Firstly, keeping the confining pressure in the two principal stress directions of the numerical core loaded with alternating load in different injection-production cycles unchanged and then unload the axial loading stress to the same size as the confining pressure in the direction of horizontal minimum principal stress. Finally, the true triaxial compression numerical simulation experiment will be carried out on the numerical core. According to the stress–strain data, the elastic deformation parameters of core in each injection-production cycle are calculated to analyze the influence of injection-production cycle and differential pressure on the elastic deformation parameters of core sample under gas-solid coupling action.
3.2.1. Influence of Injection-Production Cycle and Differential Pressure on Elastic Modulus
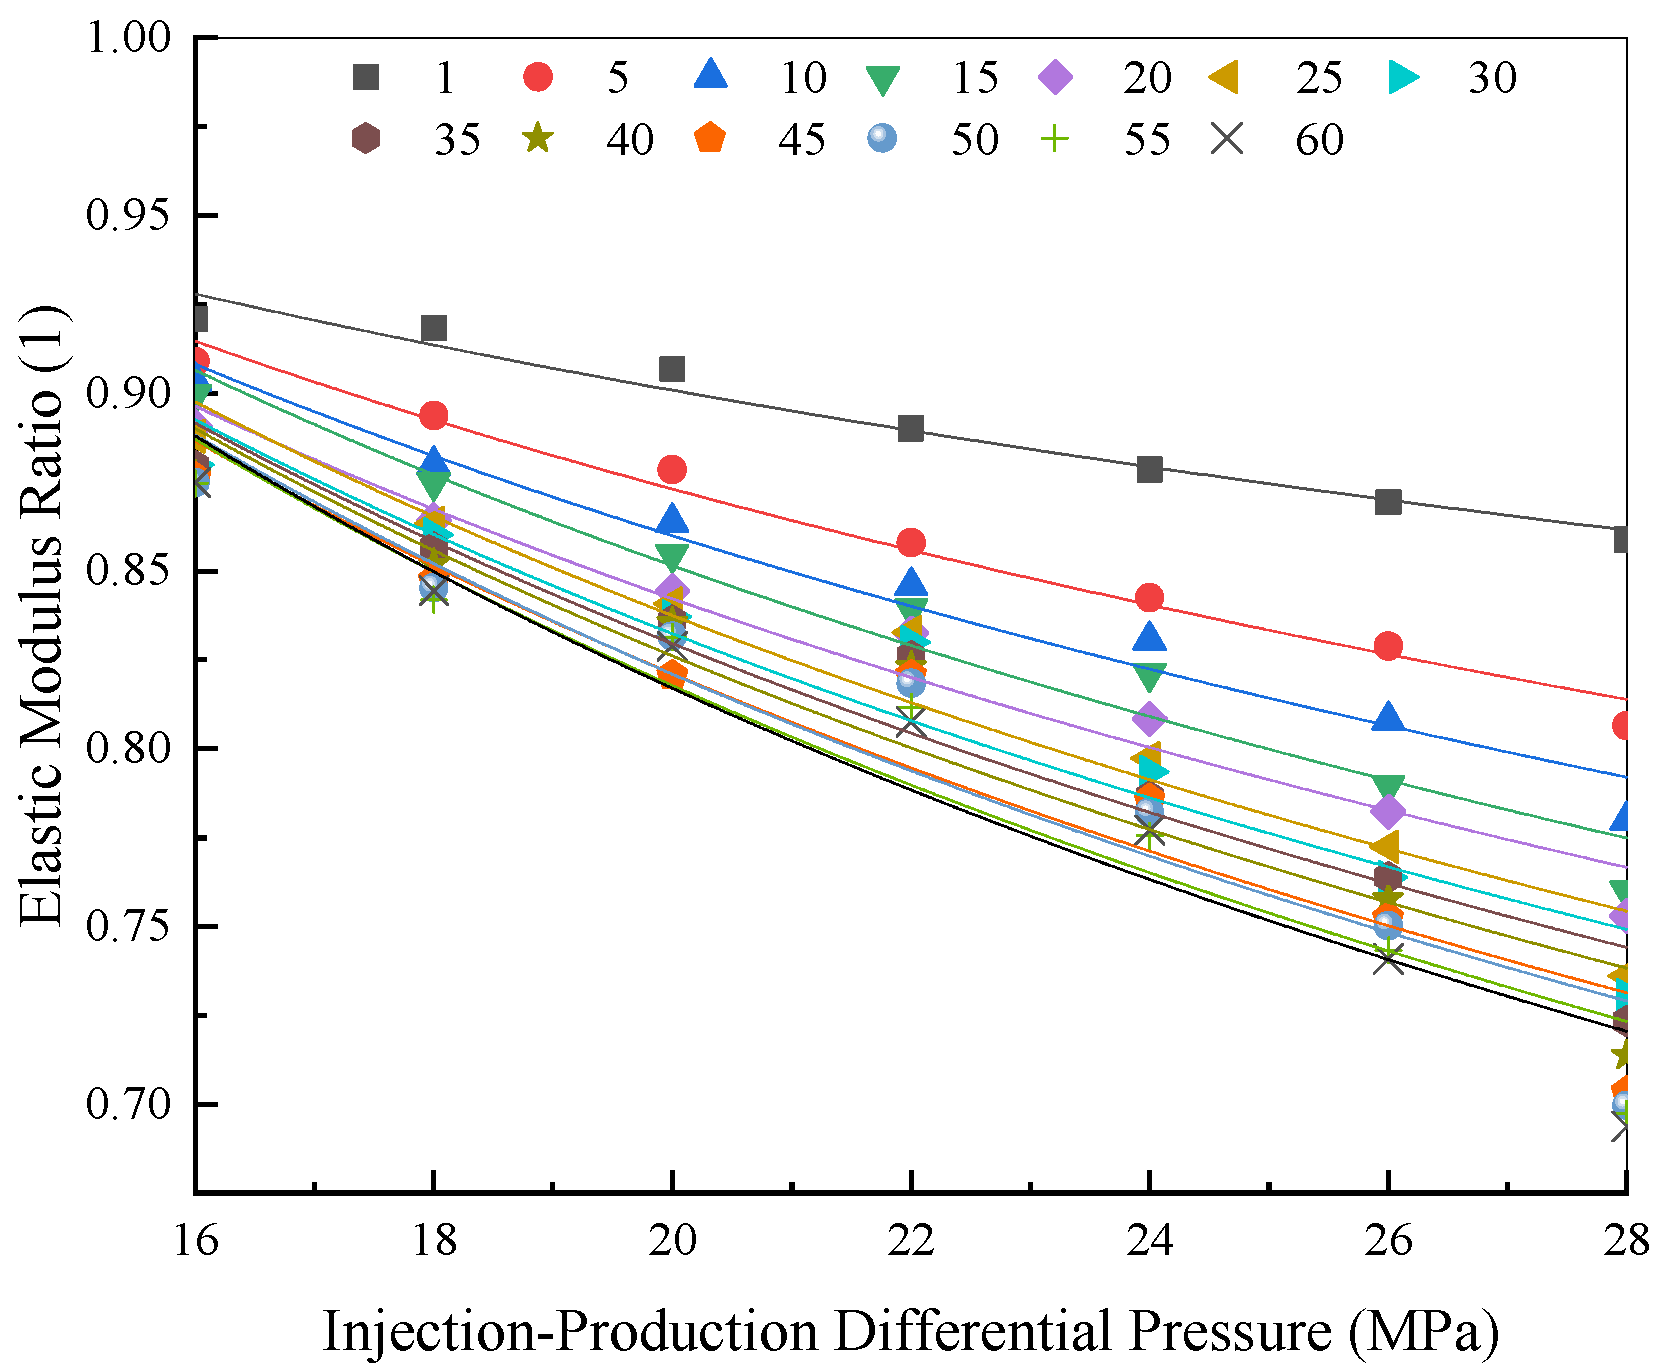
After the true triaxial compression numerical simulation experiment is carried out on the numerical cores with different injection-production cycles under alternating load, the elastic modulus under different injection-production cycles and differential pressure is calculated according to the axial stress–strain data, and then the relationship between the elastic modulus ratio and injection-production cycle and differential pressure will be finally obtained.
According to the experimental test results, as shown in
Figure 8 (dots are simulation results and curves are trend lines), the change of elastic modulus ratio of each stress amplitude is analyzed. It can be clearly seen that under each injection-production cycle, the elastic modulus ratio gradually decreases with the increase of injection-production cycle, and the decrease amplitude gradually slows down. Moreover, the higher the injection-production differential pressure, the greater the decrease of elastic modulus ratio with the increase of injection-production cycle. The reason is that after the injection-production differential pressure increases, the number of bond contact cracks and crack area in the numerical core increases under the same injection-production cycle, the overall strength of the numerical core decreases, the ability of the numerical core to resist deformation under the action of external force decreases, and the axial deformation of the numerical core is greater at the same stress level. Therefore, the elastic modulus of the numerical core decreases with the increase of injection-production differential pressure, and the greater the injection-production cycle, the greater the overall strength decrease of the numerical core. Therefore, the more the injection-production cycle, the greater the decrease of elastic modulus and there is a good power function relationship between the elastic modulus ratio and the injection-production pressure drop in this area. The power function can be used to describe the relationship between the elastic modulus ratio and the injection-production pressure drop in the change process of a single injection-production pressure drop, that is:
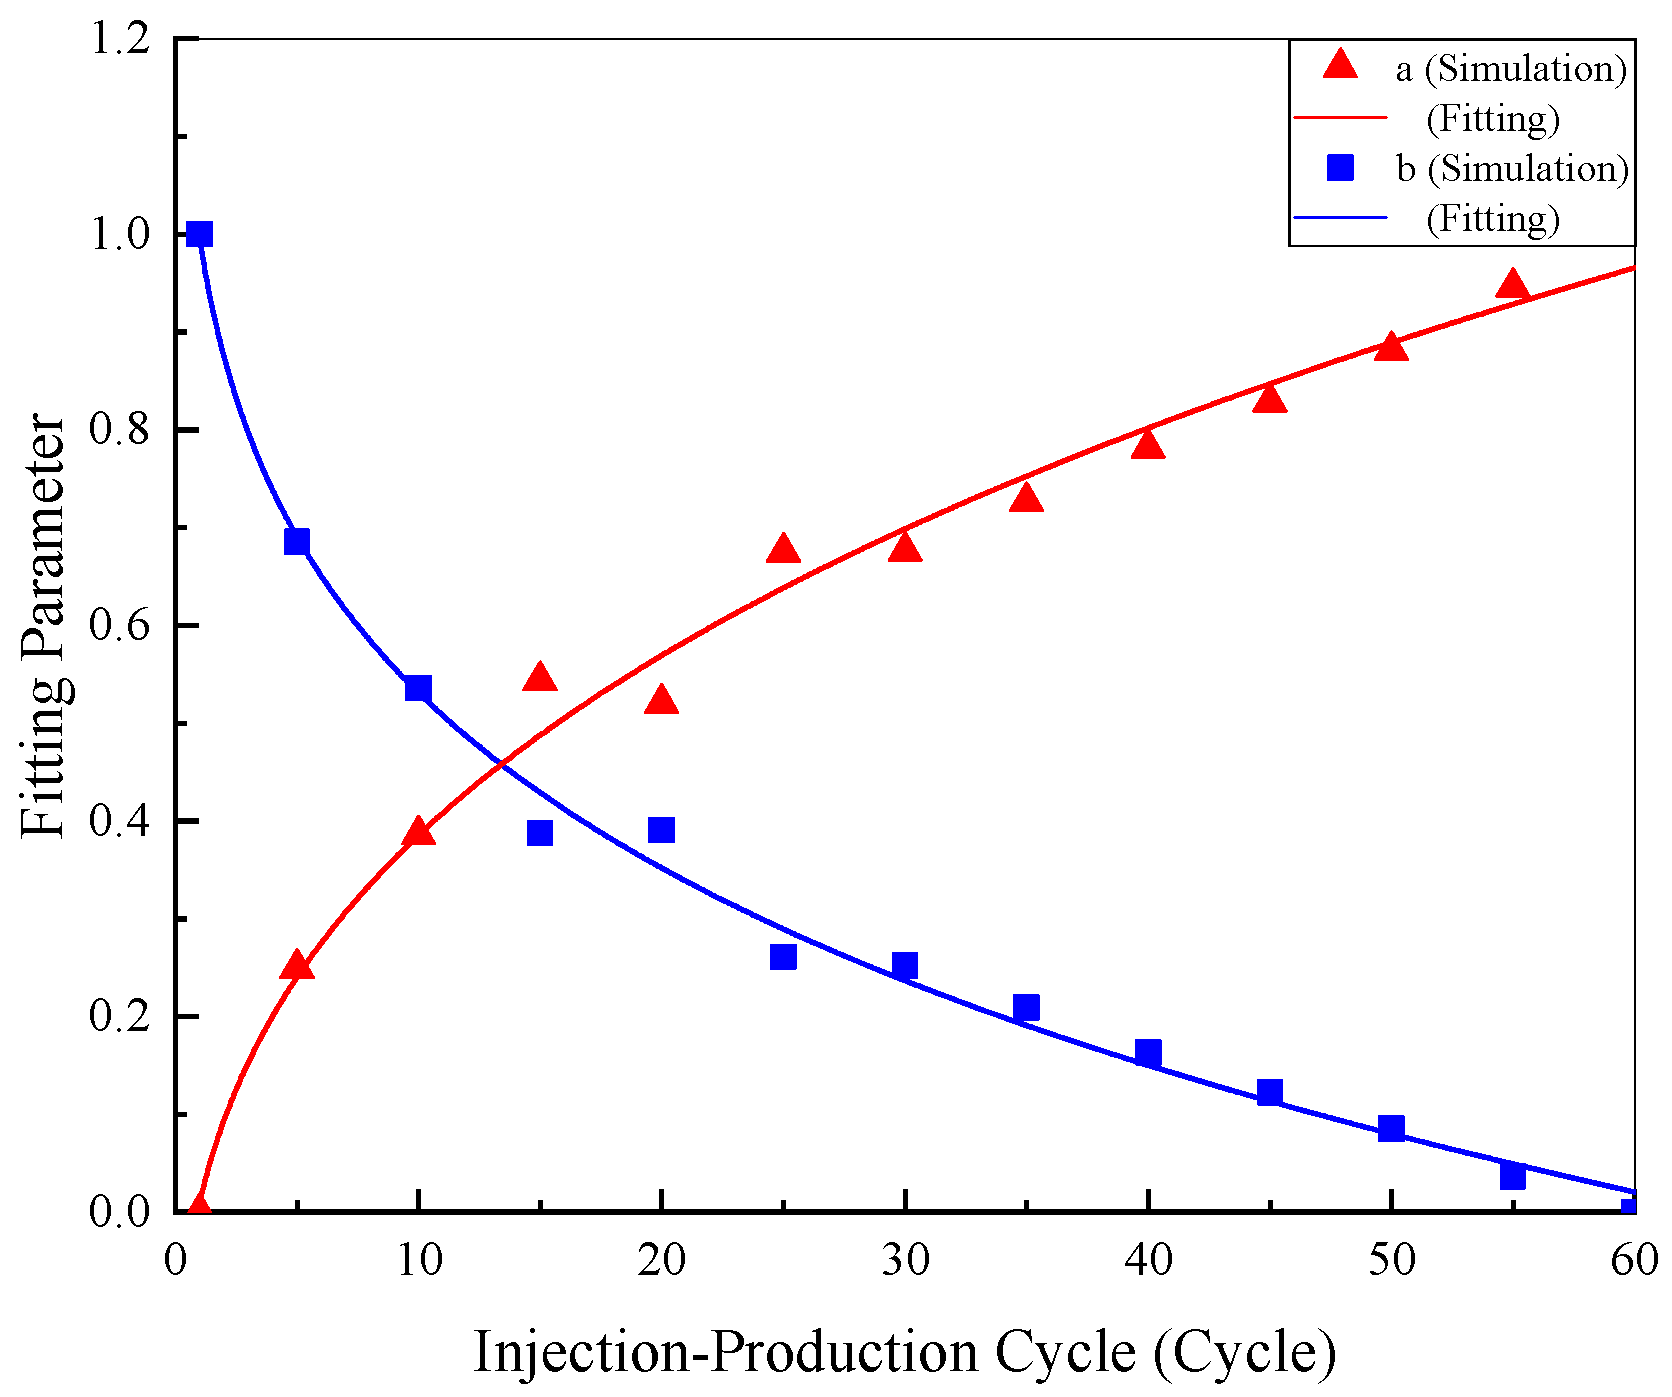
Fitting parameters a and b also have a good power function relationship with the number of injection-production cycles, so the relationship model between fitting parameters a and b and the number of injection-production cycles can be established by using power function regression analysis, respectively, as shown in
Figure 9. Then, the relationship model between the fitting parameters a and b under each injection-production cycle and the number of injection-production cycles of the gas storage is:
Substituting Equations (2) and (3) into Equation (1), the elastic modulus of rock under injection-production pressure drop in any operation cycle of gas storage due to gas-solid coupling can be calculated, namely:
where E is the elastic modulus of formation rock, MPa;
is the original elastic modulus of formation rock, MPa;
is the relative elastic modulus ratio, dimensionless;
is the injection-production pressure drop, MPa; n is the injection-production cycle, cycle; a and b are the fitting parameters.
3.2.2. Influence of Injection-Production Cycle and Differential Pressure on Poisson’s Ratio
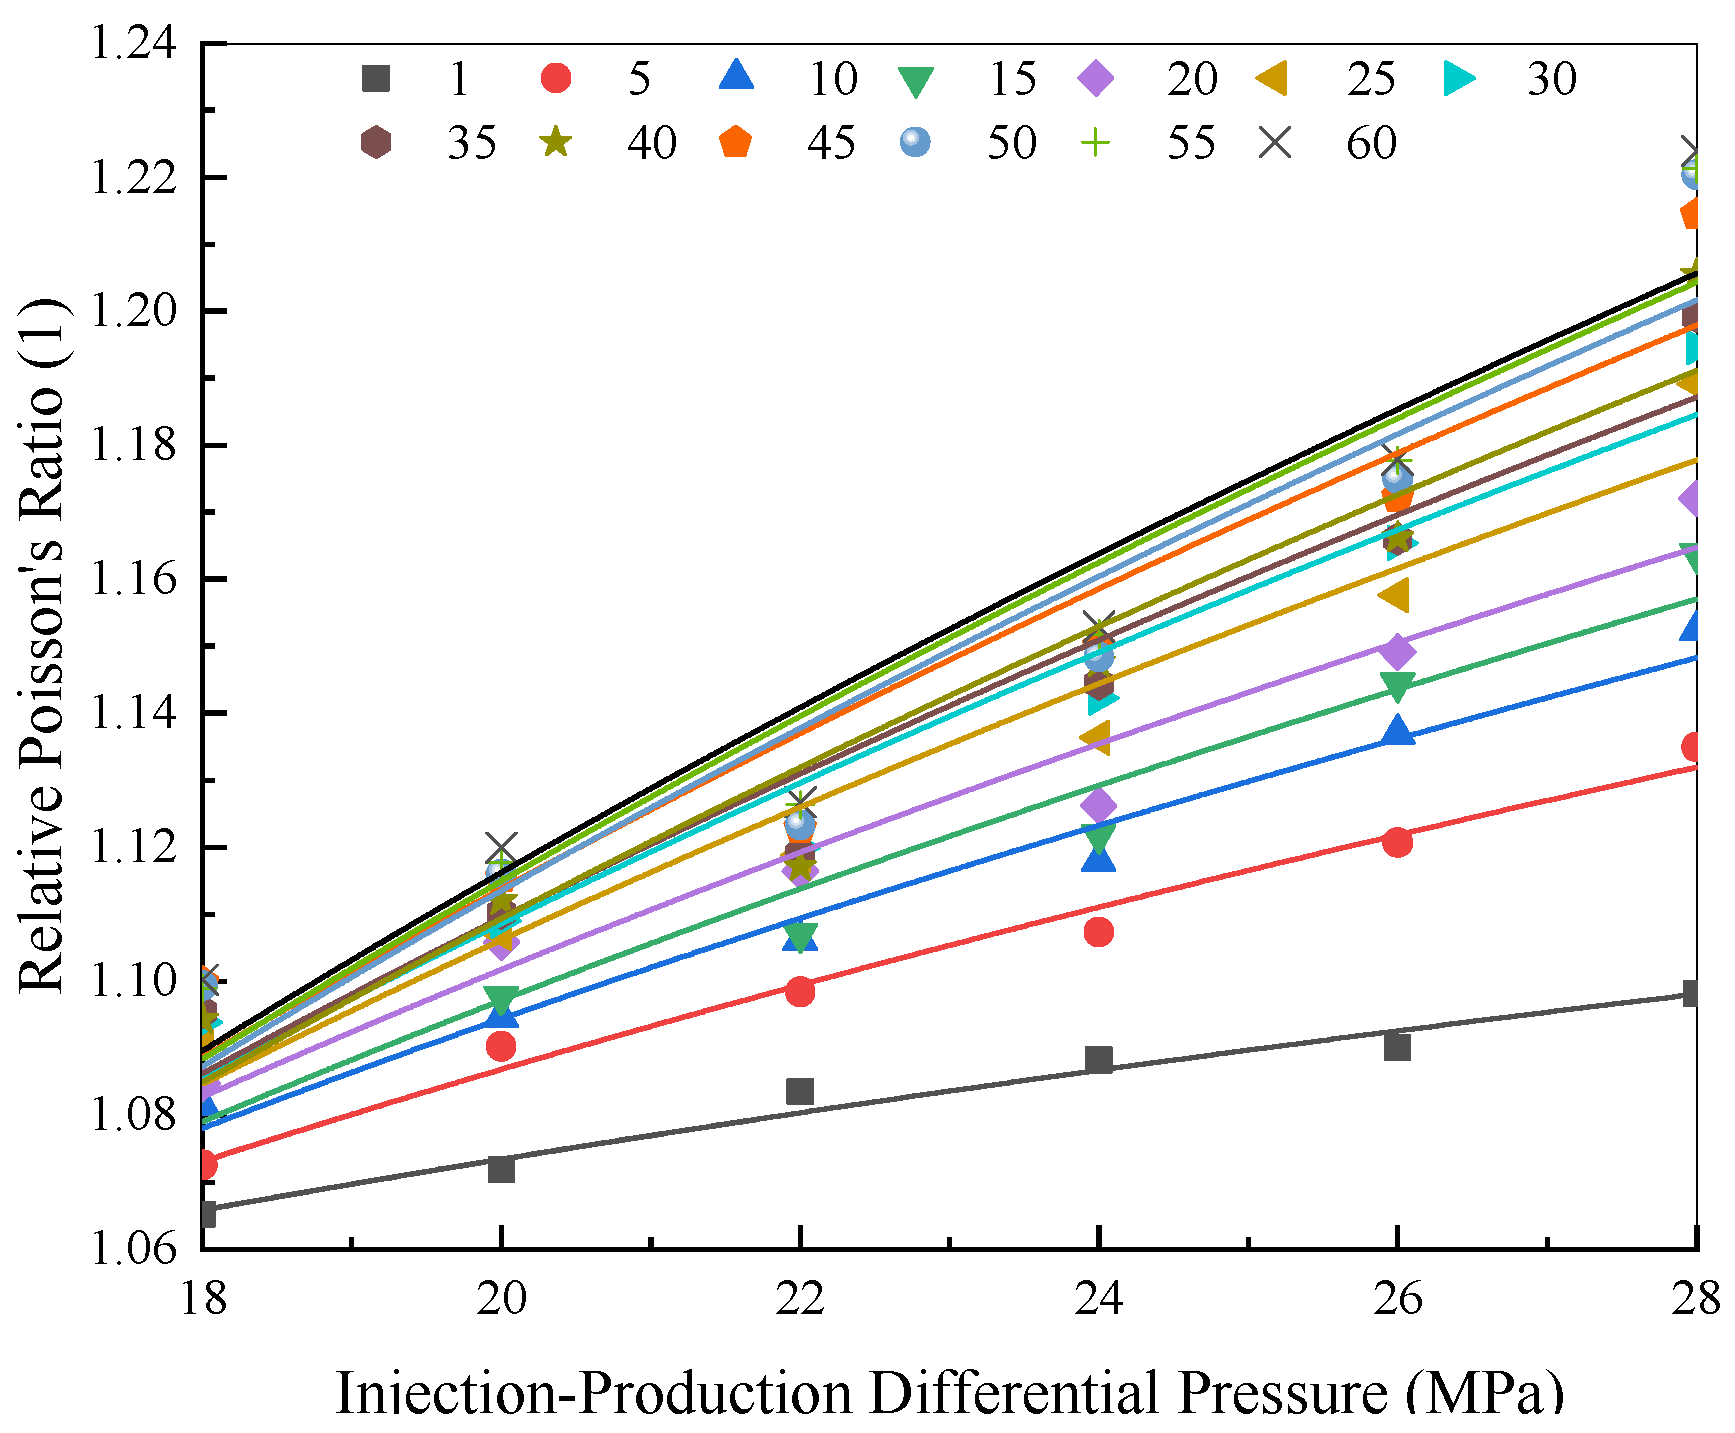
After performing true triaxial compression numerical simulation experiments on numerical cores with different injection-production cycles, the Poisson’s ratio with each injection-production cycle under gas-solid coupling is calculated according to the axial strain and transverse strain data. However, the true triaxial model has transverse strains in the two directions of horizontal minimum and maximum principal stress, so the Poisson’s ratios in the two directions can be calculated respectively. The ratio of the Poisson’s ratio in each injection-production cycle to the initial Poisson’s ratio of the numerical core is recorded as the relative Poisson’s ratio. The relationship between the relative Poisson’s ratio in the direction of horizontal minimum and maximum principal stress and the injection-production cycle, injection-production differential pressure is respectively obtained, as shown in
Figure 10 (dots are simulation results and curves are trend lines) and
Figure 11.
As shown in
Figure 10, according to the analysis of experimental test results, in the direction of horizontal minimum principal stress, the relative Poisson’s ratio under each injection-production differential pressure gradually increases with the increase of injection-production cycle, and the increasing range gradually slows down. When the injection-production cycle is the same, with the increase of injection-production differential pressure, the relative Poisson’s ratio of gradually increases, and generally the more the injection-production cycle is, the greater the increase of relative Poisson’s ratio is. On the one hand, the reason is that after the injection-production differential pressure increases, the number of bond contact cracks and crack area in the numerical core increase at the same injection -production cycle, the overall strength of the numerical core decreases, the ability of the numerical core to resist deformation under the action of external force decreases, and the transverse deformation and axial deformation of the numerical core increase due to gas-solid coupling at the same stress level. On the other hand, the unbonded contact and new cracks produced by bonded contact crack cannot bear tensile stress but compressive stress, resulting in the increase of transverse deformation of numerical core at the same stress level is greater than that of axial deformation. Therefore, with the increase of injection-production differential pressure, the Poisson’s ratio in the direction of horizontal minimum principal stress of numerical core increases, while the more injection-production cycles, the greater the overall strength decline of numerical core, and the more injection-production cycles, the greater the increase of Poisson’s ratio in the direction of horizontal minimum principal stress of numerical core. Secondly, there is a good power function relationship between the relative Poisson’s ratio in the direction of the minimum principal stress and the injection-production pressure drop in this area. The power function can be used to describe the relationship between the relative Poisson’s ratio in the direction of the minimum principal stress and the injection-production pressure drop in the change process of a single injection-production pressure drop, that is:
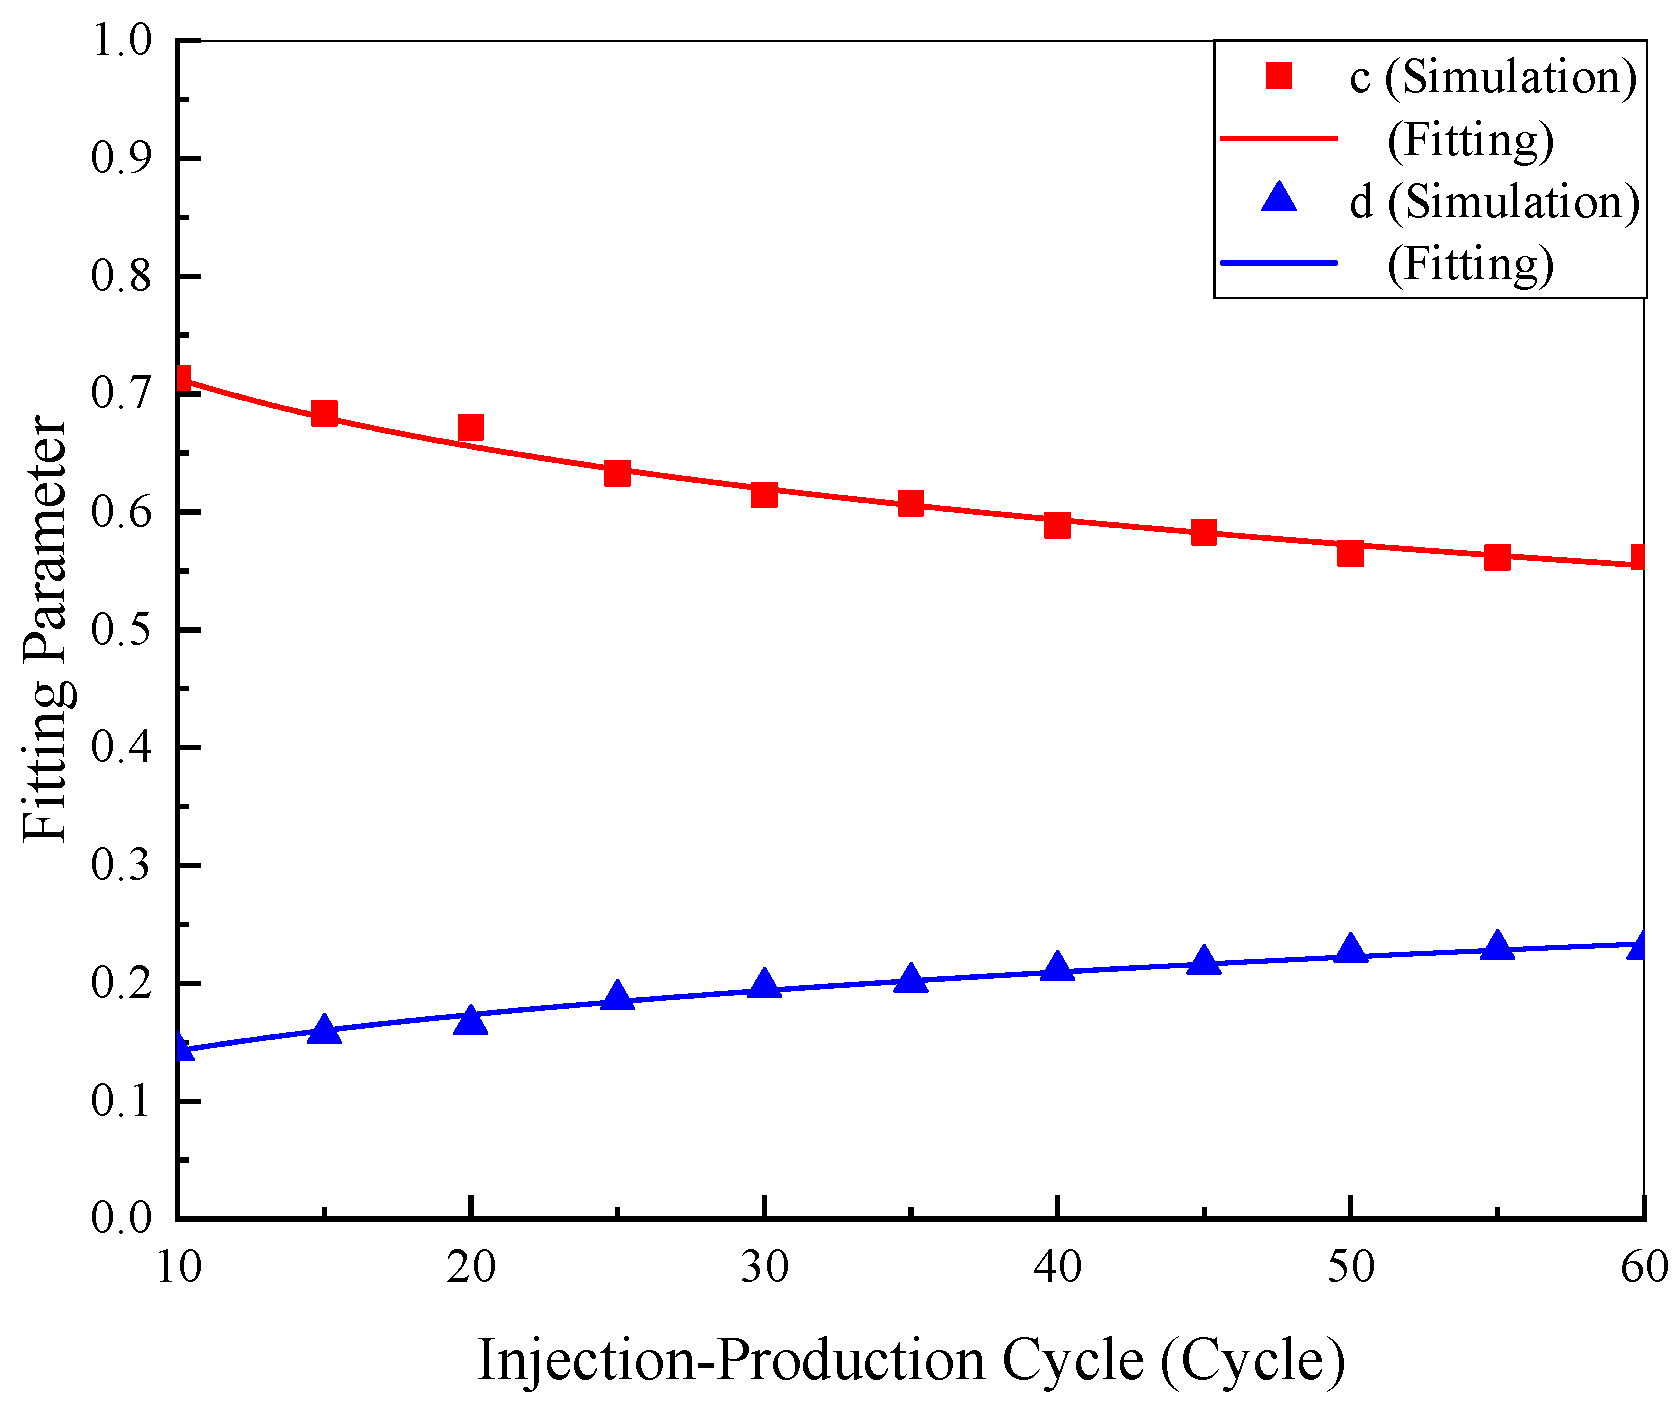
Fitting parameters c and d have a good power function relationship with the number of injection-production cycles, so the relationship model between fitting parameters c and d and the number of injection-production cycles can be established by using power function regression analysis, respectively, as shown in
Figure 11. Then, the relationship model between the fitting parameters c and d under each injection-production cycle and the number of injection-production cycles of the gas storage is:
Substituting Equations (6) and (7) into Equation (5), Poisson’s ratio in the direction of minimum principal stress of rock under injection-production pressure drop in any operation cycle of gas storage due to gas-solid coupling can be calculated, namely:
where
is Poisson’s ratio of horizontal minimum principal stress direction of the formation rock, dimensionless;
is the original Poisson’s ratio of formation rock, dimensionless;
is the relative Poisson’s ratio in the direction of horizontal minimum principal stress, dimensionless;
is the injection-production pressure drop, MPa; n is the injection-production cycle, cycle; c and d are the fitting parameters.
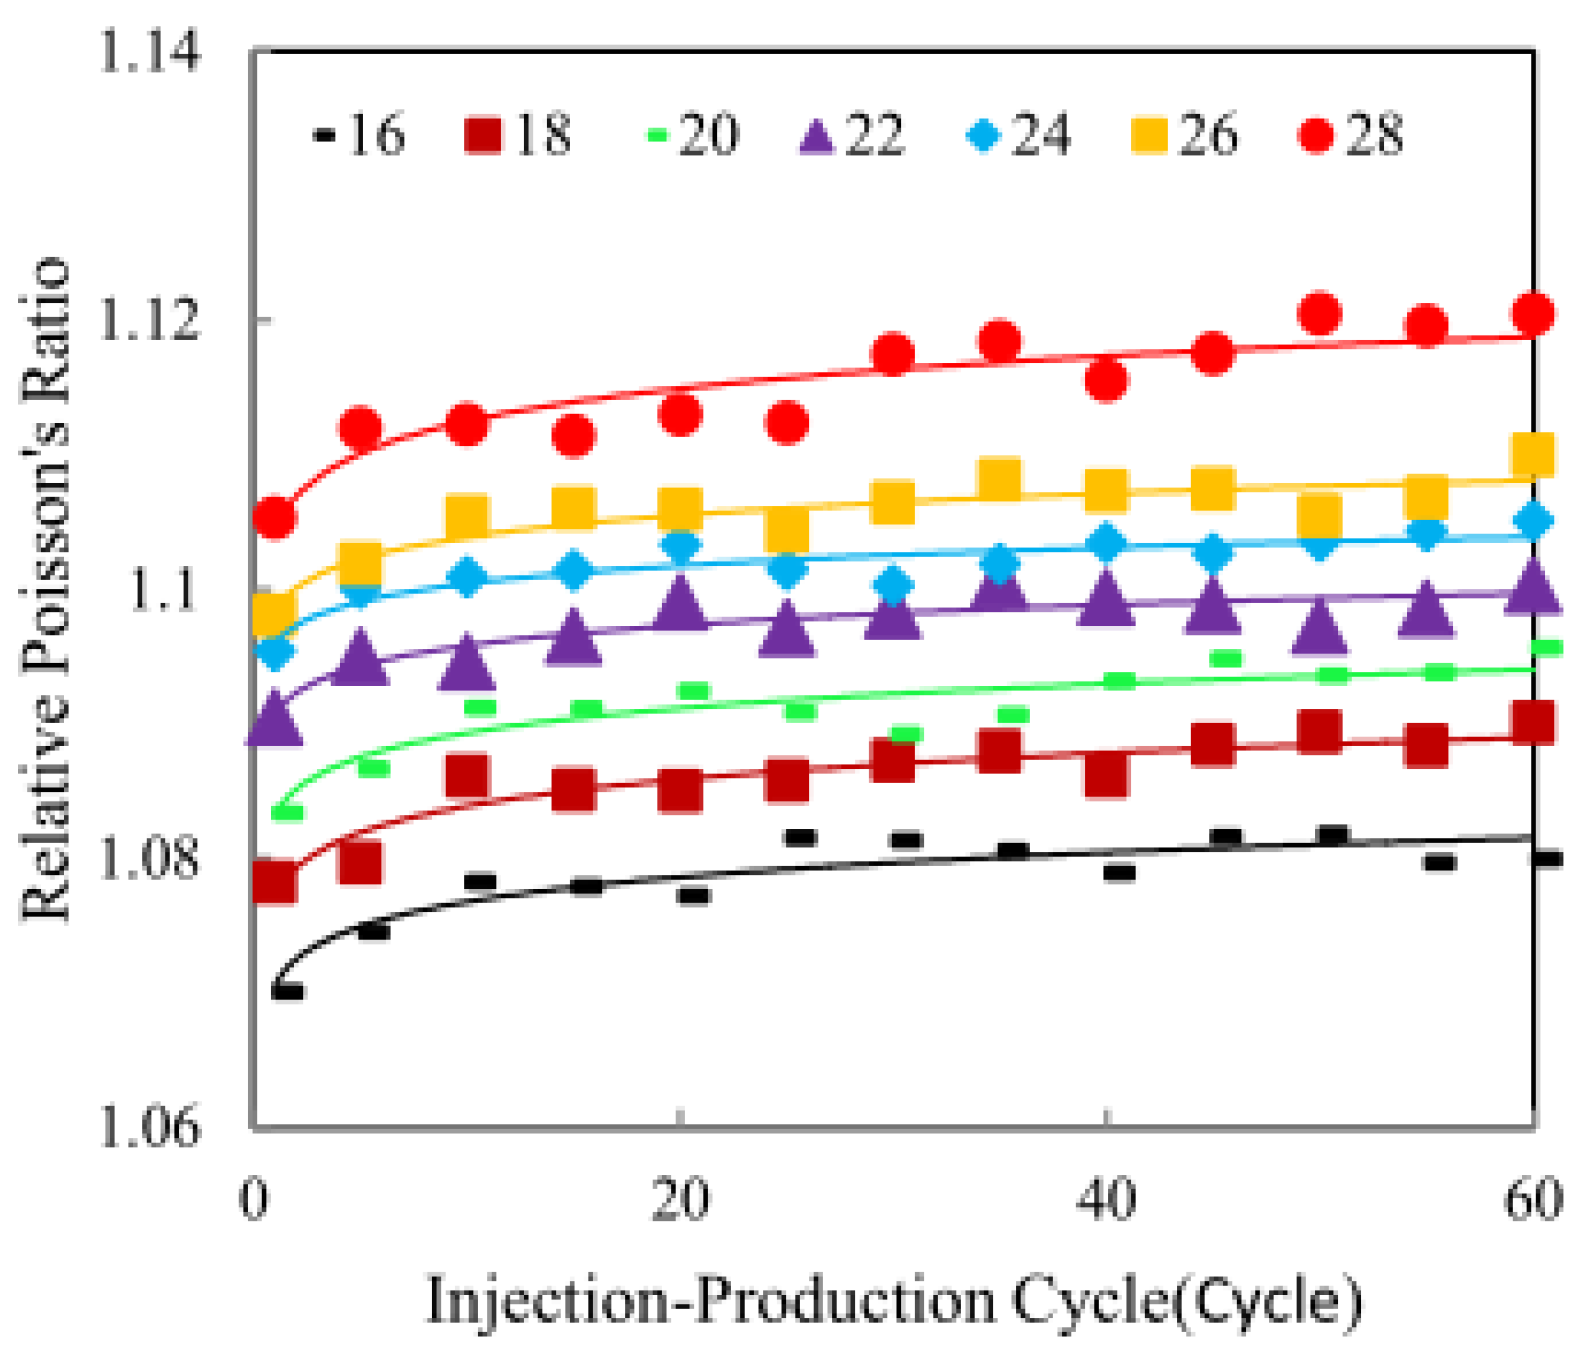
As shown in
Figure 12 (dots are simulation results and curves are trend lines), according to the experimental test results, in the direction of horizontal maximum principal stress, the relative Poisson’s ratio under each injection-production differential pressure gradually increases with the increase of injection-production cycle, and the increase amplitude gradually slows down. Moreover, the higher the injection-production differential pressure, the greater the increase of relative Poisson’s ratio with the increase of injection-production cycle. In addition, under the condition of the same injection-production cycle, the relative Poisson’s ratio gradually increases with the increase of injection-production differential pressure, and the increase difference of relative Poisson’s ratio in each injection-production cycle with the increase of injection-production differential pressure is not obvious. On the one hand, with the increase of injection-production differential pressure, the increase mechanism of Poisson’s ratio in the two horizontal principal stress directions is the same, and the difference of confining pressure leads to the increase of Poisson’s ratio in the direction of maximum principal stress is less than that in the direction of minimum principal stress. On the other hand, with the increase of injection-production differential pressure, the increase mechanism of Poisson’s ratio in the two horizontal principal stress directions is the same. The difference of confining pressure leading to the increase of Poisson’s ratio in the direction of maximum principal stress is less than that in the direction of minimum principal stress. Then, the relative Poisson’s ratio of the maximum principal stress direction in this area has a good logarithmic function relationship with the injection-production cycle. The logarithmic function can be used to describe the relationship between the relative Poisson’s ratio of the maximum principal stress direction and the injection-production cycle in the change process of a single injection-production cycle, that is:
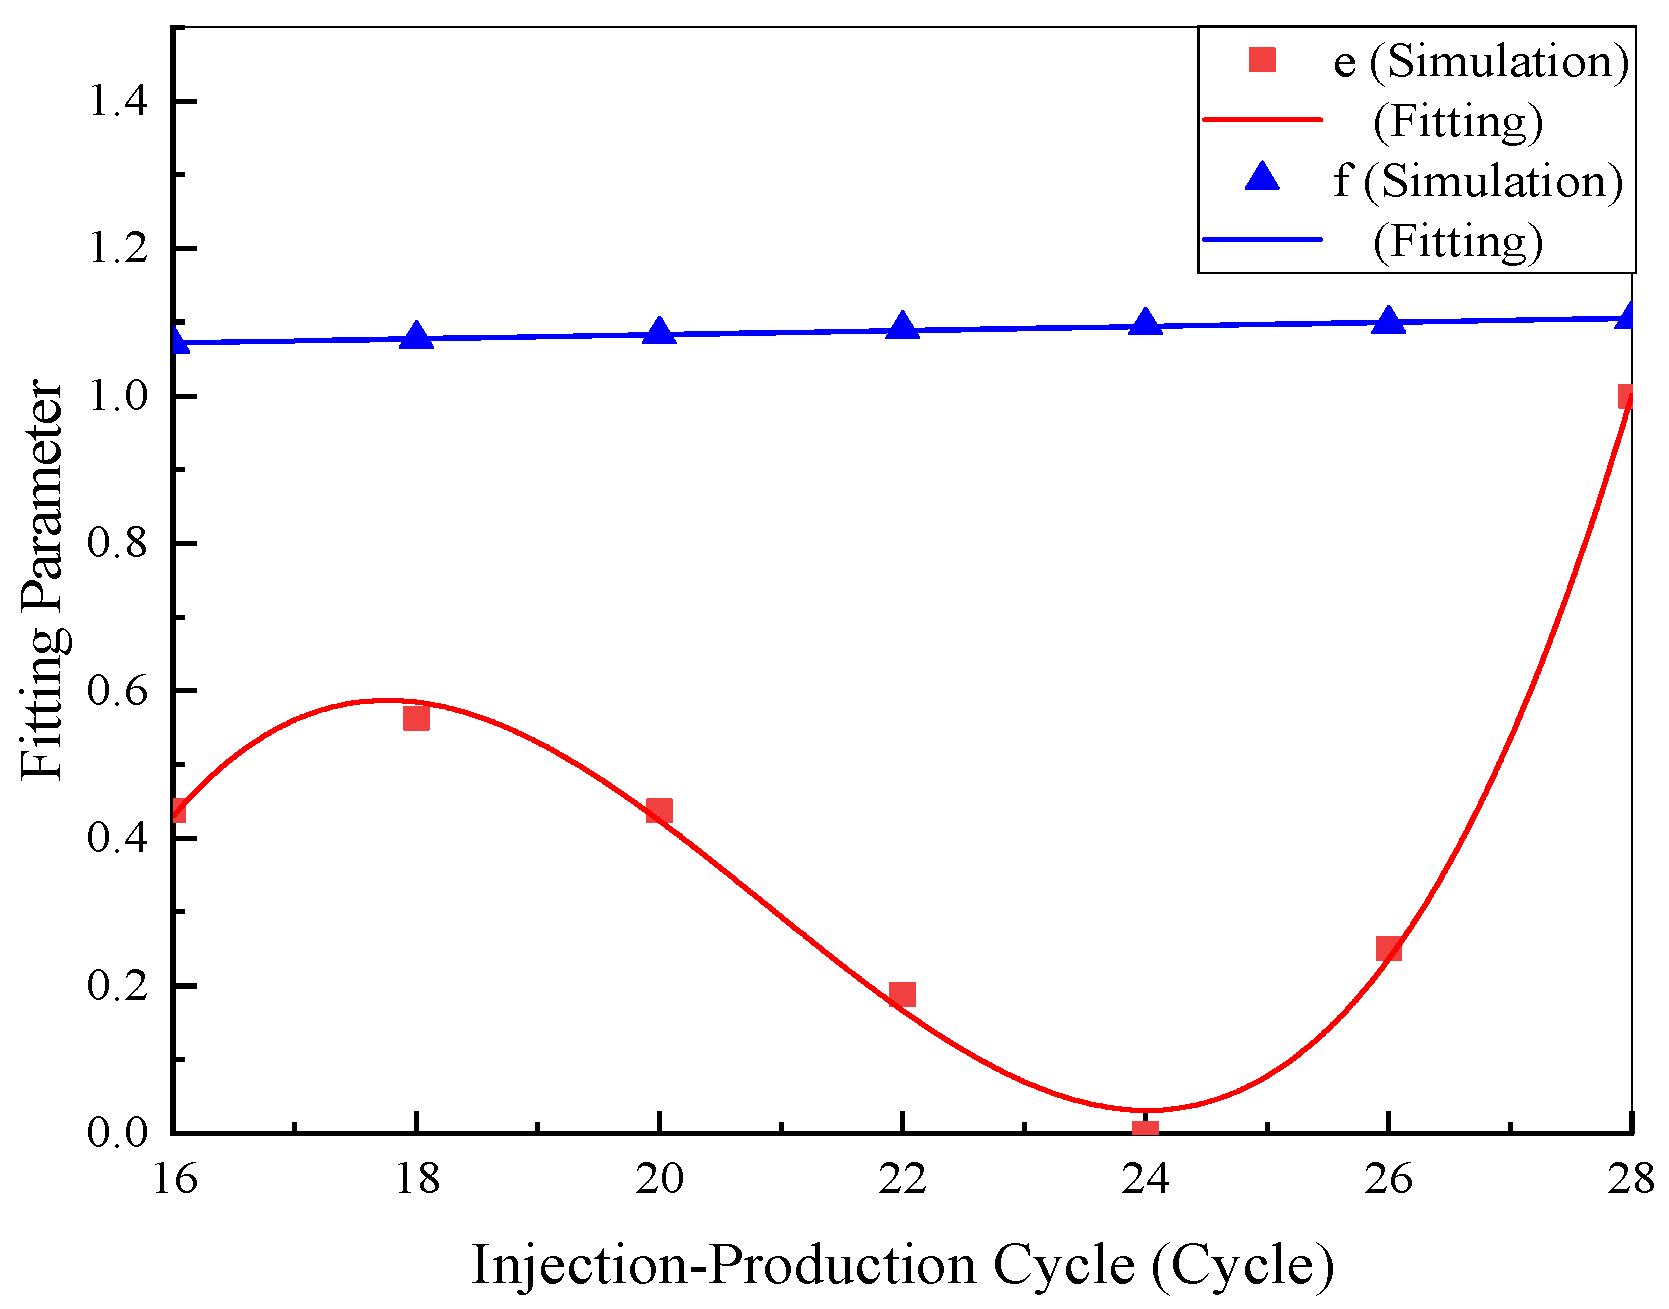
Firstly, regression analysis is used for fitting parameters e and f respectively, and the relationship model between fitting parameters e and e and injection-production cycle number is established, as shown in
Figure 13. Then, the relationship model between the fitting parameters e and f under each injection-production pressure drop and the injection-production pressure drop of the gas storage is:
Substituting Equations (10) and (11) into Equation (9), the relative Poisson’s ratio in the direction of the maximum principal stress of rock under injection-production pressure drop in any operation cycle of gas storage due to gas-solid coupling can be calculated, namely:
where
is the Poisson’s ratio in the direction of the maximum principal stress of the formation rock, dimensionless;
is the Poisson’s ratio of the original maximum principal stress direction of the formation rock;
is the relative Poisson’s ratio in the direction of maximum principal stress, dimensionless;
is the injection-production pressure drop, MPa; n is the injection-production cycle, cycle; e, f is the fitting parameter.
3.2.3. Influence of Injection-Production Cycle and Differential Pressure on Cohesion Ratio
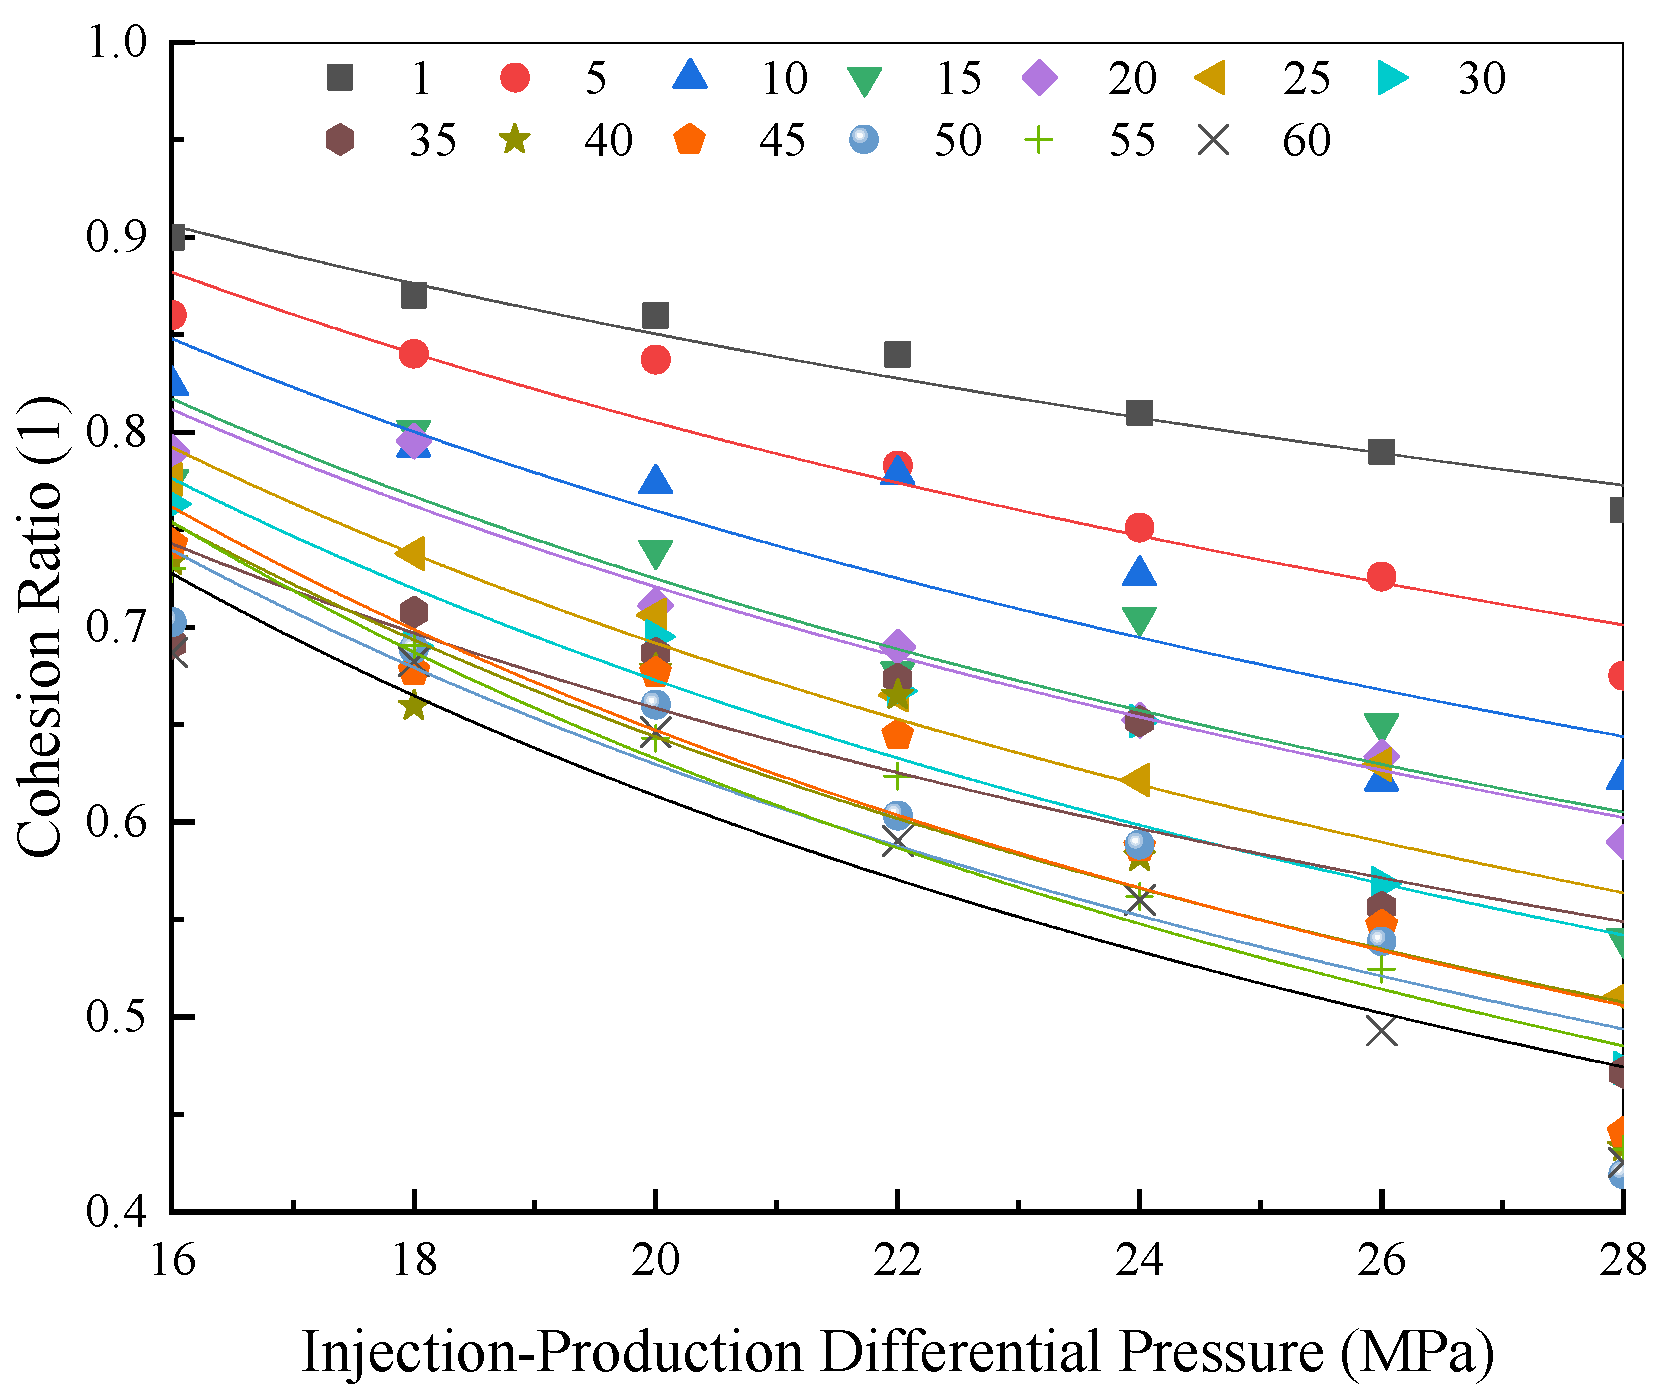
After three groups of true triaxial compression numerical simulation experiments with different confining pressures under gas-solid coupling are carried out on numerical cores with different injection-production cycles. Then, the Mohr strength envelope of numerical cores is obtained according to the compression failure strength data of three groups of numerical cores under different confining pressures. Finally, the cohesion is obtained from the longitudinal intercept of the Mohr strength envelope. Among them, the cohesion in each injection-production cycle is dimensionless into cohesion ratio, and lastly the relationship between cohesion ratio and injection-production cycle and injection-production differential pressure is shown in
Figure 14 (dots are simulation results and curves are trend lines).
A as shown in
Figure 14, according to the analysis of the experimental test results, under each injection-production differential pressure, the cohesion ratio gradually decreases with the increase of injection-production cycle, and the reduction range gradually slows down. Moreover, the higher the injection-production differential pressure, the greater the decrease of cohesion ratio with the increase of injection-production cycle. Under the condition of the same injection-production cycle, with the increase of injection-production differential pressure, the cohesion ratio decreases gradually, and the more injection-production cycles, the greater the decline of cohesion ratio. On the one hand, the reason is that with the injection-production differential pressure increases and the effect of gas-solid coupling, the number of bond contact cracks and crack area in the numerical core increases under the same injection-production cycle, the overall strength of the numerical core decreases. The unbonded contact and new cracks generated by the bond contact crack in the numerical core cannot bear the tensile stress, resulting in the loosening of local particle system. Therefore, the injection-production differential pressure increases and the cohesion decreases. On the other hand, the more the injection-production cycle is, the greater the overall strength decline of the numerical core is. Therefore, the more injection-production cycles, the greater the decline of cohesion. Additionally, there is a good power function relationship between the cohesion ratio and the injection-production pressure drop in this area. The power function can be used to describe the relationship between the cohesion ratio and the injection-production pressure drop in the change process of a single injection-production pressure drop, namely:
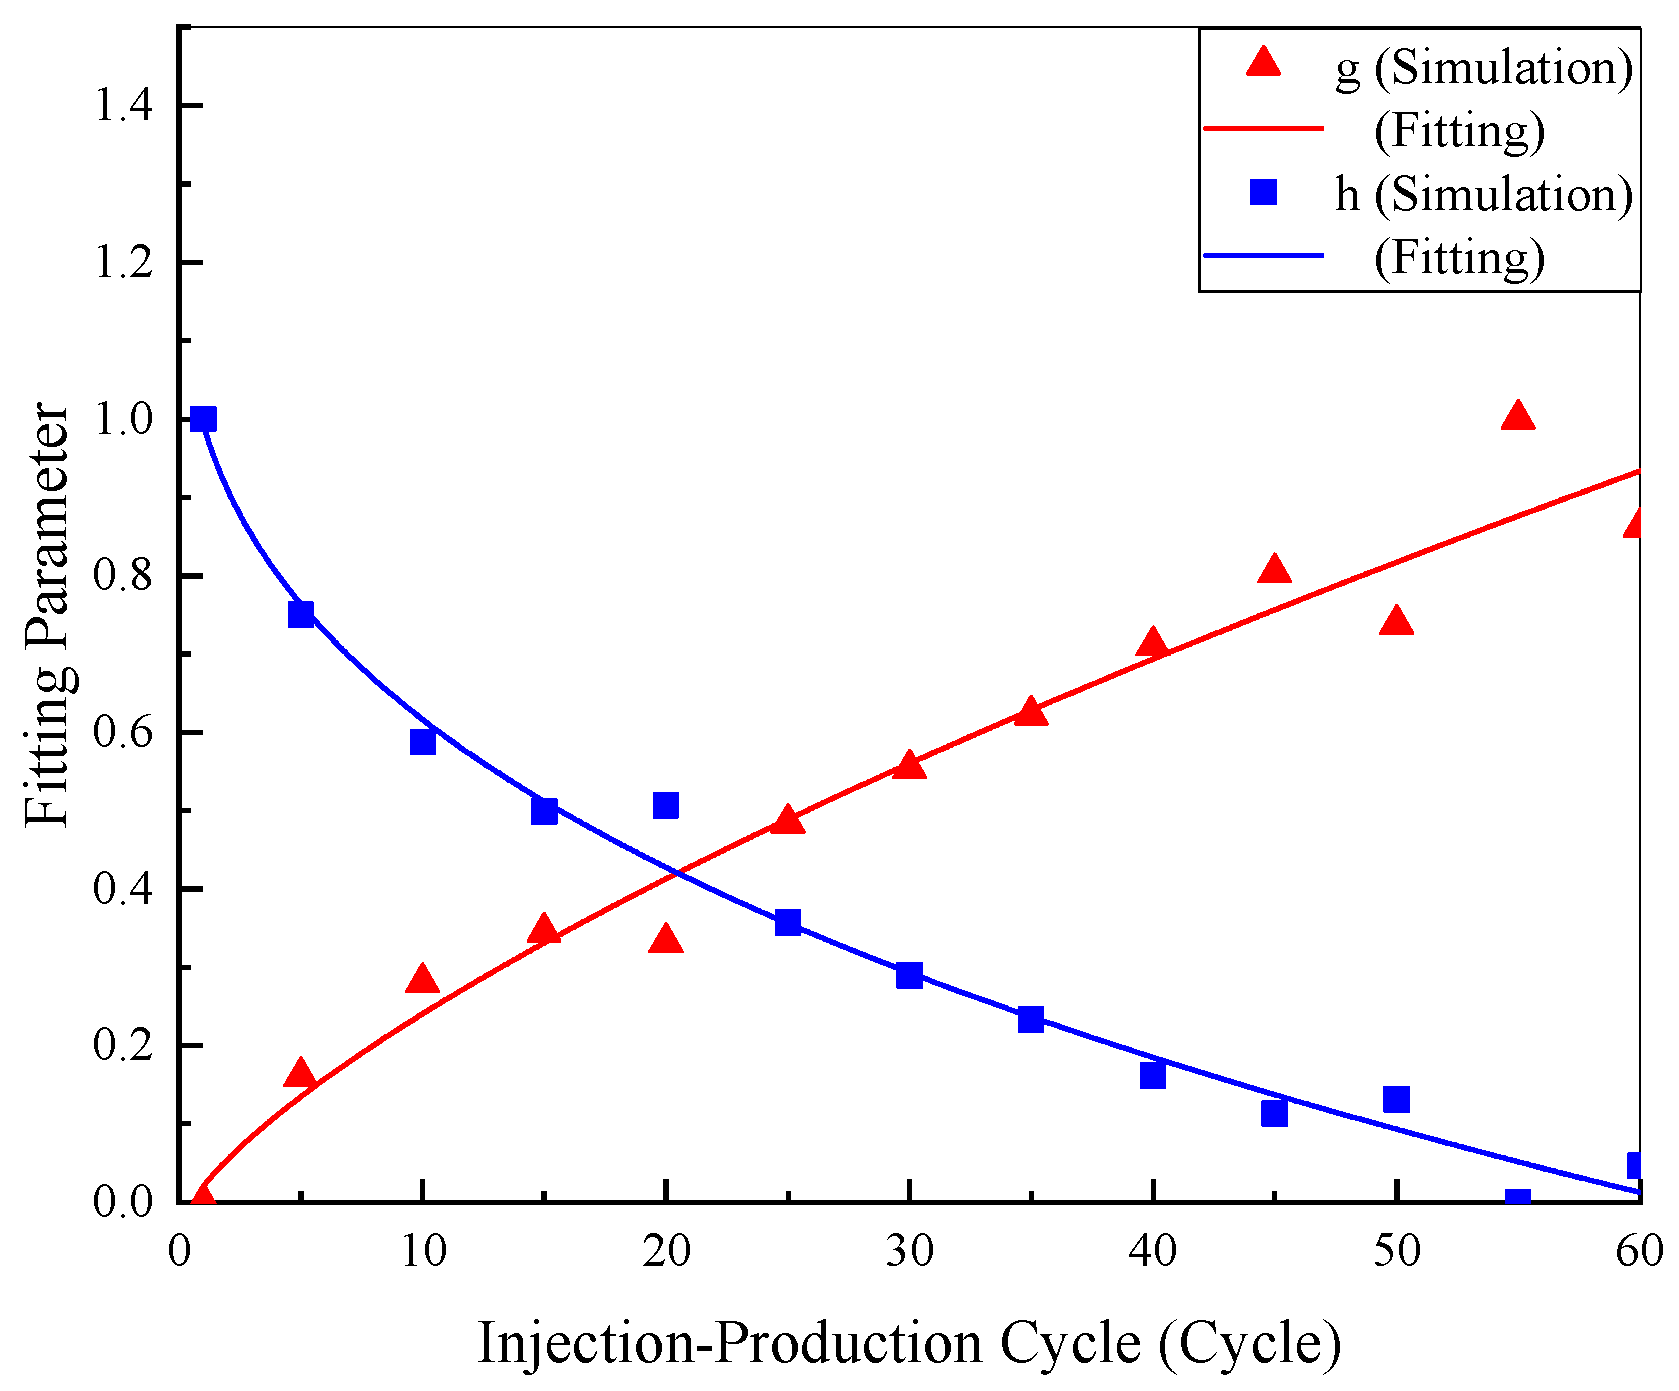
Fitting parameters g and h have a good power function relationship with the number of injection-production cycles, so the relationship model between fitting parameters g, h and the number of injection-production cycles can be established by using power function regression analysis, respectively, as shown in
Figure 15. Then, the relationship model between the fitting parameters g and h under each injection-production cycle and the number of injection-production cycles of the gas storage is:
Substituting Equations (14) and (15) into Equation (13), the cohesion of rock under injection-production pressure drop in any operation cycle of gas storage due to gas-solid coupling can be calculated, namely:
where
is the cohesion of formation rock, MPa;
is the original cohesion of formation rock, MPa;
is the cohesion ratio, dimensionless;
is the injection-production pressure drop, MPa; n is the injection-production cycle, cycle; g and h are the fitting parameters.
3.2.4. Influence of Injection-Production Cycle and Differential Pressure on Internal Friction Angle
After three groups of true triaxial compression numerical simulation experiments with different confining pressures are carried out for numerical cores loaded with alternating load in different cycles. Firstly, the Mohr strength envelope of numerical cores is obtained according to the compression failure strength data of numerical cores under three groups of confining pressures. Then, the internal friction angle will be obtained from the angle between Mohr strength envelope and transverse axis. Among them, the internal friction angle of numerical cores in each injection-production cycle is dimensionless into the internal friction angle ratio. Finally, the relationship between the internal friction angle ratio and injection-production cycle and differential pressure can be obtained, as shown in
Figure 16 (dots are simulation results and curves are trend lines).
Fitting the internal friction angle ratio in
Figure 16 with the numerical simulation data of injection-production cycle, the following relationship is obtained:
Fitting the internal friction angle ratio under each stress amplitude in
Figure 16 with the data of injection-production cycle to obtain the fitting parameters
and
The variation with the increase of injection-production cycle is shown in
Figure 17. It can be seen that the fitting parameters in formula (18) and formula (19) increase with the increase of injection-production cycle
decrease and then increase,
gradually increase and then decrease, namely:
Substituting Equations (18) and (19) into Equation (17), the internal friction angle of rock under injection-production pressure drop in any operation cycle of gas storage due to gas-solid coupling can be calculated, namely:
where
is the internal friction angle of formation rock, (°);
is the original internal friction angle of formation rock, (°);
is the internal friction angle ratio, dimensionless;
is the injection-production pressure drop, MPa; n is the loading cycle of alternating load, cycle;
and
are fitting parameters.


