Article

The Efficiency of Green Technology Innovation and Its Influencing Factors in Wastewater Treatment Companies

1
International School of Law and Finance, East China University of Political Science and Law, Shanghai 200042, China
2
Legal Research Center of Optimizing Doing Business Environment, East China University of Political Science and Law, Shanghai 200042, China
3
Energy Law and Policy Institute, East China University of Political Science and Law, Shanghai 200042, China
4
The Circular Economy Research Center, Tongji University, Shanghai 200092, China
*
Author to whom correspondence should be addressed.
Separations 2022, 9(10), 263; https://doi.org/10.3390/separations9100263
Submission received: 26 July 2022 / Revised: 23 August 2022 / Accepted: 15 September 2022 / Published: 21 September 2022

Abstract

:
To achieve the harmonious development of economic growth and the environment, nations must pay more attention to wastewater treatment and boost efficiency using green technology. This study applies the Malmquist-DEA model to assess the efficiency of green technology innovation in 19 Chinese wastewater treatment companies between 2017 and 2020. In addition, focus is placed on the core wastewater treatment technology of the companies with excellent performance, indicating how wastewater treatment companies may improve their green technology. The results of the study indicate that, first, the overall effectiveness of green technology innovation in companies follows a rising and then decreasing trend. In 2020, wastewater treatment companies’ green technology innovation efficiency was around 17.4 percent lower than in 2017. Improving technical progress is the key to boosting the total factor productivity of wastewater treatment companies. Second, based on the Tobit regression, the shareholding ratio of companies has a positive influence on the technical efficiency of companies. Therefore, China should increase innovation capacity and productivity, adopt current sewage treatment technology from overseas, and thus gradually achieve clean sewage utilization and ecological environment management.

1. Introduction

Since the industrial revolution, carbon emissions have increased in recent countries even after the Paris Agreement targets were set. According to the most recent “World Energy Statistics 2022”, global carbon emission estimates show a decreased trend in 2020 due to the emergence of COVID-19, but an increase in all other years. While searching for new energy sources, it is crucial to supplement the application of green treatment technologies with traditional energy production techniques. Countries around the world have explored wastewater treatment and reclamation applications as an efficient approach to challenges because of water pollution and the water crisis [1].
As a response to the energy problem and global warming, the Chinese government suggested the concepts of “Carbon Neutrality” and “Carbon Peaking” in 2021, establishing emissions objectives for the next four decades. In order to react to this strategy, key industries have expanded their investments in R&D to develop new green technologies that minimize carbon emissions [2]. Green technology refers to scientific and technological innovations that conserve the world’s natural resources or lessen humankind’s negative environmental impact [3]. Braun and Wield were the first to propose the notion of green technology. They felt that green technology should comprise pollution control, ecological treatment, pollution cleaning, pollution recycling, pollution monitoring, and other pollution evaluation approaches [4]. There are corresponding rewards for organizations that conduct research and development on green technologies, including company reputation, financial performance, and the success of new products [5]. Sustainable denitrification technologies, denitrification and phosphorus removal methods, and recovery of organic energy technologies have evolved to some degree in the field of wastewater treatment, with listed firms serving as the primary research echelon [6]. Take the Beijing Originwater Technology Company (hereinafter called BOTC) as an example; the company independently developed a vibrating membrane bioreactor that reduces operating energy consumption by 70 percent compared to the traditional MBR, thereby effectively controlling membrane pollution and overcoming the barrier to the development of traditional technology. At the same time, some businesses are investing significantly in R&D but failing to generate the required technical results, resulting in deteriorating financial conditions and even the possibility of delisting [7]. Consequently, based on the objective of emission reduction, this paper examines the efficiency of green technical innovation of wastewater treatment companies and its affecting factors using a sample of listed companies involved in the wastewater treatment business in China.
The contribution of this paper relative to earlier research resides in the novelty of the research object. First, regarding the industry of the research object, the majority of traditional research on the innovation efficiency of companies focuses on listed companies as a whole and less on a specific industry. In the remaining research that distinguishes specific industries, the main focus is on high-tech start-up companies, supplemented by other manufacturing industries. Second, traditional research is overwhelmingly limited to the treatment efficiency of large domestic wastewater treatment plants, and there is an absence of enterprise in the organizational structure of wastewater treatment companies. Lastly, for the breadth of the research object, in addition to the primary measurement of the innovative efficiency of green technology in wastewater treatment companies and its influencing factors, the core treatment technologies and processes of a few key companies are also introduced in detail, serving as a point of reference for other companies in the same industry.

2. Literature Review

2.1. Productivity of Wastewater Treatment Plants

In recent years, wastewater treatment has accounted for around 3% of worldwide power consumption and between 1% and 2% of global greenhouse gas emissions, which is a typical example of high energy consumption and high-emission industry [8]. Shen analyzed the building and operating expenses of wastewater treatment plants in some provinces using game theory. He concluded that, in most regions of China, wastewater treatment fees do not cover all operating costs, and government subsidies are the primary source of income for wastewater treatment plants [9]. Neczaj contends, based on the existing state of wastewater treatment, that there are still industry barriers in the wastewater treatment industry, that the capital needs of businesses are not being satisfied, and that the market mechanism must be improved [10]. Dong used the DEA model to analyze the efficiency of urban wastewater treatment and concluded that environmental factors such as economic, social, and scale have a major impact on the investment efficiency of urban wastewater treatment and that China’s wastewater treatment rate is lower than its wastewater treatment investment efficiency [11]. Giulia discovered that the ownership structure, size, and geographic location of wastewater treatment companies have varying degrees of impact on their operational circumstances [12].
Vicent discovered that wastewater treatment companies have the highest service efficiency when the daily wastewater treatment volume reaches a moderate scale. Therefore, it is recommended that wastewater treatment companies adhere to the principle of moderation when expanding their scale and that the government should also participate actively in macro regulation [13]. In addition, Francesc’s study of the cost efficiency of wastewater treatment companies revealed that the number and cost of input components have the greatest impact on the cost efficiency of wastewater treatment companies [14]. Zhen also utilized the SBM model to examine the operational efficiency of urban wastewater treatment plants in China, and the results revealed that China’s wastewater treatment industry is still in the process of developing incremental scale benefits [15]. As in previous research, Guerrini discovered that increased operating size and higher capacity utilization can boost the cost-effectiveness of wastewater treatment companies [16]. Arunava observed that private wastewater treatment companies are relatively more efficient while operating on a small scale, while public water utilities are relatively more efficient when operating on a large scale [17].

2.2. Membrane Bioreactor (MBR) Technology

Artificial wetlands, anaerobic digestion technology, biofilters, and membrane bioreactors are the primary technologies in the field of wastewater treatment today. Among them, artificial wetland is easy to run and manage, and the investment cost is low. However, its use is readily limited by regional climatic features, especially in cold regions, and it occupies a big area, while its total nitrogen (TN) removal effectiveness is also low [18]. The method of anaerobic digestion offers the benefits of easy operation and high resource utilization, but its effluent index is relatively low [19]. Biofilter is an advancement of the classic biofilter, which has the benefits of a small footprint, high shock load tolerance, and cheap operating costs, but is susceptible to filter clogging over time, etc. [20]. The primary distinction between membrane bioreactor (MBR) technology and conventional activated sludge treatment is that membrane modules replace the solid–liquid separation process and associated structures, thereby increasing the solid–liquid separation efficiency while conserving space [21]. In terms of the biodegradation of organic pollutants, MBR is more conducive to the removal of organic matter than conventional activated sludge treatment systems and has a greater efficiency for difficult-to-degrade organic pollutants [22]. MBR has the benefits of a compact footprint, high biochemical efficiency, and good effluent quality, and with the steady improvement of membrane contamination issues [23], this technology has a wide and beneficial use in the field of wastewater treatment [24].
Xiao who reviewed and analyzed the development history and characteristics of MBR, found that MBR has certain advantages over traditional activated sludge methods in terms of pollutant removal and cost–benefit analysis. This technology utilizes a motor to power the mechanical vibration of the MBR packer. This indicates that the membrane is moving and not the water. Therefore, one of the advantages of this technology is that it replaces the conventional high-intensity aeration purging method of membrane contamination management, resulting in a substantial reduction in both investment costs and electricity usage [25]. Neoh introduced the operational and biological characteristics of MBR and concluded that integrated MBR is a leading technology in wastewater treatment as it can open up new sources of energy and nutrients while reducing pollution [26]. Wang used the DEA-Tobit model to process data from Chinese wastewater treatment plants and concluded that technological advances and export levels have a positive impact on emission reduction efficiency, and among treatment processes, biofilm-based processes have higher emission reduction efficiency [27]. Lsejean conducted a market survey on the performance of MBR products in Europe and found that MBR has a clear lead in both municipal and industrial sectors, while he believes that the MBR market will grow further in the future [28].

2.3. Innovation Efficiency of Listed Companies

Huang categorized companies’ organizational capacities as dynamic and collaborative and concluded, based on data analysis, that the better the firm’s organizational capabilities, the greater its innovation efficiency [29]. Wang examined the technological innovation efficiency of Chinese listed companies and concluded that the overall scale efficiency of firms is low, resulting in inefficient technological innovation. Wang argued that the innovation of listed companies is impacted by an unfavorable environment [30]. Chen contended that the ownership structure is a significant factor of innovation success in emerging markets and that the variety of ownership types presents an efficient means of financing emerging market companies, by examining the influence of R&D investment behavior and motivation on innovation efficiency as well as the government’s overinvestment of innovation resources in high-tech companies [31]. Xu concluded that the degree of financing constraints is negatively related to the R&D investment of listed companies in China [32]. Tong discovered that the level of employee protection shows a certain positive correlation with corporate innovation; the higher the level of employee protection, the stronger the corporate innovation capability [33]. Wei used government subsidies as an entry point and demonstrated that government subsidies have a greater impact on the innovation efficiency of emerging strategic industries, with varying degrees of impact depending on the nature of property rights and the life cycle of companies [34]. Mohammed also presented substantial evidence that corporate social responsibility has a similarly strong positive association with innovation efficiency, which increases as corporate social responsibility grows [35].
In summary, the current academic research in wastewater treatment generally focuses on the production efficiency of wastewater treatment plants [36,37], but there is minimal involvement in private or state-owned wastewater treatment corporations structured in the form of companies. In addition, in the research on the innovation efficiency of listed firms, scholars discuss more samples of listed companies in manufacturing and service industries [38,39], and there are few studies on listed companies with wastewater treatment as their major activity. Meanwhile, among the new wastewater treatment technologies, researchers generally focus on the innovation and improvement of conventional methods, such as anaerobic digestion technology, sustainable denitrification technology, denitrification phosphorus removal procedure, etc. Compared with the former, vibrating membranes still represent an emerging technology with limited research outcomes [40]. Therefore, this paper takes the wastewater treatment industry as the scope, the Malmquist-DEA and Tobit model as tools, and representative wastewater treatment technologies of key companies as the cross-sectional analysis object to explore the efficiency of green technology innovation of wastewater treatment companies and its influencing factors.

3. Model Construction and Data Processing

3.1. Research Method

Data envelopment analysis (DEA) and stochastic frontier analysis (SFA) comprise the majority of the current standard academic research approaches for quantifying innovation efficiency. In actuality, because the variables evaluating innovation output have numerous features, the innovation efficiency reflected by a single variable has a considerable error. Hence, this study primarily employs the DEA model as its research instrument.
Early on in the implementation of the DEA model, its connotation evolved since it can only reflect the static efficiency of innovation activities and cannot evaluate the dynamic changes in innovation efficiency of the sample over time. Based on DEA, Charnes presents a CCR model for measuring multiple inputs and multiple outputs under constant returns to scale, whereas Banker proposes the BCC model for measuring technology and efficiency laws with varying returns to scale. This paper focuses on the Malmquist-DEA model, which is an evaluation of efficiency based on the DEA model and can be decomposed into the technology change (TECHCH) and the efficiency change (EFFCH) to reflect the dynamic changes in innovation efficiency more comprehensively among sample companies.
The Malmquist-DEA index measures the growth rate of the total factor productivity, which is an indicator of the dynamic change in efficiency following the evaluation of efficiency. According to the measured data, the theoretical minimum value of TFP is 0 and the theoretical maximal value is infinite. Extreme changes in companies’ conditions within a short period are uncommon due to the complexity and constraints of real-world situations; hence, the value of TFP normally varies about 1. A Malmquist Index value greater than 1 indicates that TFP has improved in the current period compared to the prior one. If the measured number is less than 1, the current period’s TFP has declined relative to the prior period [41,42].
min [ θ ε ( e S + e + S + ) ]
s . t . { j = 1 n x j λ j + S = θ x k j = 1 n y j λ j S + = y k λ 0 , j = 1 , 2 , n S + = ( S 1 + S 2 + , S 3 + , S q + ) T 0 S = ( S 1 S 2 , S 3 , S p ) T 0 }
In this equation, θ is the efficiency taking value in the range of 0–1. λ j is the input–output indicator weight of decision unit j. x j is the input vector of decision j. y j is the output variable of decision unit j. p is the number of input indicators, and q is the number of output indicators. e is the p-dimensional unit row vector. e + is the q-dimensional unit row vector. S , S + are the input and output slack variables, respectively. ε is non-Archimedean infinitesimal quantity. When θ = 1 and ε ( e S + e + S + ) = 0, the decision unit k input–output is DEA effective. When θ = 1 and ε ( e S + e + S + ) > 0, the decision unit k input–output is weakly DEA effective. When is θ < 1, the decision unit k is non-DEA effective and needs to adjust the input–output configuration. The additional convexity constraint j = 1 n λ j = 1 is the variable scale payoff BCC model. The relative efficiency derived under the variable scale payoff condition is the pure efficiency change (PE), whereas the relative efficiency derived from the original CCR model is the efficiency change (EFFCH), also known as the overall efficiency, which is equal to the scale efficiency change (SE) multiplied by the pure efficiency change (PE).
As previously mentioned, when measuring the efficiency of green technology innovation in wastewater treatment companies, the DEA model is analyzed from static aspects and cannot fully respond to the innovation efficiency change process. Thus, it is necessary to construct the Malmquist index model based on the data results of DEA to dynamically measure the efficiency of technology innovation in different periods. The Malmquist index measures the efficiency of the decision unit under the technology conditions of period t, the magnitude of the efficiency change in the decision unit from period t to period t + 1, and the efficiency of the decision unit under t + 1 technology conditions, from which the total factor productivity change from period t to period t + 1 is derived. Under the assumption of continuous returns to scale, the TFP comprises EFFCH and TECHCH.
M   ( x t , y t , x t + 1 , y t + 1 ) = D t + 1 ( x t + 1 , y t + 1 ) D t ( x t , y t ) × [ D t ( x t + 1 , y t + 1 ) D t + 1 ( x t + 1 , y t + 1 ) × D t ( x t , y t ) D t + 1 ( x t , y t ) ] 1 2 = EFFCH × TECHCH
In this equation, Dt and Dt+1 reflect the relative input–output efficiency of the technology-level decision unit in periods t and t + 1, respectively. However, when M is more than 1, TFP increases from period t to period t + 1. When M is equal to 1 or less than 1, TFP decreases. TFP can be further broken down as follows, given that technical efficiency equals the sum of PE and SE.
M (x-, y-, x-”‘, y-”‘) = TFPCH = EFFCH × TECHCH = PECH × SECH × TECHCH
The technological efficiency change, also known as the “Catch-up Effect,” estimates the rate of catch-up of each decision unit from period t to the production possibility frontier in period t + 1. TECHCH, referred to as the “Growth Effect”, evaluates the shift in the technological frontier from period t to period t + 1 and indicates the evolution of technology. When technological innovation or advancement occurs, TECHCH is larger than 1 and the production frontier rises.

3.2. Data Sources

The China Securities Commission’s 2012 industry classification for wastewater treatment companies focuses mostly on the “Water Production and Supply Industry” and “Ecological Protection and Environmental Management Industry”. There are a total of 89 listed businesses in these two industries. The primary criterion for screening the sample of listed firms is the inclusion of “wastewater treatment” in the company’s primary activity. However, to ensure the continuity and validity of the data, the sample of companies listed after 2017 was removed. The study area for this article is comprised of a total of 19 listed companies from 2017 to 2020. When collecting and compiling important data, the WIND database and CSMAR database are the data sources. The names, codes, and abbreviations of the companies are shown in Table 1.
The color in Figure 1, from light to dark, may be divided into a total of three levels: the darker the color, the greater the number of companies that are registered there. According to the geographic distribution of the sample companies, most wastewater treatment companies are registered in the central and eastern areas of China, with Beijing, Jiangsu, and Guangdong being the most registered provinces. There are several elements involved in the selection of geography for wastewater treatment companies, but the four most significant are as follows. First, as the primary economic zone of China, the Middle East has grown production activities and generates a large amount of sewage, creating a large market for wastewater treatment enterprises. Second, government support for green sectors in the region is increased, and the intensity of government subsidies is strong. Third, there are more research institutes in the central and eastern regions, as well as a strong talent attraction, which is favorable to technological research and development. Finally, the high industrial agglomeration effect contributes to the enhancement of businesses’ competitive edge.

3.3. Input–Output Indicators Selection

The wastewater treatment sector is characterized by considerable environmental reliance and belongs to an industry with more dependence on policy and more concentrated R&D resources. With the continual improvement of environmental protection policy regulations, the domestic market demand is continuing to rise, while consumer manufacturers are following increasingly strict emission requirements for their products. In the face of the enormous market, product or technological innovation is regarded as a key component in the competition of wastewater treatment firms; the earlier the creation of advanced environmental technology, the more likely it is to occupy a greater market share. In reference to the articles on the technological innovation efficiency of relevant listed companies, combing the specific indicators in the index system constructed by relevant studies, while considering the characteristics of the wastewater treatment industry itself, the input indicators screened in this paper include total fixed assets, employee compensation and R&D expenses; output indicators include green patent applications and the wastewater treatment operating income. The specific list is shown in Table 2.

4. Results

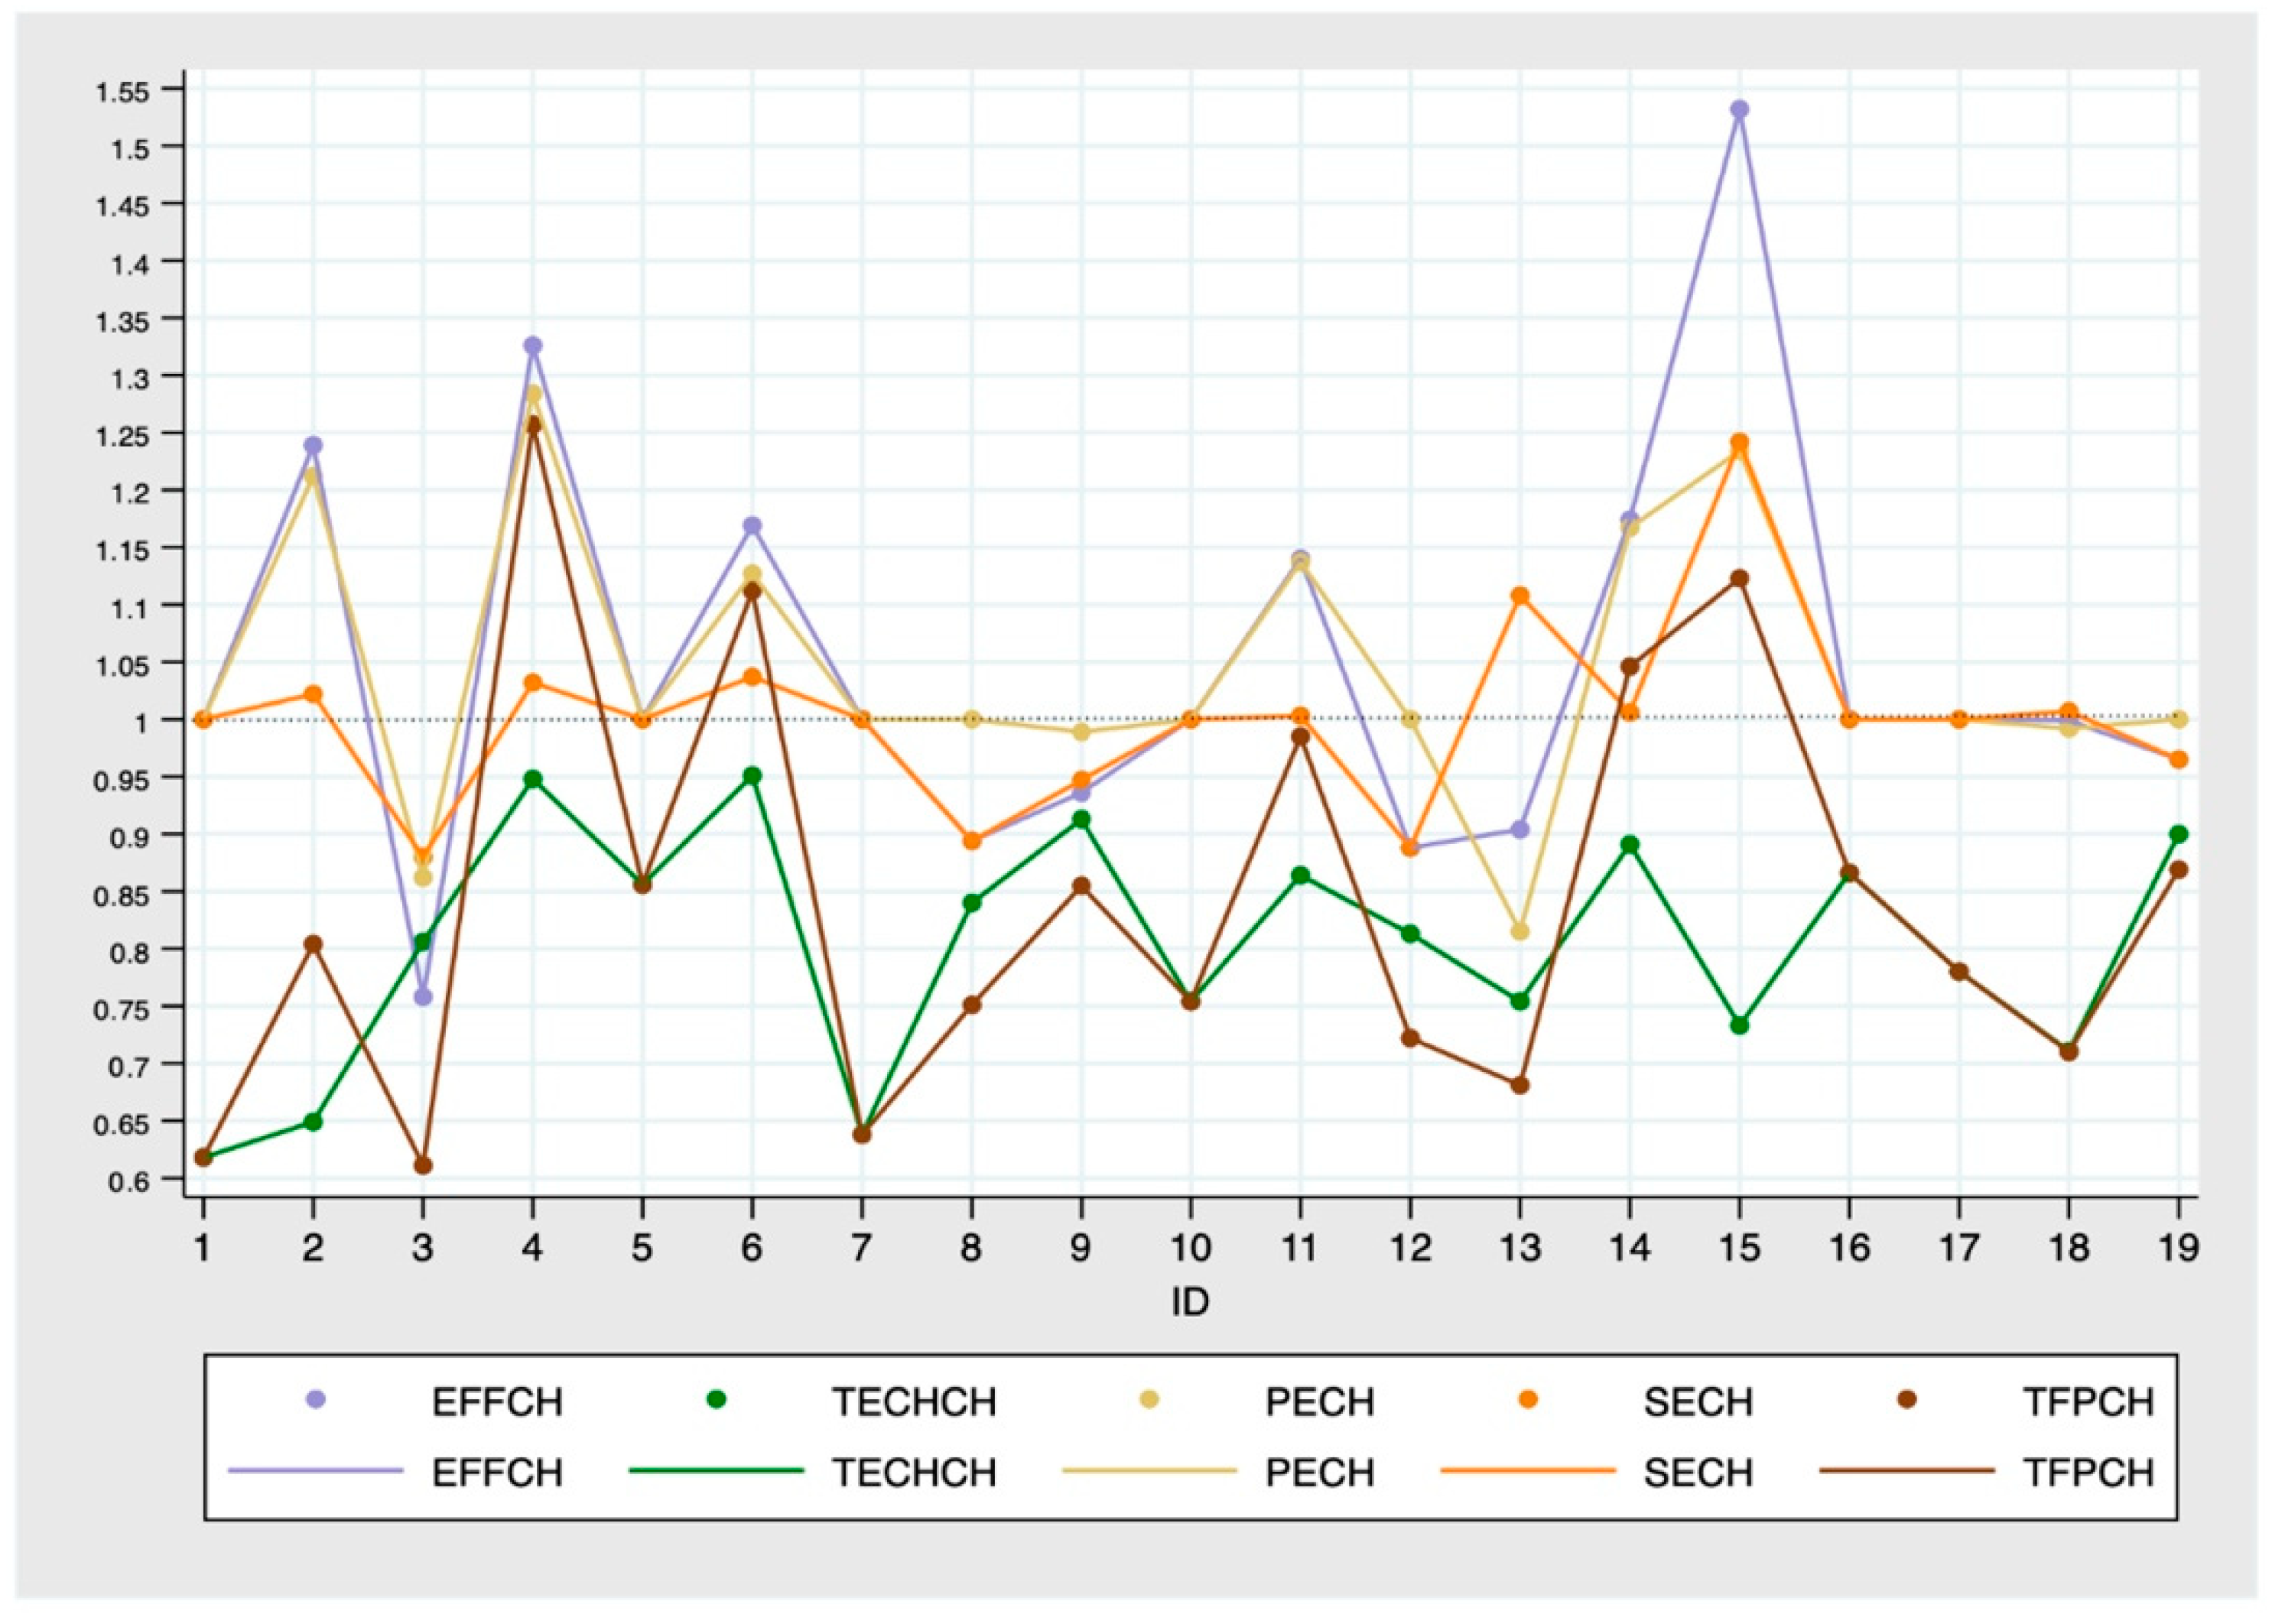
4.1. Dynamic Analysis

4.1.1. General Trends

Total factor productivity (TFP) is the “effectiveness of production operations over time”. It quantifies total output per unit of total input, or the ratio of total output to all factor inputs. According to the data in Figure 2, the TFP of wastewater treatment companies has a downward trend from 2017 to 2020, with the highest decline in 2019–2020, while it has also achieved its lowest level in recent years. TFP is first decomposed into the EFFCH, which is greater than 1 in the period 2017–2019, the innovation catch-up effect of wastewater treatment companies is evident, and the production of DMUs is closer to the production frontier surface, while the decline in TFP in this period is primarily attributable to the decline in the TECHCH. During 2017–2020, as measured by the TECHCH, the green technology level of wastewater treatment companies was below 1 and demonstrates a declining trend. It indicates that the technical level of green technology innovation in wastewater treatment companies did not achieve the expected results, and the low level of technology was not able to improve. The rationale for the lowest TFP in 2019–2020 is that both EFFCH and the TECHCH are at low levels.
In Figure 3, TPF in the statistical period of good performance includes a total of four, namely Kerong, TUS, Zhonghuan, and Penyao, whose average productivity reached 1 or higher. For the remaining fourteen companies, whose performance is poor, TFP has declined to varying degrees. Referring to the specific indicators, we find that the technological innovation efficiency of the four companies with the best performance is growing more steadily and at a faster rate than that of the other sample companies, and that the high level of technological innovation efficiency compensates for their disadvantage in the TECHCH.

4.1.2. Efficiency Change

As shown in Figure 2, the efficiency of green technology innovation in wastewater treatment companies exhibits a rising and then falling trend from 2017 to 2020. In 2017–2019, the EFFCH is better than 1, indicating a productive rate. In contrast, during 2019–2020, the EFFCH reduces to 0.86, suggesting that the production efficiency of wastewater treatment businesses declines by a lesser degree. In terms of their individual performance, the vast majority of businesses operate smoothly and without significant fluctuations, and their technical efficiency performance generally increases and then drops. The period-to-period performance of Grandblue, Safbon, Zhonghuan, and Penyao fluctuates significantly. In contrast, the levels of CSD, CECEP, CEC, Poten, Chongqing, and TCEPG are 1.
The performance of the sample wastewater treatment companies in 2017–2019 demonstrates that the management and technical level of wastewater treatment companies has been rising and that the efficiency of the use of production resources has reached a high level over the past three years as the industry has developed. Nevertheless, the phenomena of declining technical efficiency of wastewater treatment firms in 2019–2020 is notable, as it shows the diminishing ability of components such as assets, labor, and inputs to generate economic output throughout the 2019–2020 economic efficiency growth phase.
The breakdown of EFFCH reveals that it primarily comprises PE and SE, both of which have performance levels near to 1 and indicate a more efficient condition. The PE indicates whether the financing structure is optimized, whether the capital is invested appropriately, and whether the financing channels are reasonable. It reflects the company’s ability to effectively utilize available resources, such as capital, which is primarily dependent on the company’s operation and management skills. The majority of wastewater treatment companies have had a PE greater than 1 over the past four years, indicating that the operational management ability of the company has improved to varying degrees and that there has been some improvement in the utilization of funds for technology research and development. In terms of SE, the average value from 2017 to 2020 is 0.999, indicating a reasonably constant situation. In this four-year period, the scale efficiency is at its best in 2018–2019 and its lowest in 2019–2020. In particular, just six out of nineteen businesses have a regular efficiency below the threshold of 1. The SE of the other 13 firms has risen over the past four years despite the fact that their growth has not been excessive.

4.1.3. Technology Change

As indicated by Figure 2, the TECHCH of wastewater treatment companies demonstrates a more pronounced decline. Specifically, the average value of nearly 1 in 2017–2018 decreased year after year to 0.773 in 2019–2020, with the greatest decline occurring from 0.935 in 2017–2018 to 0.773. In the initial period, 11 of the 19 businesses had a TECHCH greater than 1, indicating greater technological advancement. Since then, there has been a widespread fall in the technical development index, with Xingrong in 2018–2019 and CEC in 2019–2020 being the only companies with values of more than 1 per time period. In spite of a large increase in EFFCH in 2018–2019, the level of TECHCH of the sample companies remains low, indicating that the wastewater treatment industry’s production frontier has been moving downward in recent years. In the wastewater treatment industry, there is a more widespread decline in technology, and the technology “growth effect” is not reflected. Even in the context of a large increase in EFFCH in 2018–2019, the level of TECHCH of the sample companies is still in a low state, which indicates that the production frontier of the wastewater treatment industry has been in a trend of downward movement in recent years.
The level of green technological innovation in wastewater treatment companies cannot be increased effectively for several reasons, including the impact of external variables and the absence of management level and technical capacity of this enterprise’s product. First, the rapid expansion of China’s domestic market size and the lack of market competition intensity resulted in insufficient motivation for enterprise technology innovation. Second, China’s wastewater treatment technology started late, relying primarily on technology introduction and product procurement, resulting in the slow development of companies’ own innovation. Third, China’s wastewater treatment process requirements are low, and firms have a poor technical level. Fourth, weak policy incentives to support the wastewater treatment business must be enhanced.
The drop in the TECHCH implies that the original factor allocation structure is no longer matched to the needs of technological advance and has even become a major factor that impedes technological progress. The explanation for the improvement in technical efficiency but lack of technological advancement may be the unfavorable effect of big changes in relative pricing on the selection of factor inputs. As the stage of technological change advances, the rate of efficiency improvement becomes slower and slower, and the dependence of TFP improvement on technological progress is evident. The sustainable development of Chinese wastewater treatment companies will largely depend on whether they can continue technological progress characterized by innovation.

4.1.4. Analysis of Key Companies

Kerong, TUS, Xingrong, and Bohai are the four companies in Figure 3 with the highest TFP. In terms of specific indicators, the first three companies are more evenly matched in terms of EFFCH and TECHCH, but Bohai’s primary advantage resides in EFFCH. In addition, Originwater is included in the research due to its substantial market share in the sector of domestic wastewater treatment, as well as the fact that its TECHCH falls between the middle and upper levels. In terms of technological factors, the companies listed above have more technical advantages than their rivals in the same industry.
Kerong has a number of invention patents and utility model patents for wastewater treatment technology in the field of water environment treatment, and its research team’s “new process of sludge anaerobic digestion” earned the second prize of Beijing Science and Technology Progress. The company has also created a new MBR process, which, compared to the classic MBR, can provide more stable system effluent and improved water quality without impacting the life of activated sludge in the aerobic tank, as well as saving more floor space for the treatment process. TUS also possesses more advanced water pollution management technologies, such as hydroponic cyclone technology, fiber rotary filter equipment, biological reaction chain technology, and FBC technology. As the core technology of TUS, FBC technology is the company’s primary competitive advantage, and FCB technology is a solution for the quasi-IV discharge standard, which is a deep nitrogen and phosphorus removal procedure based on an anaerobic anoxic fluidized biological carrier. It has been effectively applied at Xi’an City’s four wastewater treatment plants and Hanzhong, without the addition of a carbon source, and the main indexes meet the surface water quality standard for class IV. In addition, Xingrong invests in research and development, focusing primarily on the experimental research project of increased biological denitrification, and has achieved some success.
As a wastewater treatment company with a relatively substantial market share, Originwater has been at the forefront of technological innovation in the industry. Its MBRU (membrane bioreactor unit) is one of the essential technologies in China’s ongoing “Energy Saving and Emissions Reduction” and “Wastewater Resource Utilization” strategies, as well as the principal product of MBR technology. The most recent generation of MBRU utilizes tank-type aeration technology and three-dimensional water collecting technology, resulting in good effluent quality, low operational energy consumption, robust anti-fouling capability, a small footprint, and a long service life. The membrane filament pore size is uniformly distributed, with high filtration accuracy and effluent turbidity below 1NTU; the membrane filament has a unique gradient network membrane pore structure to improve pollution resistance and high chemical cleaning efficiency. The fiber-reinforced composite membrane technology makes the membrane filament fracture stress high and the service life long, allowing it to be applied in a variety of wastewater treatment fields.
Companies are advancing their green technologies in many ways. WELLE currently utilizes A2O (submerged flat MBR) technology for the treatment of municipal wastewater by enhancing the existing technology. This method stabilizes and enhances the effluent quality by keeping microorganisms in the bioreactor, raising and maintaining the microorganisms’ concentrations (especially long-generation-cycle microorganisms). This technology replaces the traditional secondary sedimentation tank with a submerged plate membrane filtration process. The aeration provided serves simultaneously as a microbial metabolism and oxygenation and membrane surface scouring to reduce pollution, resulting in stable and optimized effluent quality with minimal external influence. In addition, CECEP has created energy-saving Biovac-PMBR wastewater treatment equipment based on the introduction of MBR technology from Japan Kubota, integrated with a sophisticated UCT method. This equipment has a high efficiency of nitrogen removal and phosphorus removal and a great ability of shock load resistance and is mostly utilized in areas with limited land and no municipal infrastructure.
According to the TFP formula, the horizontal and vertical coordinates are the mean of EFFCH and TECHCH, respectively. As indicated by Figure 4, based on the data performance, we separated the companies into four quadrants. There are a total of four companies in quadrant Ⅰ, and their EFFCH improvement is the most substantial. In addition, the TECHCH level of these companies is greater than that of the sample companies, and they have an outstanding development position within the industry. To further strengthen their dominating position, companies in quadrant Ⅰ should boost their efforts to enhance their technology while retaining their scale efficiency. Companies in quadrant Ⅱ have a lesser fall in technology level, although their scale efficiency is below the average for the industry. Such companies should prioritize the enhancement of corporate governance and scaling efficiency. The companies in quadrant Ⅲ have low performance on both the technical level and the efficiency of scale. When determining their future course of action, companies must implement substantial reforms and reallocate resources. The companies should enhance their internal governance and increase the investment of R&D. To improve TFP performance, the two companies in quadrant Ⅳ should allocate future resources to R&D, talent acquisition, and outcome transformation.

4.2. Tobit Regression

On the basis of the facts presented above, it is evident that the efficacy of green technology innovation in China’s wastewater treatment companies varies significantly; thus, what are the primary causes? For further study, this paper employs Stata software to conduct a Tobit model regression analysis to research the factors that influence business green technology innovation efficiency.

4.2.1. Variable Description

(1)
Government subsidies (SUB). Government subsidies are governmental measures by public institutions to provide financial contributions, price concessions, support business income or reduce the benefits of other related parties to certain companies for specific purposes [43].
(2)
Salary of employees (SAL). Whether it is economic development or technological progress, innovative talents are crucial for companies to gain core competitiveness in the market [44]. Salary is the most direct way to motivate talents. Therefore, this paper uses “employee compensation payable/number of employees” to represent the salary of employees.
(3)
Overhead expenses (COST). The term ‘overhead expenses’ generally refers to the various costs incurred in an enterprise to organize and manage production and operation activities. The specific items included are the daily overhead costs incurred, maintenance costs during business management, etc., which are a reflection of the daily operating consumption of the enterprise.
(4)
Net profit margin on assets (ROA). Net profit margin is the ratio of net profit and average total assets of a company in a certain period of time. The higher the value, the more profitable the enterprise can be with all its assets. It is the most important indicator that affects the profitability of owner’s equity.
(5)
Shareholding ratio (SHARE). Shareholding is the most direct manifestation of shareholders’ interests. Shareholders who possess a certain percentage of the company’s stock enjoy unique rights in specific topics and can play a variable role in the company’s development and decision-making. Depending on the concentration of equity, a company’s operations may function differently [45]. In this article, the shareholding ratio is determined by the number of shares held by the top ten shareholders as a proportion of the entire share capital.

4.2.2. Tobit Regression Results

The Tobit model is suitable for such regressions with restricted explanatory variables because the values of the explanatory variables are between 0 and 1, and the results of the OLS regressions are biased:
Effi = α + β1 X1 + β2 X2 + β3 X3 + β4 X4 + β5 X5 + ε
Effi is the combined technical efficiency value measured by the BCC model. X is the explanatory variable, α is the constant term, β is the coefficient value, and ε is the random disturbance term. Table 3 shows the Tobit regression results.
As shown in Table 3, two of the five influencing variables of the Tobit regression equation passed the test. This suggests that environmental issues substantially affect the technological efficiency of businesses. When the coefficient of regression is positive, it shows that an increase in environmental variables is favorable in raising the efficiency of green technological innovation within businesses, thus enhancing their competitiveness. Among these, the coefficient of SAL is −0.085 and passes the significance test at the 5% level, indicating that high employee salaries are not conducive to the enhancement of firms’ green technological innovation efficiency. SHARE’s coefficient is 0.009, which passes the significance test at the 1% level. This suggests that the enterprise’s green technology innovation efficiency improves with increasing equity concentration. This is because the high number of shares held by the top ten shareholders gives them significant decision-making power within the organization. The management develops more effective business strategies, and employees are more driven to take the initiative, allowing the organization to flourish over time. In addition, the SUB, COST, and ROA coefficients fail the significance test. This demonstrates that government subsidies, overhead costs, and the net profit margin of assets have no substantial effect on the efficiency of green technology innovation among businesses at this time. This may be because the money in these areas is not utilized for the technological innovation activities of businesses.

5. Discussion

5.1. Main Discovery

In this paper, 19 wastewater treatment companies listed on the Shanghai or Chinese stock exchange were chosen, and their green technology innovation efficiency and influencing factors quantified and analyzed by processing their index data from 2017 to 2020 and applying Malmquist-DEA and Tobit models. Finally, the following conclusions were drawn.
First, the SE and PE of China’s wastewater treatment companies have improved, and the influence of the technological level is the primary reason for the year-on-year decline in total factor productivity. In the context of increasing EFFCH, the TECHCH is declining, indicating that the key to boosting the efficiency of green technology innovation in Chinese wastewater treatment firms is to increase the level of wastewater treatment technology.
The results of the components that influence innovation efficiency indicate that environmental considerations have a significant impact on businesses’ overall technical efficacy. Excessive employee compensation hurts firms’ innovation efficiency, whereas increased company equity concentration promotes firms’ innovation activities. At this stage, there is no major influence of government subsidies and overhead expenses on companies’ green technology innovation effectiveness.
Lastly, the companies with the best TFP performance are distinguished by their advanced core treatment technologies and outstanding contributions in the field of wastewater treatment and separation in China, but there is still a significant technological gap between the Chinese market and the international market. Meanwhile, there is no correlation between the number of patent applications and the R&D success of businesses.

5.2. Industrial Implications

5.2.1. Rectifying the Understanding of the Patent System’s Function of Companies

Some companies in the panel data have a high number of patent applications but a low level of technology. In addition to a lack of awareness of the patent system and the use of patent applications primarily as a tool to authorize more government funding [46], the low rate of technology conversion is a significant factor in the poor technological progress performance [47]. Therefore, wastewater treatment companies require a greater investment in research and higher technology conversion rates, as well as an increase in the proportion of skilled workers and a decrease in factors that inhibit technology conversion rates. Companies must clarify their primary position in the technological innovation system, strengthen their collaboration with universities and research institutes, and identify feasible research projects to increase the anticipated conversion rate. In addition, they must improve the level of enterprise management, actively train technical personnel, enhance their working conditions and incentives, and establish an effective communication and cooperation mechanism between industry, academia, and research institutions. Companies must use the market as their compass, incorporate technology, management, money, and other factors into market selection, and enhance the applicability and market adoption of R&D technology.

5.2.2. Increasing the Precision of Subsidies for Wastewater Treatment Technologies

In the study, even though the total amount of government subsidies is increasing each year, the lack of precision of its subsidies, resulting in a certain flooding situation, combined with the absence of supervision mechanisms, prevents the funds from being utilized to their full potential [48]. Likewise, for the enterprise side, because the relevant policy is more of a matter of principle, there is not sufficient incentive to use the government subsidies for the maximum efficiency of research and development investments, and even the government subsidies obtained because of wastewater treatment to other business areas are not uncommon, which has led to the current government subsidies continuing to exacerbate the embarrassing situation. Therefore, the government, as the provider of funds, must further improve the policy and regulations on wastewater treatment subsidies, increase the intensity of financial support, and improve the accuracy of subsidies. In addition, the government needs to monitor the destination of corporate funds, and the performance of the use of corporate funds as the basis for the number of subsidies issued the following year, in order to play the role of national policy guidance more effectively.

5.2.3. Enhancing Industrial Structure and Boost Spending on Wastewater Treatment

As a result of the mismatch between China’s industrial needs and environmental regulations, the wastewater treatment industry has substantial market potential. In China’s current market ratio, the number of companies with modern wastewater treatment technology is low, the market share of individual companies is relatively high, and the overall market competitiveness is inadequate. Therefore, companies must continue to alter their industrial structure, respond to national policies and market demand, increase the volume of their investment in the wastewater treatment business’s parts, and enhance their resource allocation. In the current domestic enterprise wastewater treatment technology, the introduction of so-called advanced technology may not have advanced status on the international market and has even instead been updated after the product. The domestic technology market is at the low end of the locked state [49]. Domestic enterprises in R&D are mostly for the existing treatment process technical corrections and improvements, which, in terms of basic technology research and development, are far from enough. Therefore, businesses must concentrate on the international market, using international advanced technology as a benchmark, and the government must be supportive with relevant policies to encourage more production factors, to invest in the research and development of advanced technology to enhance the level of wastewater treatment technology.

5.2.4. Enhancing the Level of Internal Governance and Business Internal Management

We can only successfully ensure the efficiency and efficacy of the utilization of corporate R&D money by constructing a governance model that integrates corporate governance and internal control. First, we optimize the enterprise’s equity structure and organizational scale. Considering a minor loss in scale efficiency over the past year, wastewater treatment companies must reevaluate their organizational size and pay allocation mechanism to maximize the effectiveness of each production factor. Moreover, because China’s wastewater treatment companies are still in the early stages of development, a higher concentration of corporate equity is more conducive to business decisions and implementation. Companies can moderate the concentration of equity through buybacks or other means in the hope of enhancing the effectiveness of the company’s green technology innovation.

5.2.5. Enhancing the Awareness of Technological Innovation of Companies and Improving the Level of Efficiency of Wastewater Treatment

China’s “Statistical Yearbook of Urban Drainage” reveals that the wastewater treatment process AOO type process is the most popular in the country, accounting for 33 percent of the statistical number, followed by the oxidation ditch process and SBR process, accounting for 29 percent and 19 percent, respectively; the AO process accounted for 4 percent of the statistical number, MBR process accounted for 3 percent of the statistical number, and the use of biofilm technology accounted for 2 percent of the statistical number. In the realm of international wastewater treatment, domestic treatment technologies of an advanced level have become increasingly prevalent. China’s wastewater treatment technology and processes lag significantly behind international standards. Strengthening the technology of anaerobic digestion, for instance, is currently a focus of international research. For instance, thermal hydrolysis pretreatment, mixed-matrix co-digestion, and graded phase anaerobic digestion, among others, have been actually applied on a large scale in foreign projects, whereas less than 5 percent of China’s wastewater treatment plants use the anaerobic digestion process. Therefore, firms involved in wastewater treatment must actively rely on national policies, take advantage of financial support and policy protection, and develop innovative new technologies, processes, and equipment.

6. Conclusions

In terms of R&D technology, this paper’s findings serve as a benchmark for Chinese wastewater treatment companies. This portion of companies can refer to the research findings for production factor adjustment to increase the efficacy of green technology innovation in companies and to develop more advanced wastewater treatment separation technologies and processes in alignment with the international market.
This paper still has several limitations regarding the selection and processing of data. First, in the panel data, only 19 wastewater treatment companies were selected between 2017 and 2020. The number of companies is small, and the period is short, preventing a more accurate representation of the changes in the efficiency of green technology innovation in wastewater treatment companies. Second, the paper’s data indicators cannot account for the influence of each component on the treatment outcomes, and the research on influencing factors lacks precision. The study concludes with an inadequate presentation of the technical components of wastewater treatment, focusing mostly on the core technologies of certain businesses, and with insufficient depth of description of the technical qualities.

Author Contributions

Conceptualization, X.X.; methodology, X.C.; software, X.C.; validation, X.X. and Q.Z.; formal analysis, Y.J.; investigation, Y.J.; resources, Q.Z.; data curation, Y.L.; writing—original draft preparation, X.X. and Q.Z.; writing—review and editing, X.X.; visualization, X.C.; supervision, Y.L.; project administration, Y.J.; funding acquisition, X.X. All authors have read and agreed to the published version of the manuscript.

Funding

This research was funded by the Major Projects of National Social Science Fund, grant number 20&ZD205; the Projects of National Social Science Fund, grant number 19CFX052; Research project of State Intellectual Property Office of China, grant number SS21-B-015; The National Natural Science Foundation of China, grant number 71974144; The fund of the Key Laboratory of Cities’ Mitigation and Adaptation to Climate Change in Shanghai, grant number QHBHSYS201906.

Institutional Review Board Statement

Not applicable.

Informed Consent Statement

Informed consent was obtained from all subjects involved in the study.

Data Availability Statement

Data is contained within the article. Further requests can made to the corresponding author.

Conflicts of Interest

The authors declare no conflict of interest.

References

  1. Shannon, M.A.; Bohn, P.W.; Elimelech, M.; Georgiadis, J.G.; Mariñas, B.J.; Mayes, A.M. Science and technology for water purification in the coming decades. Nature 2008, 452, 301–310. [Google Scholar] [CrossRef]
  2. Zhao, X.; Ma, X.; Chen, B.; Shang, Y.; Song, M. Challenges toward carbon neutrality in China: Strategies and countermeasures. Resour. Conserv. Recycl. 2022, 176, 105959. [Google Scholar] [CrossRef]
  3. Shrivastava, P. Environment technologies and competitive advantage. Strateg. Manag. J. 1995, 16, 183–200. [Google Scholar] [CrossRef]
  4. Braun, E.; Wield, D. Regulation as a means for the social control of technology. Technol. Anal. Strateg. Manag. 1994, 6, 259–272. [Google Scholar] [CrossRef]
  5. Przychodzen, J.; Przychodzen, W. Relationship between eco-innovation and financial performance-Evidence form listed companies in Poland and Hungary. J. Clean. Prod. 2015, 90, 253–263. [Google Scholar] [CrossRef]
  6. Xu, X.; Chen, X.; Zhu, Y.; Zhu, Y. The Effect of R&D Input on Operating Income of Chinese Wastewater Treatment Companies—With Patent Performance as a Mediating Variable. Water 2022, 14, 836. [Google Scholar] [CrossRef]
  7. Zhang, W. R&D investment and distress risk. J. Empir. 2015, 32, 94–114. [Google Scholar] [CrossRef]
  8. Lu, L.; Guest, J.S.; Peters, C.A.; Zhu, X.; Rau, G.H.; Ren, Z.J. Wastewater treatment for carbon capture and utilization. Nat. Sustain. 2018, 1, 750–758. [Google Scholar] [CrossRef]
  9. Shen, K.; Li, L.; Wang, J.Q. Circular economy model for recycling waste resources under government participation: A case study in industrial waste water circulation in China. Technol. Econ. Dev. Econ. 2019, 26, 21–47. [Google Scholar] [CrossRef]
  10. Neczaj, E.; Grosser, A. Circular Economy in Wastewater Treatment Plant–Challenges and Barriers. Proceedings 2018, 2, 614. [Google Scholar] [CrossRef] [Green Version]
  11. Dong, X.; Zhang, X.; Zeng, S. Measuring and explaining eco-efficiencies of wastewater treatment plants in China: An uncertainty analysis perspective. Water Res. 2017, 112, 195–207. [Google Scholar] [CrossRef]
  12. Romano, G.; Guerrini, A. Measuring and comparing the efficiency of water utility companies: A data envelopment analysis approach. Util. Policy 2011, 19, 202–209. [Google Scholar] [CrossRef]
  13. Vicent, H.C.; Águeda, B.D.; Francesc, H.S. Efficiency of wastewater treatment facilities: The influence of scale economies. J. Environ. Manag. 2018, 228, 77–84. [Google Scholar] [CrossRef]
  14. Hernández-Sancho, F.; Sala-Garrido, R. Technical efficiency and cost analysis in wastewater treatment processes: A DEA approach. Desalination 2009, 249, 230–234. [Google Scholar] [CrossRef]
  15. Shi, Z.; She, Z.; Chiu, Y.; Qin, S.; Zhang, L. Assessment and improvement analysis of economic production, water pollution, and sewage treatment efficiency in China. Socio-Econ. Plan. Sci. 2021, 74, 100956. [Google Scholar] [CrossRef]
  16. Guerrini, A.; Romano, G.; Carosi, L.; Mancuso, F. Cost Savings in Wastewater Treatment Processes: The Role of Environmental and Operational Drivers. Water Resour. Res. 2017, 31, 2465–2478. [Google Scholar] [CrossRef]
  17. Bhattacharyya, A.; Harris, T.R.; Narayanan, R.; Raffiee, K. Specification and estimation of the effect of ownership on the economic efficiency of the water utilities. Reg. Sci. Urban Econ. 1995, 25, 759–784. [Google Scholar] [CrossRef]
  18. Ma, Y.; Zhai, Y.; Zheng, X.; He, S.; Zhao, M. Rural domestic wastewater treatment in constructed ditch wetlands: Effects of influent flow ratio distribution. J. Clean. Prod. 2019, 225, 350–358. [Google Scholar] [CrossRef]
  19. Gu, J.; Liu, H.; Wang, S.; Zhang, M.; Liu, Y. An innovative anaerobic MBR-reverse osmosis-ion exchange process for energy-efficient reclamation of municipal wastewater to NEWater-like product water. J. Clean. Prod. 2019, 230, 1287–1293. [Google Scholar] [CrossRef]
  20. Bihan, Y.L.; Lessard, P. Monitoring biofilter clogging: Biochemical characteristics of the biomass. Water Res. 2000, 17, 4284–4294. [Google Scholar] [CrossRef]
  21. Yoon, S.H.; Kim, H.S.; Yeom, I.T. The optimum operational condition of membrane bioreactor (MBR): Cost estimation of aeration and sludge treatment. Water Res. 2004, 1, 37–46. [Google Scholar] [CrossRef]
  22. Sipma, J.; Osuna, B.; Collado, N.; Monclús, H.; Ferrero, G.; Comas, J.; Roda, I.R. Comparison of removal of pharmaceuticals in MBR and activated sludge systems. Desalination 2010, 2, 653–659. [Google Scholar] [CrossRef]
  23. Du, X.; Shi, Y.; Jegatheesan, V.; Haq, I.U. A Review on the Mechanism, Impacts and Control Methods of Membrane Fouling in MBR System. Membranes 2020, 10, 24. [Google Scholar] [CrossRef] [PubMed]
  24. Santos, A.; Ma, W.; Judd, S.J. Membrane bioreactors: Two decades of research and implementation. Desalination 2010, 1, 148–154. [Google Scholar] [CrossRef]
  25. Xiao, K.; Xu, Y.; Liang, S.; Lei, T.; Sun, J.; Wen, X.; Zhang, H.; Chen, C.; Huang, X. Engineering application of membrane bioreactor for wastewater treatment in China: Current state and future prospect. Front. Environ. Sci. Eng. 2014, 8, 805–819. [Google Scholar] [CrossRef]
  26. Neoh, C.H.; Noor, Z.Z.; Ahmad-Mutamim, N.S.; Lim, C.K. Green technology in wastewater treatment technologies: Integration of membrane bioreactor with various wastewater treatment systems. Chem. Eng. J. 2016, 283, 582–594. [Google Scholar] [CrossRef]
  27. Wang, S.; Zhou, L.; Wang, H.; Li, X. Water Use Efficiency and Its Influencing Factors in China: Based on the Data Envelopment Analysis (DEA)—Tobit Model. Water 2018, 10, 832. [Google Scholar] [CrossRef]
  28. Lesjean, B.; Huisjes, E.H. Survey of the European MBR market: Trends and perspectives. Desalination 2008, 231, 71–81. [Google Scholar] [CrossRef]
  29. Huang, J.W.; Li, Y.H. Green Innovation and Performance: The View of Organizational Capability and Social Reciprocity. J. Bus. Ethics 2017, 145, 309–324. [Google Scholar] [CrossRef]
  30. Wang, Q.; Geng, C. Research on Financing Effciencies of Strategic Emerging Listed Companies by Six-Stage DEA Model. Math. Probl. Eng. 2017, 8, 2017. [Google Scholar] [CrossRef] [Green Version]
  31. Chen, V.Z.; Li, J.; Shapiro, D.M.; Zhang, X. Ownership structure and innovation: An emerging market perspective. Asia Pac. J. Manag. 2014, 31, 1–24. [Google Scholar] [CrossRef]
  32. Xu, K.; Geng, C.; Wei, X.; Jiang, H. Financing development, financing constraint and R&D investment of strategic emerging industries in China. J. Bus. Econ. Manag. 2020, 21, 1010–1034. [Google Scholar] [CrossRef]
  33. Tong, L.; Liu, N.; Zhang, M.; Wang, L. Employee Protection and Corporate Innovation: Empirical Evidence from China. J. Bus. Ethics 2018, 153, 569–589. [Google Scholar] [CrossRef]
  34. Wei, J.; Liu, Y. Government support and firm innovation performance: Empirical analysis of 343 innovative companies in China. Chin. Manag. Stud. 2015, 9, 38–55. [Google Scholar] [CrossRef]
  35. Benlemlih, M.; Bitar, M. Corporate Social Responsibility and Investment Efficiency. J. Bus. Ethics 2018, 148, 647–671. [Google Scholar] [CrossRef]
  36. Zhou, X.; Luo, R.; Yao, L.; Cao, L.; Wang, S.; Lev, B. Assessing integrated water use and wastewater treatment systems in China: A mixed network structure two-stage SBM DEA model. J. Clean. Prod. 2018, 185, 533–546. [Google Scholar] [CrossRef]
  37. Wang, M.; Huang, Y.; Li, D. Assessing the performance of industrial water resource utilization systems in China based on a two-stage DEA approach with game cross efficiency. J. Clean. Prod. 2021, 312, 127722. [Google Scholar] [CrossRef]
  38. Bian, Y.; Yan, S.; Xu, H. Efficiency evaluation for regional urban water use and wastewater decontamination systems in China: A DEA approach. Resour. Conserv. Recycl. 2014, 83, 15–23. [Google Scholar] [CrossRef]
  39. Shin, J.; Kim, Y.J.; Jung, S.; Kim, C. Product and service innovation: Comparison between performance and efficiency. J. Innov. Knowl. 2022, 7, 100191. [Google Scholar] [CrossRef]
  40. Sala-Garrido, R.; Hernández-Sancho, F.; Molinos-Senante, M. Assessing the efficiency of wastewater treatment plants in an uncertain context: A DEA with tolerances approach. Environ. Sci. Policy 2012, 18, 34–44. [Google Scholar] [CrossRef]
  41. Färe, R.; Grosskopf, S.; Lindgren, B.; Roos, P. Productivity changes in Swedish pharamacies 1980–1989: A non-parametric Malmquist approach. J. Prod. Anal. 1992, 3, 85–101. [Google Scholar] [CrossRef]
  42. Caves, D.W.; Christensen, L.R.; Diewert, W.E. The economic theory of index numbers and the measurement of input, output, and productivity. Econometrica 1982, 50, 1393–1414. [Google Scholar] [CrossRef]
  43. Xu, X.; Chen, X.; Xu, Y.; Wang, T.; Zhang, Y. Improving the Innovative Performance of Renewable Energy Enterprises in China: Effects of Subsidy Policy and Intellectual Property Legislation. Sustainability 2022, 14, 8169. [Google Scholar] [CrossRef]
  44. Xu, X.; Zhang, W.; Wang, T.; Xi, Y.; Du, H. Impact of subsidies on innovations of environmental protection and circular economy in China. J. Environ. Manag. 2021, 289, 112385. [Google Scholar] [CrossRef]
  45. Singh, M.; Davidson, W.N. Agency costs, ownership structure and corporate governance mechanisms. J. Bank. Financ. 2003, 5, 793–816. [Google Scholar] [CrossRef]
  46. Chu, A.C.; Furukawa, Y.; Ji, L. Patents, R&D subsidies, and endogenous market structure in a schumpeterian economy. South. Econ. J. 2016, 82, 809–825. [Google Scholar] [CrossRef]
  47. Raheman, A.; Afza, T.; Qayyum, A.; Bodla, M.A. Estimating Total Factor Productivity and Its Components: Evidence from Major Manufacturing Industries of Pakistan. Pak. Dev. Rev. 2008, 47, 677–694. Available online: http://www.jstor.org/stable/41261247 (accessed on 1 July 2022). [CrossRef]
  48. Guo, Y.; Xia, X.; Zhang, S.; Zhang, D. Environmental Regulation, Government R&D Funding and Green Technology Innovation: Evidence from China Provincial Data. Sustainability 2018, 10, 940. [Google Scholar] [CrossRef]
  49. Qu, J.; Wang, H.; Wang, K.; Wang, K.; Yu, G.; Ke, B.; Yu, H.-Q.; Ren, H.; Zheng, X.; Li, J.; et al. Municipal wastewater treatment in China: Development history and future perspectives. Front. Environ. Sci. Eng. 2019, 13, 88. [Google Scholar] [CrossRef]
Figure 1. Wastewater treatment companies registered in the distribution.
Separations 09 00263 g001
Figure 2. Malmquist index and its decomposition index in 2017–2020.
Separations 09 00263 g002
Figure 3. Malmquist index of wastewater treatment companies in 2017–2020.
Separations 09 00263 g003
Figure 4. Wastewater treatment companies’ performance categories.
Separations 09 00263 g004
Table 1. Sample of listed wastewater companies.
NumberStock SymbolFull NameAbbreviation
1603903CSD Water Service Co., Ltd.CSD
2600323Grandblue Environment Co., Ltd.Grandblue
3300262Safbon Water Service Inc.Safbon
4300152Xiongan Kerong Environment Technology Co., Ltd.Kerong
5300388CECEP Guozhen Environmental Protection Technology Co., Ltd.CECEP
6000826TUS Environment Science and Technology Development Co., Ltd.TUS
7300172CEC Environment Protection Co., Ltd.CEC
8300070Beijing Originwater Technology Co., Ltd.Originwater
9300422Guangxi Bossco Environmental Protection Technology Co., Ltd.Bossco
10603603Poten Environment Group Co., Ltd.Poten
11300190WELLE Environmental Group Co., Ltd.WELLE
12300692Anhui Zhonghuan Environmental Protection Technology Co., Ltd.Zhonghuan
13300664Penyao Environmental Protection Co., Ltd.Penyao
14000598Chengdu Xingrong Environment Co., Ltd.Xingrong
15000605Bohai Water Industry Co., Ltd.Bohai
16601158Chongqing Water Group Co., Ltd.Chongqing
17600874Tianjin Capital Environmental Protection Group Company LimitedTCEPG
18000544Central Plains Environment Protection Co., Ltd.CPEP
19600187Heilongjiang Interchina Water treatment Co., Ltd.Interchina
Table 2. Input and output indicators.
INDEXSYMBOL
INPUTTotal Fixed AssetsX1
Staff SalariesX2
R&DX3
OUTPUTGreen Patent ApplicationsY1
Wastewater Treatment in RevenuesY2
Table 3. Regression results.
EffiCoef.St.Errt-Valuep-ValueSig.
SUB0.0380.0241.560.119
COST−0.0540.066−0.820.415
SAL−0.0850.041−2.050.040**
SHARE0.0090.0023.840.000***
ROA0.0080.0061.300.193
_cons1.4201.2151.170.243
*** p < 0.01, ** p < 0.05.
Publisher’s Note: MDPI stays neutral with regard to jurisdictional claims in published maps and institutional affiliations.

