
Separation and Disinfection of Contagious Aerosols from the Perspective of SARS-CoV-2


Romico Hold A.V.V., 6226 GV Maastricht, The Netherlands
Separations 2021, 8(10), 190; https://doi.org/10.3390/separations8100190
Submission received: 8 September 2021
/
Revised: 7 October 2021
/
Accepted: 11 October 2021
/
Published: 15 October 2021
(This article belongs to the Collection State of the Art in Separation Science)
Abstract
:An assessment was performed on methods of separating and disinfecting airborne droplet nuclei containing viruses, such as SARS-CoV-2. The droplet nuclei originate from evaporating aerosols emitted by the coughing, singing, sneezing, etc. of infected humans. Based on empirical data and theoretical analysis, we successively determined: (i) the particle number distribution of nuclei versus the nucleus diameter, (ii) the statistical distribution of the viral content in the droplet nuclei starting from a uniform random distribution of viruses in the mucus, (iii) the particle number distribution of droplet nuclei containing at least one virus particle, and (iv) the effectiveness of methods for removing and disinfecting nuclei containing one or more virus particles from indoor air; viz., ventilation with fresh air, filtering with porous media, such as HEPA, and centrifugal separation and simultaneous disinfection, particularly with a rotational particle separator (RPS). Indoor aerosol removal with RPS supplemented with HEPA to arrest tiny volumes of very small particles was found to be the most effective. It is as good as particle removal through ventilation with clean air over long periods of time. An RPS facilitates direct elimination of viruses in the collected nuclei by flushing with a disinfection liquid. The components of an RPS are recyclable. Combining HEPA with an RPS extends the service time of HEPA by almost two orders of magnitude compared to the relatively short service time of stand-alone HEPA filters.
1. Introduction
Several epidemic illnesses are caused by viruses [1]. COVID-19, for instance, is caused by infection with the severe acute respiratory syndrome coronavirus 2 (SARS-CoV-2) strain [2]. Transmission of viral diseases, such as COVID-19, may be caused by respiratory droplets in a gas from coughs and/or sneezes. COVID-19 is a new disease, and many of the details of its spread are under investigation at present. This is one of the reasons for why prior literature related to methods and devices configured for decreasing the spread of the SARS-CoV-2 virus is sparse. COVID-19 may spread from person to person via several different modes, particularly when people are in close proximity to one another [3]. Spread may occur very easily and sustainably, with one infected person possibly infecting more than one other person. It may be transmitted when people are symptomatic, but also when people do not show any or only minor symptoms. The World Health Organization (WHO) recommends at least one meter of social distance to hinder transmission, in combination with wearing face masks and washing hands, but people increasingly have problems with this behavior.
Viral diseases in particular spread by means of small droplets in the breath, which are usually referred to as aerosols or bio-aerosols [4,5,6,7,8,9,10]. An aerosol is a suspension of fine solid particles or liquid droplets in a gas or in air. The liquid or solid particles can reach very small sizes. As an example, SARS-CoV-2 virus particles are generally about 0.05 m in size, but they are contained in larger saliva particles. Bacteria are typically 1 m in size or somewhat larger. The saliva particles and bacteria form an aerosol in the air. When a person emits breath by coughing, sneezing, and the like, the virus-containing aerosol particles are emitted into the air, where they evaporate rather easily, such as in about 1 s, to yield smaller droplet nuclei of about 1 m that carry the virus particles [8,9,10]. Animals may also produce such virus-containing droplet nuclei, as well as droplets containing bacteria. The problem with droplet nuclei is that the infectious viruses contained in them may float for quite a long time over quite some distance, thereby increasing the risk for transmission of the disease associated with them.
For instance, it can be shown that, under the influence of gravity, SARS-CoV-2-containing droplet nuclei of about 1 m will fall in the air for only about 10 cm after 1 h of floating. Larger particles do not have this problem, and particles of, e.g., 10 m in size will fall in the air at least a hundred times faster. When the virus-containing droplets eventually fall onto floors or surfaces, they may remain infectious if people touch the contaminated surfaces and then their eyes, nose, or mouth with unwashed hands.
Airborne transmission of lower-size aerosols occurs particularly in crowded and less-ventilated indoor spaces [3], which are particularly effective for transmitting viruses, such as in restaurants, nightclubs, public transport, and gatherings such as funerals. Transmission can also occur in a healthcare setting, as certain medical procedures performed on COVID-19 patients generate aerosols. It would be highly desirable to be able to prevent viruses from spreading, particularly in such potentially crowded and less-ventilated indoor spaces.
The aim of this article is to assess methods of separating and disinfecting contagious aerosols containing viruses, particularly the SARS-COVID-2 virus. First, we determine the probability distributions of numbers of droplet nuclei and the distributions of those that can cause infection as a function of their diameter in Section 2 and Section 3. The distributions are subsequently used to evaluate the performance of risk mitigation methods in Section 4. Conclusions are presented in Section 5.
2. Probability Density Function of Airborne Droplet Nuclei
The generation of a large number of aerosol droplets through coughing, sneezing, speaking, and breathing has been documented for a long time [4,5,6,7,8,9,10]. The droplets are created within the respiratory tract due to disruption of saliva by abrupt changes in the airflow. The front of the mouth is the site of narrowing and the most important site for atomization, with the larynx as second site [7]. The published sizes of these aerosols range from sub-micron sizes to >100 m, and these can be continuous [8], bi-modal [11], and tri-modal [12]. Care must be taken with these results, however, as the conditions, instruments, and methods differ [13].
When studying bioaerosols generated by human subjects, it is important to distinguish between the initial diameter of particles and the diameter after evaporation of water in ambient air; the resulting desiccated particles are termed “droplet nuclei” in the medical literature. Droplet evaporation is a combination of heat and mass transfer between droplets and their surroundings [14]
We estimated the evaporation time by assuming:
- initial droplet temperature C;
- zero temperature gradient inside the droplet;
- creeping flow around the droplet (Stokes regime).
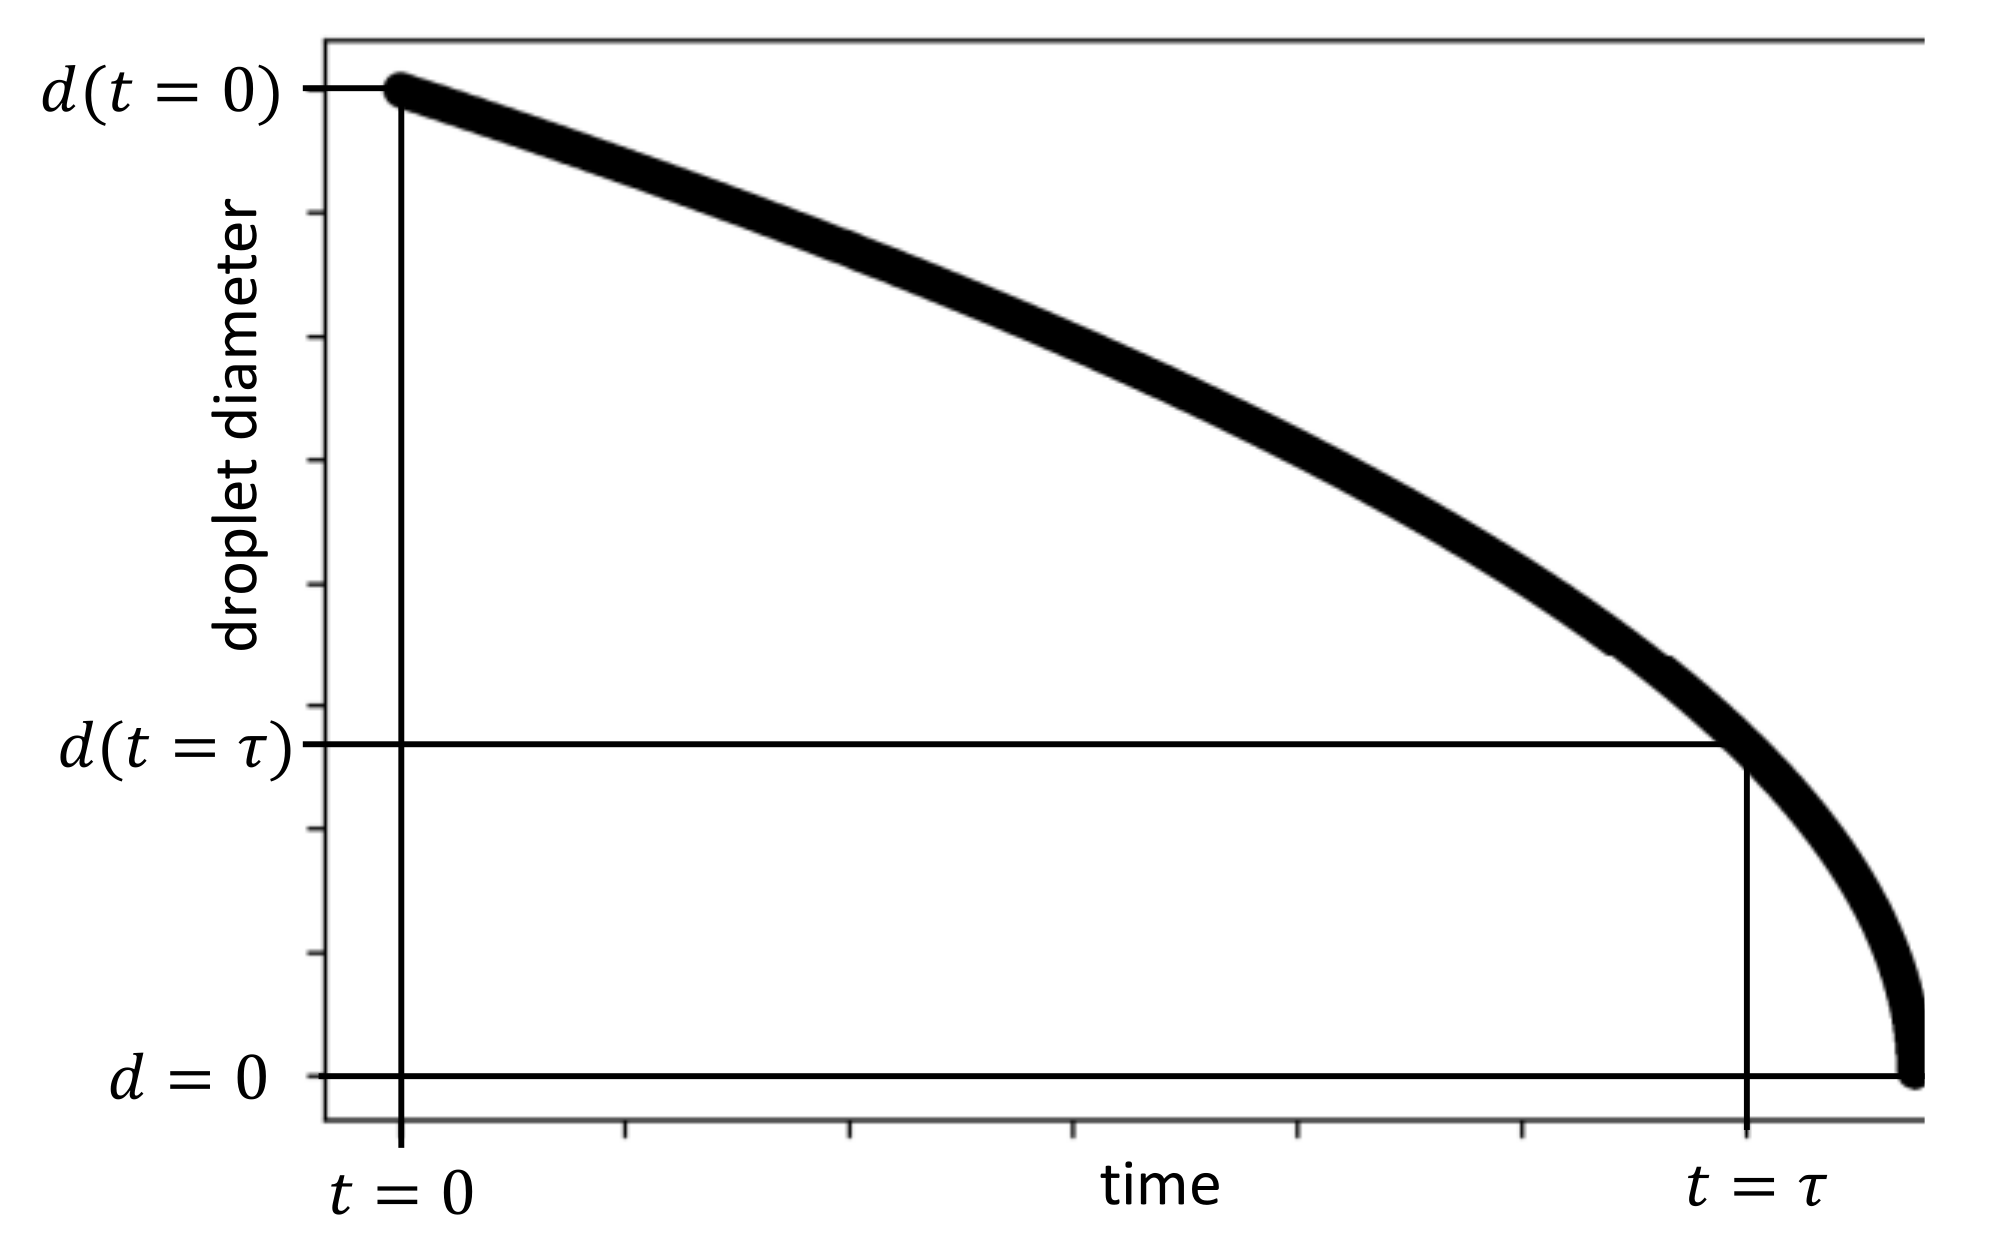
The physical properties of water and humid air were taken from the Coolprop C++ library [15]. The time constant for evaporation is defined by (see Figure 1):
For particles with a diameter <25 m, the water is evaporated within seconds, even for high values of relative humidity; see Figure 2. These results conform with those of more detailed models [16,17].
The amount by which a droplet shrinks upon dehydration depends on the fraction of nonvolatile matter in the oral fluid, which includes electrolytes, sugars, enzymes, DNA, and remnants of dehydrated epithelial and white blood cells [18,19]. As described in [19], whereas pure saliva contains 99.5% water when exiting the salivary glands, the weight fraction of nonvolatile matter in oral fluid falls in the 1 to 5% range. Presumably, this wide range results from differential degrees of dehydration of the oral cavity during normal breathing and speaking and from decreased salivary gland activity with age [19]. Given a nonvolatile weight fraction in the 1 to 5% range and an assumed density of 1.3 g/mL for that fraction, dehydration causes the diameter of an emitted droplet to be reduced in size by a factor of 3–5; see Table 1. As smaller particles are more likely to remain airborne, we use a conservative value of 5 for the shrinkage in the diameter of the emitted droplets.
The settling velocity of the resulting droplet nuclei in still air can be calculated by using the Stokes law [21]:
wherein denotes the density, g denotes the gravitational acceleration, d denotes the diameter, and denotes the dynamic viscosity. The indices p and a denote the droplet nuclei and ambient air, respectively. The settling velocity for water as a function of the droplet diameter in still air is given in Figure 3. Only droplets with a diameter smaller than 20 m and with a settling velocity lower than 1 cm/s have a chance of remaining airborne.
Amongst others, the authors of [9,10,20] investigated the size of droplet nuclei after the evaporation of water; see Figure 4. The emissions from sneezing, coughing, and speaking were investigated. Although the particle number concentration varies for the different modes, the particle number probability density function of the droplet nuclei is similar and follows a log-normal [21] probability density function:
with a mean of around m and a geometric standard deviation of approximately .
In time, the droplet size may increase due to coagulation. Coagulation is the process whereby aerosol particles collide with one another due to the relative motion between them and adhere to form larger particles [21]. When the relative motion is Brownian, the process is called thermal coagulation. For monodisperse thermal coagulation, we can derive that the change in particle number concentration N is:
where K is the coagulation constant:
The Stokes–Einstein equation for the aerosol particle diffusion coefficient is
where k denotes the Boltzmann constant, T is the absolute temperature, and is the dynamic viscosity. The Cunningham slip correction factor for accounting for deviations from the continuum when calculating the drag of aerosols is:
For air at ambient conditions and a droplet-nucleus diameter of 1 m, we calculate a coagulation constant of m s. We can determine the particle number concentration as a function of time by integrating Equation (6), assuming K to be constant. The results are shown in Figure 5. It is expected that for droplet nuclei exhaled by humans, coagulation is not significant in normally ventilated rooms.
In summary, we conclude that the probability density function of the numbers of airborne droplet nuclei produced by human exhalation is adequately represented by a log-normal distribution with a mean diameter of m and a geometric standard deviation of . Droplet nuclei with a final size m, equivalent to an original droplet size of >m, drop out of the air and are deposited on available surfaces.
3. Probability Density Distribution of Numbers of Droplet Nuclei That Can Infect
Having specified the density distribution of droplet nuclei, the question arises of how many of these droplets contain virus particles and can cause a risk of infection. A widely used tool for quantifying the airborne infection risk is the Wells–Riley model [22,23,24]. It is assumed that there exists a critical dose of bacteria or viruses for which the probability of infection is 63%. The critical dose has to be established through epidemiological research. Subsequently, standard Poisson statistics are used to determine when a person has inhaled this critical dose.
In the vast majority of pathosystems, however, it is unknown how many individual pathogens cause an infection in a host organism. The independent action hypothesis [25] states that each individual pathogen has a non-zero probability of causing host death and that individual pathogens act independently. For viruses, there is no framework for predicting how many virus particles have caused an infection. On the other hand, there is ample experimental evidence that the number of virus particles causing infection can be small for hosts that are highly susceptible [26]. As a conservative approach, we adopt the independent action hypothesis in this work, i.e., even one virus in a droplet nucleus may cause infection of the host.
So far, we have established that pathogens can occur in droplet nuclei with aerodynamic diameters down to their smallest dimensions. What remains is establishing the viral load emitted by a person as a function of the particle probability density function.
The front of the mouth is a site of narrowing and the most important site for atomization, with the larynx as the second site [7]. The concentration of virus particles in the front of the mouth is representative of the concentration in the droplets emitted during the expiratory activities. It is proposed that the droplets emitted by an infected subject have the same viral load , expressed as virus particles per unit volume, as that in the front of the mouth [23]. If we further assume that all of the pathogens that are originally present in the evaporating droplets survive, the viral load is related to the volume of the final droplet nucleus. For our calculations, we use SARS-CoV-2 (COVID-19) as a representative of very small pathogens.
The reported average concentration of SARS-CoV-2 particles in the mouth varies from to virus particles per milliliter, with extremes between and mL [27,28,29,30,31,32]. The Dutch National Institute for Public Health and the Environment (RIVM) [30] fitted the data of Zou et al. [31] and their own data to a normalized log-normal probability density function; see Figure 6. The observed shift towards higher concentrations of the RIVM data was confirmed by another Dutch study (Kampen et al. [32]). To assess the effectiveness of infection risk mitigation measures, we adopt the log-normal probability density function based on the RIVM data in this study. The characteristics of this function are given in Table 2. A cumulative distribution of means that 50% of the patients have a higher concentration and 50% have a lower concentration of virus particles. The mean virus particle concentration is found at this value. To assess the effects of risk mitigation measures, we also use the concentrations at and .
Now, consider a volume V of fluid in the mouth containing N virus particles. The volume V is expelled into a large number of aerosols, with each aerosol having a volume containing n point-like virus particles; see Figure 7. The probability of finding a virus particle within an aerosol is , while the probability of finding it in a volume is [33]. If the particles can be distinguished from each other, the probability of finding any one configuration would be equal to the product of the respective probabilities, . As the virus particles are identical to each other, this number is multiplied by the number of possibilities of choosing n particles within a total of N identical particles, obtaining:
This is a binomial distribution that expresses the probability of finding n virus particles in the droplet volume v and the remaining virus particles in the total volume of the other expelled droplets .
The volume of liquid V in the mouth from which aerosols are generated can be assumed to be large in comparison with the volume v of the individual aerosols. Under these circumstances, the binomial distribution can be approximated with the Poisson distribution (Larsen [34]). With a relative error of , one can show:
In accordance with the independent action hypothesis, we conservatively assume that just one virus in a nucleus is already sufficient to cause the infection of a host. That is, all cases with lead to infection. The probability of this happening is given by
Noting that in accordance with the analysis of the previous section, the diameter of the original aerosol emitted from the mouth is five times the diameter of the resulting droplet nucleus, we have
where, as before, is the diameter of the droplet nucleus. The distribution now becomes
where is the droplet diameter divided by its mean diameter :
and
is the number of virus particles in a droplet nucleus of mean diameter . From solution (14), it is seen that grows from 0 as goes to 1 as . As we found that m, the value of is equal to , , or for the values of from Table 2 of , , and m, respectively. A small value of implies that the value of gets a value that is appreciably larger than zero for only relatively large values of ; more precisely, for the values of or . For the quoted values of and , this implies values of of about 27, 5.4, and 2.7 m, respectively. In summary, the nuclei corresponding to the left-hand side of the probability density distribution of the nuclei have a lower chance of infecting. This feature is illustrated in Figure 8, where the probability density distribution of numbers of nuclei that can infect versus their diameter is shown for the quoted values of virus particles in the mouth liquid. This probability density is defined by the original density of droplet nuclei—cf. Equation (5)—multiplied by the probability of having at least one virus in the droplet nucleus, according to Equation (14). This is given by
where
is a normalization constant that ensures that the surface underneath the distribution is unity. With increasing viral concentration, the small droplet nuclei pick up more virus particles so that the most probable value of the density distribution shifts to lower values of the nucleus diameters; see Figure 8. This feature was already noticed in 1946 by Duguid [20].
4. Methods of Risk Reduction
An effective way to remove infectious aerosols from indoor air is to ventilate with clean air from outside. Denoting ventilation flow by and the volume of the room or space that is ventilated by , the decrease in the number of particles inside the space or room as a function of time t can be described by the ordinary differential equation
where is the number of droplet nuclei of diameter containing at least one virus particle per unit volume of air. The initial condition imposed on the differential equation is:
where is the initial value of the total number of droplet nuclei with at least one virus particle per unit volume of air and is the particle number distribution of these nuclei as a function of diameter. The initial particle number distribution is assumed to correspond to that generated by an infected person or persons and is given by Equation (17). Spatial variations in the numbers of droplet nuclei inside the room that is ventilated have been disregarded. Such variations will depend on, among other things, the positions of particle sources and of inlets and outlets of vent air [35]. Studying their effects is beyond the scope of the present analysis. The aim is to define a case based on clean air that can be used as a reference to determine the effectiveness of removing infectious particles with filtering methods.
Noting that the integral of taken over all diameters of droplet nuclei with at least one virus particle is unity, the solution of Equation (19) for the total number of droplet nuclei with at least one virus particle divided by the initial total number is
where
is the time needed to replace the air in the room with clean outside air once. The inverse of is known as air changes per hour (ACH) [36]. A typical value for in residential buildings is 15 to 30 min. The concentration will then have been reduced by exp(-2) to exp(-4), that is, by a factor of 1/7 to 1/55 in one hour.
4.1. Filtering with Porous Media
For cases where ventilation with clean outside air is not feasible or insufficient, filtering of inside air is an option. A common configuration is a fan that generates flow through a filter comprising a porous medium within which particles are entrapped. The previous formulation for ventilation with outside air can be directly extended to one where the air is filtered by replacing with :
In this case, is the flow through the filter device and is the collection efficiency of the filter, i.e., the number of particles at an inlet of a given diameter minus the number at an outlet of the same diameter divided by the number at the inlet of the same diameter. In general, the collection efficiency will vary with the particle diameter. Overall efficiency follows from the relation
where E is the collection efficiency of all particles distributed according to . Filter media that are used in practice, such as high-efficiency particle filters (HEPA), will collect almost all particles with diameters as small as 0.1 m and even smaller [37]. This implies that nuclei that can infect will be collected with almost 100% efficiency; . A filter device with flow will be as good as ventilation with the flow of clean outside air of the same size. Solution (21) also holds for the filter with flow . If a porous filter medium with a lower efficiency is applied, e.g., with about 95% efficiency, this can be compensated by only 5% extra flow through the device to achieve equivalence in particle number reduction performance, assuming that the collection efficiency is the same for all diameters of nuclei.
Filter media are widely used in indoor air filtering, from centralized air treatment in multi-story buildings to stand-alone in-house air cleaners; Figure 9. What undoubtedly contributes to their popularity is their simplicity in design. What is not always recognized is their drawback: With time, they become clogged, and the pressure drop over the filter medium increases. For a given ventilator characteristic, the filter flow decreases and, as directly follows from the previous formulae, the performance in concentration reduction drops. In practice, this feature often remains unnoticed until the point where the flow has dropped to almost nothing. To keep performance deterioration to a minimum, filter media must be replaced at regular intervals. Replacement is not risk-free because potentially large numbers of infectious particles are assembled inside the filter media. Furthermore, filter media contain non-recyclable components and can suffer from re-emission and degassing of the deposited particles. These disadvantages can be minimized by combining filter media with a rotational particle separator; see Section 4.3.
4.2. Centrifugal Separation
Clogging and increased reduction of flow with time are absent in centrifugal separation. The main types of centrifugal separators are the vane separator, the cyclone, and the rotational particle separator (RPS); Figure 10 [38]. These three methods are the most well known from applications in industry. The cyclone separator was introduced in the domestic market as a vacuum cleaner by Dyson [39]. A compelling argument is that the consumer no longer needs filter bags. They reduce the suction power over time and have to be regularly replaced. The RPS was invented in 1987 [40] and was followed by a number of spin-offs, the last of which was patented in May 2021 [41].
The basis of centrifugal separation is that, in the case of flow of a gas that makes a curve with heavier particles inside it, particles will be directed away from the gas stream lines because of the action of the centrifugal force. The separation is completed through the arrival of the particles at a collecting wall. The formulae that enable the calculation of the separation performance of the three methods are presented in Figure 10.
The separation performance of a centrifugal separator can, in general, be summarized with a single function of the separation efficiency versus particle diameter made non-dimensionless by ; see Figure 11. The parameter corresponds to the particle diameter for which all particles with a larger diameter have a collection efficiency larger than 50%. The value of is determined by the design parameters of the centrifugal separator (Figure 10).
The overall collection efficiency of droplet nuclei with at least one virus particle follows from relation (24). Here, the value of the integral will depend on the value of . The result is shown in Figure 12 for the case of the separation of droplet nuclei that can infect according to Equation (17). The calculations are based on the theoretical separation curve in Figure 11.
Apart from separation performance, practical designs are dictated by requirements on size and energy consumption. For the vane separator and cyclone, the values of are typically 10 m and larger and 4 m and larger, respectively. As seen from Figure 12, this makes them unsuited for nucleus separation. Practical versions of the RPS, on the other hand, have values of of around 0.3 m and larger. They enable the separation of particles down into the sub-micron range. The separation performance has been tested for a variety of RPS designs that were subjected to different kinds of particle loads; Figure 11. The results were published in a number of papers that were reviewed in [38]. The measured separations were consistently found to correspond to theoretical predictions based on solutions of the classical laws of mechanics. They can be represented by the curve in Figure 11. The RPS technology is a candidate for effective separation of droplet nuclei.
4.3. Rotational Particle Separator (RPS)
As follows from Figure 12, the efficiency of the removal of almost 100% of viruses was obtained for the design values of of 1 m and less. Such design values of are common for practical RPS designs; Table 3.
It should be noted, however, that the separation degrees shown in Figure 12 apply to the initial situation, where the distribution of droplet nuclei versus the diameter of those that can infect corresponds to the values given by the initial condition (20). With time, the larger nuclei will first be removed. The smaller ones, however, are subjected to lower filter efficiency and take more time to be filtered. To deal with this situation, we need to solve Equation (19) with replaced by and noting that varies with the nucleus diameter. One obtains
In Figure 13, the rate of decrease in the number of nuclei that can infect versus time has been shown for various cases. The reference is the decrease in the case of ventilation with clean outside air. It is seen that with time, the rate of decrease in the case of RPS is reduced. With time, the larger nuclei that are collected with 100% efficiency are directly taken out of the air after passing through the RPS. The very small ones, whose particle number concentration is small, need to pass through the RPS several times in order to be removed completely. In the case of an RPS with , the reduction rate starts to deteriorate when the numbers of nuclei have reached a value of about 10 times the concentration at the start. The deterioration of the removal rate can be delayed by applying a lower value of . For example, in the case of an RPS with m, the rate of reduction starts to deteriorate when the numbers of nuclei have reached a value of about 10 times the concentration at the start. The deterioration can be eliminated altogether by introducing a HEPA filter at the outlet of the RPS. Consider, for example, an RPS with =1 m. It will remove about 95% of all particles that can infect right from the start, as well as all other airborne particles in the room. In this case, the HEPA filter is subjected to a minimal load of about 2% of the volume of all particles that are not collected by the RPS. The service life of the HEPA filter will be practically two orders of magnitude longer compared to that without the RPS.
4.4. RPS with Liquid Flushing
The separation by the RPS described in the previous section bears the risk of re-entrainment of particles collected at the radially outward sides of the separation channels. This risk is particularly present in periods in which the rotation rate is reduced, whereby the centrifugal force that presses the particles to the walls fades. Moreover, the de-gassing of the particles can cause the emission of unwanted components into the filtered air. The way out is to apply liquid flushing, a technique that has been tested and applied in de-misting versions of the RPS [38] and the more recently conceived rotating absorber device [41].
Liquid is sprayed at the top of the vertically positioned rotating channel structure. The liquid enters the channels and, due to the centrifugal force, quickly forms a liquid film at the outer walls. It flows downwards as a thin film. Particles entrained in the gas are centrifugated to the outer sides of the channel walls, as described in a quantitative manner in the previous section. Here, they enter the liquid film and flow with the liquid to the bottom of the rotating channel structure; Figure 14. Liquid leaves the channels at the bottom as large droplets that contain the particles are propelled to a radially positioned collection chamber. The liquid collection chamber is of a limited volume—a few liters in total—and serves as a reservoir whose content is re-injected at the top.
The pressure drop and separation performance of the RPS supplemented with liquid flushing remain constant over time. The liquid needs to be replaced only after relatively long periods of time, which can be up to a year. Moreover, the liquid preferably consists of disinfecting components that immediately kill all viruses and bacteria. The RPS technology consists of recyclable components and fits into modern circular economics. The combination of the RPS with liquid flushing and the possible supplementation with a HEPA filter positioned at the gas outlet of the device offers particle separation performance that is equal to that of clean air ventilation.
5. Conclusions
The size of aerosols emitted from the mucus of humans by coughing, sneezing, singing, speaking, etc. has been measured and documented extensively. Due to evaporation shortly after emission, the aerosols are reduced in diameter, on average, by a factor of 3 to 5. The resulting diameter distributions of the droplet nuclei can be captured with a log-normal distribution with a mean diameter of 1m and a geometric standard deviation of 2.
Given a uniform random distribution of virus particles in the mucus, the probability of finding one or more virus particles in an aerosol or nucleus can be described by a Poisson distribution. For common viral concentrations in the mucus, only larger-sized nuclei contain at least one virus particle. The diameter above which one or more virus particles are present decreases with the viral concentration. Combining the probability of having one or more virus particles with the probability density of the droplet nuclei yields the distribution of numbers of droplet nuclei that contain at least one virus particle as a function of the nucleus diameter. The parameter in these distributions is the viral concentration in the mucus, for which the latest data of RIVM were used.
To assess the effectiveness of indoor aerosol removal methods, ventilation with clean outside air was used as a reference. Well-designed filters based on porous media, such as HEPA, remove almost all potentially infectious particles. The drawback is that, with time, the filter media become saturated and clogged. The pressure drop increases, and the flow through the filter device becomes less and less. The rate by which the number of particles in the room that can infect are reduced deteriorates. The filter media have to be regularly replaced and disposed of as hazardous chemical waste.
Filter bags are absent in the case of separation devices based on centrifugal methods. The flow through the devices remains constant, as there is no increase in the pressure drop with time. From the options of centrifugal methods based on vane-type separators, cyclones, and rotational particle separators (RPSs), only an RPS is capable of removing particles with diameters going into the sub-micron range typical of droplet nuclei that contain virus particles with sufficient efficiency. In an RPS, the flow through the device remains undisturbed. All particles that are collected are continuously removed by flushing with a liquid, which is then recirculated. By applying a disinfecting liquid, all virus particles are killed directly after being collected inside the channels of the device. The device remains virus-free, and its components are based on sustainable technology.
The collection efficiency of the RPS drops below 100% for nuclei with diameters that are substantially less than 1m. The result is that when performing filtering in a room, the nuclei with very small sub-micron diameters need to be recirculated several times before being removed from the contaminated air in the room to a sufficient degree. The particle number concentration of these very small sub-micron-size nuclei is low, but their presence leads to a slower rate of nucleus reduction after some time of filtering, i.e., when the concentration has reached a level of 10 to 10 times the concentration at the start of filtering. To prevent this from happening, an HEPA filter can be installed at the gas outlet of the RPS. This ensures a constant rate of reduction of all potentially infectious nuclei, which is equal to that of ventilation with clean outside air at an equal air flow. The time until the replacement of the HEPA filter can be almost two orders of magnitude longer than that of HEPA as a stand-alone filter.
Particle separation with an RPS and HEPA, liquid flushing in the RPS and disinfection by liquids are established methods of practice. The effective elimination of contagious aerosols in rooms will be demonstrated in the future.
Funding
This research received no external funding.
Data Availability Statement
Not applicable.
Acknowledgments
Conflicts of Interest
The authors declare no conflict of interest.
References
- Wikipedia. Coronavirus Diseases. Available online: https://en.wikipedia.org/wiki/Coronavirus_diseases (accessed on 1 August 2021).
- Wikipedia. COVID-19. Available online: https://en.wikipedia.org/wiki/COVID-19 (accessed on 1 August 2021).
- Qian, H.; Miao, T.; Liu, L.; Zheng, X.; Luo, D.; Li, Y. Indoor transmission of SARS-CoV-2. Indoor Air 2021, 31, 639–645. [Google Scholar] [CrossRef] [PubMed]
- Hutchison, R.F. Die verbreitung von keimen durch gewöhnliche luftströme. Z. FÜR Hyg. Und Infekt. 1901, 36, 233. [Google Scholar] [CrossRef]
- Wells, W.F. On air-borne infection. Study II. Droplets and droplet nuclei. Am. J. Hyg. 1934, 20, 611–618. [Google Scholar]
- Tellier, R. Aerosol transmission of influenza A virus: A review of new studies. J. R. Soc. Interface 2009, 6, 783–790. [Google Scholar] [CrossRef] [PubMed] [Green Version]
- Johnson, G.R. Modality of human expired aerosol size distributions. J. Aerosol Sci. 2011, 42, 839–851. [Google Scholar] [CrossRef]
- Han, Z.; Weng, W.; Huang, Q. Characterizations of particle size distribution of the droplets exhaled by sneeze. J. R. Soc. Interface 2013, 9, 2013056. [Google Scholar] [CrossRef] [PubMed]
- Morawska, L. Size distribution and sites of origin of droplets expelled from the human respiratory tract during expiratory activities. J. Aerosol Sci. 2009, 40, 256–269. [Google Scholar] [CrossRef] [Green Version]
- Assadi, S. Aerosol emission and superemission during human speech increase with voice loudness. Sci. Rep. 2019, 9, 2348. [Google Scholar] [CrossRef] [Green Version]
- Bao, L.; Gao, H.; Deng, W.; Lv, Q.; Yu, H.; Liu, M.; Yu, P.; Liu, J.; Qu, Y.; Gong, S.; et al. Transmission of severe acute respiratory syndrome coronavirus 2 via close contact and respiratory droplets among human angiotensin-converting enzyme 2 mice. J. Infect. Dis. 2020, 222, 551–555. [Google Scholar] [CrossRef]
- Gralton, J.; Tovey, E.; McLaws, M.L.; Rawlinson, W.D. The role of particle size in aerosolised pathogen transmission: A review. J. Infect. 2011, 62, 1–13. [Google Scholar] [CrossRef]
- Jarvis, M.C. Aerosol transmission of SARS-CoV-2: Physical principles and implications. Front. Public Health 2020, 8, 813. [Google Scholar] [CrossRef]
- Bird, R.B.; Stewart, W.E.; Lightfoot, E.N. Transport Phenomena; John Wiley & Sons: New York, NY, USA, 1960. [Google Scholar]
- Bell, I.; Wronski, J.; Quolin, S. Coolprop C++ Library. Available online: http://coolprop.org/ (accessed on 7 February 2021).
- Liu, F.; Qian, H.; Zheng, X.; Song, J.; Cao, G.; Liu, Z. Evaporation and dispersion of exhaled droplets in stratified environment. In IOP Conference Series: Materials Science and Engineering; IOP Publishing: Bristol, UK, 2019; Volume 609-4, p. 042059. [Google Scholar]
- Basu, S.; Kabi, P.; Chaudhuri, S.; Saha, A. Insights on drying and precipitation dynamics of respiratory droplets from the perspective of COVID-19. Phys. Fluids 2020, 32, 123317. [Google Scholar] [CrossRef]
- Liu, L.; Wei, J.; Li, Y.; Ooi, A. Evaporation and dispersion of respiratory droplets from coughing. Indoor Air 2017, 27, 179–190. [Google Scholar] [CrossRef]
- Stadnytskyi, V.; Bax, C.E.; Bax, A.; Anfinrud, P. The airborne lifetime of small speech droplets and their potential importance in SARS-CoV-2 transmission. Proc. Natl. Acad. Sci. USA 2020, 117, 11875–11877. [Google Scholar] [CrossRef] [PubMed]
- Duguid, J. The size and the duration of air-carriage of respiratory droplets and droplet-nuclei. Epidemiol. Infect. 1946, 44, 471–479. [Google Scholar] [CrossRef] [Green Version]
- Hinds, W.C. Aerosol Technology: Properties, Behavior, and Measurement of Airborne Particles; John Wiley & Sons: Hoboken, NJ, USA, 1999. [Google Scholar]
- Riley, E.; Murphy, G.; Riley, R. Airborne spread of measles in a suburban elementary school. Am. J. Epidemiol. 1978, 107, 421–432. [Google Scholar] [CrossRef]
- Buonanno, G.; Stabile, L.; Morawska, L. Estimation of airborne viral emission: Quanta emission rate of SARS-CoV-2 for infection risk assessment. Environ. Int. 2020, 141, 105794. [Google Scholar] [CrossRef] [PubMed]
- Guo, Y.; Qian, H.; Sun, Z.; Cao, J.; Liu, F.; Luo, X.; Ling, R.; Weschler, L.B.; Mo, J.; Zhang, Y. Assessing and controlling infection risk with Wells-Riley model and spatial flow impact factor (SFIF). Sustain. Cities Soc. 2021, 67, 102719. [Google Scholar] [CrossRef]
- Druett, H. Bacterial invasion. Nature 1952, 170, 288. [Google Scholar] [CrossRef] [PubMed]
- Zwart, M.P. An experimental test of the independent action hypothesis in virus–insect pathosystems. Proc. R. Soc. B Biol. Sci. 2009, 276, 2233–2242. [Google Scholar] [CrossRef] [Green Version]
- Wölfel, R. Virological assessment of hospitalized patients with COVID-2019. Nature 2020, 581, 465–469. [Google Scholar] [CrossRef] [Green Version]
- Fajnzylber, J.; Regan, J.; Coxen, K.; Corry, H.; Wong, C.; Rosenthal, A.; Worrall, D.; Giguel, F.; Piechocka-Trocha, A.; Atyeo, C.; et al. SARS-CoV-2 viral load is associated with increased disease severity and mortality. Nat. Commun. 2020, 11, 1–9. [Google Scholar] [CrossRef] [PubMed]
- Kleiboeker, S.; Cowden, S.; Grantham, J.; Nutt, J.; Tyler, A.; Berg, A.; Altrich, M. SARS-CoV-2 viral load assessment in respiratory samples. J. Clin. Virol. 2020, 129, 104439. [Google Scholar] [CrossRef]
- Schijven, J.F.; Vermeulen, L.C.; Swart, A.; Meijer, A.; Duizer, E.; de Roda Husman, A.M. Exposure assessment for airborne transmission of SARS-CoV-2 via breathing, speaking, coughing and sneezing. medRxiv 2020. [Google Scholar]
- Zou, L.; Ruan, F.; Huang, M.; Liang, L.; Huang, H.; Hong, Z.; Yu, J.; Kang, M.; Song, Y.; Xia, J.; et al. SARS-CoV-2 viral load in upper respiratory specimens of infected patients. N. Engl. J. Med. 2020, 382, 1177–1179. [Google Scholar] [CrossRef]
- Van Kampen, J.J.; van de Vijver, D.A.; Fraaij, P.L.; Haagmans, B.L.; Lamers, M.M.; Okba, N.; van den Akker, J.P.; Endeman, H.; Gommers, D.A.; Cornelissen, J.J.; et al. Duration and key determinants of infectious virus shedding in hospitalized patients with coronavirus disease-2019 (COVID-19). Nat. Commun. 2021, 12, 1–6. [Google Scholar] [CrossRef] [PubMed]
- Mauri, R. Non-Equilibrium Thermodynamics in Multiphase Flows; Springer: Berlin/Heidelberg, Germany, 2012. [Google Scholar]
- Larsen, M.L. Spatial distributions of aerosol particles: Investigation of the Poisson assumption. J. Aerosol Sci. 2007, 38, 807–822. [Google Scholar] [CrossRef] [Green Version]
- Blocken, B.; van Druenen, T.; Ricci, A.; Kang, L.; van Hooff, T.; Qin, P.; Xia, L.; Ruiz, C.A.; Arts, J.; Diepens, J.; et al. Ventilation and air cleaning to limit aerosol particle concentrations in a gym during the COVID-19 pandemic. Build. Environ. 2021, 193, 107659. [Google Scholar] [CrossRef] [PubMed]
- Wikipedia. Ventilation (Architecture). Available online: https://en.wikipedia.org/wiki/Ventilation_(architecture) (accessed on 1 August 2021).
- Wikipedia. HEPA. Available online: https://en.wikipedia.org/wiki/HEPA (accessed on 1 August 2021).
- Van Kemenade, E.; Brouwers, B.; van Benthum, R. Centrifugal separation with emphasis on the rotational particle separator. ChemBioEng Rev. 2014, 1, 262–272. [Google Scholar] [CrossRef] [Green Version]
- Wikipedia. James Dyson. Available online: https://en.wikipedia.org/wiki/James_Dyson (accessed on 27 August 2021).
- Brouwers, J.J.H. Rotational Particle Separator. European Patent EP0286160B1, 12 October 1988. [Google Scholar]
- Brouwers, J.J.H. Rotational Absorber Device and Method for Scrubbing an Absorbate from a Gas. European Patent EP3624923B1, 14 April 2021. [Google Scholar]
Figure 1.
The diameter of an evaporating droplet as a function of time. The time constant is defined at the time at which the droplet is reduced to 0.37 times its original value.
Figure 1.
The diameter of an evaporating droplet as a function of time. The time constant is defined at the time at which the droplet is reduced to 0.37 times its original value.

Figure 2.
Time constant for evaporation as a function of the relative humidity and temperature of the air.
Figure 2.
Time constant for evaporation as a function of the relative humidity and temperature of the air.

Figure 3.
Settling velocity of water droplets in still air as a function of the diameter.

Figure 4.
Probability density function of the droplet nuclei emitted by humans.

Figure 5.
Particle number concentration versus time for simple monodisperse coagulation.

Figure 6.
Probability density function and cumulative distribution as a function of the virus particle concentration . Log-normal distributions, adapted from Zou et al. [31] (green) and RIVM data (black), adapted from Schijven et al. [30]. Blue: adapted from Kampen et al. [32].

Figure 7.
n virus particles in aerosols with volume v inside the total volume of all expelled aerosols V with N randomly dispersed virus particles.
Figure 7.
n virus particles in aerosols with volume v inside the total volume of all expelled aerosols V with N randomly dispersed virus particles.

Figure 8.
Probability density of droplet nuclei (broken line) and probability density of droplet nuclei containing at least one virus particle for and m. Viral concentrations in the mouth liquid: , , and m.
Figure 8.
Probability density of droplet nuclei (broken line) and probability density of droplet nuclei containing at least one virus particle for and m. Viral concentrations in the mouth liquid: , , and m.

Figure 9.
Fan and porous filter medium.

Figure 10.
Centrifugal separation methods.

Figure 11.
Efficiency with which particles are separated versus particle diameter divided by measured for a range of RPS designs that are subjected to different particle loads. The values of of the various designs are indicated between brackets. Next to the measured results is the theoretically derived full line for the RPS. This line represents an approximate description of the efficiency of cyclone- and vane-type separators, reprinted with permission from ref. [38].

Figure 12.
Degree to which particles distributed according to Equation (17) are separated by the centrifugal method as a function of the design parameter for various viral concentrations in the mucus.
Figure 12.
Degree to which particles distributed according to Equation (17) are separated by the centrifugal method as a function of the design parameter for various viral concentrations in the mucus.

Figure 13.
Rate of decrease in the number of nuclei that can infect versus dimensionless time. Comparison of the performance of the RPS with m and m and with clean air ventilation for various concentrations of virus particles in the mucus. The RPS supplemented with HEPA follows the curve of clean air recirculation.

Figure 14.
Liquid flushing in a vertical RPS.


Table 1.
Reduction in the diameter of emitted droplets due to evaporation.
| References | Reduction |
|---|---|
| Duguid (1946) [20] | 3–5 |
| Liu et al. (2017) [18] | 3 |
| Basu et al. (2020) [17] | 3–5 |
| Jarvis (2020) [13] | 4 |
Table 2.
Characteristics of the log-normal probability density function for the virus particle volume concentration in the mouth based on the RIVM data [30].
Table 2.
Characteristics of the log-normal probability density function for the virus particle volume concentration in the mouth based on the RIVM data [30].
| Average concentration | m | ||||
| Geometric standard deviation | 20 | ||||
| Cumulative probability | |||||
| Virus particle concentration | m |
Table 3.
Example of the design of a rotational particle separator.
 | ||
|---|---|---|
| Parameter | Symbol | Example Value |
| Filter flow | 0.1 m/s | |
| Channel diameter | 3 m | |
| Angular velocity | 200 rad/s | |
| Length of cylinder | L | 0.2 m |
| Radius of cylinder | R | 0.15 m |
| Viscosity of air | 1.8 kg/m×s | |
| Density of particles | 10 kg/m | |
| Density of air | 1.3 kg/m | |
| - | 0.92 m | |
| Pressure drop over filter | 180 Pa | |
Publisher’s Note: MDPI stays neutral with regard to jurisdictional claims in published maps and institutional affiliations. |
© 2021 by the author. Licensee MDPI, Basel, Switzerland. This article is an open access article distributed under the terms and conditions of the Creative Commons Attribution (CC BY) license (https://creativecommons.org/licenses/by/4.0/).
Share and Cite
MDPI and ACS Style
Brouwers, J.J.H. Separation and Disinfection of Contagious Aerosols from the Perspective of SARS-CoV-2. Separations 2021, 8, 190. https://doi.org/10.3390/separations8100190
AMA Style
Brouwers JJH. Separation and Disinfection of Contagious Aerosols from the Perspective of SARS-CoV-2. Separations. 2021; 8(10):190. https://doi.org/10.3390/separations8100190
Chicago/Turabian StyleBrouwers, J. J. H. 2021. "Separation and Disinfection of Contagious Aerosols from the Perspective of SARS-CoV-2" Separations 8, no. 10: 190. https://doi.org/10.3390/separations8100190
Note that from the first issue of 2016, this journal uses article numbers instead of page numbers. See further details here.