Article

The Simulation and Optimization of the Tetrafluoroethylene Rectification Process

1
Key Laboratory of Colloid and Interface Chemistry of the Ministry of Education, School of Chemistry and Chemical Engineering, Shandong University, Jinan 250100, China
2
Shandong Dongyue Polymer Material Co., Ltd., Zibo 256401, China
*
Author to whom correspondence should be addressed.
Separations 2024, 11(2), 37; https://doi.org/10.3390/separations11020037
Submission received: 21 December 2023 / Revised: 19 January 2024 / Accepted: 22 January 2024 / Published: 25 January 2024
(This article belongs to the Topic Advances in Chemistry and Chemical Engineering)

Abstract

:
In the R22 (chlorodifuoromethane) steam-cracking process, which is used to produce a TFE (tetrafluoroethylene) monomer, distillation is employed to separate the high-purity TFE monomer from the cracked gas generated during this procedure. Traditionally, this distillation process is carried out using five towers. In this study, the traditional five-tower distillation method was transformed into a four-tower distillation method through the Aspen Plus simulation software, and this process was simulated and optimized. Meanwhile, a double-effect distillation process was designed for the transformed four-tower distillation process. The transformed distillation process not only meets the requirements of 99.999% purity for the TFE monomer and 99.99% purity for R22 recycling, but it also reduces the footprint by eliminating one distillation tower and saves 112.9002 kW of tower load, thus reducing the operating costs. This research provides valuable guidance for practical production.

1. Introduction

TFE is an organic compound that exists as a colorless gas under standard temperature and pressure conditions. It is insoluble in water and is extensively applied in various fields, such as the chemical industry, medicine, and material science, due to its unique chemical and physical properties. Notably, polytetrafluoroethylene (PTFE) is one of the most well known and widely used derivatives of TFE. PTFE is a polymer with exceptional corrosion resistance, extremely low friction coefficients, and excellent insulation properties. It is extensively utilized in the production of seals, bearings, valves, pipes, cable insulation, and other products. Moreover, TFE serves as a vital raw material for manufacturing polyvinylidene fluoride (PVDF), fluoride compounds, and other materials. It is also applied in the production of certain pesticides and pharmaceutical intermediates, like fluoroacetophenone. Therefore, TFE plays a crucial role in chemical production [1,2,3,4]. To ensure the quality of subsequent products, the purity of the monomer TFE must be exceptionally high, making the rectification process of TFE a critical step in the overall production process.
Aspen Plus offers a comprehensive unit operation module that simplifies the construction of chemical processes. For gas/liquid systems, Aspen Plus includes modules such as mixers, separators, flash modules, heat exchangers, reactors, pumps, compressors, distillation units for various types of multistage gas–liquid separation operations (ranging from simple distillation to rigorous simulation), multi-tower fractionation unit system simulations, and rectification modules that simulate both plates and packed towers. Selecting appropriate modules during simulation is crucial, and choosing the correct unit operating modes based on specific objectives ensures accurate simulation results. In the case of TFE rectification, the primary focus is on selecting the rectification tower module. This study primarily employs the DSTWU (simple distillation design) module within the rectification module to determine the minimum reflux ratio, the minimum theoretical plate number, actual plate number, and feed position. The results obtained from the DSTWU regarding the reflux ratio and plate number are then used for rigorous calculation and design optimization using the RadFrac (rigorous multistage separation) model [5,6,7,8,9,10].
The traditional process for producing the TFE monomer via cracking gas and fractionation involves using five distillation towers [11]. However, these five towers occupy large amounts of space and result in high production and equipment costs from industrial production processes. In this study, we aimed to maintain the product purity and yield while reducing the number of towers required by transforming the traditional five-tower distillation process into a four-tower process using the Aspen Plus simulation software. In addition, a double-effect distillation process was designed for the modified four-tower distillation process [12,13,14]. This approach not only reduces the space required, the equipment costs, and energy consumption by eliminating one distillation tower, but it also improves the purity and quality of both the product and the recovered material.

2. Methods

The present study focuses on the R22 thermal cracking process to produce TFE. The cracked gas obtained from the tubular cracking reactor is a mixture of gases. After undergoing various operations, such as water washing and alkaline scrubbing, the cracked gas is used as feedstock for the distillation process [15,16]. The total mass flow rate of the feedstock is 2500 kg/h, and its composition and content are shown in Table 1 [17].
The term “property methods” refers to the collection of methods and models required for simulation calculations. Selecting property methods is a crucial step in determining the accuracy of the simulation results [18]. In Aspen Plus, there are two main categories of property methods: the equation of state (EOS) and activity coefficient (AC) methods. Commonly used EOS models include IDEAL, SRK, and PR equations and extensions. These equations calculate the fugacity, compressibility factor, enthalpy, and other properties based on the EOS. On the other hand, commonly used AC models in Aspen Plus include NRTL, ELECNRTL, WILSON, and SRK. The NRTL and ELECNRTL models can handle polar and non-polar compound mixtures, with the ELECNRTL model being specifically designed for electrolyte-containing systems. As a representative of EOS models, the SRK equation is applicable over a wide range of temperature and pressure conditions but may have limitations for accurately simulating industrial production conditions in the chemical industry, thus affecting simulation accuracy. In the TFE distillation process, the operating pressure of the distillation column is around 1 bar. The term “polarity” refers to the extent of charge separation within a molecule, with greater separation indicating higher polarity. The cracked gas contains substances with electron-withdrawing groups, such as halogens, making them polar non-electrolytes [19,20,21]. Therefore, based on the above considerations, the NRTL model is chosen for process simulation in the distillation section of this flow process.

2.1. Traditional Five-Tower Rectification

The traditional industrial TFE distillation unit typically employs a five-column distillation process. The cracked gas is introduced into the T1 column to separate high and low fractions in this process. The T2 column is responsible for recovering R22, while the T3 column eliminates high boiling matter. The T4 column removes light components, and the T5 column carries out C2F4 rectification [22,23,24]. The traditional five-column rectification process was simulated to achieve a C2F4 purity of 99.999% and an R22 purity of 99.99%. The flow chart is presented in Figure 1, and the parameters of each rectification column are illustrated in Table 2.

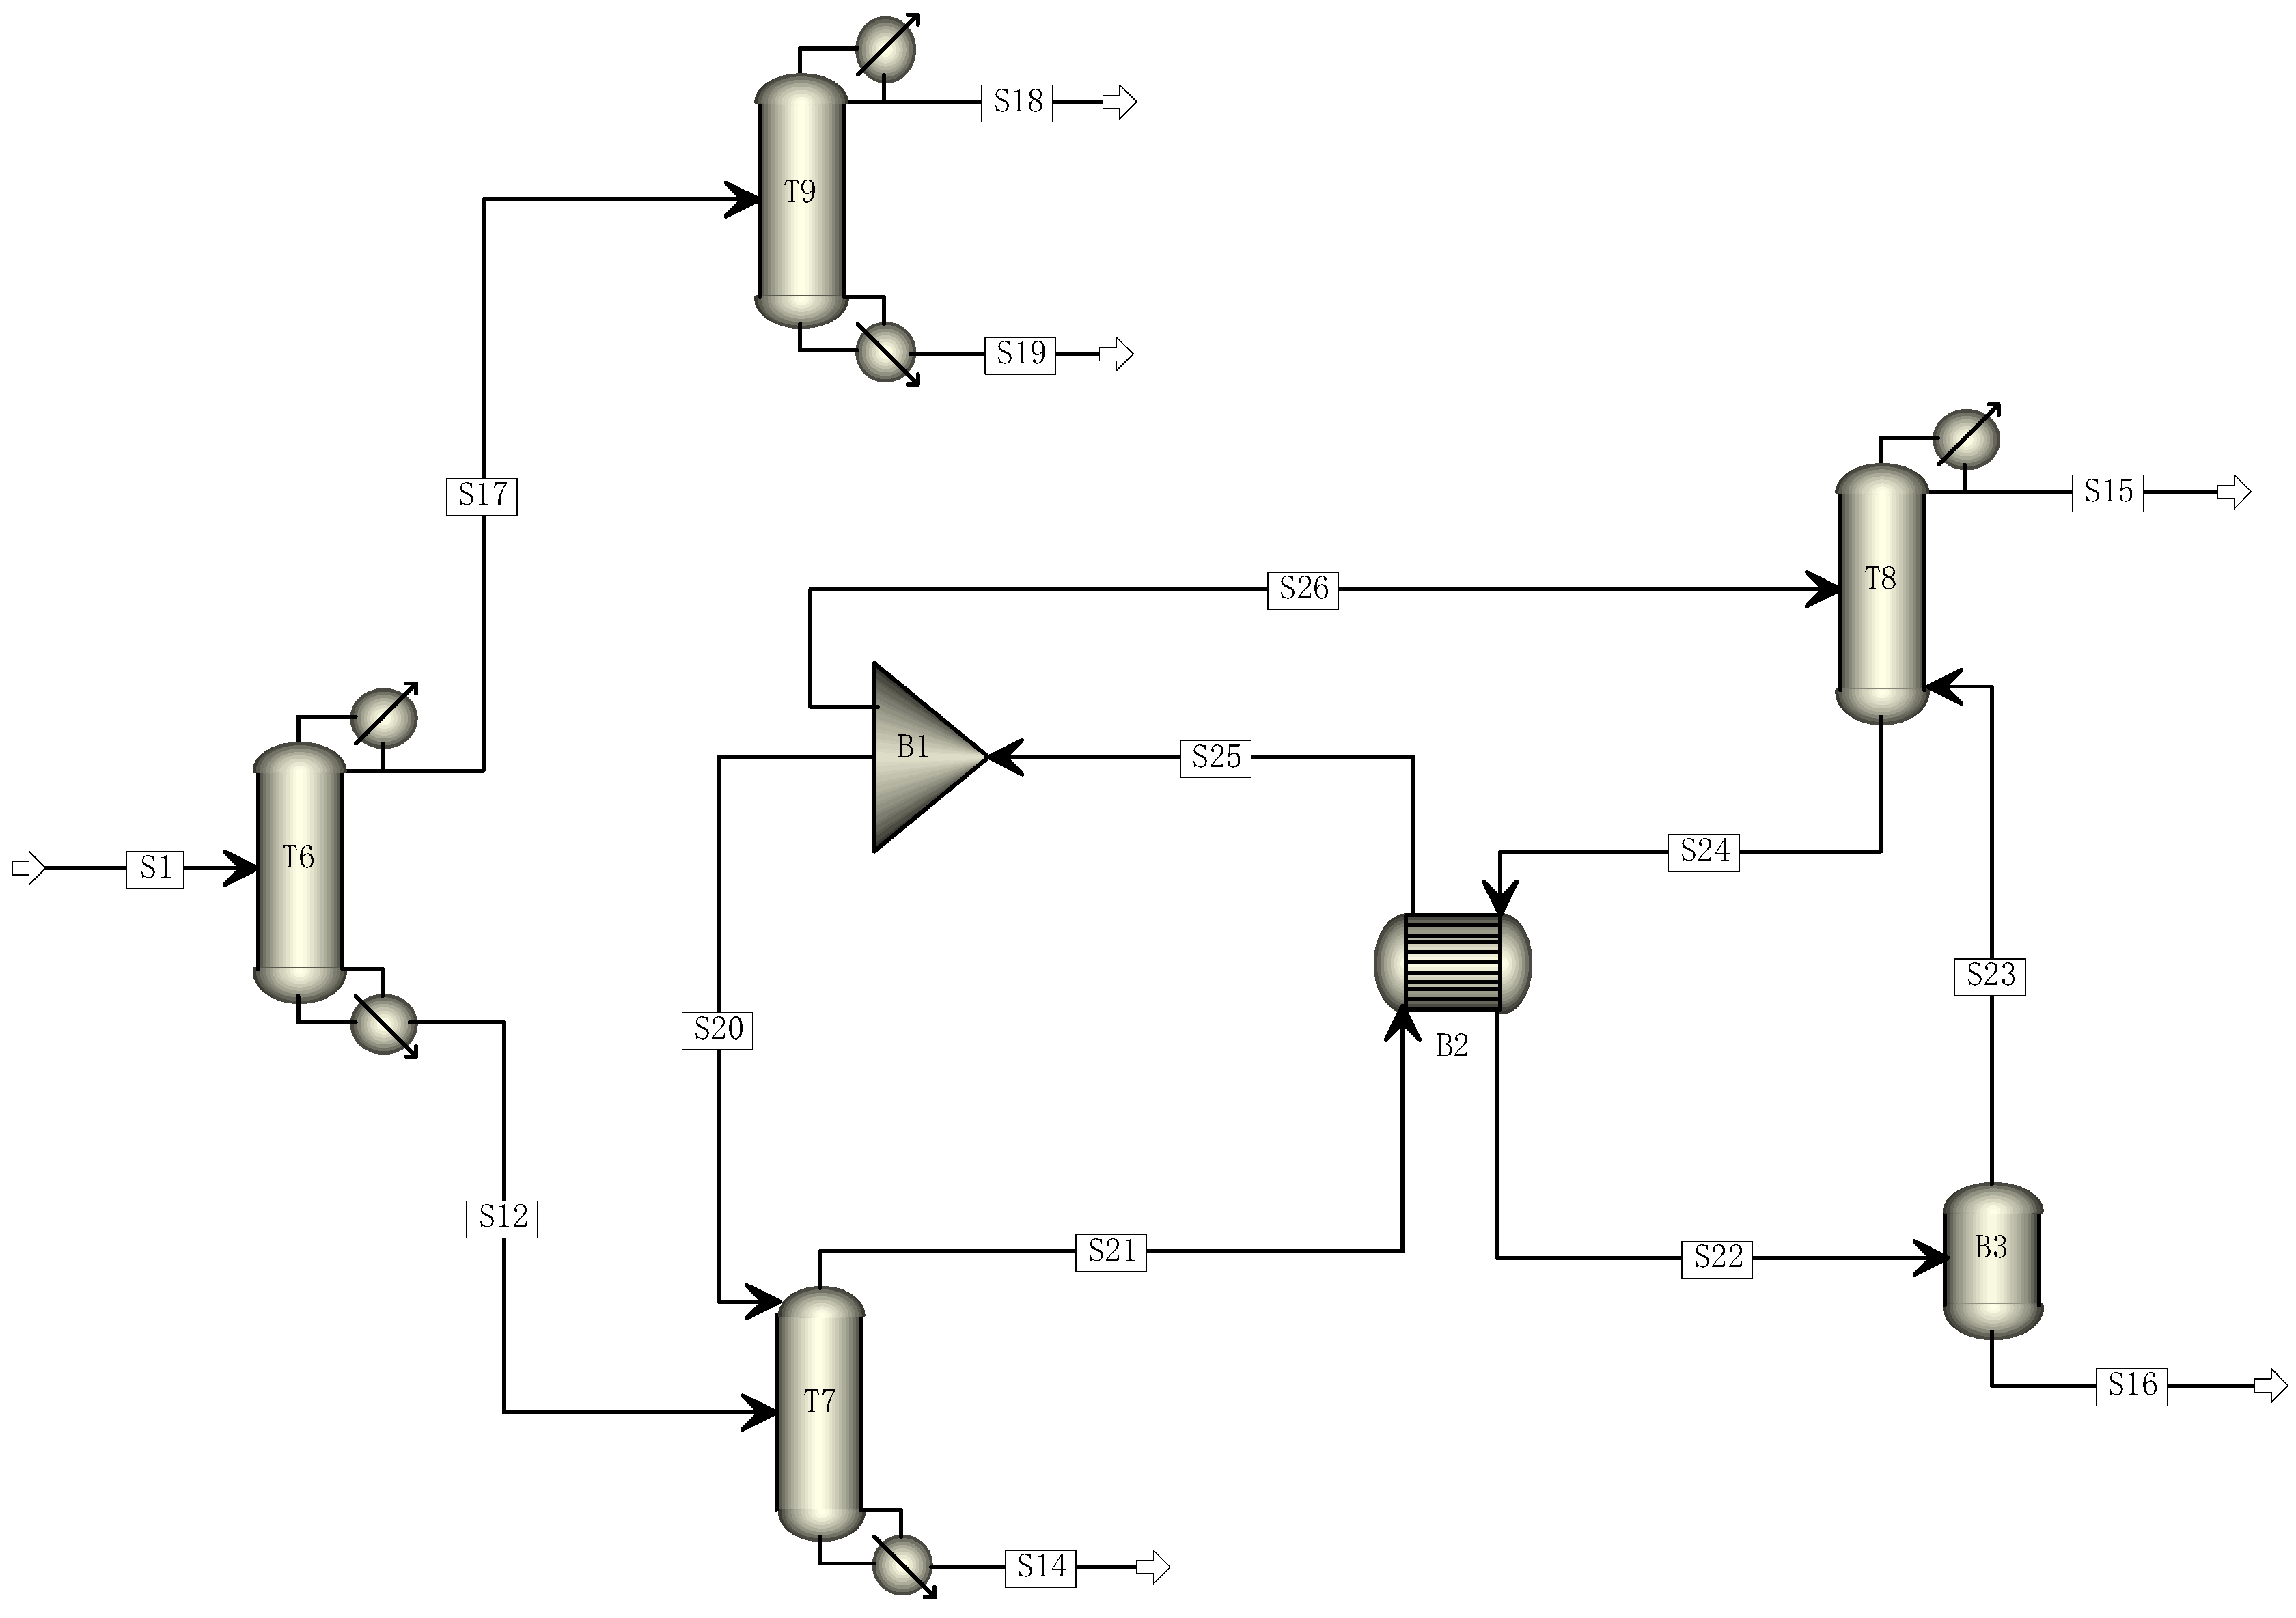
2.2. The Reformed Four-Tower Rectification

Based on the traditional five-tower distillation process, this study aimed to reduce its carbon footprint by transforming it through the elimination of one distillation tower. The cracking gas enters Tower 6, where R22 and C2F4 are separated. C2F4 and light components are directed to Tower 9 from the top of Tower 6, while heavy components are directed to Tower 7 from the bottom. The mixed components containing C2F4 undergo direct distillation in Tower 9 to obtain a pure C2F4 monomer. The components entering Tower 7 undergo distillation, with R22 and light components being obtained at the top and sent to Tower 8 for further distillation to recover R22. The modified four-tower distillation process is illustrated in Figure 2.
Initially, the process was established using the DSTWU model, with a reflux ratio of −1.2; the light and heavy key components of each rectification column are shown in Table 3. By running this process simulation, a series of parameters such as the minimum reflux ratio, actual reflux ratio, minimum number of plates, actual number of plates, and number of feed plates were obtained to establish the RadFrac model [25,26].
The specific operating parameters of the tower equipment in the modified four-column distillation process need to be determined through sensitivity analysis. Sensitivity analysis was conducted to optimize the parameters of the distillation column, such as the theoretical plate number, feed position, reflux ratio, and distillate feed ratio, to obtain the best operating parameters. This analysis allows users to study the influence of changes in input variables on the process output, and the results can be viewed in the sensitivity module folder. The results can also be plotted as a curve to visualize the relationship between different variables. Notably, changes to the process input in the sensitivity module do not affect the simulation, and the sensitivity study is run independently of the underlying condition simulation [27,28,29].

2.2.1. Effect of Theoretical Plates

The theoretical plate number refers to the number of plates required in the rectification column when the gas and liquid phases are assumed to have sufficient contact times to achieve phase equilibrium, and the relationship between the components on the plate conforms to the equilibrium curve. In actual rectification processes, the contact time of two gas–liquid phases on each plate cannot meet this requirement, so the actual plate number must be greater than the theoretical plate number. In production, the number of theoretical plates and the total plate efficiency are generally determined first; then, the actual plate number is calculated.
Figure 3 shows the variation in the content of key light and heavy components in each distillation tower with the theoretical plate number. With the increase in the theoretical plate number, the C2F4 content in Tower 6 remains basically unchanged, while the CH2F2 content first decreases and then stabilizes around 28 plates. Therefore, the theoretical plate number of Tower 6 should be chosen as above 28 plates. For Tower 7, the CHClF2 content first increases and then stabilizes around 32 plates, while the C3F6 content first decreases and then stabilizes around 34 plates. Therefore, the theoretical plate number of Tower 7 should be chosen as above 34 plates. For Tower 8, the CHClF2 content first increases and then stabilizes around 24 plates, while the CH2F2 content first decreases and then stabilizes around 25 plates. Therefore, the theoretical plate number of Tower 8 should be chosen as above 25 plates. For Tower 9, the C2F4 content first increases and then stabilizes around 43 plates, while the C2H2F2 and CHF3 contents gradually decrease and stabilize around 40 and 45 plates, respectively. Therefore, the theoretical plate number of Tower 9 should be chosen as above 45 plates. The above is a sensitivity analysis of the theoretical plate number for the distillation towers.

2.2.2. Effect of Feed Stage

The most suitable feed plate position in the rectification column is the position with the maximum separation capacity, i.e., the position where the maximum separation effect can be obtained under the same theoretical number of plates and operating conditions. This location can be in the middle, top, or bottom of the tower depending on factors such as the tower’s structure, material properties, and separation requirements. For distillation columns, the industrial distillation column feed port is typically located between two trays, so choosing the “Above Stage” when selecting the feed is more realistic.
Figure 4 displays the variation in the light and heavy key component concentrations in each distillation tower with respect to the feed tray number. We observed that, as the theoretical number of trays increases, the C2F4 quantity in Tower 6 remains relatively constant, while the CH2F2 concentration initially decreases and stabilizes for a period, and then gradually increases around tray 29. Therefore, Tower 6 should be fed between trays 20 and 29. In Tower 7, the CHClF2 concentration initially increases and then stabilizes around tray 12, while the C3F6 concentration initially decreases and stabilizes around tray 15. Hence, Tower 7 should be fed above tray 15. For Tower 8, the CHClF2 concentration stabilizes before tray 25 and then exhibits a downward trend, while the CH2F2 concentration remains relatively constant before tray 21 and then increases. Therefore, Tower 8 should be fed between trays 2 and 25. In Tower 9, the C2F4 concentration remains relatively constant before tray 30 and then gradually decreases, while the C2H2F2 and CHF3 concentrations remain relatively constant before tray 27 and then increase. Therefore, Tower 9 should be fed between trays 2 and 25. The above analysis represents the sensitivity of the feed tray number in the distillation towers.

2.2.3. Effect of Distillate to Feed Ratio

The distillate-to-feed ratio is the ratio of the amount of distillate in the feed in a distillation column. The reflux ratio (the flow rate of the distillate divided by the flow rate of the condensed reflux liquid) is specified. When performing dynamic simulations, it is easier to control the product quality at the top and bottom of the column by maintaining a constant distillate-to-feed ratio.
Figure 5 presents the variation in the light and heavy key component concentrations in each distillation tower with respect to the reflux ratio. It can be observed that as the reflux ratio increases, the C2F4 quantity in Tower 6 reaches a maximum at 0.6 and then stabilizes, while the CH2F2 concentration decreases initially and stabilizes after 0.6. Therefore, the reflux ratio for Tower 6 should be set at 0.6 or higher. In Tower 7, the CHClF2 concentration increases initially and then stabilizes after a reflux ratio of 0.9, while the C3F6 concentration remains unchanged until it reaches a reflux ratio of 0.9 and then gradually increases. Hence, the reflux ratio for Tower 7 should be set around 0.9. For Tower 8, the CHClF2 concentration gradually decreases, and the CH2F2 concentration initially decreases and then stabilizes after a reflux ratio of 0.04. Therefore, the reflux ratio for Tower 8 should be set above 0.04. In Tower 9, the C2F4 concentration gradually decreases, especially after a reflux ratio of 0.04, while the C2H2F2 and CHF3 concentrations decrease gradually and stabilize around 0.03. Hence, the reflux ratio for Tower 9 should be set within the range of 0.03–0.04. The above analysis represents the sensitivity of the reflux ratio in the distillation towers.

2.2.4. Effect of Reflux Ratio

In the rectification operation, the ratio of the reflux liquid flow from the top of the rectification tower back to the tower and the product flow from the top of the tower is known as the reflux ratio. The reflux ratio is selected from the minimum reflux ratio to infinity. If the reflux ratio is too large, it will not only increase the consumption of heating steam and cooling water, thereby increasing operating costs, but it will also affect the tower diameter and increase the equipment investment cost. Additionally, changing the reflux ratio during operation is more difficult than changing the tower, and this can greatly reduce the function of regulating the separation ability of the tower. Therefore, selecting the optimal reflux ratio is very important in the design process, both economically and operationally.
Figure 6 illustrates the variation in the light and heavy key component concentrations in each distillation tower with respect to the liquid-to-vapor feed ratio. It can be observed that as the liquid-to-vapor feed ratio increases, the C2F4 quantity in Tower 6 reaches a maximum at 3 and then decreases, while the CH2F2 concentration reaches a minimum at around 4 and then stabilizes. Therefore, the liquid-to-vapor feed ratio for Tower 6 should be set to around 3. In Tower 7, the CHClF2 concentration initially increases and then stabilizes after a liquid-to-vapor feed ratio of 3, while the C3F6 concentration initially decreases and then stabilizes at around a ratio of 3. Hence, the liquid-to-vapor feed ratio for Tower 7 should be set to around 3. For Tower 8, the CHClF2 concentration initially increases and then stabilizes at around a ratio of 35, while the CH2F2 concentration initially decreases and then stabilizes at around a ratio of 40. Therefore, the liquid-to-vapor feed ratio for Tower 8 should be set to above 40. In Tower 9, the C2F4 concentration gradually decreases after a ratio of 60, while the C2H2F2 concentration decreases gradually and stabilizes around a ratio of 25. Hence, the liquid-to-vapor feed ratio for Tower 9 should be set above 60. The above analysis represents the sensitivity of the liquid-to-vapor feed ratio in the distillation towers.

2.2.5. Result of Analysis

The sensitivity analysis of the distillation column was conducted as described above. The analysis results were combined with the simulation results to optimize the parameters of the distillation column. The final parameters for each distillation column in the process are summarized in Table 4.

2.3. Double Effect Distillation

The principle of multi-effect distillation is similar to that of multi-effect evaporation. It involves connecting several distillation towers in a series with a successively reduced pressure. The steam from the top of the first rectification tower is used as the heating medium for the reboiler of the subsequent rectification tower. This process eliminates the need for introducing heating and cooling media from the outside, except for the rectification towers at both ends [30,31,32,33,34]. In the optimized four-tower rectification process simulation, the distillation line recovered by R22 rectification is organized as a series of towers with similar tower loads. Thus, double-effect rectification is considered for the T7 and T8 towers to achieve energy-saving and efficiency improvements [35]. Figure 7 shows the final four-column distillation process after introducing double-effect distillation.

3. Results and Discussion

Material balance is the quantitative calculation of the mass balance of production processes or equipment using the principle of mass conservation. It calculates the quantities and compositions of material streams entering or leaving each unit. The purpose of material balance is to determine the component content entering and leaving each equipment, to serve as a basis for heat balance calculations, to estimate costs, and to provide quantitative data for equipment design and selection. On the other hand, energy balance is a quantitative calculation of the energy balance of production processes or equipment based on the first law of thermodynamics. It calculates the energy that requires supply or removal during the process, which is referred to as energy balance. Energy includes thermal energy, electrical energy, chemical energy, kinetic energy, and radiant energy. In chemical engineering, thermal energy is the most used form of energy, so energy calculations are often referred to as heat calculations.
In this study, the balance calculations focus on individual unit operations, quantifying the quantities and heat changes in substances resulting from various physical and chemical transformations.

3.1. Traditional Five-Tower Rectification

The data for the material balance (Table 5) and energy balance (Table 6) of the final results after simulating the constructed five-tower distillation model are shown in the following tables.
The data in the tables proved that in the simulated conventional five-tower distillation process mentioned above, the purity of the C2F4 monomer is 99.999%, and the mass flow rate of the C2F4 monomer obtained from distillation is 1448.99 kg/h. The recovered R22 purity for recycling is 99.9902% with a mass flow rate of 569.95 kg/h.

3.2. The Reformed Four-Tower Rectification

The data for the material balance(Table 7) and energy balance(Table 8) of the final results after setting and simulating the modified four-tower distillation model according to the analyzed parameters are shown in the following tables.
The data in the table prove that the mass fraction of C2F4 is 99.999% with a mass flow rate of 1548.01 kg/h, and the mass fraction of R22 is 99.99% with a mass flow rate of 751.196 kg/h, which meets the separation requirements.

3.3. Double Effect Distillation

Adding the double-effect distillation process to the modified four-tower distillation process forms the final distillation process. After simulating this process according to the established model, the data for the material balance (Table 9) and energy balance (Table 10) of the final results were obtained, and they are shown in the following tables.
From the table, we observed that the simulated process with double-effect distillation yields a mass fraction of 99.999% for C2F4 with a mass flow rate of 1548.01 kg/h. The mass fraction of R22 is 99.99% with a corresponding mass flow rate of 751.211 kg/h.

3.4. Data Summary

The traditional five-tower distillation, the modified four-tower distillation, and the four-tower distillation with dual-effect distillation processes were compared. The final data for the three processes are summarized in Table 11.
According to the data in Table 11, overall, both C2F4 with a purity of 99.999% and R22 with a purity of 99.99% can be achieved. The mass flow rates of the two substances separated by four-column distillation are higher than those of five-column distillation, but the overall tower load is also higher. After incorporating the double-effect distillation technology into four-column distillation, the overall tower load is lower than that of five-column distillation. Therefore, the final four-column distillation process not only separates higher yields of products but also reduces the overall tower load.

4. Conclusions

The aim of this study was to investigate the tetrafluoroethylene distillation process. The five-column, four-column, and double-effect distillation processes were simulated and optimized using the Aspen Plus software. The resulting distillation process not only meets the requirements for product purity but also exhibits significant improvements compared to traditional distillation processes. The mass flow rate of C2F4 increased by 6.2873%, and the mass flow rate of CHClF2 increased by 22.6577%. Additionally, a reduction of 112.9002 kW in the tower load was achieved. In summary, the improved TFE distillation process, compared to the traditional process, not only ensures the desired separation purity but also reduces the footprint and equipment costs of one tower. Furthermore, it decreases the tower load during the distillation process. Optimizing various operational parameters in the distillation tower effectively enhances the economic and energy efficiency of the actual production process.

Author Contributions

L.Y.: Writing—original draft, Optimization of process simulation, Article content review; Y.C.: Conceptualization, Methodology, The acquisition of data for the work, Article content review; J.W.: Data curation, Investigation, Design and establishment of process simulation, Article content review; Y.L.: Project administration, Supervision, The analysis and interpretation of data for the work, Article content review; P.Z.: Validation, Project administration, The analysis and interpretation of data for the work, Article content review; X.Z.: Writing—review &editing, Article content review. All authors have read and agreed to the published version of the manuscript.

Funding

This research was funded by the National Key Research and Development Program (2022YFB3806902 and 2022YFB3808903).

Data Availability Statement

All data are contained within the article.

Conflicts of Interest

Author Yue Chen, Jinzhi Wang, Yongzhen Luo and Pengfei Zhou were employed by the company Shandong Dongyue Polymer Materials. The remaining authors declare that the research was conducted in the absence of any commercial or financial relationships that could be construed as a potential conflict of interest.

References

  1. Gardiner, J. Fluoropolymers: Origin, production, and industrial and commercial applications. Aust. J. Chem. 2014, 68, 13–22. [Google Scholar] [CrossRef]
  2. Moore, A.L. Fluoroelastomers Handbook: The Definitive User’s Guide and Databook; Taylor & Francis: Abingdon, UK, 2006. [Google Scholar]
  3. Biryulin, Y.S.; Borisov, A.A.; Mailkov, A.E.; Troshin, K.Y.; Khomik, S.V. Explosive characteristics of tetrafluoroethylene. Russ. J. Phys. Chem. B 2014, 8, 165–171. [Google Scholar] [CrossRef]
  4. Wittmann, J.C.; Smith, P. Highly oriented thin films of poly (tetrafluoroethylene) as a substrate for oriented growth of materials. Nature 1991, 352, 414–417. [Google Scholar] [CrossRef]
  5. Aspen Plus®: Chemical Process Simulator; Aspen Technology Inc.: Bedford, MA, USA, 2020.
  6. Elkamel, M.A.; El-Halwagi, A.M.; Al-Sahhaf, K.A. Optimization of a Gas Separation Unit using Aspen Plus. Comput. Chem. Eng. 1999, 23 (Suppl. S2), S503–S506. [Google Scholar]
  7. Vasileiadis, C.; Lymperopoulos, A.; Vamvuka, D. Design and Optimization of a Biomass Energy System using Aspen Plus. Energy Procedia 2017, 139, 219–224. [Google Scholar]
  8. Al-Juboori, A.; Al-Mashhadani, H. Modeling and Simulation of an Ethylene Production Plant using Aspen Plus. J. Pet. Sci. Eng. 2019, 173, 1185–1194. [Google Scholar]
  9. Kadam, K.; Neumann, M.J. Dynamic Model Development of a Chemical Reaction System using Aspen Dynamics. AIChE J. 2009, 55, 2283–2295. [Google Scholar]
  10. Bush, M.J.; Pulido, J.; Johnson, A.I.; Svrcek, W.Y. A modular approach to distillation column simulation. Comput. Chem. Eng. 1978, 2, 161–167. [Google Scholar] [CrossRef]
  11. Simon, C.M.; Kaminsky, W. Chemical recycling of polytetrafluoroethylene by pyrolysis. Polym. Degrad. Stab. 1998, 62, 1–7. [Google Scholar] [CrossRef]
  12. Aristovich, V.Y.; Aristovich, Y.V.; Sokolov, A.Y.; Fulmer, J.W.; Krishnan, C.; Ramani, M.V.; Tatake, P. Novel energy-saving method of rectification. Chem. Eng. Commun. 2004, 191, 844–859. [Google Scholar] [CrossRef]
  13. Chen, Z.Y. Improvement of Simulation Method for Propylene Distillation Column based on Aspen Plus. Int. Core J. Eng. 2021, 7, 141–146. [Google Scholar]
  14. Bakar, N.A. A Modeling, Optimizing and Control Analysis of a Debutanizer Column Using Aspen Plus and Aspen Dynamic. Doctoral Dissertation, Murdoch University, Perth, Australia, 2017. [Google Scholar]
  15. Hercules, D.A.; Parrish, C.A.; Sayler, T.S.; Tice, K.T.; Williams, S.M.; Lowery, L.E.; Brady, M.E.; Coward, R.B.; Murphy, J.A.; Hey, T.A.; et al. Preparation of tetrafluoroethylene from the pyrolysis of pentafluoropropionate salts. J. Fluor. Chem. 2017, 196, 107–116. [Google Scholar] [CrossRef]
  16. Conradie, F. Batch Separation of Tetrafluoroethylene, Hexafluoropropylene and Octafluorocyclobutane; University of Pretoria: Hatfield, South Africa, 2011. [Google Scholar]
  17. Su, M.C.; Kumaran, S.S.; Lim, K.P.; Michael, J.V.; Wagner, A.F.; Dixon, D.A.; Kiefer, J.H.; DiFelice, J. Thermal decomposition of CF2HCl. J. Phys. Chem. 1996, 100, 15827–15833. [Google Scholar] [CrossRef]
  18. Kiss, A.A. Advanced Distillation Technologies: Design, Control and Applications; John Wiley & Sons: Hoboken, NJ, USA, 2013. [Google Scholar]
  19. Madeddu, C.; Errico, M.; Baratti, R. Process Modeling in Aspen Plus. In CO2 Capture by Reactive Absorption-Stripping; SpringerBriefs in Energy; Springer: Cham, Switzerland, 2019; pp. 13–30. [Google Scholar]
  20. Cadoret, L.; Yu, C.C.; Huang, H.P.; Lee, M.J. Effects of physical properties estimation on process design: A case study using AspenPlus. Asia-Pac. J. Chem. Eng. 2009, 4, 729–734. [Google Scholar] [CrossRef]
  21. Al-Malah, K.I.M. Aspen Plus: Chemical Engineering Applications; John Wiley & Sons: Hoboken, NJ, USA, 2022. [Google Scholar]
  22. Sung, D.J.; Moon, D.J.; Lee, Y.J.; Hong, S.I. Catalytic pyrolysis of difluorochloromethane to produce tetrafluoroethylene. Int. J. Chem. React. Eng. 2004, 2. [Google Scholar] [CrossRef]
  23. Park, J.; Benning, A.; Downing, F.; Laucius, J.; McHarness, R. Synthesis of Tetrafluorethylene-Pyrolisis of monochlorodifluoromethane. Ind. Eng. Chem. 1947, 39, 354–358. [Google Scholar] [CrossRef]
  24. Espach, J.I.; Sonnendecker, P.W.; Crouse, P.L. Dynamic Modeling of a Sub-zero, Fed-Batch, Packed Distillation Column to Produce Tetrafluoroethylene. Chem. Eng. Technol. 2021, 44, 980–987. [Google Scholar] [CrossRef]
  25. Akpa, J.G.; Umuze, O.D. Simulation of a multi-component crude distillation column. Am. J. Sci. Ind. Res. 2013, 4, 366–377. [Google Scholar]
  26. Chen, Q. The Application of Process Simulation Software of Aspen Plus Chemical Engineering in the Design of Distillation Column. In Cyber Security Intelligence and Analytics. CSIA 2020; Advances in Intelligent Systems and Computing, Volume 1147; Xu, Z., Parizi, R., Hammoudeh, M., Loyola-González, O., Eds.; Springer: Cham, Switzerland, 2020; Volume 2, pp. 618–622. [Google Scholar]
  27. Elkhatat, A.M.; Al-Muhtaseb, S.A. Virtual mimic of lab experiment using the computer-based Aspen Plus® Sensitivity Analysis Tool to boost the attainment of experiment’s learning outcomes and mitigate potential pandemic confinements. Comput. Appl. Eng. Educ. 2023, 31, 285–300. [Google Scholar] [CrossRef]
  28. Fleitmann, L.; Pyschik, J.; Wolff, L.; Schilling, J.; Bardow, A. Optimal experimental design of physical property measurements for optimal chemical process simulations. Fluid Phase Equilibria 2022, 557, 113420. [Google Scholar] [CrossRef]
  29. Zhu, J.; Zhu, Z.; Hao, L.; Wei, H. Conceptual process design and process optimization of triple-column pressure-swing distillation for the separation of ternary mixtures embedding two azeotropes with different feed composition via thermodynamic insights and genetic algorithm. Sep. Purif. Technol. 2023, 2023, 124335. [Google Scholar] [CrossRef]
  30. Wang, W.; Wang, W. Energy saving in methylchlorosilane distillation. In Proceedings of the 2012 International Conference on Computer Distributed Control and Intelligent Environmental Monitoring, Zhangjiajie, China, 5–6 March 2012; pp. 290–293. [Google Scholar]
  31. Zhang, J.; Liang, S.; Feng, X. A novel multi-effect methanol distillation process. Chem. Eng. Process. Process Intensif. 2010, 49, 1031–1037. [Google Scholar] [CrossRef]
  32. Patil, L.; Amte, V. Energy efficient distillation column configuration: An exergy analysis. Int. J. Exergy 2022, 37, 428–443. [Google Scholar] [CrossRef]
  33. Louhi, E.H.; Kasiri, N.; Khalili-Garakani, A.; Heydari-Fard, M.; Ivakpour, J. Design and optimization of distillation column sequencing for the GTL process. Chem. Eng. Res. Des. 2021, 173, 119–128. [Google Scholar] [CrossRef]
  34. Rodriguez, C.; Mhaskar, P.; Mahalec, V. Linear hybrid models of distillation towers. Comput. Chem. Eng. 2023, 171, 108160. [Google Scholar] [CrossRef]
  35. Palacios-Bereche, R.; Ensinas, A.V.; Modesto, M.; Nebra, S.A. Double-effect distillation and thermal integration applied to the ethanol production process. Energy 2015, 82, 512–523. [Google Scholar] [CrossRef]
Figure 1. Simulation diagram of traditional five-column distillation process.
Separations 11 00037 g001
Figure 2. Four-tower distillation process simulation diagram.
Separations 11 00037 g002
Figure 3. Theoretical plate number sensitivity analysis diagram of distillation column: (a) T6, (b) T7, (c) T8, (d) T9.
Separations 11 00037 g003
Figure 4. Sensitivity analysis diagram of feed stage of rectification column: (a) T6, (b) T7, (c) T8, (d) T9.
Separations 11 00037 g004
Figure 5. Analysis diagram of high sensitivity of distillate-to-feed ratio in rectification column: (a) T6, (b) T7, (c) T8, (d) T9.
Separations 11 00037 g005
Figure 6. Rectifying column reflux ratio sensitivity analysis diagram: (a) T6, (b) T7, (c) T8, (d) T9.
Separations 11 00037 g006
Figure 7. Final distillation process simulation diagram.
Separations 11 00037 g007
Table 1. Cracking gas composition and content table.
ComponentBoiling Point (°C)Composition Content
(Mass Fraction)
CO−191.30.005
CHF3−84.40.005
C2H2F2−820.005
C2F4−76.30.63
CH2F2−51.60.002
C2HF3−510.002
CHClF2−410.32
C3F6−29.40.02
C2HClF4−100.005
C4F8-1−60.0005
C4F8-24.850.0005
C3HClF6140.005
total--1
Table 2. Operation parameters of traditional five-column distillation flow column.
ModulePlate NumberReflux RatioFeed Tray LocationDistillate Feed Ratio (D/F)Overhead Load(kW)Tower Bottom Load (kW)
T1254120.7−226.82621.6562
T24820230.02−114.766114.773
T34025110.82−482.462482.766
T48825110.08−200.664214.256
T5442200.9−189.772189.969
Table 3. Division of light and heavy components in distillation column.
ModuleLight Critical ComponentHeavy Critical Component
T6C2F4C2HF3
T7CHClF2C3F6
T8C2HF3CHCLF2
T9C2H2F2C2F4
Table 4. Equipment parameters of four-column distillation flow column.
ModulePlate NumberReflux RatioFeed Tray LocationDistillate Feed Ratio (D/F)
T1303200.605
T2354.5180.91
T3276840.075
T4477960.037
Table 5. Traditional five-column rectification for material balance data.
ModuleS3
(kg/h)
S3
(kg/h)
S5
(kg/h)
S6
(kg/h)
S8
(kg/h)
S10 (kg/h)S11 (kg/h)
CO3.630003.6300
CHF39.064.11 × 10−5009.04930.0136.64 × 10−8
C2H2F28.292.69 × 10−5008.291.09 × 10−71.01 × 10⁻¹⁴
C2F41631.141.0400119.041448.9962.08
CH2F22.690.820.00032331.37 × 10−94.99 × 10−86.73 × 10−91.88
C2HF34.250.464.53 × 10−124.39 × 10−205.84 × 10−50.00143.79
CHClF2716.2933.84569.9519.316.09 × 10−94.44 × 10−1293.19
C3F677.671.230.05176.336.42 × 10−151.51 × 10−200.067
C2HClF417.660.0816.7417.591.21 × 10−241.29 × 10−349.80 × 10⁻⁷
C4F8-12.590.00777.37 × 10−112.581.43 × 10−286.68 × 10−403.70 × 10⁻⁹
C4F8-22.590.00811.33 × 10−102.582.02 × 10−281.07 × 10−394.54 × 10⁻⁹
C3HClF624.140.0239.28 × 10−1624.11000
Table 6. Traditional five-tower rectification for energy balance.
ModuleCondenser (kW)Reboiler
(kW)
Feed
(kW)
Outfeed
(kW)
Error
(%)
T1−226.8321.66−4332.29−3314.53−1222.960.03
T2−114.77114.77−1222.96−1160.43−62.520.01
T3−482.46482.77−1160.43−925.50−234.630.01
T4−200.66214.26−3314.53−3028.85−272.100.02
T5−189.77189.97−3028.85−2747.81−280.850.01
Table 7. Four-tower rectification for material balance data.
ModuleS1
(kg/h)
S14
(kg/h)
S15
(kg/h)
S16
(kg/h)
S18
(kg/h)
S19
(kg/h)
CO15754.03 × 10−155.00012.52 × 10−1421.991548.01
CHF312.53.62 × 10−220.000261.93 × 10−2212.480.017
C2H2F212.51.06 × 10−226.54 × 10−54.11 × 10−2312.491.05 × 10−5
C2F415754.03 × 10−155.00012.52 × 10−1421.991548.01
CH2F255.78 × 10−74.990.00882.29 × 10−151.14 × 10⁻⁹
C2HF352.97 × 10−104.992.17 × 10−76.88 × 10−99.84 × 10−5
CHClF28002.8945.92751.1963.54 × 10−194.05 × 10⁻¹²
C3F65049.940.000310.06400
C2HClF412.512.58.28 × 10−133.67 × 10−900
C4F8-11.251.250000
C4F8-21.251.250000
C3HClF612.512.50000
Table 8. Four-tower rectification for energy balance.
ModuleCondenser (kW)Reboiler (kW)Feed
(kW)
Outfeed
(kW)
Error (%)
T6−425.95205.78−4320.37−1463.07−3077.520.05
T7−292.05292.33−1463.07−1325.37−137.430.01
T8−211.49211.53−1325.37−105.52−1219.820.01
T9−439.13467.78−3077.52−113.27−2935.590.01
Table 9. Final process for material balance data.
ModuleS1
(kg/h)
S14
(kg/h)
S15
(kg/h)
S16
(kg/h)
S18
(kg/h)
S19
(kg/h)
CO12.500012.51.17 × 10−97
CHF312.53.62 × 10−220.00026012.480.017
C2H2F212.51.06×10−226.54 × 10−5012.491.05 × 10−5
C2F415754.03 × 10−155.0001021.991548.01
CH2F255.76 × 10−74.990.00242.29 × 10−151.14 × 10⁻⁹
C2HF352.96 × 10−104.9992.34 × 10−86.88 × 10−99.84 × 10−5
CHClF28002.8845.91751.2113.54 × 10−194.05 × 10⁻¹²
C3F65049.950.000170.04700
C2HClF412.512.51.63 × 10−131.15 × 10−900
C4F8-11.251.250000
C4F8-21.251.250000
C3HClF612.512.50000
Table 10. Final flow for energy balance.
ModuleCondenser (kW)Reboiler (kW)Feed
(kW)
Outfeed
(kW)
Error
(%)
T6−425.95205.78−4320.37−1463.07−3077.520.05
T70292.33−7427.15−6997.38−137.450.01
T8−294.050−8180.1−105.68−8368.480.01
T9−439.13467.78−3077.52−113.27−2935.590.01
Table 11. Data comparison of different processes.
ModuleTraditional Five-Tower RectificationThe Reformed Four-Tower RectificationDouble-Effect Distillation
C2F4 (kg/h)1448.991548.011548.01
R22 (kg/h)569.95751.196751.211
Purity (C2F4)99.999%99.999%99.999%
Purity (R22)99.9902%99.99%99.99%
Total load (kW)2237.912705.4552125.295
Total low pressure steam consumption (kg/h)874,450.21,073,248825,392
Total refrigerant consumption (kg/h)21,853.9226,080.4920,860.68
Total cost (USD$)23,500.27428,787.24622,199.36
Disclaimer/Publisher’s Note: The statements, opinions and data contained in all publications are solely those of the individual author(s) and contributor(s) and not of MDPI and/or the editor(s). MDPI and/or the editor(s) disclaim responsibility for any injury to people or property resulting from any ideas, methods, instructions or products referred to in the content.

