Article

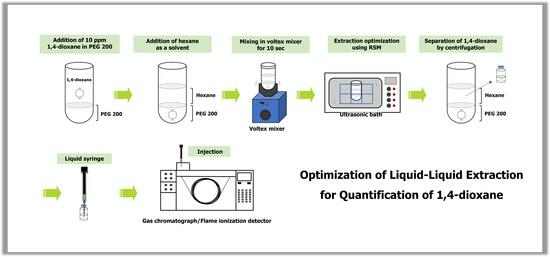
Application of Response Surface Method for Determination of Optimized Conditions for Quantification of 1,4-Dioxane in Model System of Polyethylene Glycol 200

Department of Food Science and Technology, Pukyong National University, Busan 48513, Republic of Korea
*
Author to whom correspondence should be addressed.
Separations 2023, 10(9), 495; https://doi.org/10.3390/separations10090495
Submission received: 10 August 2023 / Revised: 29 August 2023 / Accepted: 9 September 2023 / Published: 12 September 2023
(This article belongs to the Special Issue Extraction and Analytical Methods in Food Technology)

Abstract

:
The release of 1,4-dioxane probably contributes to the deterioration of marine habitats, animal health, and human liver and kidneys. The formulation of 1,4-dioxane in glycols, which has been applied for dehumidifying agents in refineries, may need to be replaced to ensure public health. Further, it is necessary to identify and precisely determine the levels of 1,4-dioxane in glycols for food quality control and environmental safety regulation. The objectives of this study were to validate a liquid–liquid extraction (LLE) method for 1,4-dioxane analysis and to optimize the LLE conditions using a response surface methodology (RSM). With consideration of the food matrix and its applications, polyethylene glycol 200 was used as the model system and analyzed by gas chromatography with flame ionization detection. In the experiments for the optimum extraction temperature and time of 1,4-dioxane in ultrasonic treatment, they were 20 °C and 10 min, respectively. The experimental conditions and results were analyzed by RSM with the Box–Behnken design, and the optimal extraction conditions for the LLE were determined to be coded with three independent variables (sample weight, solvent volume, and centrifugation speed). The amount of 1,4-dioxane increased as the amount of sample increased, whereas the amount of 1,4-dioxane decreased as the amount of solvent increased. This information can help to find the analytical methods for regulating the 1,4-dioxane content and its precise quantification in food products.

Graphical Abstract

1. Introduction

1,4-Dioxane (also known as dioxane) is a combustible heterocyclic ether with a faintly pleasant odor. Although 1,4-dioxane was mostly utilized in industrial applications, such as wetting and dispersion agents for printing and textile processing, as well as stabilizers [1], the U.S. Environmental Protection Agency (USEPA) has identified 1,4-dioxane as a probable human carcinogen that may result in liver and nasal cancers [2]. The adverse effects on the neurological system, liver, and kidney are also reported with respect to non-carcinogenicity [3]. Also, it frequently produces explosive peroxides and emits toxic fumes [4]. In the aspect of environmental science, the ingestion of polluted water is the most significant route of exposure for dose and risk [5], and it was designated as a “high priority” pollutant in the 2016 amendment to the Toxic Substance Control Act [5]. For food processing, food packaging materials, manufactured food additives, or crops treated with insecticides may all include traces of 1,4-dioxane contamination [6]. Despite the formulation with a glycol matrix being able to limit direct exposure or, at least, minimize it to low parts-per-million amounts [7], the reactions related to ethoxylated components can cause 1,4-dioxane formation [8]. For example, when two successive ethylene oxide units were separated from a chain of ethylene oxides, a ring of 1,4-dioxane can be readily formed. Alternatively, it also can be formed, when the ethylene oxide ring opens to form ethylene glycol and two ethylene glycols dimerize in the chemical structure of 1,4-dioxane. Most of these substances have been used as a composition of detergents, foaming agents, emulsifiers, and solvents. Although not used as an ingredient in consumer goods, due to the fact that dioxane exhibits excellent mobility and persistency as a cyclic ether, when released into the environment [9], it may be found as a trace contaminant in some items [10].
For controlling 1,4-dioxane, even at trace quantities, many government jurisdictions have been suggested [11,12]. For example, in Canada, it has been rejected for use in cosmetics, and, in Europe, it is a substance subjected to regulation [13]. The permitted concentrations in the U.S. are anticipated to vary from state to state, often at low parts-per-million to parts-per-billion levels [14]. In the U.S., the California DTSC (Department of Toxic Substances Control) has identified 1,4-dioxane as a chemical that merits additional study in order to remove it from consumer products due to the numerous issues associated with it in the environment [15]. Also, New York state set the nation’s first drinking water standard for 1,4-dioxane and the maximum contamination level at 1 part per billion and, recently, limits on the maximum permitted concentration of 1,4-dioxane in consumer items, such as cosmetic items, only up to 1 ppm [16].
Despite existing risks and regulations from overdose from or exposure to 1,4-dioxane, the release, diffusion, and interferences from complicated compositions of protein, carbohydrate, lipids, and organic acid and their matrices make precise quantification and control at trace levels in agri-food products challenging. None of the conventional techniques can accurately measure 1,4-dioxane at parts-per-million (ppm) levels below ten without modification [17]. In the complicated matrices involved with viscous and foamy items, like gels, detergents, and consumer products, it is difficult to assess and requires subsequent isolation and separation steps. Furthermore, it is necessary to validate their applicability in food model systems that contain intricate mixtures and solutions [18].
To overcome this issue, the application of liquid–liquid extraction (LLE) followed by gas chromatography (GC) would be worthy of testing for the measurement of the 1,4-dioxane contents in food samples. In LLE, the analyte is collected from a sample matrix by using a solvent. Typically, the sample is mixed with solvent to cause the compounds of interest to be solubilized into the solvent and allowed to establish equilibrium, which produces precise and repeatable analytical results. However, with consideration of the chemical and structural composition of consumer goods, examination by LLE only may contain a wide range of volatile and semi-volatile substances that are also extracted together with the 1,4-dioxane. Even the insertion of cyclohexanone as an internal standard to each sample is allowed for the explanation of more precise analysis [19]; it still needs alternatives. In this aspect, GC can be utilized to analyze volatile organic molecules and isolate single compounds for their quantification.
In this study, response surface methodology (RSM) and related variables were selected and applied to optimize the parameters with the view to maximize the extraction yields of 1,4-dioxane [20]. With help from the statistical approaches, it would be useful to identify the ideal circumstances for extracting particular substances in a variety of food analyses with a minimum loss in extraction efficiency. Thereby, to identify the ideal 1,4-dioxane extraction in polyethylene glycol 200 (PEG 200), the current study proceeded with the optimization of LLE and GC conditions using the RSM approach.

2. Materials and Methods

2.1. Materials

1,4-Dioxane was purchased from Daejung Chemicals and Metals (Siheung, Republic of Korea), and cyclohexanone, as an internal standard (IS), was purchased from Sigma-Aldrich Co. (St. Louis, MO, USA). PEG 200 and methanol were obtained from Samchun Pure Chemical (Pyeongtaek, Republic of Korea). Hexane was obtained from Honeywell Burdick & Jackson (Ulsan, Republic of Korea). Sodium sulfate (Na2SO4) was purchased from Junsei Chemical (Tokyo, Japan). All chemicals used in this study were of analytical grade. Water was deionized using an ultrapure and pure all-in-one water purification system (Dongwon Scientific Co., Seoul, Republic of Korea).

2.2. Preparation of Standard Solutions for Standard Curve

In the experiments for the standard curve, the standard solutions of 1,4-dioxane in PEG 200 were made with 5 g of sample and 5 mL of hexane. The prepared suspensions were analyzed at the concentrations of 1, 3, 5, 7.5, 10, 15, and 20 ppm. The concentration of 1,4-dioxane was quantified from the ratio of the peak area of the added 1,4-dioxane to the fixed quantity of 10 ppm cyclohexanone as IS.

2.3. Liquid–Liquid Extraction of 1,4-Dioxane for Standard Solutions and Samples

The solutions for 1,4-dioxane extraction in the liquid–liquid method were prepared by taking 5 g of PEG 200. For LLE, 5 mL of hexane was added. A 10 ppm of cyclohexanone was used as IS. The mixtures were shaken vigorously for 10 sec using a vortex mixer (GW92VM, Go-Won Scientific Technology Co., Seoul, Republic of Korea), followed by 10 min sonication using an ultrasonic bath (Powersonic 400, Hwashin Technology, Yangsan, Republic of Korea). The centrifugation speed of 10,000 rpm was applied at 4 °C for 10 min. After centrifugation, the upper layer was extracted using a syringe (J-S-5, Jung Rim Medical Industrial Co., Ltd., Jincheon, Republic of Korea) and stored in the glass vials. The solutions were taken using a syringe (549597, Hamilton Co., Reno, NV, USA) and injected into the GC (6000 series, Young-In Chromass) for 1,4-dioxane analysis.

2.4. Extraction Condition of 1,4-Dioxane in Ultrasonicfication

A total of 10 ppm of 1,4-dioxane and 10 ppm of IS was added to 5 g of PEG 200, and 5 mL of hexane was used for extraction. After mixing 10 sec with a vortex mixer (GW92VM, Go-Won Scientific Technology Co., Seoul, Republic of Korea), the mixture was treated at extraction temperatures of 20, 30, 40, and 50 °C and extraction times of 5, 10, and 15 min in an ultrasonic bath (Powersonic 400, Hwashin Technology, Yangsan, Republic of Korea). The recovery rate of 1,4-dioxane extraction in PEG 200 was measured.

2.5. Experimental Design for Optimization of LLE Using RSM

The analytical method of 1,4-dioxane was evaluated by LLE with three independent variables. The RSM Box–Behnken design was used in the extraction experiment. For LLE, the selected factors were as follows: weight of the sample (mL), volume of the solvent (mL), and the centrifugation speed (Table 1). These variables were tested at three distinct levels (−1, 0, and +1) to investigate the interactions among the variables at different levels and their response yields (Table 2) [21]. With these three factors for three levels, the Box–Behnken design method was established as 17 experimental runs, as shown in Table 2, and yield (Y) was set as the dependent variable. It was measured twice, and the average value was used for analysis.

2.6. Liquid–Liquid Extraction of 1,4-Dioxane for RSM

The solutions for optimization of 1,4-dioxane extraction in the liquid–liquid method were prepared by taking 3, 5, and 7 g of PEG 200 after adding 10 ppm 1,4-dioxane. For LLE, 3, 5, and 7 mL of hexane were added. Ten ppm of cyclohexanone was added as an IS. The following procedure was the same as in Section 2.3.

2.7. GC-FID Conditions

Samples were injected into a gas chromatography system to determine 1,4-dioxane concentrations. An SP-2560 fused silica capillary column (100 × 0.25 mm; 0.2 μm film thickness; Supelco Inc., Bellefonte, PA, USA) was used to separate 1,4-dioxane. Temperatures at both the injector and detector interfaces were maintained at 240 °C.
The oven temperature of GC was as follows: the initial column temperature was 50 °C for 2 min and then increased to 160 °C at 10 °C/min. At a flow rate of 1.5 mL/min, nitrogen gas was used as the carrier gas. In splitless mode, 1 μL aliquot of each sample was injected into GC. Cyclohexanone was used as IS to determine the 1,4-dioxane level in the PEG 200 samples. The detection and quantification of 1,4-dioxane in PEG 200 was determined by assessing the peak area obtained after injection. The area of each peak was confirmed to be proportionate to the amount of 1,4-dioxane and injected cyclohexanone. The concentration of 1,4-dioxane was estimated by the standard curve of the ratios of peak areas between several concentrations of 1,4-dioxane and 10 ppm of cyclohexanone. All data in the tables and figures are the average of at least two experiments, each completed twice.

2.8. Statistical Analysis

For data analysis of 1,4-dioxane extraction, a Box–Behnken design of RSM was applied via Design-Expert statistical software (version 7.0.1; Stat-Ease Inc., Minneapolis, MN, USA). Tables and model graphs with a 3-dimensional view were used to illustrate the data.

3. Results and Discussion

3.1. Content of 1,4-Dioxane by Standard Curve in PEG 200

The amount of 1,4-dioxane contained in PEG 200 was calculated via a standard curve from 1 ppm to 20 ppm 1,4-dioxane standard solutions (Figure 1). The formula of the standard curve was Y = 0.0149 × X + 0.0932, where Y was the ratio of peak areas between 1,4-dioxane and cyclohexanone, and X was the added concentrations of 1,4-dioxane. The coefficient of determination (R2) of the standard curve was higher than 0.99, which showed good linearity. From the x-intercept in Figure 1, the concentration of 1,4-dioxane in PEG 200 can be estimated [22], and it was 6.26 ppm.

3.2. Effect of Ultrasound with Extraction Temperature and Time on Recovery Rate of 1,4-Dioxane

The recovery rates of 1,4-dioxane extraction in PEG 200 by ultrasound are shown in Figure 2. From the results, the highest recovery rate was obtained at 55.9 ± 2.6% when extracted at 20 °C for 10 min, and the best recovery rate (45.6 ± 2.3%) at 30 °C was obtained when extracted for 5 min. It was found that the recovery rate was significantly reduced to less than 20% under the conditions at 40 °C and 50 °C. It was considered that 1,4-dioxane was in an under unstable state at higher temperatures with ultrasound cavitation. Similar to our results from the study of Son et al. [23], ultrasonic treatment at 25 °C for 2 hrs presented the decomposition of more than 75% of 1,4-dioxane.

3.3. Optimization of Extraction Yield of 1,4-Dioxane Using Response Surface Method

The parameters for headspace were systemically optimized to find the extraction conditions for 1,4-dioxane. The Box–Behnken design was established with three factors: sample weight, solvent volume, and centrifugation speed. These three factors and their response values are shown in Table 2. The extraction yield ranged from 42.4 ± 3.2% to 86.6 ± 1.5%. Among the experimental values for the extraction yield, the lowest yield (42.4 ± 3.2%) occurred when the sample was 3 g, the solvent was 5 mL, and the centrifugation speed was 5000 rpm. Conversely, the highest yield (86.6 ± 1.5%) occurred when the sample was 7 g, the solvent was 3 mL, and the centrifugation speed was 10,000 rpm. The quadratic equation for the relationship between the extraction yield (Y) and the coded values of three independent factors, such as weight of sample (A), volume of solvent (B), and centrifugation speed (C), is as the following Equation (1):
Y = 4.36000 + 11.53750 × A + 7.33750 × B − 0.000574 × C − 1.68125 × A × B − 0.000187 × A × C + 0.000128 × B × C + 0.554375 × A2 − 0.458125 × B2 + 7.47000 × 10⁻⁸ × C2
The p-values for the quadratic equation are shown in Table 3. The R2 was estimated to be 0.9943, which can conclude their significance. The yields tended to increase when the sample weight increased, and it was the opposite for solvent volume—when the solvent volume was increased, the yield tended to decrease. In particular, the sample weight was the most influential factor in the response model, followed by the centrifugation speed and the solvent volume, on the extraction yield of 1,4-dioxane. While we used hexane, which is commonly used as a solvent and selected for this study, ethyl acetate or dichloromethane can be alternatives to increase the recovery rate of 1,4-dioxane from food matrices for future study. From the results of Alsohaimi et al.’s study (2020) on the extraction efficiency of 1,4-dioxane from various solvent types in cosmetic samples, the recovery rate was varied in the order of ethyl acetate (99%), dichloromethane (89%), methanol (70%), hexane (47%), and acetone (35%). Especially with dichloromethane for the solvent, the recovery rates of 1,4-dioxane from water and cosmetic samples presented good agreement, with 95% and 89%, respectively [24,25].
The three-dimensional response surface graph for the extraction yield is shown in Figure 3. The graph of Figure 3A shows an increasing tendency of extraction yield of 1,4-dioxane as the weight of the sample increased. When the sample weight and solvent volume were 7 g and 3 mL, respectively, the 1,4-dioxane extraction yield was at its peak.
We found statistical significance in the correlation between sample weight and extraction yield (Table 3), indicating the higher yield of 1,4-dioxane extraction as more sample weight was added. For example, when comparing 7 g and 3 g of sample with 3 mL of solvent, the extraction yield was 38.9% increased. A similar tendency was found in Park et al.’s study [24]. In their study, when the recovery rate was tested by adding 1 ppb and 10 ppb 1,4-dioxane to the water sample, the recovery rate increased from 66.8% to 72.3% as methyl tert-butyl ether was used for a solvent and from 86.5% to 101.8% as methylene chloride was used for a solvent, respectively.
The effects of the sample amount and centrifugation speed are shown in Figure 3B. A linear correlation with the 1,4-dioxane extraction yield was found with respect to the increase in the sample amount and centrifugation speed. As shown in Figure 3A, as the sample amount increased, the extraction yield of 1,4-dioxane also increased. On the other hand, the 1,4-dioxane yield was a little, but not significantly, affected by the centrifugation speed (Table 3). Still, the expected extraction yields for 5 g sample and 5 mL solvent can be estimated using Equation (1), and it was 56.6%, 57.9%, and 62.9% at the centrifugation speeds of 5000, 10,000, and 15,000, respectively. From these estimations, we can find that the centrifugation speed of 15,000 rpm was associated with slightly higher, though not significant, changes in the extraction yield of 1,4-dioxane compared with the other two centrifugation speeds. Also, when comparing the extraction yields of 1,4-dioxane at 7 g and 5 mL at 5000 and 15,000 rpm, they were 75.1 ± 8.1% and 77.7 ± 5.4%, respectively, and it indicated the extraction yields of 1,4-dioxane were not significantly different within the tested centrifugation speeds in this study. Our experimental and simulated results for the extraction yields of 1,4-dioxane with the centrifugation speed settings can explain the settings for others’ studies and can be helpful for future study design. For example, from Zhou’s study [26], 250 mg of cosmetic sample and 250 μL of internal standard (10.0 g/mL 1,4-dioxane-d8) were added to 2.0 mL acetonitrile, vortexed for 3 min, sonicated for 30 min, and then the samples were pretreated by centrifugation at 11,000 rpm for 10 min. It was near the middle value between 5000 and 15,000 rpm tested in this study [26].
The interaction of the solvent volume and centrifugation speed in the extraction yield of 1,4-dioxane is described in Figure 3C. When the sample size was 7 g, the centrifugation speed was 10,000 rpm, and the amount of solvent increased from 3 mL to 7 mL, the extraction yield significantly decreased from 86.6 ± 1.5% to 55.3 ± 9.8%. Therefore, as the amount of solvent increases, the extraction yield of 1,4-dioxane decreases significantly. In the study of Park et al. [25] for the solvent extraction of 1,4-dioxane, the recovery rates for the ratios of 2, 5, 10, and 20 mL of dichloromethane solvents in a 10 mL water sample were 19.1%, 27.5%, 48.6%, and 94.9%, respectively. In addition, as the amount of solvent for the water sample increased, the recovery rate showed a tendency to increase. In the case of using methyl tert-butyl ether instead of dichloromethane under the same conditions, the recovery rates were 13.3%, 27.7%, 65.5%, and 74.9%, respectively, showing lower results than those from dichloromethane, with similar tendency toward increased recovery rate was shown as the amounts of the solvent increased. The above results demonstrate the contradictory results from this study, and it is considered that they may be derived from the differences in the matrices of samples, types of solvents, sample pretreatment methods, and analysis conditions.

4. Conclusions

By RSM, the experimental results from this study were optimized to suggest the effective and precise quantification of 1,4-dioxane in PEG 200. The optimal conditions for measuring 1,4-dioxane in PEG 200 samples were 7 g of sample, 3 mL of solvent, and centrifugation at 10,000 rpm. The optimum extraction temperature and time of 1,4-dioxane in the ultrasonic treatment were 20 °C and 10 min, respectively. With LLE, it is possible to identify the volatile compounds with a minimum loss in extraction efficiency from the food sample. In this study, we found that the LLE and GC combination can offer a robust, sensitive, and inexpensive way to analyze 1,4-dioxane in PEG 200. This approach can be applied to control and regulate the 1,4-dioxane contents in specific foods with similar food matrices or chemical compositions of PEG 200 for their improved quality control and safety.

Author Contributions

Conceptualization, M.-C.K.; Methodology, M.-C.K., S.-Y.P., H.-R.K. and T.M.M.; Data curation, S.-Y.P., H.-R.K., Y.-S.C. and T.M.M.; Visualization, S.-Y.P., Y.-S.C. and J.H.M.; Investigation, Y.-S.C. and S.-Y.P.; Validation, M.-C.K. and T.M.M.; Writing—original draft preparation, M.-C.K. and T.M.M.; Writing—reviewing and editing, S.-Y.P., J.H.M. and Y.-B.L.; Supervision, Y.-B.L. All authors have read and agreed to the published version of the manuscript.

Funding

This work was supported by the Research Grant of Pukyong National University (2023-2024).

Data Availability Statement

The data presented in this study are available on request from the corresponding author.

Conflicts of Interest

The authors declare no conflict of interest.

References

  1. Duncan, B.; Vavricka, E.; Morrison, R. A forensic overview of 1,4-dioxane. Environ. Claims J. 2004, 16, 69–79. [Google Scholar] [CrossRef]
  2. Pollitt, K.J.G.; Kim, J.-H.; Peccia, J.; Elimelech, M.; Zhang, Y.; Charkoftaki, G.; Hodges, B.; Zucker, I.; Huang, H.; Deziel, N.C. 1,4-Dioxane as an emerging water contaminant: State of the science and evaluation of research needs. Sci. Total Environ. 2019, 690, 853–866. [Google Scholar] [CrossRef] [PubMed]
  3. Anderson, J.K.; Kappleman, W.B. Review of the Human Health Toxicology and Ecotoxicology of 1,4-Dioxane, Environmental Investigation and Remediation; CRC Press: Boca Raton, FL, USA, 2020; pp. 255–290. [Google Scholar]
  4. Eigenbrodt, C.; Rooney, E. Adsorption of 1,4–Dioxane on Activated Carbon with Regeneration by Titanium Dioxide/Ultraviolet Light; WPI: Worcester, MA, USA, 2014; p. 32. [Google Scholar]
  5. Dawson, D.; Fisher, H.; Noble, A.E.; Meng, Q.; Doherty, A.C.; Sakano, Y.; Vallero, D.; Tornero-Velez, R.; Cohen Hubal, E.A. Assessment of non-occupational 1,4-dioxane exposure pathways from drinking water and product use. Environ. Sci. Technol. 2022, 56, 5266–5275. [Google Scholar] [CrossRef]
  6. Wang, Y. Breakthrough in 2D-CSIA technology for 1,4-dioxane. Remediat. J. 2016, 27, 61–70. [Google Scholar] [CrossRef]
  7. Pundlik, M.; Sitharaman, B.; Kaur, I. Gas chromatographic determination of 1,4-dioxane at low parts-per-million levels in glycols. J. Chromatogr. Sci. 2001, 39, 73–76. [Google Scholar] [CrossRef]
  8. Lavilla, I.; Cabaleiro, N.; Bendicho, C. Main chemical contaminants in cosmetics: Regulatory aspects and analytical methods. In Analysis of Cosmetic Products; Elsevier: Amsterdam, The Netherlands, 2018; pp. 331–383. [Google Scholar]
  9. Li, F.; Deng, D.; Li, M. Distinct catalytic behaviors between two 1,4-dioxane-degrading monooxygenases: Kinetics, inhibition, and substrate range. Environ. Sci. Technol. 2019, 54, 1898–1908. [Google Scholar] [CrossRef]
  10. Mohr, T.K. 1,4-Dioxane Chemistry, Uses, and Occurrence, Environmental Investigation and Remediation; CRC Press: Boca Raton, FL, USA, 2020; pp. 77–124. [Google Scholar]
  11. Chiang, S.Y.; Anderson, R.; Wilken, M.; Walecka-Hutchison, C. Practical perspectives of 1,4-dioxane investigation and remediation. Remediat. J. 2016, 27, 7–27. [Google Scholar] [CrossRef]
  12. Halden, R.U. Epistemology of contaminants of emerging concern and literature meta-analysis. J. Hazard. Mater. 2015, 282, 2–9. [Google Scholar] [CrossRef]
  13. Stepien, D.K.; Diehl, P.; Helm, J.; Thoms, A.; Püttmann, W. Fate of 1,4-dioxane in the aquatic environment: From sewage to drinking water. Water Res. 2014, 48, 406–419. [Google Scholar] [CrossRef]
  14. Adamson, D.T.; Uhlir, G.; Rauch, S.R.; Klein, T.; Danko, A.S. Trends in 1,4-dioxane analyses: Implications for identification and characterization of contaminated groundwater sites. Groundw. Monit. Remediat. 2021, 41, 29–40. [Google Scholar] [CrossRef]
  15. Polsky, C.; Schwarzman, M. The hidden success of a conspicuous law: Proposition 65 and the reduction of toxic chemical exposures. Ecol. LQ 2020, 47, 823. [Google Scholar]
  16. Broughton, A.; Sepulveda, A.; Foster, K.; Kruk, T.; Nickelsen, M.G.; Gillan, M.; Mohr, T.K. 1,4-Dioxane: Emerging technologies for an emerging contaminant. Remediat. J. 2019, 29, 49–63. [Google Scholar] [CrossRef]
  17. Zhang, S.; Gedalanga, P.B.; Mahendra, S. Advances in bioremediation of 1,4-dioxane-contaminated waters. J. Environ. Manag. 2017, 204, 765–774. [Google Scholar] [CrossRef]
  18. Guo, W.; Brodowsky, H. Determination of the trace 1,4-dioxane. Microchem. J. 2000, 64, 173–179. [Google Scholar] [CrossRef]
  19. Jones-Lepp, T.L. Emerging Contaminants in the Environment. Comprehensive Environmental Mass Spectrometry; U.S. Environmental Protection Agency: Las Vegas, NV, USA, 2012; p. 287.
  20. Kasiri, M.; Aleboyeh, H.; Aleboyeh, A. Modeling and optimization of heterogeneous photo-fenton process with response surface methodology and artificial neural networks. Environ. Sci. Technol. 2008, 42, 7970–7975. [Google Scholar] [CrossRef] [PubMed]
  21. Arslan-Alaton, I.; Tureli, G.; Olmez-Hanci, T. Treatment of azo dye production wastewaters using photo-fenton-like advanced oxidation processes: Optimization by response surface methodology. J. Photochem. Photobiol. A Chem. 2009, 202, 142–153. [Google Scholar] [CrossRef]
  22. Tanchotikul, U.; Hsieh, T.C.Y. Methodology for quantification of geosmin and levels in rangia clam (Rangia cuneata). J. Food Sci. 1990, 55, 1233–1235. [Google Scholar] [CrossRef]
  23. Son, H.-S.; Choi, S.-B.; Khan, E.; Zoh, K.-D. Removal of 1,4-dioxane from water using sonication: Effect of adding oxidants on the degradation kinetics. Water Res. 2006, 40, 692–698. [Google Scholar] [CrossRef]
  24. Alsohaimi, I.H.; Khan, M.R.; Ali, H.M.; Azam, M.; Alammari, A.M. Solvent extraction and gas chromatography–mass spectrometric determination of probable carcinogen 1,4-dioxane in cosmetic products. Sci. Rep. 2020, 10, 5214. [Google Scholar] [CrossRef] [PubMed]
  25. Park, Y.M.; Pyo, H.S.; Park, S.J.; Park, S.K. Development of the analytical method for 1,4-dioxane in water by liquid–liquid extraction. Anal. Chim. Acta 2005, 548, 109–115. [Google Scholar] [CrossRef]
  26. Zhou, W. The determination of 1,4-dioxane in cosmetic products by gas chromatography with tandem mass spectrometry. J. Chromatogr. A 2019, 1607, 460400. [Google Scholar] [CrossRef]
Figure 1. Standard curve for calculation of 1,4-dioxane concentration in PEG 200.
Separations 10 00495 g001
Figure 2. Results of the recovery rate of 1,4-dioxane on extraction temperature and time in ultrasound.
Separations 10 00495 g002
Figure 3. Three-dimensional response surface plots showing the effects of the interactions of sample weight, solvent volume, and centrifugation speed on 1,4-dioxane liquid/liquid extraction. (A) Weight of sample interaction with solvent volume; (B) weight of sample interaction with centrifugation speed; (C) solvent volume interaction with solvent volume. The other component is adjusted to its center value.
Separations 10 00495 g003
Table 1. Coded and experimental values of independent factors in Box–Behnken design of RSM for liquid–liquid extraction.
CategoryCoded and Experimental Values of Independent Variables
Coded Value−10+1
AExperimental
parameters
Sample (g)357
BSolvent (mL)357
CCentrifugation speed (rpm)500010,00015,000
Table 2. Experimental values for the three variables of the Box–Behnken design and their response in terms of 1,4-dioxane yield (Y) for liquid–liquid extraction.
RunCoded and Experimental Values of Independent VariablesResponse
A: Sample Amount
(g)
B: Solvent Volume
(mL)
C: Centrifugation Speed
(rpm)
Y: Yield
(%)
1+1 (7)0 (5)−1 (5000)75.1 ± 8.1
2+1 (7)−1 (3)0 (10,000)86.6 ± 1.5
3−1 (3)0 (5)−1 (5000)42.4 ± 3.2
4+1 (7)0 (5)+1 (15,000)77.7 ± 5.4
50 (5)0 (5)0 (10,000)56.4 ± 8.3
6−1 (3)−1 (3)0 (10,000)47.7 ± 4.7
70 (5)0 (5)0 (10,000)56.7 ± 2.2
8−1 (3)0 (5)+1 (15,000)52.5 ± 2.2
90 (5)−1 (3)−1 (5000)64.7 ± 4.7
10−1 (3)+1 (7)0 (10,000)43.3 ± 5.7
110 (5)−1 (3)+1 (15,000)68.2 ± 6.4
120 (5)+1 (7)−1 (5000)45.0 ± 5.8
130 (5)0 (5)0 (10,000)57.6 ± 5.8
14+1 (7)+1 (7)0 (10,000)55.3 ± 9.8
150 (5)+1 (7)+1 (15,000)53.6 ± 4.2
160 (5)0 (5)0 (10,000)59.0 ± 2.2
170 (5)0 (5)0 (10,000)59.5 ± 1.8
Values are presented as mean ± SD of duplicates.
Table 3. Analysis of variance (ANOVA) for the response surface quadratic model of 1,4-dioxane extraction yield in liquid–liquid extraction.
SourcedfEstimated Valuep-Value
Prob > F
Intercept1+4.36000<0.0001 ***
A-Weight of sample1+11.53750<0.0001 ***
B-Volume of solvent1+7.33750<0.0001 ***
C-Centrifugation1−0.0005740.0004 **
AB1−1.68125<0.0001 ***
AC1−0.0001870.0326 *
BC1+0.0001280.1138 NS
A21+0.5543750.0146 *
B21−0.4581250.0323 *
C21+7.47000 × 10−80.0300 *
Residual7
Lack of Fit3 0.4354
Pure Error4
Corrected Total16
(1) Designated as A for weight of sample (g); B for volume of solvent (mL); and C for centrifugation speed in rpm. (2) R2 = 0.9943; adjusted R2 = 0.9869; predicted R2 = 0.9530; adequate precision = 41.2896; coefficient of variation (%) = 2.40. Significantly different at * p < 0.05, ** p < 0.01, and *** p < 0.001; NS—not significant; df—degree of freedom; Prob—probability.
Disclaimer/Publisher’s Note: The statements, opinions and data contained in all publications are solely those of the individual author(s) and contributor(s) and not of MDPI and/or the editor(s). MDPI and/or the editor(s) disclaim responsibility for any injury to people or property resulting from any ideas, methods, instructions or products referred to in the content.

