Article

Adsorptive Removal of Emulsified Automobile Fuel from Aqueous Solution

by
Mohammad Asif
1,*,
Mourad M. Boumaza
1,
Nadavala Siva Kumar
1,
Ebrahim H. Al-Ghurabi
1 and
Mohammed Shahabuddin
2
1
Department of Chemical Engineering, King Saud University, P.O. Box 800, Riyadh 11421, Saudi Arabia
2
Department of Physics and Astronomy, King Saud University, P.O. Box 2455, Riyadh 11451, Saudi Arabia
*
Author to whom correspondence should be addressed.
Separations 2023, 10(9), 493; https://doi.org/10.3390/separations10090493
Submission received: 30 June 2023 / Revised: 4 September 2023 / Accepted: 6 September 2023 / Published: 11 September 2023

Abstract

:
The development of cost-effective technologies for the treatment of water contaminated by petrochemicals is an environmental priority. This issue is of paramount importance for countries like Saudi Arabia owing to its scarce water resources. Of particular concern are automobile fuels, such as gasoline and diesel, that can contaminate water aquifers from leaking underground fuel storage tanks. Owing to the cost-effectiveness of adsorption-based technologies, low-cost high surface-area commercial activated carbon was used for the adsorptive removal of contaminants from the emulsified fuel-contaminated water. Batch equilibrium experiments showed a high efficacy of the adsorbent. Even with small amounts of the adsorbent, a removal efficiency of more than 97% was obtained for both gasoline as well as diesel. Three different well-known batch adsorption isotherm models, namely the Langmuir, Freundlich, and Temkin, were used for describing the experimental data. The best results were obtained using the Freundlich isotherm followed by the Langmuir model. The maximum capacity was found to be 8.3 g gasoline and 9.3 g diesel per gram of the adsorbent at ambient conditions for a neutral contaminated aqueous solution.

1. Introduction

The contamination of water bodies as a result of various human activities is a matter of great environmental concern. Even a small amount of petrochemical contamination, for instance, could lead to significant environmental damage. As an example, one liter of benzene, at the maximum concentration limit (MCL) of 5 ppb (parts per billion), could render approximately 77 million gallons of water unfit for human consumption [1] because benzene can cause leukemia. Among different pollutants, automobile fuel is of major concern. The United States Environmental Protection Agency estimates the existence of over 200,000 leaking underground storage tanks (UST) in the United States. Even a small hole with a diameter of 0.5 mm in an UST with a daily gasoline pumping capacity of 1500 L could leak as much as 460 L of fuel for 12,100 L of the automobile fuel pumped [1]. Although the leaked fraction of the fuel is less than 4%, the environmental cost of the contamination would be substantially higher. If such a pollution scenario occurred in Saudi Arabia, the damage could be significantly greater in view of the nation’s scarce water resources. Therefore, developing cost-effective technologies for the treatment of water contamination is of paramount importance.
Among various ex situ remediation techniques, adsorption is especially promising because of its simplicity, adaptability for batch and continuous processes, potential for regeneration and reuse, low capital cost, and ability to remove a wide range of pollutants and impurities. It involves the removal of the contaminating molecules from the fluid phase (gas/liquid) by adhesion onto the surface of a solid adsorbent. In fact, the use of the adsorption technology is not only limited to environmental remediation. It can also be used to separate and store gases like hydrogen, methane, natural gas, and carbon capture as solid adsorbents and can selectively adsorb certain gases while allowing others to pass through. The adsorption technology has also been applied in catalysis, pharmaceuticals and drug delivery, dehumidification, and air conditioning.
Of particular importance in the adsorptive removal of contaminants is the availability of the surface area of the adsorbent [2,3,4,5,6,7,8,9]. Activated carbon (AC), owing to its large surface area, high micropore volume, well-developed porous structure, thermal stability, and desirable surface characteristics, has been widely used as an adsorbent for the treatment of wastewater, industrial effluents, gas purification, and the removal of volatile organic compounds (VOC) [8,10,11,12,13]. Another advantage of using activated carbon in the treatment of fuel-contaminated wastewater is that it does not pose any disposal problem. When the regeneration of the spent adsorbent becomes uneconomical, it can be used as a fuel.
A complete treatment strategy usually requires a sequential application of a number of physical, chemical, and biological processes to the wastewater. These include reverse osmosis, membrane separation, evaporation, electro-dialysis, ion exchange, chemical precipitation, coagulation, filtration, flocculation, photochemical reactions, activated sludge, aerobic and anaerobic treatment, microbial reduction and adsorption, etc. As a matter of fact, most wastewater treatment technologies are specifically designed to address a particular water contamination or purification problem and, therefore, usually involve rather complex procedures that often lead to high operational and maintenance costs while generating toxic sludge. Because adsorption is fairly generic in nature owing to ease of operation and simplicity of design [14,15], it can, therefore, be easily integrated with other separation technologies to improve the separation efficacy of the treatment process. The reverse osmosis membrane filtration coupled with an adsorption pretreatment unit proved to be an effective hybrid technique for the treatment of high-concentration oily wastewater with a removal efficacy of 99% and more than a 100% increase in the permeate flux [16].
In order to develop high-efficiency adsorbents for the removal of emulsified oil (gasoline) from contaminated water, the use of multi-walled carbon nanotubes (MWCNTs) doped with ferric oxide nanoparticles (NPs) was suggested [17]. Increasing the fraction of NPs reportedly enhanced the gasoline uptake. Measuring the oil concentration using the total organic carbon (TOC) analyzer, the sorption capacities of doped CNTs were found to be greater than 7 g/g for gasoline. Earlier work on the use of NPs showed good removal capacity of the commercial hydrophobic nano-silica of automobile fuels, i.e., gasoline and diesel, from an aqueous solution [3]. However, the isotherm fits of their batch equilibrium data were found to be poor. Recently, low-cost activated carbon (AC) samples prepared at different temperatures from potato peel were used for the removal of the oil [8]. Samples with larger surface areas and higher pore volumes resulted in higher oil uptake, indicating a direct correlation between the pore characteristics and the adsorption capacity of the adsorbent. The adsorption capacity of the adsorbent showed a steep decrease when water was present along with the oil. No results of batch equilibrium studies were reported by the authors [8]. Another recent study suggested the use of magnetic chitosan-based flocculants for the removal of emulsified oil from the steel rolling industry’s effluent wastewater [18]. In the present study, low-cost, commercially available activated carbon was used for the removal of the two most common automobile fuels, i.e., gasoline and diesel, from aqueous solutions with varying contaminant concentrations. In most practical situations, unlike crude oil spills, these fuels could lead to contamination of an underground water aquifer in small concentrations that would make the water unfit for human consumption and will, therefore, require appropriate remediation strategies. As a result, unlike in situ remediation techniques often suggested for crude oil spills, they are unlikely to be effective for water contaminated with low concentrations of automobile fuels. Therefore, careful consideration of the appropriate description of the batch equilibrium experimental data was given in this study while keeping the concentration of the emulsified oil in an aqueous solution low. To ensure an accurate measurement of the contaminant concentration in the aqueous solution, the concentration measurements were carried out using a TOC analyzer.

2. Materials and Methods

2.1. Materials

The activated carbon (AC) used in this study as an adsorbent was obtained from Loba Chemie Pvt Ltd., Mumbai, India. The morphological characterization of the CAC was carried out using a Scanning Electron Microscope (SEM). These images are shown in Figure 1. A great degree of surface roughness is seen in both images as a result of the activation process.
Another important aspect of the activated carbon is its surface area and pore volume. The greater the surface area and the pore volume of the adsorbent, the higher the contaminant-binding active sites available in the pore structure created by the physical/chemical activation process undertaken during the synthesis of the sample. This is attributed to the reactions that take place during the pyrolysis and the activation processes, leading to the evolution of volatiles, such as oxides of carbon and hydrogen gas. The occurrence of reactions between the active intermediates and the constituents of the gas phase, though not fully understood, also cannot be ruled out. In the case of activation using alkalis (M = Na/K), hydroxide reduction and carbon oxidation take place. The reduction reaction leads to the evolution of hydrogen gas in addition to Na or K metals, whereas carbon is oxidized to metal carbonates. Typically, the various overall probable reaction schemes taking place in the case of an alkali-driven activation process can be represented as [19,20],
6 M O H + 2 C 2 M + 2 M 2 C O 3 + 3 H 2
2 M O H + C + H 2 O M 2 C O 3 + 2 H 2
2 M O H + 2 C 2 C O + 2 K + H 2
Note that the crystallinity of the sample, among other factors, could also play a significant role in the degree of intercalation of the metal inside the carbonaceous porous structure, thereby ultimately affecting their relative efficacy towards different contaminants. For example, metallic K was shown to be more amenable to intercalation in contrast with Na, which only intercalated with highly disorganized samples of MWCNTs [19].
The variation of the pore volume and pore area with the pore radius is shown in Figure 2. It is obvious from the figure that the AC sample used was highly microporous. The total pore volume was 0.522 cm3/g. More than half of the pore volume was concentrated in pores with an average pore width of less than 20 Å. Out of a total pores area of 1132 m2/g, the fraction of pores with a width of 20 Å was almost 220 m2/g. This means that the remaining pore area of almost 900 m2/g was dominated by pores with a width of ≤20 Å, which are classified as ultra-micropores and super-micropores. This is a clear indication that the AC sample, owing to its high surface area and pore volume, is potentially a promising adsorbent for the removal of contaminants.

2.2. Methods

First, the stock solution was prepared with a contaminant concentration of 1000 ppm using distilled water with a conductivity of 2.77 µS/cm. We used a nonionic surfactant (Triton X-100: C14H22O(C2H4O)n) to prepare a homogeneous solution. The oily wastewater emulsion was mixed at 500 rpm for 1 h. The stability of the oily wastewater emulsion remained unchanged after 10 h [16].
The kinetics of the gasoline uptake was determined by monitoring the temporal variation of its concentration in the emulsified solution. The kinetic fit yielded the pseudo-first-order rate constant as 0.166 min−1 with the coefficient of determination (r-squared) being 0.971. This means 42 min are required to reach 99.9% of the equilibrium uptake value. The trend was similar for the diesel uptake kinetics. Therefore, 2 h of contact time was used for batch equilibrium studies in the present investigation.
Different dosages of the AC were used with 40 mL of solution in TOC (total organic carbon) vials. The solution with a fixed quantity of the AC was mounted on a shaker for 2 h at 25 ± 0.5 °C to ensure an intimate mixing of the adsorbent with the emulsified fuel (gasoline/diesel) solution. The contact duration of the adsorbent with the contaminated solution helped to remove the contaminant from the solution, thereby yielding an equilibrium concentration of the contaminant in the remaining solution. The solution was then filtered using a Büchner funnel and a Büchner flask, connected to a vacuum pump, to remove the AC before the measurement of the oil concentration. The filtered samples are shown in Figure 3, where the initial concentration of the oily contaminant was kept at 1000 ppm while the adsorbent dosage was varied from 0.01 to 0.25 g.
The oil concentration was measured using a Total Carbon Content (TOC) Analyzer (Model: TOC-L, Shimadzu, Japan) with a measurement range of 4 μg/L to 30,000 mg/L. The instrument calibration of the TOC analyzer was first verified using potassium hydrogen phthalate (C8H5KO4). Next, the calibration of the equipment for both gasoline and diesel was carried out. As mentioned earlier, batch isotherm experiments were carried out using the oil-in-water emulsion, where the oil was the dispersed phase in the continuous phase (water) at room temperature. Different dosages of the adsorbent were used, i.e., 0.01, 0.02, 0.04, 0.06, 0.08, 0.10, 0.15, 0.20, and 0.25 g.
The equilibrium adsorption capacity and the percentage removal efficiency were computed using the following equations,
q e = ( C 0 C e ) V W
R e m o v a l   ( % ) = ( C 0 C e ) × 100 C 0
where, q e = the amount adsorbed in mg of the solute per gram of the adsorbent at equilibrium, C 0 = the initial fuel concentration in mg per liter of an aqueous solution, C e = the equilibrium fuel concentration in mg per liter of an aqueous solution, V = the solution volume in liters, and W = the adsorbent mass in grams.

3. Batch Isotherm Models

3.1. Langmuir Isotherm Model

This isotherm model correlates the equilibrium contaminant concentration in the solid phase (adsorbent) with that in the aqueous phase. Mathematically, the Langmuir isotherm model is given as [21],
q e = Q m b C e 1 + b C e
where q e (mg/g) is the equilibrium contaminant concentration on the adsorbent, C e (mg/L) is the equilibrium contaminant concentration in the aqueous phase, Q m is the maximum adsorption capacity (mg/g) that corresponds to monolayer coverage, and b is the Langmuir isotherm constant (L/mg). In linearized form, the above equation can be rewritten as [3,22],
( 1 q e ) = 1 b Q m ( 1 C e ) + 1 Q m
A plot of ( 1 q e )   vs .   ( 1 C e ) will result in a straight line of slope 1 b Q m and y-intercept as 1 Q m . The experimental result can, therefore, be used to evaluate the maximum adsorption capacity.

3.2. Freundlich Isotherm Model

This isotherm model correlates the heterogeneous surface containing binding sites to their energies, which can be described as [23],
q e = K F C e 1 / n
where the constant KF ((mg/g)(L/mg)1/n) is a measure of the ‘relative adsorption capacity’ whereas the constant (n) is a measure of the ‘adsorption intensity’. For n > 1 , adsorption is favorable. Linearizing the above equation yields [24,25],
log ( q e ) = log ( K F ) + 1 n log ( C e )
A plot of log ( q e )   vs .   log ( C e ) will result in a straight line of slope 1 n and y-intercept as log ( K F ) .

3.3. Temkin Isotherm Model

The Temkin isotherm model assumes linear variation of the adsorption heat with the coverage of the adsorbent surface. This model is represented as [22],
q e = R T B T ln K T + R T B T ln C e
where B T is the heat of adsorption (kJ/mol) and K T is the Temkin isotherm parameter (L/mg). A plot of q e   vs .   ln ( C e ) will result in a straight line of slope R T B T and y-intercept as R T B T ln K T .

3.4. Coefficient of Determination (R2)

This is the most widely used statistical tool to assess the validity of the model. It is the proportion of the variation in the model predictions from that of the corresponding experimental values that can be represented as follows,
R 2 = 1 S S r e s i d u a l S S t o t a l
where,
S S r e s i d u a l = i = 1 N ( q e , i q m o d e l , i ) 2
S S t o t a l = i = 1 N ( q e , i q e , i ¯ ) 2
q e , i ¯ = 1 N i = 1 N q e , i

3.5. Normalized Standard Deviation Test of Model Validity

For evaluating the isotherm models’ validity, the following expression for the normalized standard deviation is often used,
Δ q ( % ) = 100 × i = 1 N [ ( q e , i q m o d e l , i ) / q e , i ] 2 ( N 1 )
where q e , i and q m o d e l , i are the experimentally obtained data and the isotherm model prediction, respectively, for the ith data point whereas N is the number of experimental data points.

4. Results and Discussion

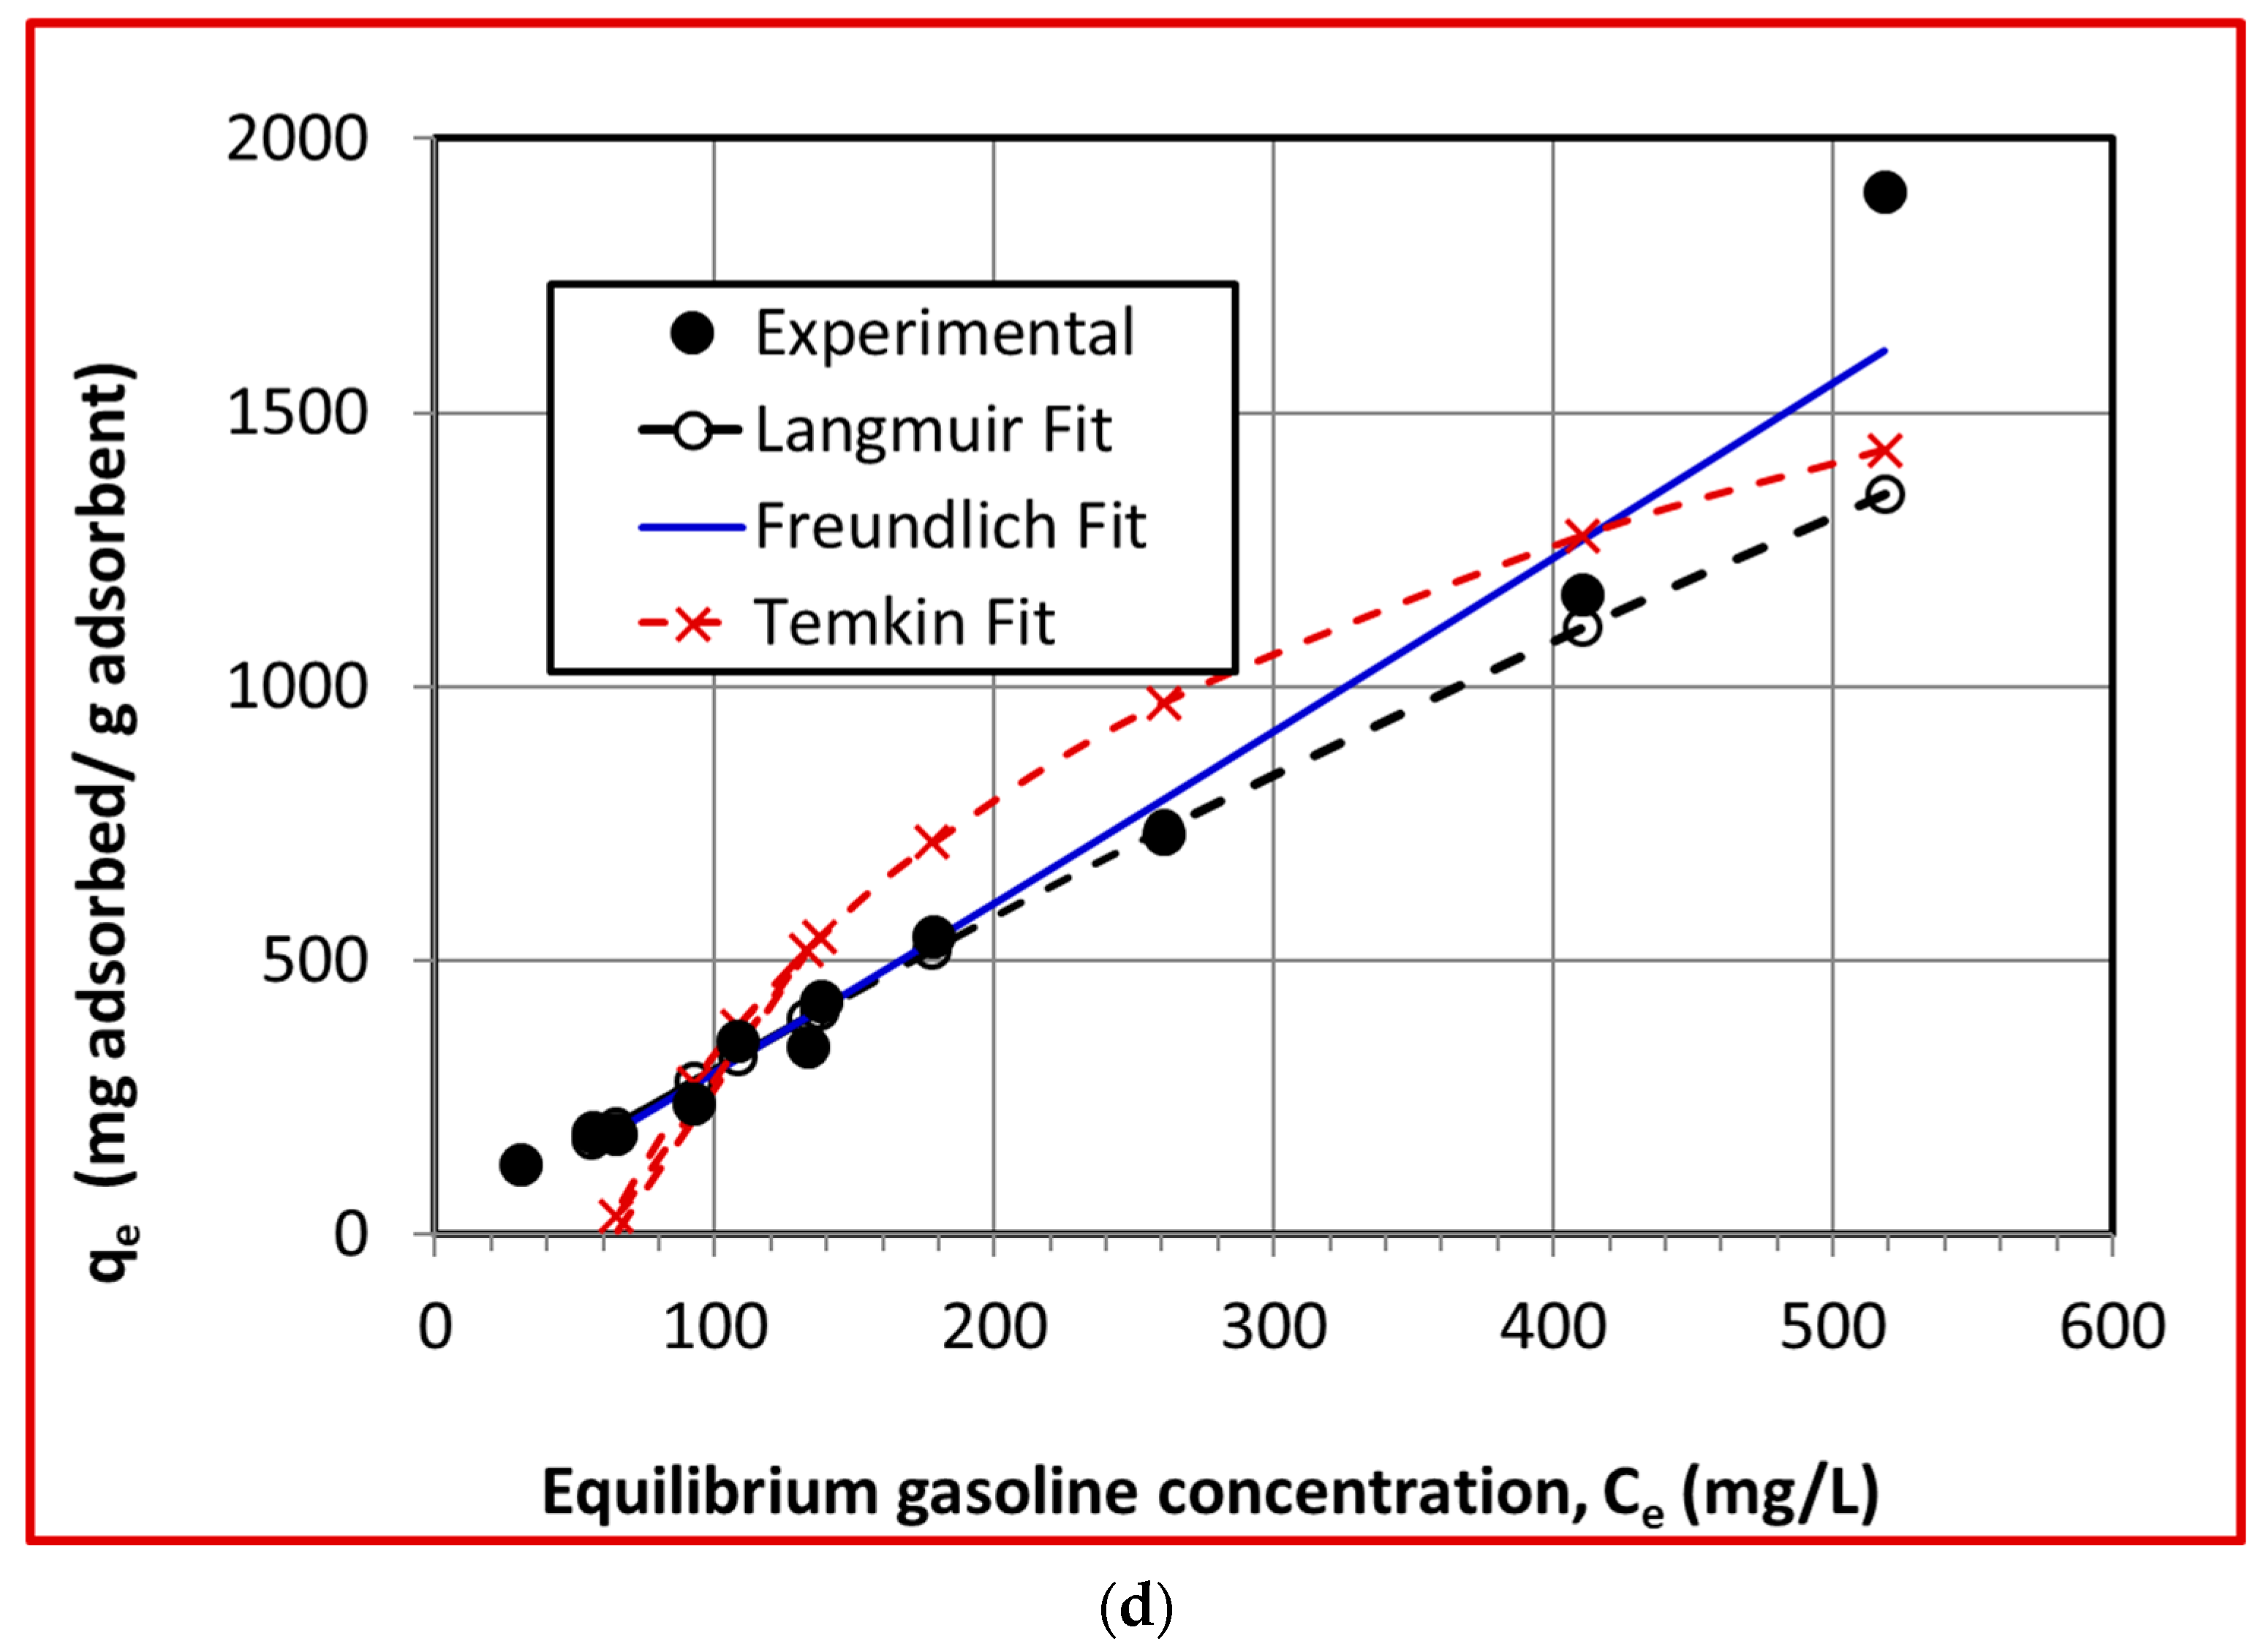
4.1. Gasoline Removal Studies and Isotherm Model Fits

The experimental results are shown in Figure 4. As the amount of the adsorbent was increased, the removal percentage also increased, as seen on the right-hand side ordinate of the figure. Almost 90% removal was obtained when 80 mg of the adsorbent was used in a 40 mL solution of 1000 ppm gasoline. The removal percentage gradually increased to 93.5% and 96.7% when 0.2 g and 0.3 g adsorbents, respectively, were used. The adsorbent also showed high adsorption capacity, as seen on the left-hand side ordinate of the figure. With a small amount of the adsorbent (i.e., 200 mg), the gasoline adsorbed was approximately 1300 mg/g. These results clearly highlight the high efficacy of the adsorbent for the gasoline uptake from the contaminated water.
The fit of the experimental data with the Langmuir isotherm is shown in Figure 5a where q e 1 is plotted against C e 1 according to Equation (6). The coefficient of determination, denoted by R2, quantifies the difference between the actual value of the dependent variable and the one predicted from the independent variable. Ideally, its value is unity for a perfect fit. In the present case, R2 = 0.966 is an indication of a reasonably good description of the batch equilibrium data by the Langmuir isotherm model. The y-intercept in this case is Q m 1 , which, in fact, yields the maximum adsorption capacity of the absorbent. The smaller the y-intercept, the higher the uptake capacity of the adsorbent. For Q m = 8265   m g / g this means that the uptake of gasoline by the adsorbent can reach as high as eight times its own weight. Clearly, activated carbon employed here is an effective adsorbent for the adsorptive removal of the gasoline from the aqueous phase.
The experimental data were also evaluated using the Freundlich isotherm model, as shown in Figure 5b. Note that both abscissa and ordinate of the figure are logarithmic. The plot of C e   vs .   q e is, therefore, linear. Here, R2 = 0.980, which is higher than the 0.966 obtained with the Langmuir isotherm model. Hence, the Freundlich isotherm model provides a better description of the contaminant uptake mechanism of the gasoline by the adsorbent employed in this study. Another feature of the fit is the slope of the straight line, which is close to unity. This indicates that q e depends strongly upon C e in the concentration range considered in this study.
Figure 5c compares the predictions of the Temkin isotherm model with the experimental data. The agreement is clearly seen to be poor. This is further substantiated by the value of the coefficient of determination (R2 = 0.83). Therefore, the underlying assumption of the linear variation of the adsorption heat with the coverage of the adsorbent surface can be ruled out in the present case.
A direct comparison of the experimental data with different isotherm models is shown in Figure 5d, where the linear plot of C e   vs .   q e is presented. This figure further substantiates the conclusions in the foregoing that the Freundlich model best describes the adsorption of the gasoline in this study.
The parameters of the linearized models are reported in Table 1 in addition to R2 and ∆q, evaluated using Equation (13). Clearly, the Freundlich isotherm model best describes the experimental results of the present investigation. Both R2 and ∆q values for the Freundlich isotherm model are superior to the corresponding values of the other two models.

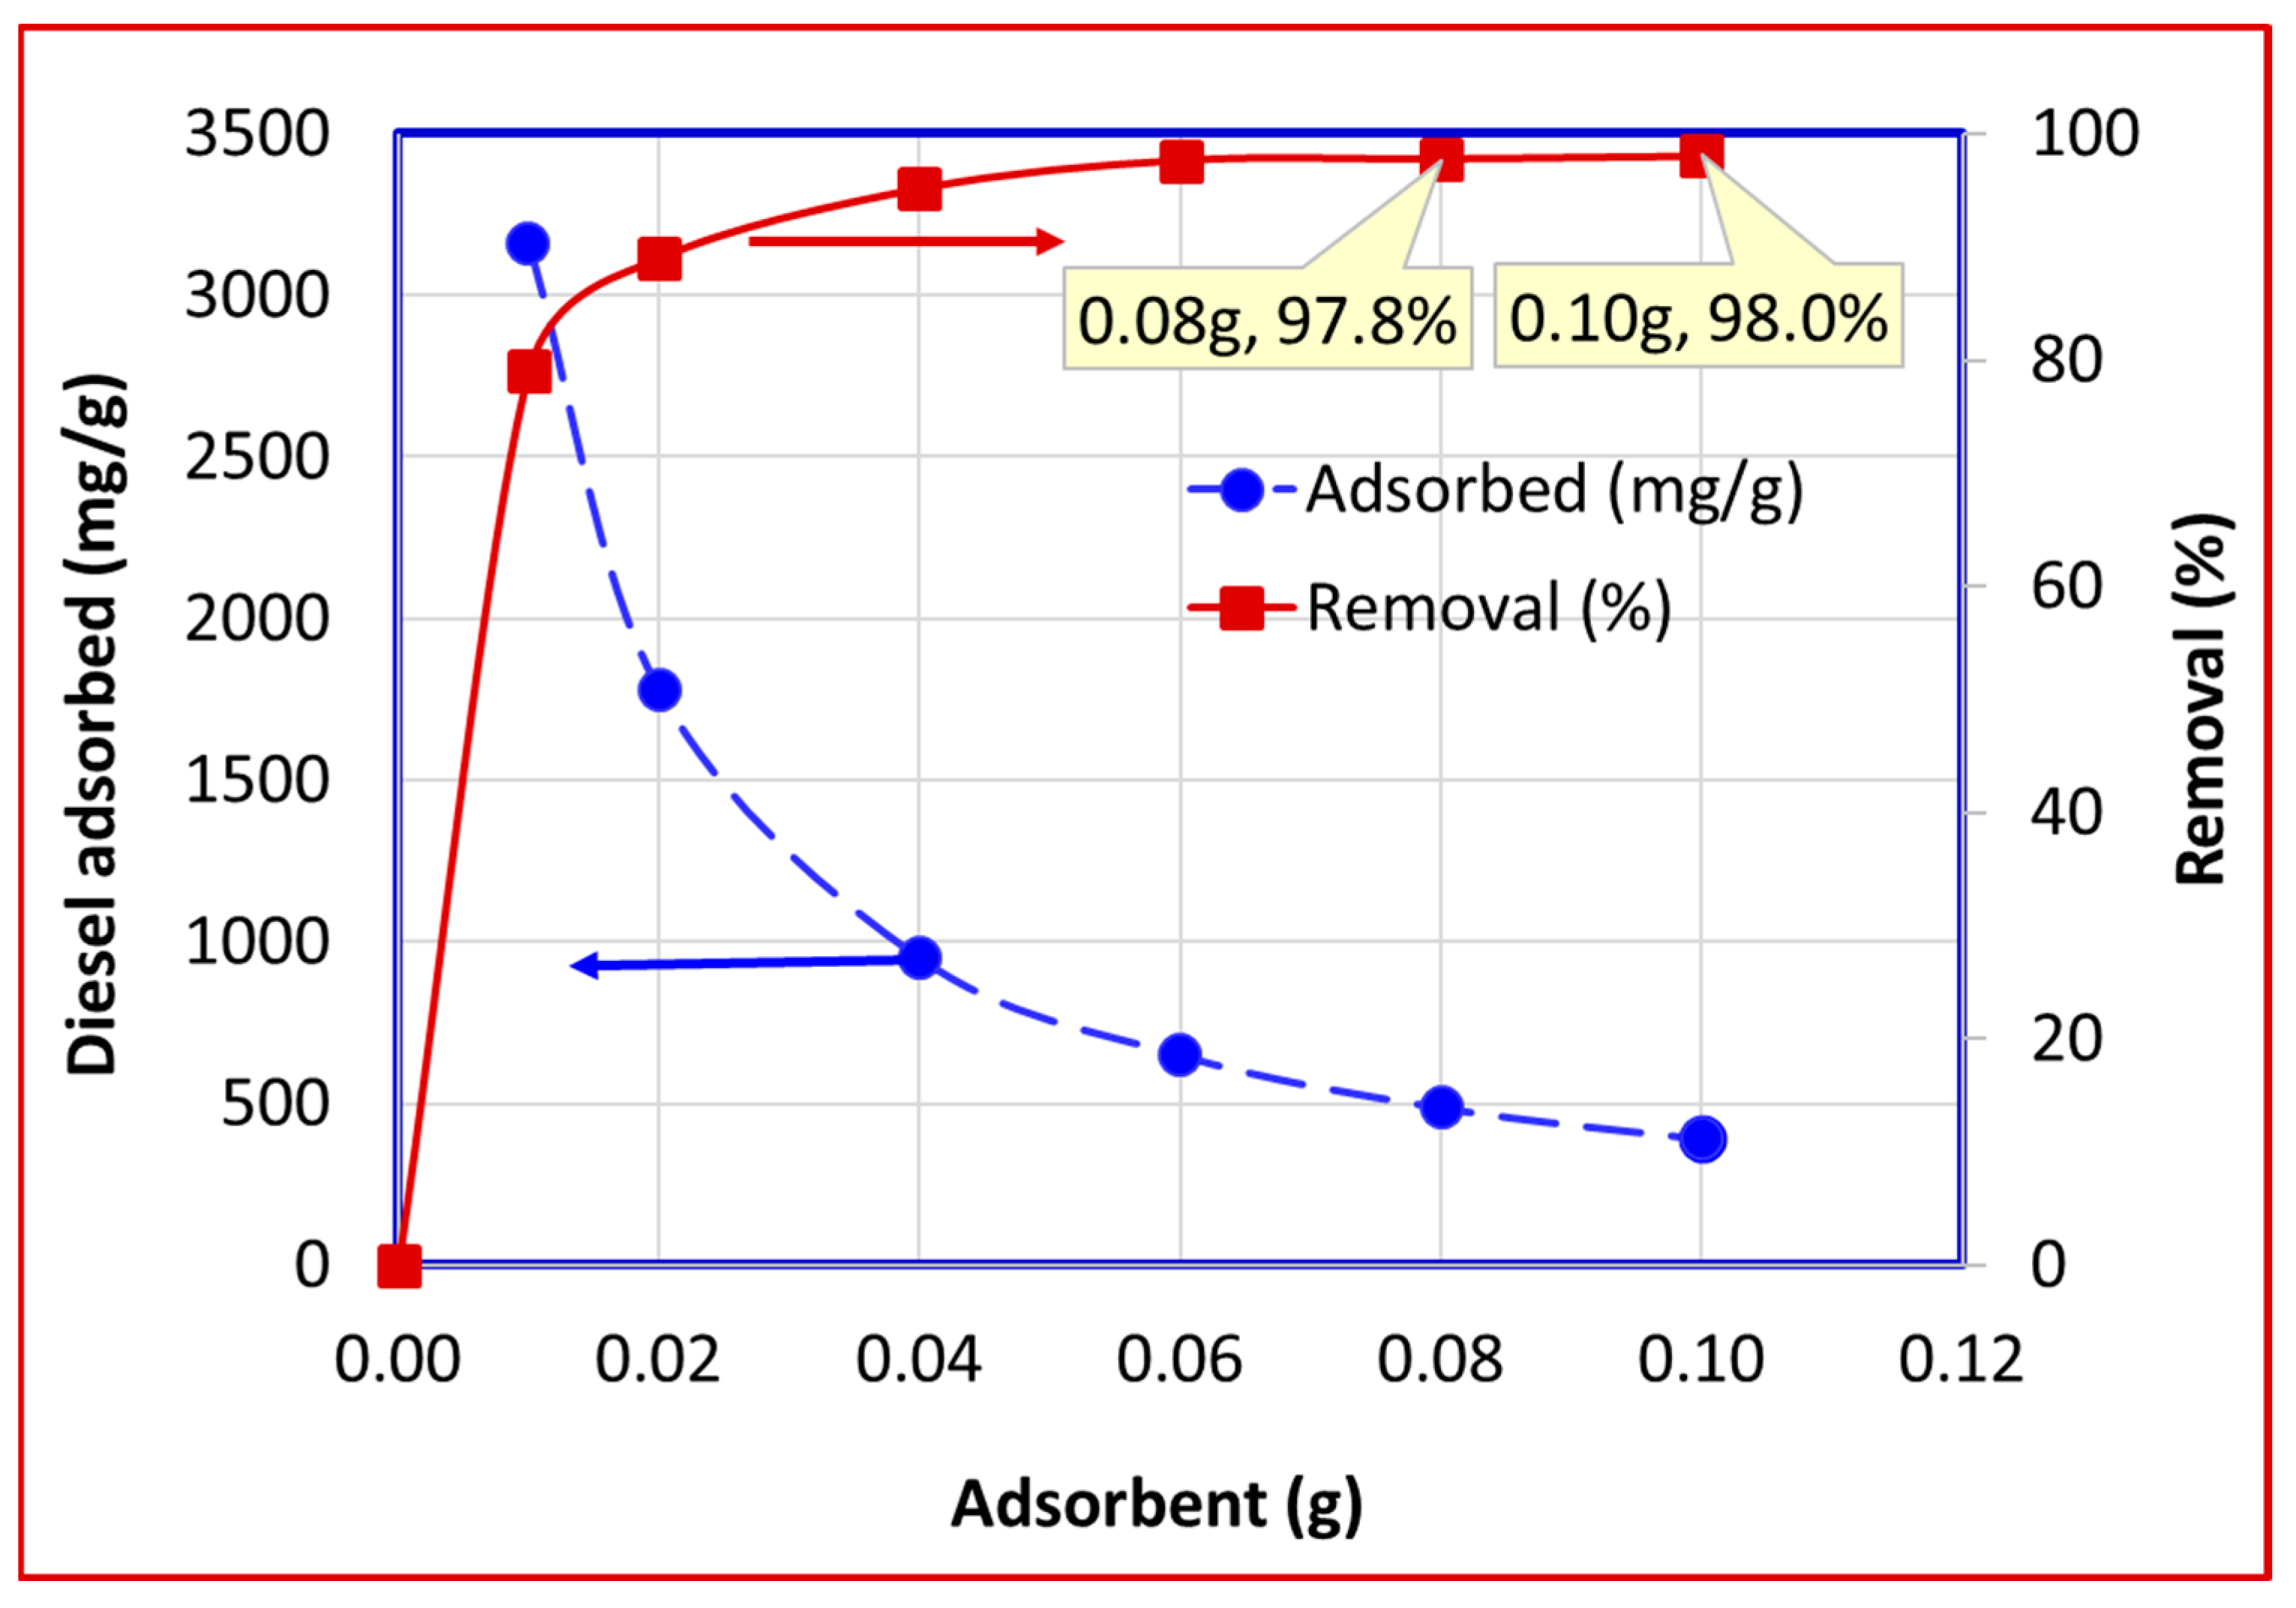
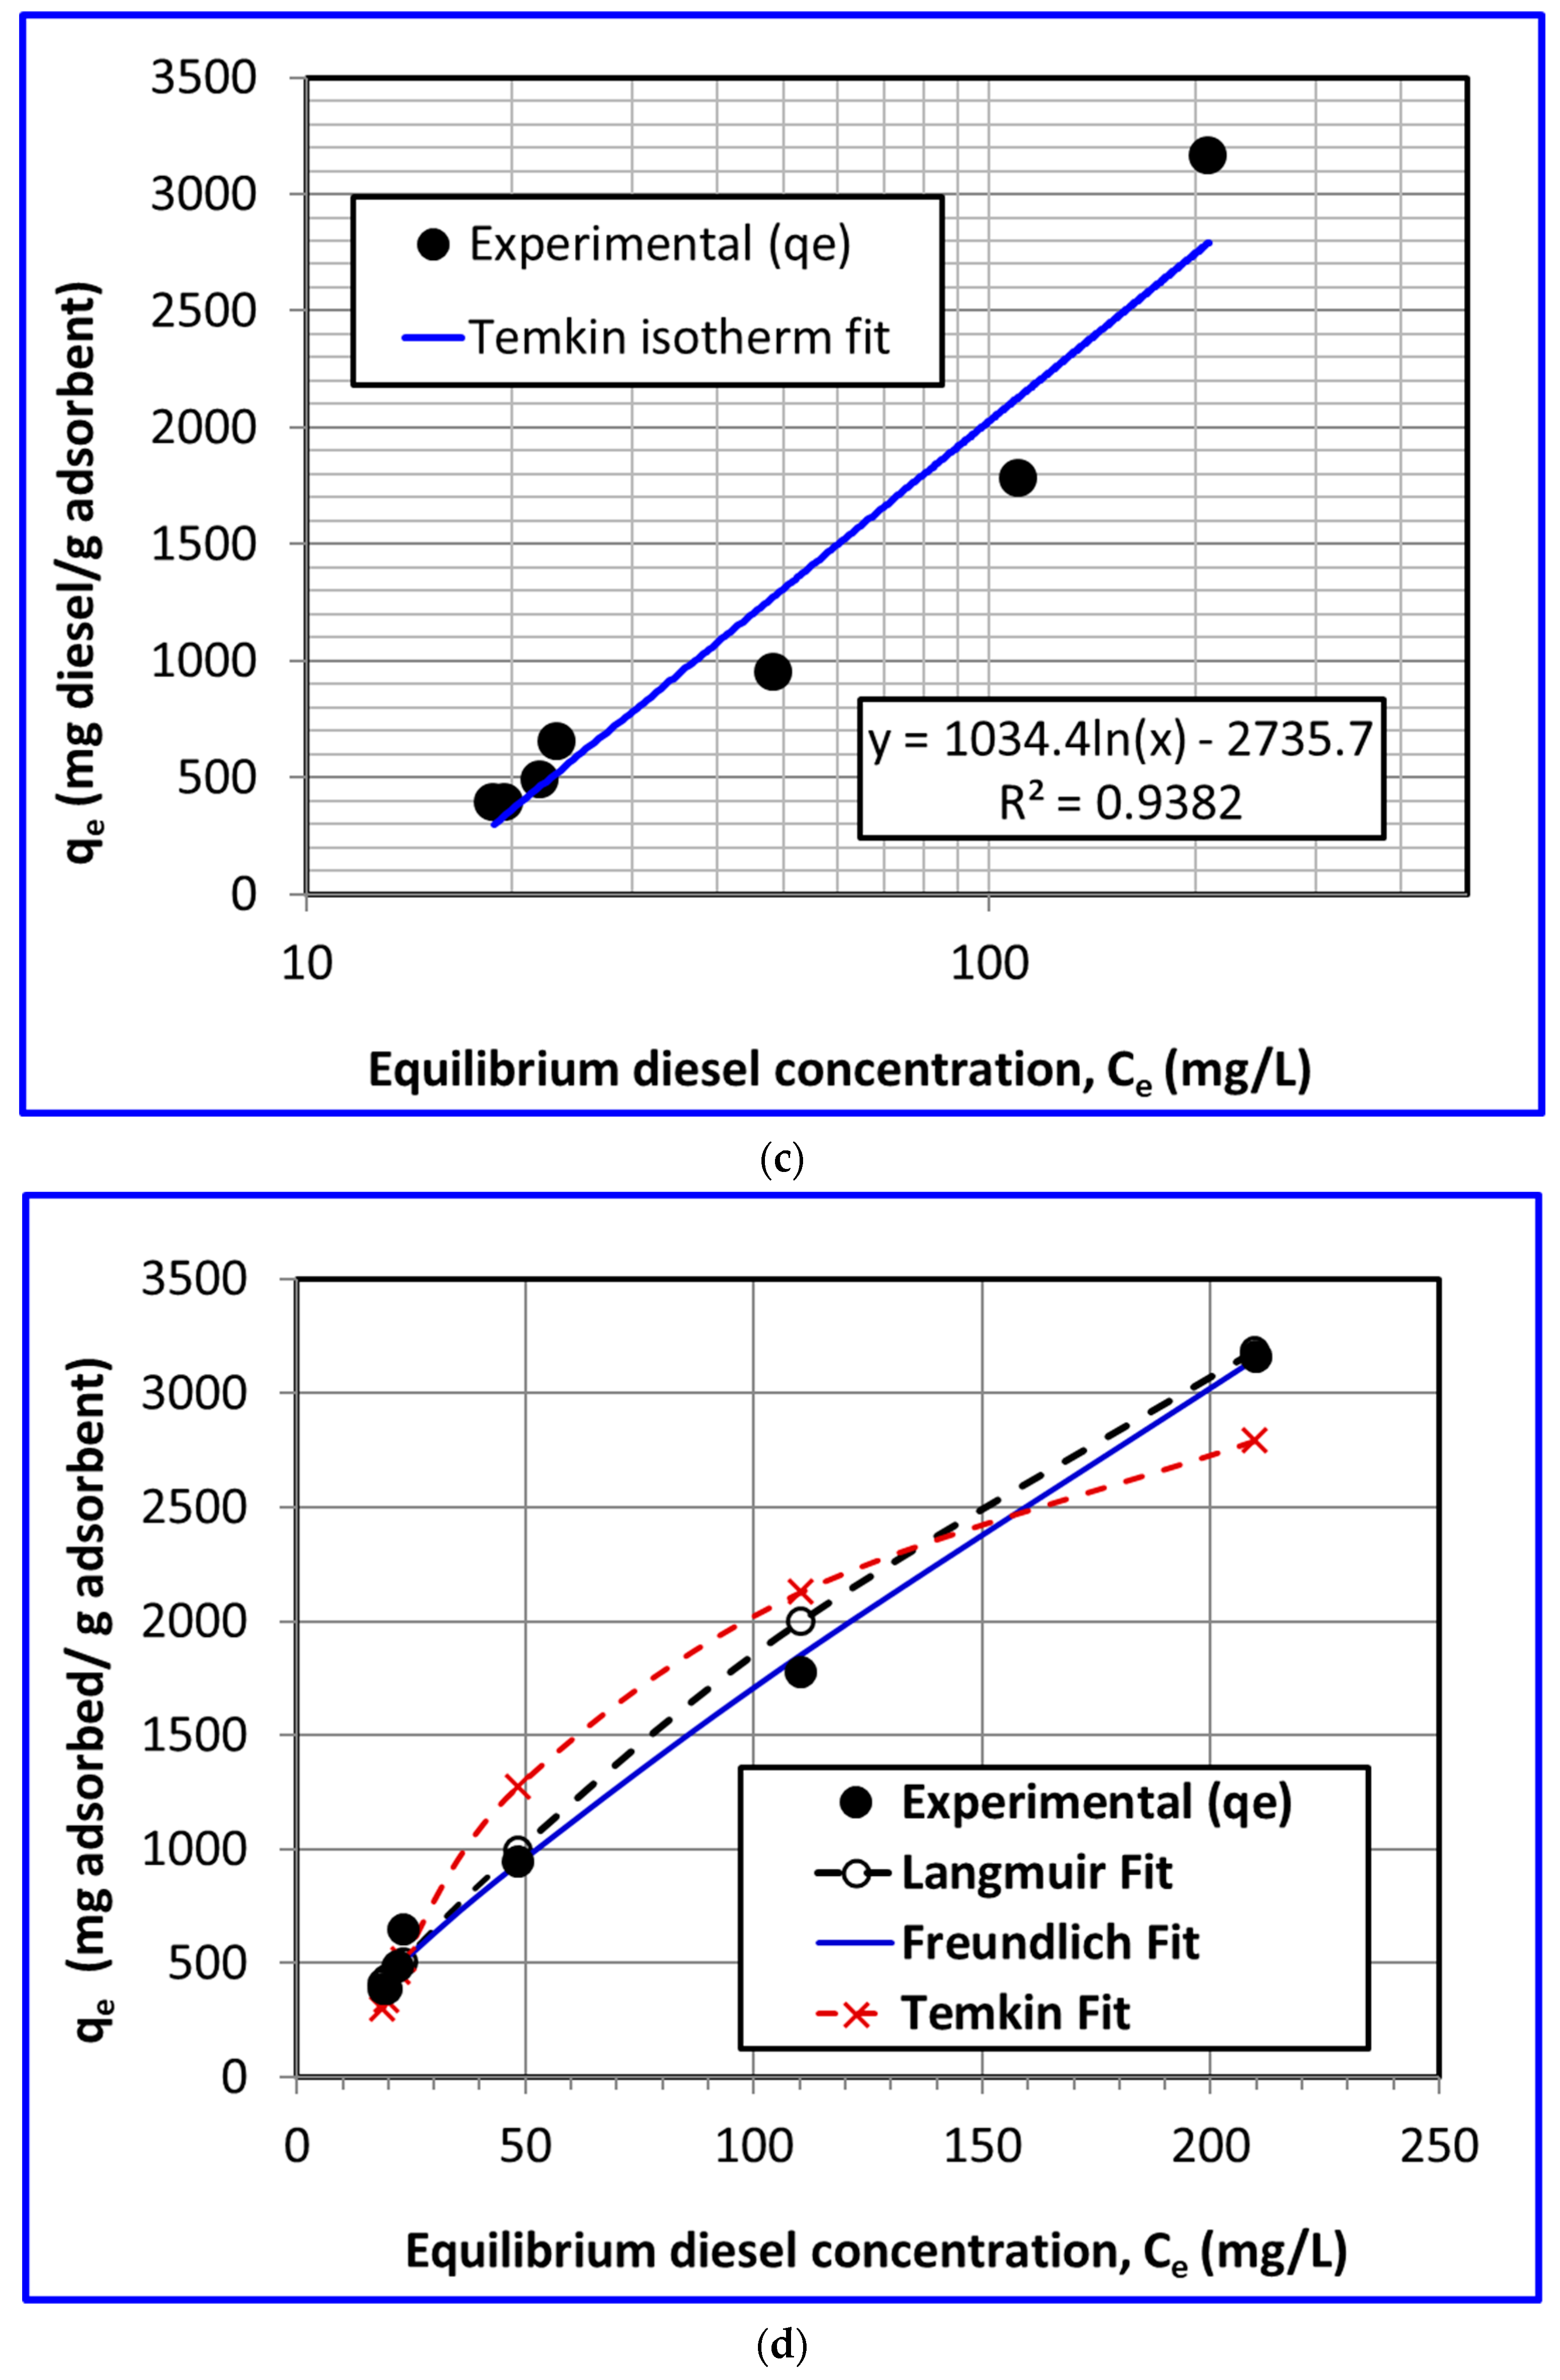
4.2. Diesel Removal Studies and Isotherm Model Fits

Figure 6 shows the experimental results for the removal of another commonly used automobile fuel of diesel. The left-hand side ordinate shows the amount of the solute adsorbed per gram of the adsorbent, while the right-hand side ordinate indicates the removal percentage of the diesel. Clearly, increasing the amount of the adsorbent helped in the removal of the diesel. As shown in the figure callout, almost 97.8% removal efficiency was obtained when 80 mg of the adsorbent was used in a 40 mL solution of 1000 ppm diesel. In this case, the amount of the solute adsorbed was approximately 3.5 g per gram of the adsorbent. Further, increasing the adsorbent dosage to 100 mg did not make any significant impact on the diesel removal. The high adsorption capacity of the adsorbent was also very high, as seen in the figure, which is plotted on the left-hand side ordinate. We obtained more than 3000 mg/g adsorption of the diesel using adsorbent as low as 10 mg. This gives a very good indication of the high efficacy of the adsorbent employed in this study for diesel removal from the aqueous phase.
The prediction of the Langmuir isotherm model with the experimental data for diesel removal is shown in Figure 7a. The figure presents the C e 1 versus q e 1 behavior for both the experimental equilibrium data and the model predictions. The coefficient of determination (i.e., R2) in this case is approximately 0.9475. The low value of the y-intercept, i.e., Q m 1 , is encouraging because the maximum uptake capacity is Q m = 9328   mg / g . Therefore, the maximum diesel uptake capacity of the adsorbent is higher than that of the gasoline, which was found to be Q m = 8265   mg / g .
The comparison of the experimental data with the Freundlich isotherm model is presented in Figure 7b. The agreement in this case is excellent with the R2 = 0.9787. This value is higher than that obtained for the case of the gasoline. This means that the underlying mechanism of the adsorption of the diesel onto the adsorbent is better described by the Freundlich model, correlating the binding process to the surface heterogeneity and the variation in the heat of adsorption. The plot of log C e   vs .   log q e is linear with a slope of 0.83. Although the maximum adsorption capacity is higher for diesel than gasoline, gasoline, owing to its higher slope of 1.03, shows a stronger dependence of the equilibrium adsorption capacity on the equilibrium contaminant concentration compared to the present case of diesel with a slope of 0.8255.
The description of the batch isotherm data by the Temkin model is shown in Figure 7c. The agreement is relatively poor as the value of R2 = 0.94 is lower than the previous two isotherm fits of the Langmuir and the Freundlich models with R2 values of 0.95 and 0.98, respectively.
The comparison of all three isotherm models with the experimental results of the diesel adsorption is presented together in Figure 7d. It clearly shows that the best agreement is obtained with the Freundlich model, followed by the Langmuir and the Temkin models.
The parameters of the linearized models are reported in Table 2 in addition to R2 and ∆q, evaluated using Equation (13). Clearly, the Freundlich isotherm model best describes the experimental results of the present investigation. It is interesting to note that despite a significant difference in the R2 values of the two models, i.e., Langmuir and Freundlich, their difference between their ∆q values are rather insignificant.

5. Conclusions

The adsorptive removal of two different water-contaminating automobile fuels, namely gasoline and diesel, was investigated in this study. For a precise measurement of the contaminant concentration, a total organic content (TOC) analyzer was used. In both cases of the automobile fuels, excellent removal efficacy of the commercial activated carbon employed in this study, owing to its high surface area and pore volume, was found.
The removal percentage of the gasoline reached 97% by using 0.3 g adsorbent with 40-mL and 1000-ppm gasoline solution. The experimental data were fitted with the Langmuir, Freundlich, and Temkin isotherm models. The Freundlich model best-described gasoline adsorption with the coefficient of determination (R2) value of 0.98. There was a strong correlation between the uptake capacity with the gasoline concentration at equilibrium. The maximum adsorption capacity in this case was predicted to be 8.3 g gasoline per gram adsorbent used.
For the case of diesel, 98% removal was obtained by using only 0.1 g adsorbent with 40-mL and 1000-ppm diesel solution. This shows that the present adsorbent is highly effective for the removal of diesel from contaminated water. Once again, the Freundlich isotherm model provided the best description of the experimental results. The coefficient of determination for the diesel was 0.979 compared to 0.948 and 0.938 obtained with the Langmuir and Temkin models. The maximum diesel adsorption capacity of the adsorbent was predicted to be 9.33 g/g by the Langmuir model.
In view of the high efficacy of the low-cost commercial activated carbon for the adsorptive removal of automobile fuel from water, the use of an alternative adsorbent developed on a small scale in laboratories needs strong justification.

Author Contributions

Conceptualization, M.A. and M.M.B.; methodology, M.A., N.S.K. and E.H.A.-G.; software, M.A.; validation, M.A. and E.H.A.-G.; formal analysis, M.A.; investigation, M.A.; resources, M.S.; data curation, E.H.A.-G.; writing—original draft preparation, M.A.; writing—review and editing, M.A., M.M.B., N.S.K. and M.S.; visualization, M.A.; supervision, M.A.; project administration, M.A., M.M.B., N.S.K. and M.S.; funding acquisition, M.A. All authors have read and agreed to the published version of the manuscript.

Funding

National Plan for Science, Technology, and Innovation (MAARIFAH), King Abdulaziz City for Science and Technology, Kingdom of Saudi Arabia, Award number (13-WAT1250-02).

Data Availability Statement

Not applicable.

Acknowledgments

This project was funded by the National Plan for Science, Technology, and Innovation (MAARIFAH), King Abdulaziz City for Science and Technology, Kingdom of Saudi Arabia, Award number (13-WAT1250-02).

Conflicts of Interest

The authors declare no conflict of interest.

References

  1. Ergas, S.J.; Chang, D.P.Y.; Schroeder, E.D. Bioremediation Principles, 1st ed.; William C Brown Pub: Dubuque, IA, USA, 1999. [Google Scholar]
  2. Liang, H.; Esmaeili, H. Application of nanomaterials for demulsification of oily wastewater: A review study. Environ. Technol. Innov. 2021, 22, 101498. [Google Scholar] [CrossRef]
  3. Syed, S.; Alhazzaa, I.; Asif, M. Treatment of oily water using hydrophobic nano-silica. Chem. Eng. J. 2011, 167, 99–103. [Google Scholar] [CrossRef]
  4. Abdullah, T.A.; Juzsakova, T.; Hafad, S.A.; Rasheed, R.T.; Al-Jammal, N.; Mallah, M.A.; Salman, A.D.; Le, P.C.; Domokos, E.; Aldulaimi, M. Functionalized multi-walled carbon nanotubes for oil spill cleanup from water. Clean Technol. Environ. Policy 2022, 24, 519–541. [Google Scholar] [CrossRef]
  5. Shokry, H.; Elkady, M.; Salama, E. Eco-friendly magnetic activated carbon nano-hybrid for facile oil spills separation. Sci. Rep. 2020, 10, 10265. [Google Scholar] [CrossRef] [PubMed]
  6. Lico, D.; Vuono, D.; Siciliano, C.; B.Nagy, J.; De Luca, P. Removal of unleaded gasoline from water by multi-walled carbon nanotubes. J. Environ. Manag. 2019, 237, 636–643. [Google Scholar] [CrossRef]
  7. De Nino, A.; Olivito, F.; Algieri, V.; Costanzo, P.; Jiritano, A.; Tallarida, M.A.; Maiuolo, L. Efficient and Fast Removal of Oils from Water Surfaces via Highly Oleophilic Polyurethane Composites. Toxics 2021, 9, 186. [Google Scholar] [CrossRef]
  8. Kosheleva, R.I.; Kyzas, G.Z.; Kokkinos, N.C.; Mitropoulos, A.C. Low-Cost Activated Carbon for Petroleum Products Clean-Up. Processes 2022, 10, 314. [Google Scholar] [CrossRef]
  9. Nekouei, F.; Noorizadeh, H.; Nekouei, S.; Asif, M.; Tyagi, I.; Agarwal, S.; Gupta, V.K. Removal of malachite green from aqueous solutions by cuprous iodide–cupric oxide nano-composite loaded on activated carbon as a new sorbent for solid phase extraction: Isotherm, kinetics and thermodynamic studies. J. Mol. Liq. 2016, 213, 360–368. [Google Scholar] [CrossRef]
  10. Tan, K.L.; Foo, K.Y. Chapter 13—The viable role of activated carbon for the effective remediation of refinery and petrochemical wastewaters. In Petroleum Industry Wastewater; El-Naas, M.H., Banerjee, A., Eds.; Elsevier: Amsterdam, The Netherlands, 2022; pp. 185–203. [Google Scholar] [CrossRef]
  11. Rafatullah, M.; Sulaiman, O.; Hashim, R.; Ahmad, A. Adsorption of methylene blue on low-cost adsorbents: A review. J. Hazard. Mater. 2010, 177, 70–80. [Google Scholar] [CrossRef]
  12. Njoku, V.O.; Asif, M.; Hameed, B.H. 2,4-Dichlorophenoxyacetic acid adsorption onto coconut shell-activated carbon: Isotherm and kinetic modeling. Desalin. Water Treat. 2015, 55, 132–141. [Google Scholar] [CrossRef]
  13. Ying, Z.W.; Zhang, T.Y.; Li, H.; Liu, X.Q. Adsorptive removal of aflatoxin B1 from contaminated peanut oil via magnetic porous biochar from soybean dreg. Food Chem. 2023, 409, 10. [Google Scholar] [CrossRef] [PubMed]
  14. Yu, L.; Han, M.; He, F. A review of treating oily wastewater. Arab. J. Chem. 2017, 10, S1913–S1922. [Google Scholar] [CrossRef]
  15. Manafi, M.R.; Manafi, P.; Agarwal, S.; Bharti, A.K.; Asif, M.; Gupta, V.K. Synthesis of nanocomposites from polyacrylamide and graphene oxide: Application as flocculants for water purification. J. Colloid Interface Sci. 2017, 490, 505–510. [Google Scholar] [CrossRef] [PubMed]
  16. Elhady, S.; Bassyouni, M.; Mansour, R.A.; Elzahar, M.H.; Abdel-Hamid, S.; Elhenawy, Y.; Saleh, M.Y. Oily Wastewater Treatment Using Polyamide Thin Film Composite Membrane Technology. Membranes 2020, 10, 84. [Google Scholar] [CrossRef]
  17. Kayvani Fard, A.; Rhadfi, T.; McKay, G.; Al-marri, M.; Abdala, A.; Hilal, N.; Hussien, M.A. Enhancing oil removal from water using ferric oxide nanoparticles doped carbon nanotubes adsorbents. Chem. Eng. J. 2016, 293, 90–101. [Google Scholar] [CrossRef]
  18. Ma, J.Y.; Wu, G.Y.; Zhang, R.; Xia, W.; Nie, Y.; Kong, Y.L.; Jia, B.T.; Li, S. Emulsified oil removal from steel rolling oily wastewater by using magnetic chitosan-based flocculants: Flocculation performance, mechanism, and the effect of hydrophobic monomer ratio. Sep. Purif. Technol. 2023, 304, 122329. [Google Scholar] [CrossRef]
  19. Raymundo-Piñero, E.; Azaïs, P.; Cacciaguerra, T.; Cazorla-Amorós, D.; Linares-Solano, A.; Béguin, F. KOH and NaOH activation mechanisms of multiwalled carbon nanotubes with different structural organisation. Carbon 2005, 43, 786–795. [Google Scholar] [CrossRef]
  20. Nandi, R.; Jha, M.K.; Guchhait, S.K.; Sutradhar, D.; Yadav, S. Impact of KOH Activation on Rice Husk Derived Porous Activated Carbon for Carbon Capture at Flue Gas alike Temperatures with High CO2/N2 Selectivity. ACS Omega 2023, 8, 4802–4812. [Google Scholar] [CrossRef]
  21. Langmuir, I. The Adsorption of Gases on Plane Surfaces of Glass, Mica and Platinum. J. Am. Chem. Soc. 1918, 40, 1361–1403. [Google Scholar] [CrossRef]
  22. Basu, A.; Ali, S.S.; Hossain, S.S.; Asif, M. A Review of the Dynamic Mathematical Modeling of Heavy Metal Removal with the Biosorption Process. Processes 2022, 10, 1154. [Google Scholar] [CrossRef]
  23. H.R., P. Kapillarchemie, Eine Darstellung der Chemie der Kolloide und verwandter Gebiete. Nature 1911, 85, 534–535. [Google Scholar] [CrossRef]
  24. Kumar, N.S.; Shaikh, H.M.; Asif, M.; Al-Ghurabi, E.H. Engineered biochar from wood apple shell waste for high-efficient removal of toxic phenolic compounds in wastewater. Sci. Rep. 2021, 11, 2586. [Google Scholar] [CrossRef] [PubMed]
  25. Siva Kumar, N.; Asif, M.; Poulose, A.M.; Suguna, M.; Al-Hazza, M.I. Equilibrium and Kinetic Studies of Biosorptive Removal of 2,4,6-Trichlorophenol from Aqueous Solutions Using Untreated Agro-Waste Pine Cone Biomass. Processes 2019, 7, 757. [Google Scholar] [CrossRef]
Figure 1. SEM images of the activated carbon sample at two different magnifications with different inset scales (a) 200 µm, (b) 20 µm.
Separations 10 00493 g001
Figure 2. Cumulative pore size and pore volume variation with the pore size for the adsorbent sample. Insets show the pore size and corresponding value of ordinate.
Separations 10 00493 g002
Figure 3. Photographs of the filtered emulsified oil solutions after contact with different amounts of adsorbent.
Separations 10 00493 g003
Figure 4. Variation in the gasoline adsorption and removal capacity with the adsorbent amount. Insets show adsorbent mass and corresponding removal percentage of the gasoline.
Separations 10 00493 g004
Figure 5. Equilibrium isotherm fits of gasoline for various isotherm models (a) Langmuir, (b) Freundlich, (c) Temkin, and (d) direct model predictions’ comparison with experimental data.
Separations 10 00493 g005aSeparations 10 00493 g005bSeparations 10 00493 g005c
Figure 6. Variation in the diesel adsorption and removal capacity with the adsorbent amount.
Separations 10 00493 g006
Figure 7. Equilibrium isotherm fits for diesel for isotherm models (a) Langmuir, (b) Freundlich, (c) Temkin, and (d) model predictions’ comparison with experimental data.
Separations 10 00493 g007aSeparations 10 00493 g007b
Table 1. Parameters of the linearized isotherm models for gasoline removal.
Isotherm ModelSlopeInterceptR2q(%)
Langmuir0.32090.000120.965613.2
Freundlich1.03000.41180.979711.0
Temkin670.5721−2759.34070.831558.3
Table 2. Parameters of the linearized isotherm models for the adsorptive removal of diesel.
Isotherm ModelSlopeInterceptR2q(%)
Langmuir0.04340.00010.94759.3
Freundlich0.82551.58180.97879.0
Temkin1034.3979−2735.70570.938217.8
Disclaimer/Publisher’s Note: The statements, opinions and data contained in all publications are solely those of the individual author(s) and contributor(s) and not of MDPI and/or the editor(s). MDPI and/or the editor(s) disclaim responsibility for any injury to people or property resulting from any ideas, methods, instructions or products referred to in the content.

