Article

Morphology of Particulate Structures on a Fiber Array before and at Clogging Point of an Aerosol Filtration Process

Institute of Mechanical Process Engineering and Mechanics, Karlsruhe Institute of Technology, Straße am Forum 8, 76131 Karlsruhe, Germany
*
Author to whom correspondence should be addressed.
Separations 2023, 10(9), 462; https://doi.org/10.3390/separations10090462
Submission received: 17 July 2023 / Revised: 18 August 2023 / Accepted: 21 August 2023 / Published: 23 August 2023
(This article belongs to the Topic Advances in Chemistry and Chemical Engineering)

Abstract

:
Fundamental microscopic investigations are based on the interaction between filter fiber and particles. The fibrous filter theory is based on a single fiber of a fiber array, and experiments focus either on a single fiber or a fiber array. This study investigates the particle loading process of a fiber array and focuses on the microscopic development of particle structures on the fiber array. Gravimetric measurements and image analysis of the array were used to study the development of the particle structure and morphology. Microscopic analysis of the video data focused on the evolution of particle accumulation within the fiber spacing, the development of boundary lines of the particle structure, and the number/size of bridges and pores within the particle structure. For the tested flow velocities, an increase in mass was observed to increase the duration of the filtration process. An extreme increase in deposited mass was observed at the moment of complete blocking (clogging) of the fiber spacing at flow velocities of 0.65 m/s. The size of pores (hydraulic diameter) increased with the flow velocity during the loading procedure. However, the total number of pores was higher in tests with lower Stokes numbers due to the dendritic and more porous structure. This work provides insights into the growth kinetics and structural setup of the particle structure (on a microscopic level). This will improve the understanding of the change of the filtration process from the transition phase to the clogging phase in fibrous filters.

1. Introduction

Fibrous filters are applied for various purposes, including the removal of particles from gases in process plants or maintaining the safe air quality of air-conditioning systems. The behavior of pressure drop, separation efficiency, and total loading capacity is critical for characterizing a filtration process with depth filters and the filter lifetime. The characteristic trend of the pressure drop can be divided into three stages during the filtration process. Filter hardware parameters that affect the duration of these stages include the porosity of the filter medium in the initial state (fiber diameter and spacing) and the thickness of the filter medium. The characteristics of the concentration of aerosol, such as particle size/distribution, particle material density, aerosol flow velocity, and viscosity of the continuous phase, also play a role in influencing the different stages of the pressure drop. The pressure drop across the filter is caused by the clogging of particulate material in the unobstructed area between the fibers. The kinetics of the clogging process, which is dependent on the morphology of the particle structure, directly affects the development of the pressure drop. The morphology of particle structures within a filter may vary with the applied filtration parameter. At the beginning of the filtration process, a unique particle structure forms on each individual fiber. Later on, structures on neighboring fibers may interact and even merge.
In the initial phase of filtration, particles are deposited on the unoccupied fibers of the filter, resulting in a slow increase in pressure drop with the deposited mass. The progression of the pressure drop in the depth filtration phase and subsequent phases is shown in Figure 1 on the left. If the particle size and density are constant, the morphology of the particle structure on each fiber is primarily influenced by the flow velocity. Figure 1 right (a) illustrates the deposition process on the unoccupied fibers during this first phase, assuming a constant density and size of the particles. In the second phase (Figure 1 right (b)), particles continue to separate on already existing structures, causing changes in the flow field around the fibers. The previously deposited structures reduce the free space between fibers, resulting in an increase in pressure drop [1,2]. This non-linear increase in pressure drop is visible in the transition phase in Figure 1 on the left.
Particle structures built at positions on the fiber with a large angle to the stagnation point are more likely to grow into the fiber spacing. As shown by Kanaoka et al., Müller et al., and Zoller et al., a dendritic type of structure develops at low Stokes numbers [3,4,5]. Structures deposited by inertia when flow stagnates may also grow into the spacings.
In addition to the increase in pressure drop in the second stage (transition phase), the area for separation at the collector increases, too. The transition stage is between the depth filtration stage and the subsequent surface phase.
In the third phase (surface filter phase), the particles start to build a filter cake on the surface of the filter (see Figure 1 right (c)). The pressure drop increases proportionally to the deposited particle mass and filtration time (see Figure 1 left) [1,6,7]. The deposition of particles on the filter surface comes along with a complete closing (clogging) of fiber interspaces. This produces a gradient in the deposited mass along the filter depth because further particulate material cannot travel deeper/downstream into void filter layers [8].
A possible solution to open closed interspaces within a filter is to introduce stress into the separated particulate material by stretching the filter matrix. Previous studies have shown that particles can be detached by vibration or magnetic excitation of the collector [9,10]. Experiments with a single fiber collector have demonstrated that stretching up to 39 % can initiate the re-arrangement and detachment of particle structures from the surface of the collector [11,12]. During stretching, the elongation of the substrate generates shear and tensile stresses within the particle structure, resulting in cracking and a reduction of contact points that weakens the particle structure. As the polymer substrate is stretched, the fiber’s surface changes, reducing the adhesive forces between individual particles and the fiber [13]. In experiments with a single fiber, only one-dimensional stress states have been investigated so far. Stretching of arrays of stretchable fibers is expected to result in a multiple stress state. However, to ensure the best knowledge about the initial state of the particle structure on the array, it is necessary to generate and characterize particle structures of different morphologies before the stretching experiments. Furthermore, it is crucial to understand the detailed development of structure morphology on the collector before and at the clogging point (CP), which is the primary cause of pressure drop and filter cake formation. While pressure drop analysis is often sufficient to evaluate the performance of the filtration system, it is important to recognize the role of particle structure development on the collectors and its influence on pressure drop development. In addition, understanding the timing and conditions under which particle structures build up, as well as their stability and fragility during tests (before or at the clogging point), is important when applying shear stress to detach structures. As previously mentioned, the clogging point represents a changing point where the structures in the filter close upstream pores, and the structure may change. Consequently, this study investigates the evolution of various particle structures on a fiber array. The fibers have a defined spacing representing a simplified version of the overall filter system, similar to the studies by Müller et al. [14,15].

Clogging Point and Characteristic Morphology of Structures on a Collector

Clogging of particulate material on or in a collector matrix occurs when the continuous accumulation of particle mass causes a transition from depth filtration to surface filtration [16]. This transition point, also known as the upper transition point, is the point at which the pressure loss vs. mass curve returns to a linear slope [1]. Alternatively, it may be identified as the intersection of tangents at the beginning (depth filter phase) and during the surface filter phase [17]. ASHRAE 52-76 defines the clogging point as the point where mass accumulation occurs at the end of the pressure drop curve [18]. Kanaoka et al. describe the clogging point where particles start to separate on the filter cake or by particles that have already been separated, resulting in a continuous linear increase in pressure drop across the filter [2]. DEM simulations have shown closure of spaces between fibers starts in the transition phase and is completed by the end of this phase [19]. Similarly, Valdes et al. demonstrated that there is a critical gap distance for bridge formation, above which a bridge is well-formed and difficult to dissolve. They used the force chain model to describe the forces of particle contacts [20]. Some studies refer to the second phase as the clogging phase, representing the change from depth filtration to surface filtration. Zhang et al. note the lack of a clear definition of the clogging point with regard to particle separation on the collector [21].
The velocity rate for the filling of fiber interspaces during the filtration process is a function of the development of morphology of the particle structure on the collector, which is influenced by the applied process conditions [3]. The pressure drop is a function of the unobstructed area in the filter.
A lateral dendritic structure on the fibers promotes the formation and merging of numerous small bridges in the interspaces of the fiber, while a compact structure is likely to grow in the direction of flow and may never merge with neighboring particle structures. Tao et al. investigated this angle-dependent behavior in their calculations [19]. To consider these effects, dendritic structures, structures in transitional state, and pure compact morphologies are examined in this study.
To understand the deposition process of particles in a complete filter, investigations and observations on a single fiber or a fiber array are a common research method in the field of depth filtration [4,22]. Hardly any studies in the literature have been published on the particulate accumulation process prior to and during clogging at a single fiber array containing polydisperse materials. Previous studies focused on the overall filtration performance in a complete filter [23,24,25,26,27]. To conduct these observations, the focus should shift from a whole filter medium to a fiber array or a single fiber collector, as Zhang et al. suggested [21]. Particle separation on the microscopic level can be observed and quantified better in these arrangements. An interesting aspect on the microscopic level is the evolution of the number and size of individual pores and bridges as a function of the morphology within a certain range of Stokes numbers (0.52–10.05). Further aspects for research are the development kinetics of single structures and their shape and appearance on the fiber array.

2. Experimental Methods

2.1. Fiber Array and Particulate Material

In previous investigations, experiments concerning the behavior of separation and detachment were conducted on a single fiber [11,12]. To investigate the influence of the neighboring fibers as in a real filter medium, in this paper, all experiments were performed on an array consisting of five equally spaced parallel fibers in a plane perpendicular to the flow. For uniform spacing of the fibers, they were tightly clamped in combs with a spacing (center-to-center) of exactly 246 μm [15]. The fibers were made of polyurethane and had a diameter of 82 μm. The material composition enabled reversible stretching up to 75% [11]. Prior to clamping, the fibers were in a crimped state. Figure 2 depicts the clamping device with the five parallel fibers. The fibers had a clamped length of 53 mm. Before each gravimetric detection of the collected mass and growth analysis, the fiber clamping device was cleaned with isopropanol and compressed air to obtain a blank mass for each test. Any contamination by fat or particulate material was avoided.
The fibers were loaded with polydisperse and inert particle material (Spheriglass 5000CP00, soda lime A-glass). The x 50 , 3 = 7.73 μm of the distribution were used to calculate the characteristic Stokes, Péclet, and Reynolds numbers and the interception parameter. The particulate material had a material density and a bulk density ( ρ m a t e r i a l = 2.46 g cm 3 , ρ b u l k = 1.28 g cm 3 , n r e f r a c t i v e i n d e x = 1.51) and was obtained from Potters Industry [11].

2.2. Particulate Loading and Gravimetric Measurements of Particle Structure on the Fiber Array

The particle loading process of the array was performed in a 16 mm free jet airflow at different flow velocities.
Figure 3 shows the flow diagram of the loading procedure. The aerosol with a volume flow of 26.3 l/min (feed flow) was generated with the SAG 410/U by Topas, which was already used in the studies of Zoller et al., Wang et al., and Papapostolou et al. [5,29,30]. Particle dispersion is achieved by sucking the particulate material from a steel ring using a venturi nozzle. Any interruptions or irregularities in the particle loading of the ring can lead to irregular dispersion. Because of that, continuous monitoring and a constant scraper height are necessary. Further, the aerosol is neutralized using an 85 Kr-neutralizer.
A loading flow was discharged from the feed flow. The rest of the feed flow was drained off as an excess flow. The particulate material was removed by a HEPA filter. The loading flow was directed through the inlet pipe, which includes a flow rectifier (diameter 16 mm), and passed into the loading chamber where it approached the array. The camera and optical equipment were positioned at the top of the inlet pipe, where an air junction provided optical access for observation (see Figure 3). Downstream of the fiber array, an HEPA filter was used to remove the remaining particulate material. The loading flow rate was controlled using a mass flow controller (MFC).
Table 1 shows the volume flow of the corresponding airflow velocity, the characteristic numbers Reynolds R e , Stokes S t , Péclet P e , the interception parameter R, and the bounce parameter β . The particle bounce parameter β introduced by Kasper et al. is proportional to the ratio of Stokes S t and interception parameter R for a constant combination of materials (see Equation (1)). The calculation of the onset of the bounce of particles is based on the diameter of the particle x ( in μ m ) and the velocity of air flow u (in m). The parameter enables a categorization of the morphology of particle structures (consisting of monodisperse particles) on the fiber [31]. A description of this relationship has also been shown by Hiller et al. and Brach and Dunn [32,33].
S t R = β ρ m a t e r i a l 18 μ
β = x · u
To compare experiments with different airflow velocities, a characteristic time-integrated flux (TIF) is defined, which serves as the independent variable, describing the evolution of the fiber loading process. This enables comparison of experiments with different particle concentrations and airflow velocities.
To calculate the TIF for the respective airflow velocity, the particle number concentration was measured at different airflow rates and particle feed rates in the loading chamber using an optical particle counter (OPC). The particle flux density j is determined from the particle concentration c p and the mean airflow velocity u.
j = c p · u
The time-integrated flux density T I F in particles per mm2 can be obtained by combining the particle flux density j with the respective loading time t for a specific time interval.
T I F = J ( t ) = 0 t j d t
For a constant j:
T I F = J ( t ) = j · t
Gravimetric methods were used to measure particle accumulation on the fiber array directly after the experiments. The clamping device and fibers (including particulate material) were weighed after the loading process using a METTLER TOLEDO XR205DU balance (0.01 mg readability; 81 g capacity). Before weighing, the mass of separated particulate material on the fiber array, the surface of the fiber clamping device was cleaned with a cotton pad. Two replica tests per airflow velocity were conducted. After the weighing procedure of the loaded fiber array, the complete fiber clamping device and the fiber array were cleaned and reinstalled in the loading chamber for a new experiment.

2.3. In Situ Observation of Particulate Structure Development

To quantify the progress of the loading process and the associated formation of pores, it was necessary to observe the array through an inspection glass in the direction of aerosol flow as described in Section 2.2. The whole loading process was recorded by video. A Basler acA4024 29uc USB 3.0 camera and Navitar lens system (1-6010, 1-6020, 1-50330, 1-50011) were used to observe the accumulation process of particulate material on the fiber array. The camera had a resolution of 4024 × 3036 pixels, and the optical equipment provided a working distance of 341 mm with a magnification of 3.5. The observation was conducted in the direction of flow. During all experiments, a video was recorded at a frame rate of 4 frames per second, and the observation area covered a total length of 16 mm of the fiber.
The recorded video was analyzed using a MATLAB procedure. A complete progress diagram of the MATLAB program can be found in Support Material.
As observations took place in the direction of flow, parameters on the horizontal level were detected only. The MATLAB analysis was performed in the central section of the recorded fiber length at 5.8 mm. Image processing provided information about the image scale and the average spacing of the fibers. For the characterization of the morphology of the particle structure, the following parameters were recorded:
  • Particulate mass on the whole fiber array and relative projection area of the particulate material in the spacing between the fibers (accumulation of particulate material on the whole fiber array and in the spacing between the fibers; see Figure 4);
  • Length of borderline (see Figure 5);
  • Number and size of bridges;
  • Number and size of pores.

2.3.1. Accumulation of Particulate Material

Figure 4 (top) shows images of the non-loaded fiber array at the beginning of the experiment (left) and loaded fiber array at the end of the experiment (right). The MATLAB-processed images are presented below. As filling of the inner fiber spaces only was considered, the non-shaded areas were used for analysis.
In the left image, the free space between the fibers is marked red. In the right image, the particulate material in the free-space area is marked bluish/turquoise. The fraction of those marked areas describes the ratio between the area coated/occupied by accumulated particulate material in the fiber spacing at time i (Figure 4, turquoise) and the uncoated area. This parameter (relative accumulated particulate material in the spacing between the fiber; see Equation (6)) is a measure of the degree of openness of the fibrous structure. Thus, the fraction of accumulated particulate material is 0 at the beginning of the experiment and approaches 1 as the (complete) accumulation of particle material in the interspaces increases (see Equation (6)).
Separations 10 00462 i001

2.3.2. Borderline

The length of the borderline is given by the summarized pixels at the border between the particulate structure and an open space between the fibers. Its length depends on the shape of the particulate structure on the fiber array. The structure of particle loading is between compact and dendritic. For a dendritic structure, a ragged and long borderline is expected. For a compact structure, a short and straight borderline is expected. To classify the experiments, a quotient is calculated by dividing the length of the current borderline by the length of the borderline of the unloaded fibers. Figure 5 illustrates a section of the borderline of both an unloaded fiber (orange) and a fiber with a dendritic structure (white lines). Only the middle two fiber interspaces are considered for evaluations. The quotient is calculated from the colored lines, and if a dendritic structure is present as shown in the figure, the quotient is greater than 1. If the structure is more compact, the quotient is close to 1.
Separations 10 00462 i002

2.3.3. Pores and Bridges

The left of Figure 6 depicts an original image of the loaded fiber array captured by the camera system. In the schematic representation on the right (processed with MATLAB) of this frame, the blue-purple object represents the fiber position at the start of the experiment, which allows precise tracking of the growth of particulate material. The particulate material is marked white. The red objects are detected bridges. The black areas between the two bridges are identified to be pores.
The two inner fiber spacings can be viewed as large pores without bridges. A pore is identified as a closed object (black) and can be characterized using the MATLAB function “regionprops”, which gives the area A, perimeter P, diameter of the equivalent circle d e q u i , and size in the direction of x and y x i . The hydraulic diameter of the pores can be calculated using the area (A) and circumference (P) of the pore, as shown in Equation (8).
d h = 4 A P
When bridges are formed, a pore is turned into two or more objects. This enables the detection of the number of bridges in the space between the fibers. The algorithm assumes that a bridge (red) has formed between two adjacent pores (black) and detects it accordingly.
The detection of the size of bridges between fibers of the array requires a more complex algorithm, since the edges of a bridge are not firmly fixed. The left side of one pore corresponds to the right side of a bridge. The variables x and y indicate the position in the image. To detect a bridge and determine its size, the left side of a single pore is approached and checked whether it meets the bridge requirement.
Figure 7 shows a bridge (black) and white-colored pores on the right and left sides. First, the left side of a pore (black object) is marked (indicated here by the red arrow). Then, starting from this position, the left side of the white pore is scanned upwards and downwards to check whether it meets the bridge requirement. If the difference Δ x = x ( y 1 ) x ( y ) is greater than 4 pixels (threshold), the coordinates x and x ( y ) are saved as the upper right corner of the bridge. The same procedure is performed for all three remaining corners of the potential bridge. The found coordinates are connected and saved as the corners of the bridge. The area between the corners and the scanned edges gives the area of the bridge. If a bridge is located at the border of an image, the upper and lower borders of the nearest pore are drawn horizontally to the border of the image. The detected positions and sizes of bridges are saved in a separate black-and-white image. The “regionprops” function in MATLAB is used to process the numbers and horizontal sizes of the bridges.

3. Results and Discussion

3.1. Gravimetric Measurements of the Particulate Material

To characterize the deposited particle mass on the fibers, experiments were terminated at a pre-defined TIF. Subsequently, a gravimetric analysis was conducted. Then, a new experiment was started. Experiment times varied between 3 and 210 min, depending on the flow velocity and feed rate of the aerosol generator (see Section 2.2). All experiments shown were carried out with the aerosol generator described in Section 2.2, whose dispersion technology is based on VDI 491-3 and ISO 5011. Continuous control of the ring loading is intended to exclude the possibility of ring loading failure and thus inconstant dispersion conditions. Any deviations in the deposited mass can thus also be attributed to inconsistencies in the dispersion or to the occurrence of electrostatic effects, whereas the latter is counteracted by neutralizing the aerosol with an 85 Kr.
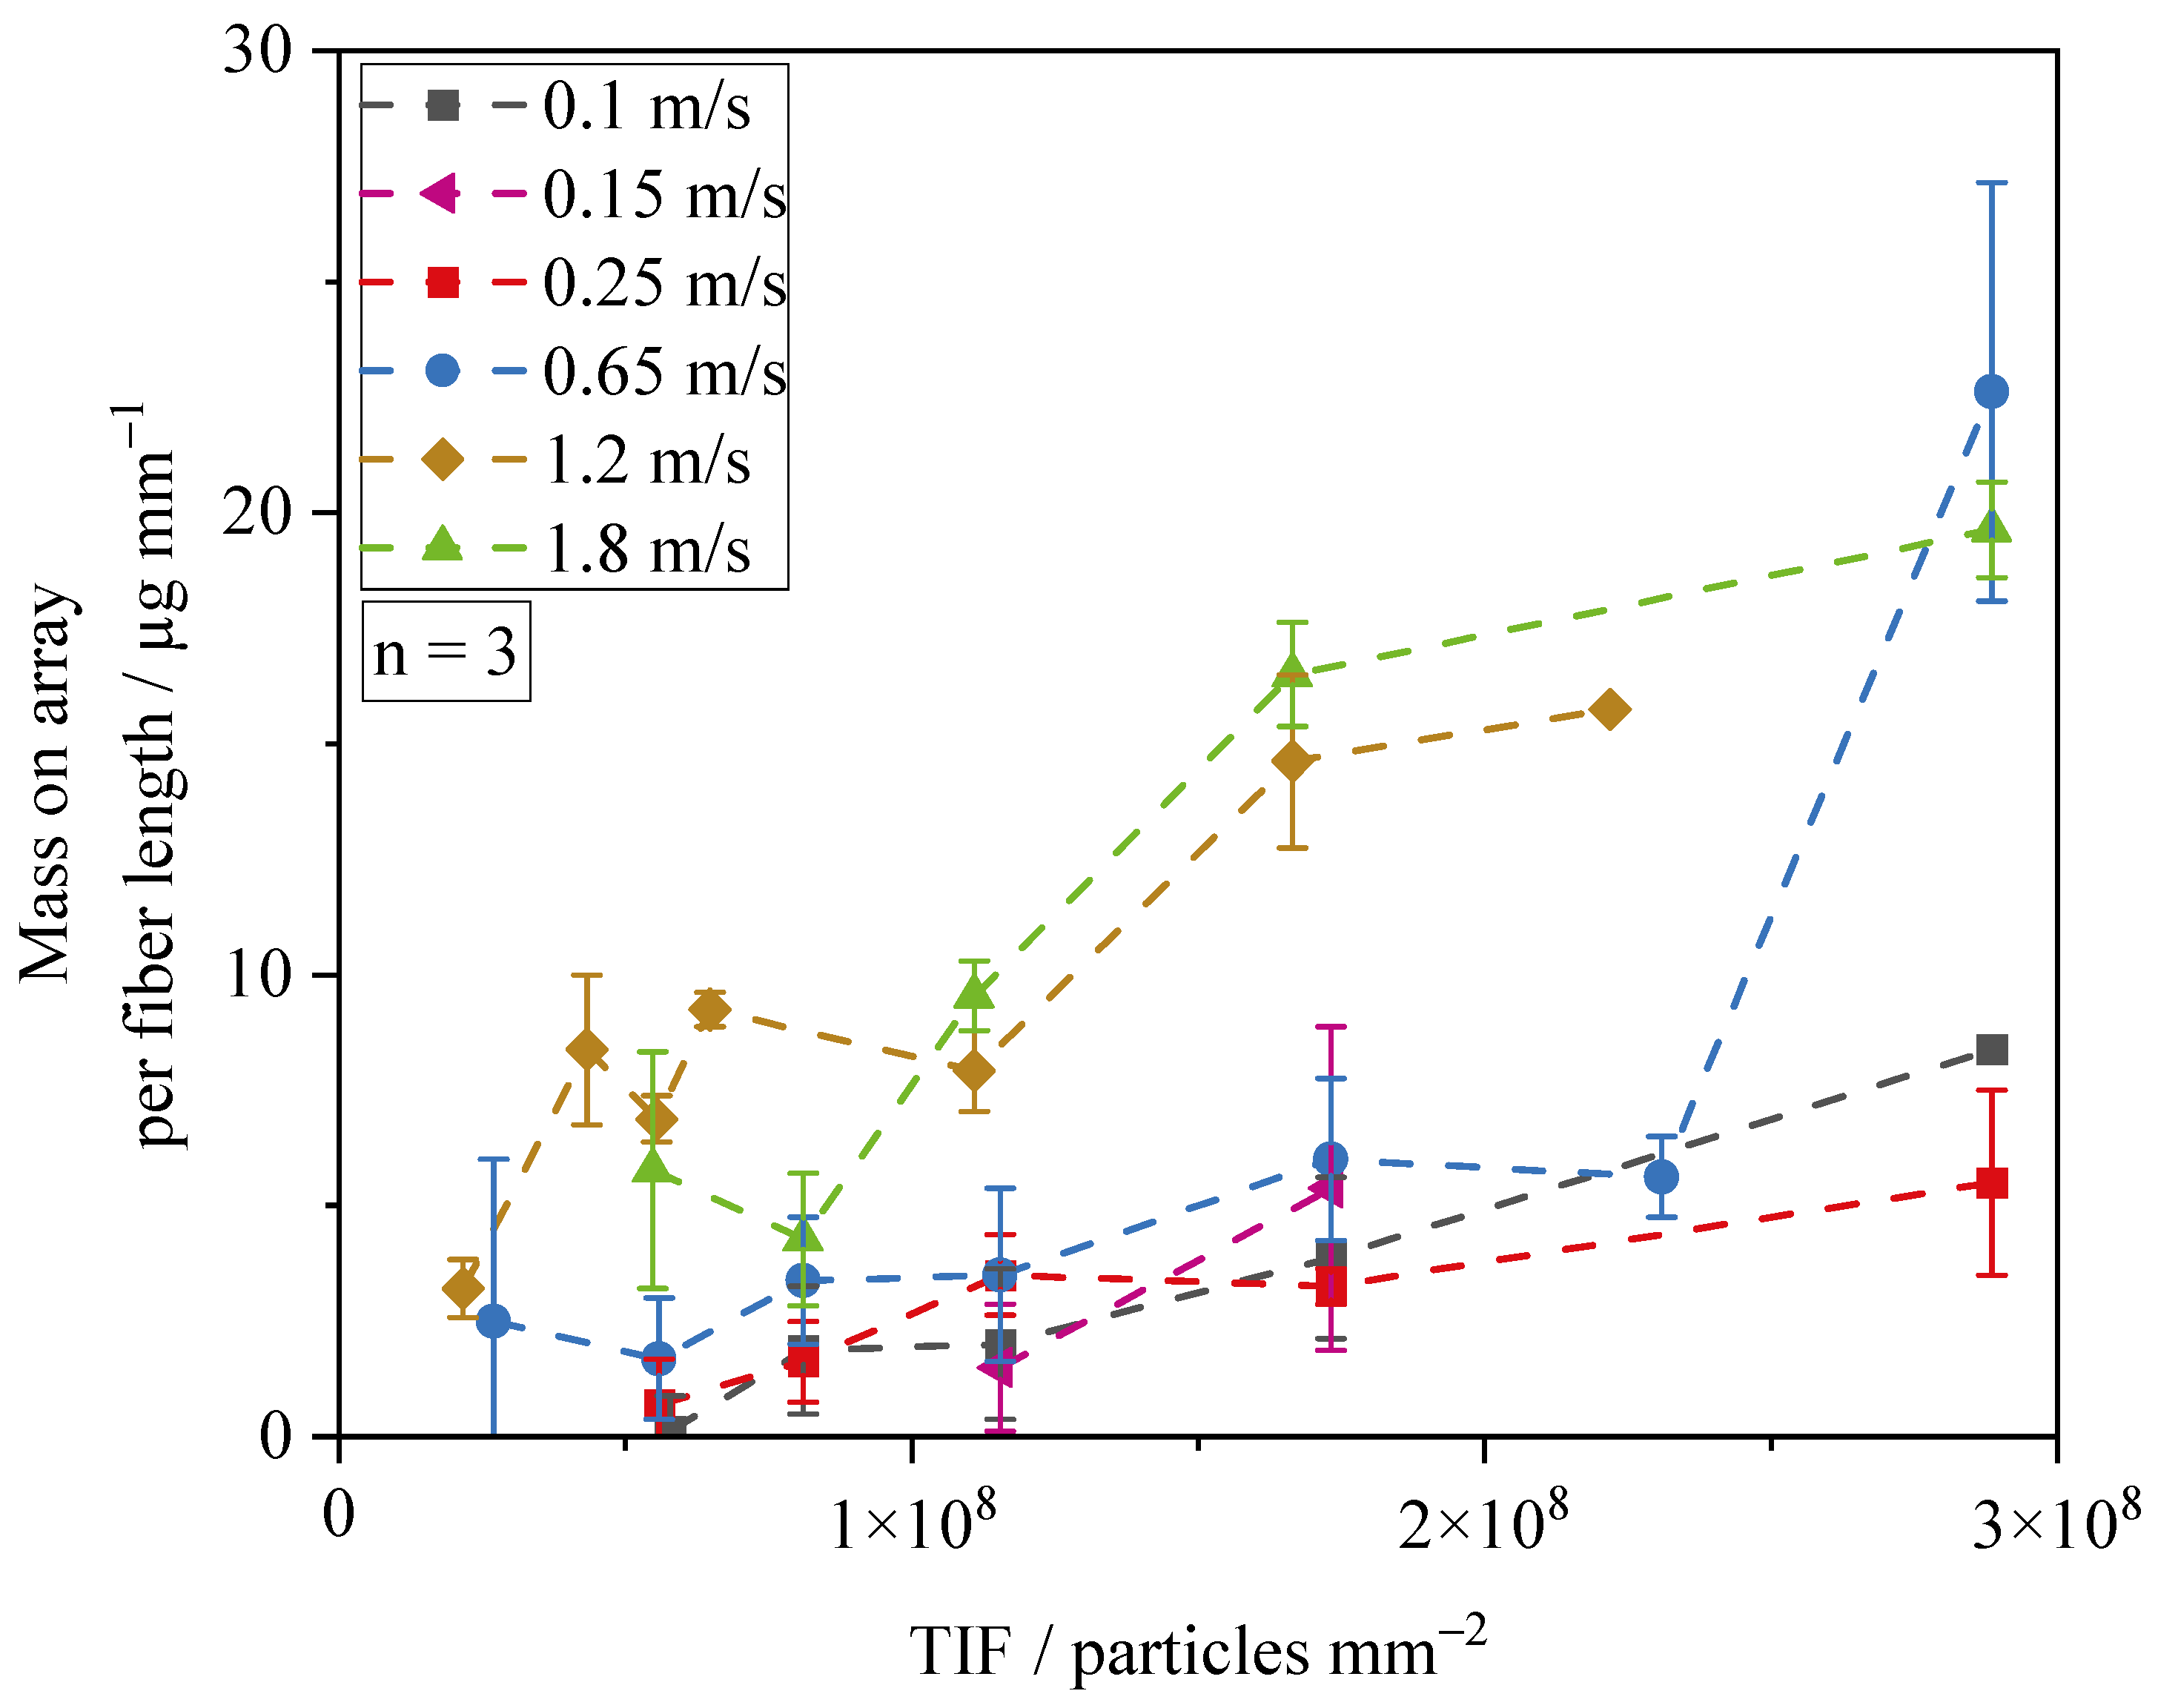
Gravimetric analysis of the particle material on the 16 mm long array (5 fibers) is presented in Figure 8. For experiments executed at a face velocity of 0.15 m/s, no deposition was detected below a TIF of 10 8 particles · mm 2 . Similarly, for experiments conducted at airflow velocities of 0.25 m/s and 0.1 m/s, no loading was detected below 6 × 10 7 particles · mm 2 . At high TIF, however, the mass on the fiber array increases continuously with increasing TIF at airflow velocity below 0.25 m/s, reaching a maximum of 5.5 μ g · mm 1 in the experiments at 0.1 m/s.
The investigation revealed particle deposition on the fibers in experiments with compact morphology. Increased deposition occurred at airflow velocities greater than 1 m/s (Stokes greater than 5.1). Particles with large diameters, which represent the high-mass fraction of the particle distribution (PD), were most probably deposited by inertia. After reaching a TIF of 1.73 × 10 8 particles · mm 2 , the increase in mass slowed down because of the poor growth of compact-shaped structures. The structure likely grows in the direction of flow and is compacted by incoming particles. Hence, the collector size increases slightly only. In the experiments with the compact structures (1.8 m/s and 1.2 m/s), increases in particle mass on the array are observed at similar TIF. Given that the TIF is a time-dependent metric and each data point is a result of three measurements, the probability of a random increase in mass due to discontinuous dispersion is negligible with the duration of the experiments.
In the experiments at 0.65 m/s, the deposited mass increased considerably above TIF 2.3 × 10 8   particles · mm 2 . First, the deposited mass was below that of experiments with a complete compact structure. Shortly after the TIF 1.73 × 10 8 particles · mm 2 , a sharp increase in the deposited mass on the fiber array is observed, indicating the complete closure of the structure and the resulting enlargement of the collector area. The increasing collector area increased the probability of separation, which might increase the impact coefficient. The steep increase in mass with increasing TIF was observed in all replicate experiments. The deposited mass was nearly 22.6 μ g · mm 1 fiber length (five times 16 mm loaded fiber length) in the experiments at 0.65 m/s. At TIF greater than 2.3 × 10 8 particles · mm 2 , the interspaces between the fibers were blocked. Unfortunately, measuring the pressure drop in a fiber array is not feasible. To gain a better understanding of the phenomena, different factors, such as accumulation of particulate material, size, and number of bridges and pores, were considered.

3.2. Accumulation of Particulate Material before Clogging

To distinguish the different phases of the separation process on the fiber array and to quantify the deposition kinetics during classical filtration, evaluation points were introduced at selected TIF. The position of the evaluation points is based on the overall course of an experiment with an airflow velocity of 0.65 m/s. In such an experiment the fiber interspaces are completely clogged, and no bridges are detected at a TIF of 2.8 × 10 8 particles · mm 2 (relative accumulated particulate material in the spacing 1 ). The TIFs corresponding to the evaluation points are shown in Table 2.
Image analysis was used to quantify the growth kinetics of particle structures in the fiber interspaces by measuring the increase in particle material in the inner fiber interspaces of the array. Figure 9 shows the relative accumulated particle material in the fiber interspaces over the increase in TIF up to a TIF of 1.75 × 10 8 particles · mm 2 at different airflow velocities. None of the experiments revealed complete blocking at these TIF values. The airflow velocities ranged from 0.1 to 1.8 m/s. The development of accumulated particle material in the interspaces remained constant over the entire experiment. The evaluation started at the smallest TIF where the fibers became visible. The growth rate represents the rate at which the fiber interspace was occupied by particulate material. The fiber array first was in the depth filter phase, followed by the transition phase as in normal filters.
The average growth rates between the second and the third evaluation points were determined by using a linear fit (black fit) for each curve, with a coefficient of determination above 0.99. Regardless of the applied airflow velocity, the experiments passed the run-in phase and were in the surface phase or at the beginning of the transition phase.
Analysis of experimental conditions revealed trends and mechanisms in particle growth kinetics within the fiber interspaces. Dendritic particle growth was observed at flow velocities ranging from 0.1 to 0.65 m/s. As shown in Figure 10, dendritic structures develop in the region of interception in the experiment at a flow velocity of 0.15 m/s.
The same phenomenon had been found before in a computational simulation by Payatakes and Tien [34]. 
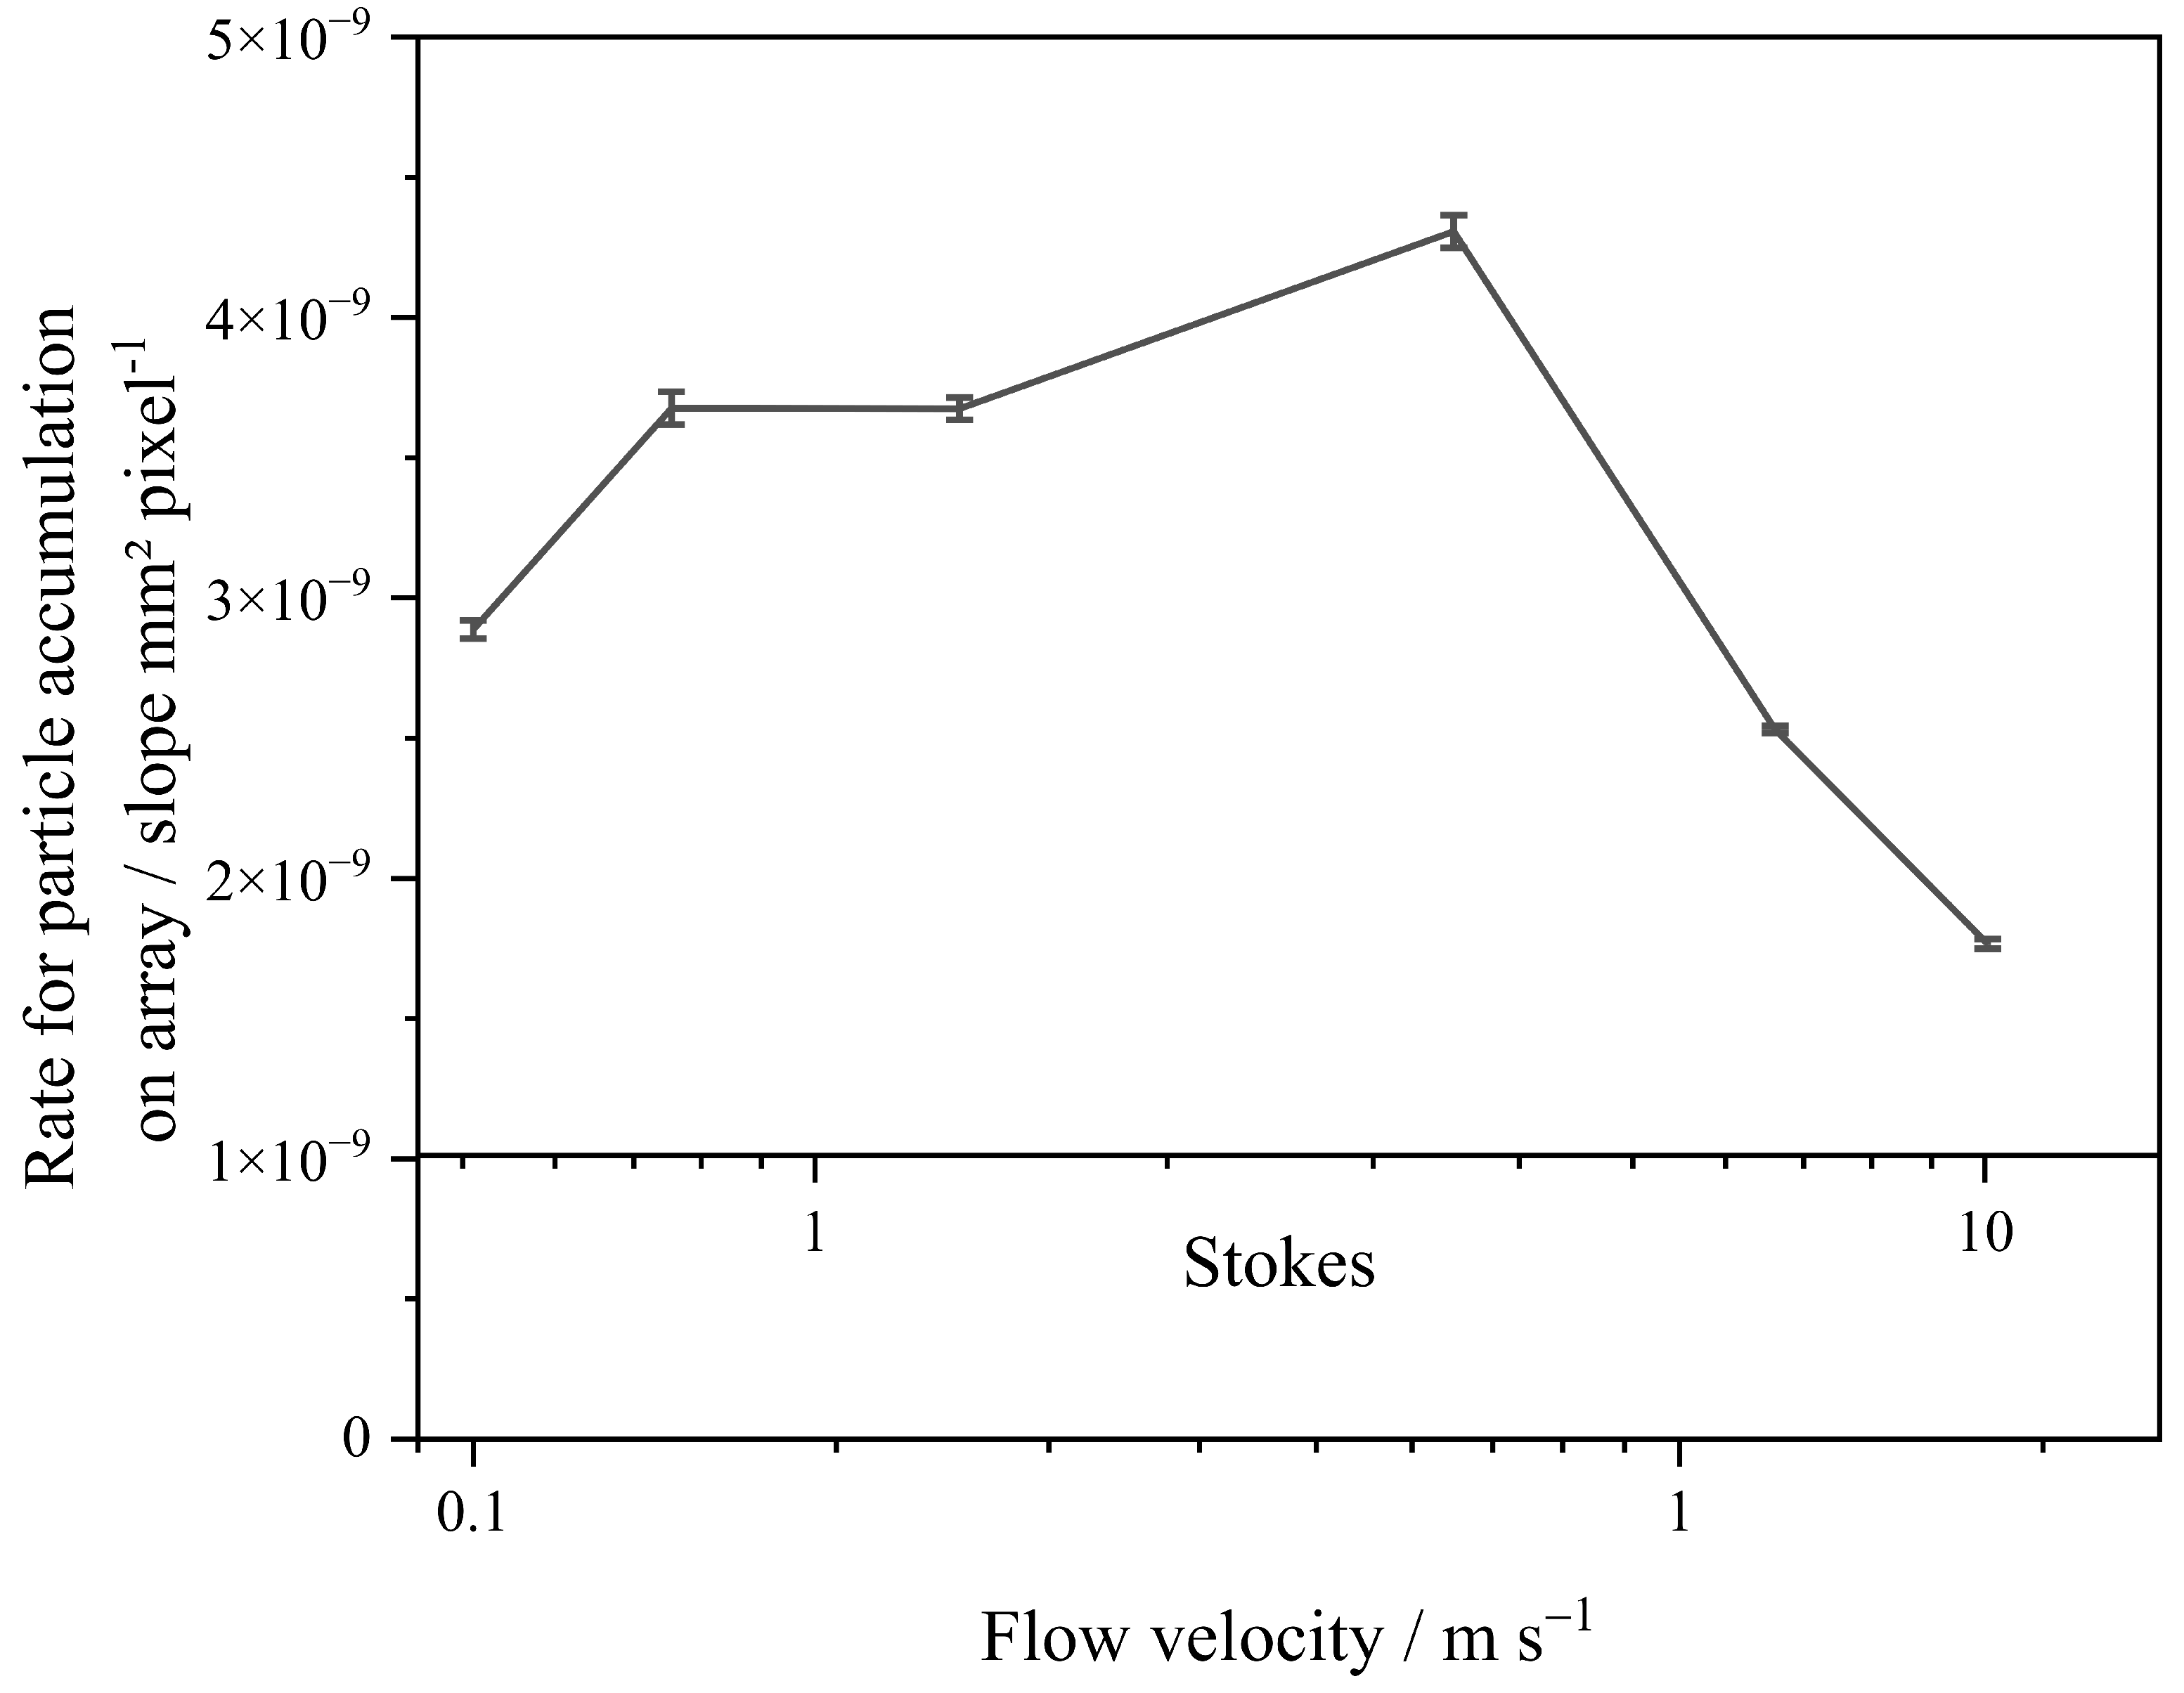
Figure 11 shows the rate for particle accumulation on an array plotted against the flow velocity and Stokes number, which is extracted from linear fit in Figure 9. The rate reflects structure growth in the interspaces and on the fibers. An increase in the particle structure within or outside of the image plane cannot be detected. Compact structures formed in the experiments at 1.2 and 1.8 m/s result in a low growth rate compared to the low airflow velocity experiments. The smallest growth rate of dendritic structures was observed at 0.1 m/s, while growth at 0.15 and 0.25 m/s was 27% higher than in the experiments with an airflow velocity of 0.1 m/s. In the experiment with a flow velocity of 0.65 m/s, the growth was 49% higher. The particle loading rate in Figure 11 is on a higher level because particles accumulated opposite to the direction of flow.
Kanaoka et al. (1986) observed a change in the orientation of particle deposition from upstream to cross-stream on the side of each fiber as the Stokes number decreased towards zero and the Péclet number increased towards infinity [3]. The masses deposited on the fiber at flow velocities 0.1 m/s, 0.15 m/s, and 0.25 m/s were approximately the same at the same value of TIF (see Figure 8). Therefore, the higher growth rate at 0.15 m/s and 0.25 m/s compared to 0.1 m/s in Figure 9 cannot be attributed to an increased deposition rate.
Instead, the particle bounce parameter β defined by Kasper et al. may explain the observed horizontal widening of structures in the direction of the image plane [31]. As particle velocity or diameter increases, the rebound parameter β increases, leading to re-arrangement and eventually to bouncing and dislodging of previously deposited particles [35]. In addition to the effect of interception, re-arrangement might occur, initiated by the accumulation of particles that widen the structures at the horizontal level.
While previous studies cited in this work have used a narrow particle size distribution or monodisperse material, whereas this study used a polydisperse particle size distribution, which leads to overlapping deposition effects.
Therefore, the interception effect for small particles and the inertia effect for large particles overlap. When considering the rebound parameter, the effects for impinging particles and particles that detach before deposition overlap at the same flow rate for each particle size. The predominantly dendritic particle deposition observed at flow rates below 0.65 m/s changes to a compact deposition on the fiber surface at flow rates of 0.65 m/s and higher. The loading rate between the fibers decreases with increasing flow rate above 0.65 m/s. This indicates that particles hardly adhere in cross-stream or detach after adhesion at the highest Stokes numbers.

3.3. Development of Structures before and in the Clogging Phase

It is outlined in Section 3.2 that as the TIF increases, more particles accumulate in the interspaces between the fibers. The complete closure of the interspaces between fibers was not observed at values of TIF up to 1.75 × 10 8 particles · mm 2 . To analyze bridge growth up to the CP, three experiments were conducted with different flow velocities at higher terminal TIF values. The flow velocity covered the range of deposition patterns (dendritic, transition, and compact morphology). The final TIF value reached 2.8 × 10 8 particles · mm 2 after a long experimental time. For one set of parameters, complete clogging was achieved. Figure 12 displays the complete evolution of the structures up to the predefined evaluation points.
In all experiments, a particle layer was initially visible on the fiber at Evaluation Point 1. In the tests an incident flow velocity of 1.8 m/s, deposition at the stagnation point of the fiber was clearly visible. At Evaluation Point 2, the characteristic separation of particles was observed in all experiments. The morphology of the particle structure was a function of airflow velocity. In the experiments with a flow velocity of 0.25 m/s, dendritic structures with small arms appeared in the interspaces between the fibers. In the experiments with an airflow velocity of 0.65 m/s, growth of dendritic structures was observed, too. However, more particulate material is separated at the stagnation point of the fiber, as shown by the presence of a thick layer of particle material. In the experiment with an airflow velocity of 1.8 m/s, the unobstructed fiber interspaces were clearly visible. The particulate material just separated on the zenith/top of the fiber. At the third evaluation point, deposition of particulate material in the interspaces of the fiber was visible though the compact structure seems to bend into the interspaces. Merging particle structures across the interspaces were found at the sites where the fiber bends.
In the experiments with airflow velocities of 0.65 m/s, and 0.25 m/s, increased growth of the dendritic structures into the interspaces of the fiber was observed at this evaluation point. The images of the experiments at 0.65 m/s reveal a few gaps in the particle structure visible at Evaluation Point 3, where the fibers have dents and are slightly separate from each other. These gaps only close as the number of bridges decreased towards Evaluation Point 4. In addition, impacts on the already clogged particle structure were found and attributed to large particles which hit the particulate structure. Compared to the total area, these impacts are small in size. In the experiments with an airflow velocity of 0.25 m/s, the dendritic structure grew into the interspaces of the fiber. The dendritic arms were much more pronounced compared to the experiments with an airflow velocity of 0.65 m/s. The compact structure of the fiber merged (formation of bridges) across the interspaces of the fibers. The contact points of merging particle structures from different fibers were found to be much wider for the compact structures than for the dendritic structures. The clogging point will be reached soon when the free interspaces between the fiber are closed completely. For all experiments with different airflow velocities, an increased separation of particles at the outer fibers of the array is observed with increasing loading at Evaluation Point 4. Thus, in the experiments with the airflow velocity of 1.8 m/s, the structure at the outer fiber becomes a little bit bulky. The edges of the structure remain sharp and smooth. However, the growth of the structure on the outer two fibers is observed in the tests with incident flow velocities of 0.25 m/s and 0.65 m/s, too. Due to the separation mechanism, the structure has more small arms and dendrites on the outer fiber surface. The reason for this increased separation is the change of the flow around the fiber which is a result of particle separation in the interspaces of the fibers. This effect was predicted in the calculations of Müller et al. [4]. As described in Section 2.3, only the inner interspaces of the array are considered during evaluation. The limit on using just 5 parallel fibers is because the used motors are not able to stretch more polymer fibers at once due to the restrain force that the fibers encounter.
In Figure 13, the fraction of accumulated particulate material and the total number of bridges are plotted as a function of TIF for each flow velocity. The experiment was conducted three times, and the data were analyzed using MATLAB.
For the highest flow velocity ( u = 1.8 m/s), the graph shows a continuous growth of the fraction of accumulated material in the transition phase, with a small decrease in growth rate for a TIF above 2.0 × 10 8 particle · mm 2 . This section comes with an increase in the standard deviation. At the same time, the number of bridges levels off at around 10 for the experiments with a flow velocity of 1.8 m/s. In contrast, the experiments with a flow velocity of 0.25 m/s and the dendritic structure on the fibers show a continuous increase in the number of bridges starting at a TIF of approximately 7.5 × 10 7 particles · mm 2 . This effect is due to the growth of the structure vertical to the flow direction, which tends to close the interspaces between the fibers. In these experiments, the fraction of accumulated material increases from the start of the experiment with a steeper slope than in the experiments with a compact deposit at a flow velocity of 1.8 m/s. The relative accumulated particulate material starts to decrease slightly as bridge growth becomes dominant at a TIF of 1.25 × 10 8 particles · mm 2 . In the experiments conducted at an airflow velocity of 0.65 m/s, the relative accumulation of particulate material within the fiber spacing displayed the most rapid increase. The accumulation continuously increased from the start of the experiment until complete closure of the filter occurred with minimal pore sizes.
Significantly, the experimental conditions that involved an airflow velocity of 0.65/exhibited the lowest standard deviation among the observed results. With increasing TIF, the number of bridges increases continuously at TIF of 1.6 × 10 8 particles · mm 2 to a maximum of approximately 100 bridges. Initially, dendritic growth is observed with well-developed bridge formation and the maximum number of bridges. The maximum value of bridges occurs just before Evaluation Point 3. It is important to note that the generation of bridges and the separation of particles at the fiber generally are processes that involve a certain random component. This fact is highlighted by the high standard deviations. Once the maximum is reached, the number of bridges decreases as the array becomes more clogged and the pores and interspaces between the fibers continue to fill and multiple small bridges merge into broader structures. A cake of particulate material forms on the array, as illustrated in Figure 12.
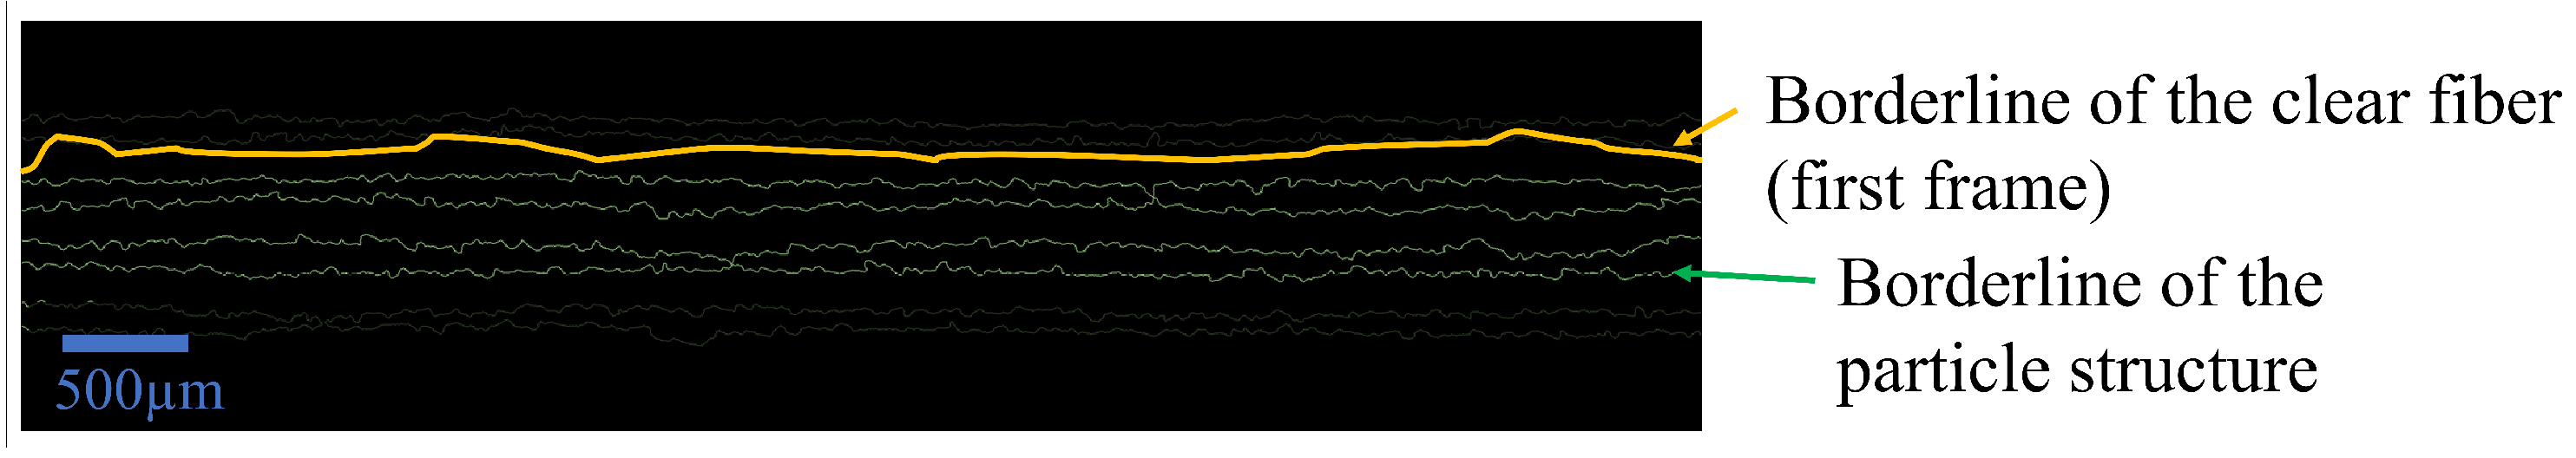
The boundary line reflecting the deposition pattern is presented in Figure 14. The boundary line is characteristic of the respective type of deposition morphology or mechanism. For the dendritic structures in the experiments with airflow velocities of 0.25 m/s and 0.65 m/s, a jagged and long boundary line can be observed. The boundary line of the experiments with a compact deposit is similar to the original fiber. The boundary line of the experiment at 0.65 m/s is initially jagged but becomes straighter with increasing TIF. In comparison, the boundary line of the experiment at 0.25 m/s is more jagged. Once complete closure of the interspaces is achieved, the boundary line disappears, as shown here by the experiments at airflow velocity 0.65 m/s.
Figure 15 presents a quantitative analysis of the length of the boundary line (horizontal, parallel to fiber axis) relative to the initial boundary line of the fiber for the three different morphologies (dendritic, transition from dendritic to compact, compact) of particulate structures. At an airflow velocity of 0.65 m/s, the ratio first increases slightly above 1 due to the dendritic separation of particles. Just before the second evaluation point, the ratio starts to decrease due to the formation of the first bridges. After the second evaluation point, the curve continues to decrease due to the formation of bridges and clogging of the interspace between the fibers. At the end of the experiment, the ratio reaches the value of 0 for the experiment with 0.65 m/s. At an airflow velocity of 1.8 m/s, by contrast, the ratio of the boundary lines remains constant at almost 1 due to the horizontal increase in compact structure. However, a reduction below 1 is observed between Evaluation Points 3 and 4, caused by the formation of bridges and the subsequent shortening of the boundary line at the end of the experiment (see Section 3.4). As observed earlier, the boundary line of the dendritic structure is more jagged, resulting in a larger ratio than for the compact and transition structures. The ratio remains above one after the third evaluation point.

3.4. Size of Pores and Bridges

The pressure in a filter drops due to friction between gas molecules and fibers or deposited particle structures. Particle structure growth on the collector can lead to an increased blockage area (fiber + particulate material) and reduced free cross-sectional area for flow. Section 3.2 emphasized that particle structures grow at varying rates and extend into interspaces of the fibers. While previous studies focused on the pressure drop as a function of process parameters, the impact of structural morphology on particle separation/accumulation and the CP has yet to be investigated in sufficient detail. Observing particle deposition on a single fiber or array of fibers is not sufficient to characterize pressure loss in the filtration process. The particulate material is deposited on the fibers. The fiber interspaces start to clog when more particulate material is separated onto a pre-existing particulate structure under a large angle to the stagnation point (refer to Section 3.3). Particle bridges as illustrated in Figure 12, develop with progressing filtration time between/across the fiber interspaces due to the growing of particle structures on neighboring fibers. As described above, the formation of bridges reduces the unobstructed flow area of the initial “pore” between the two fibers and generates two new pores on either side of the bridge. The number and dimensions of formed bridges depend on airflow velocity and the deposition mechanism as well as on the fiber’s structural morphology.
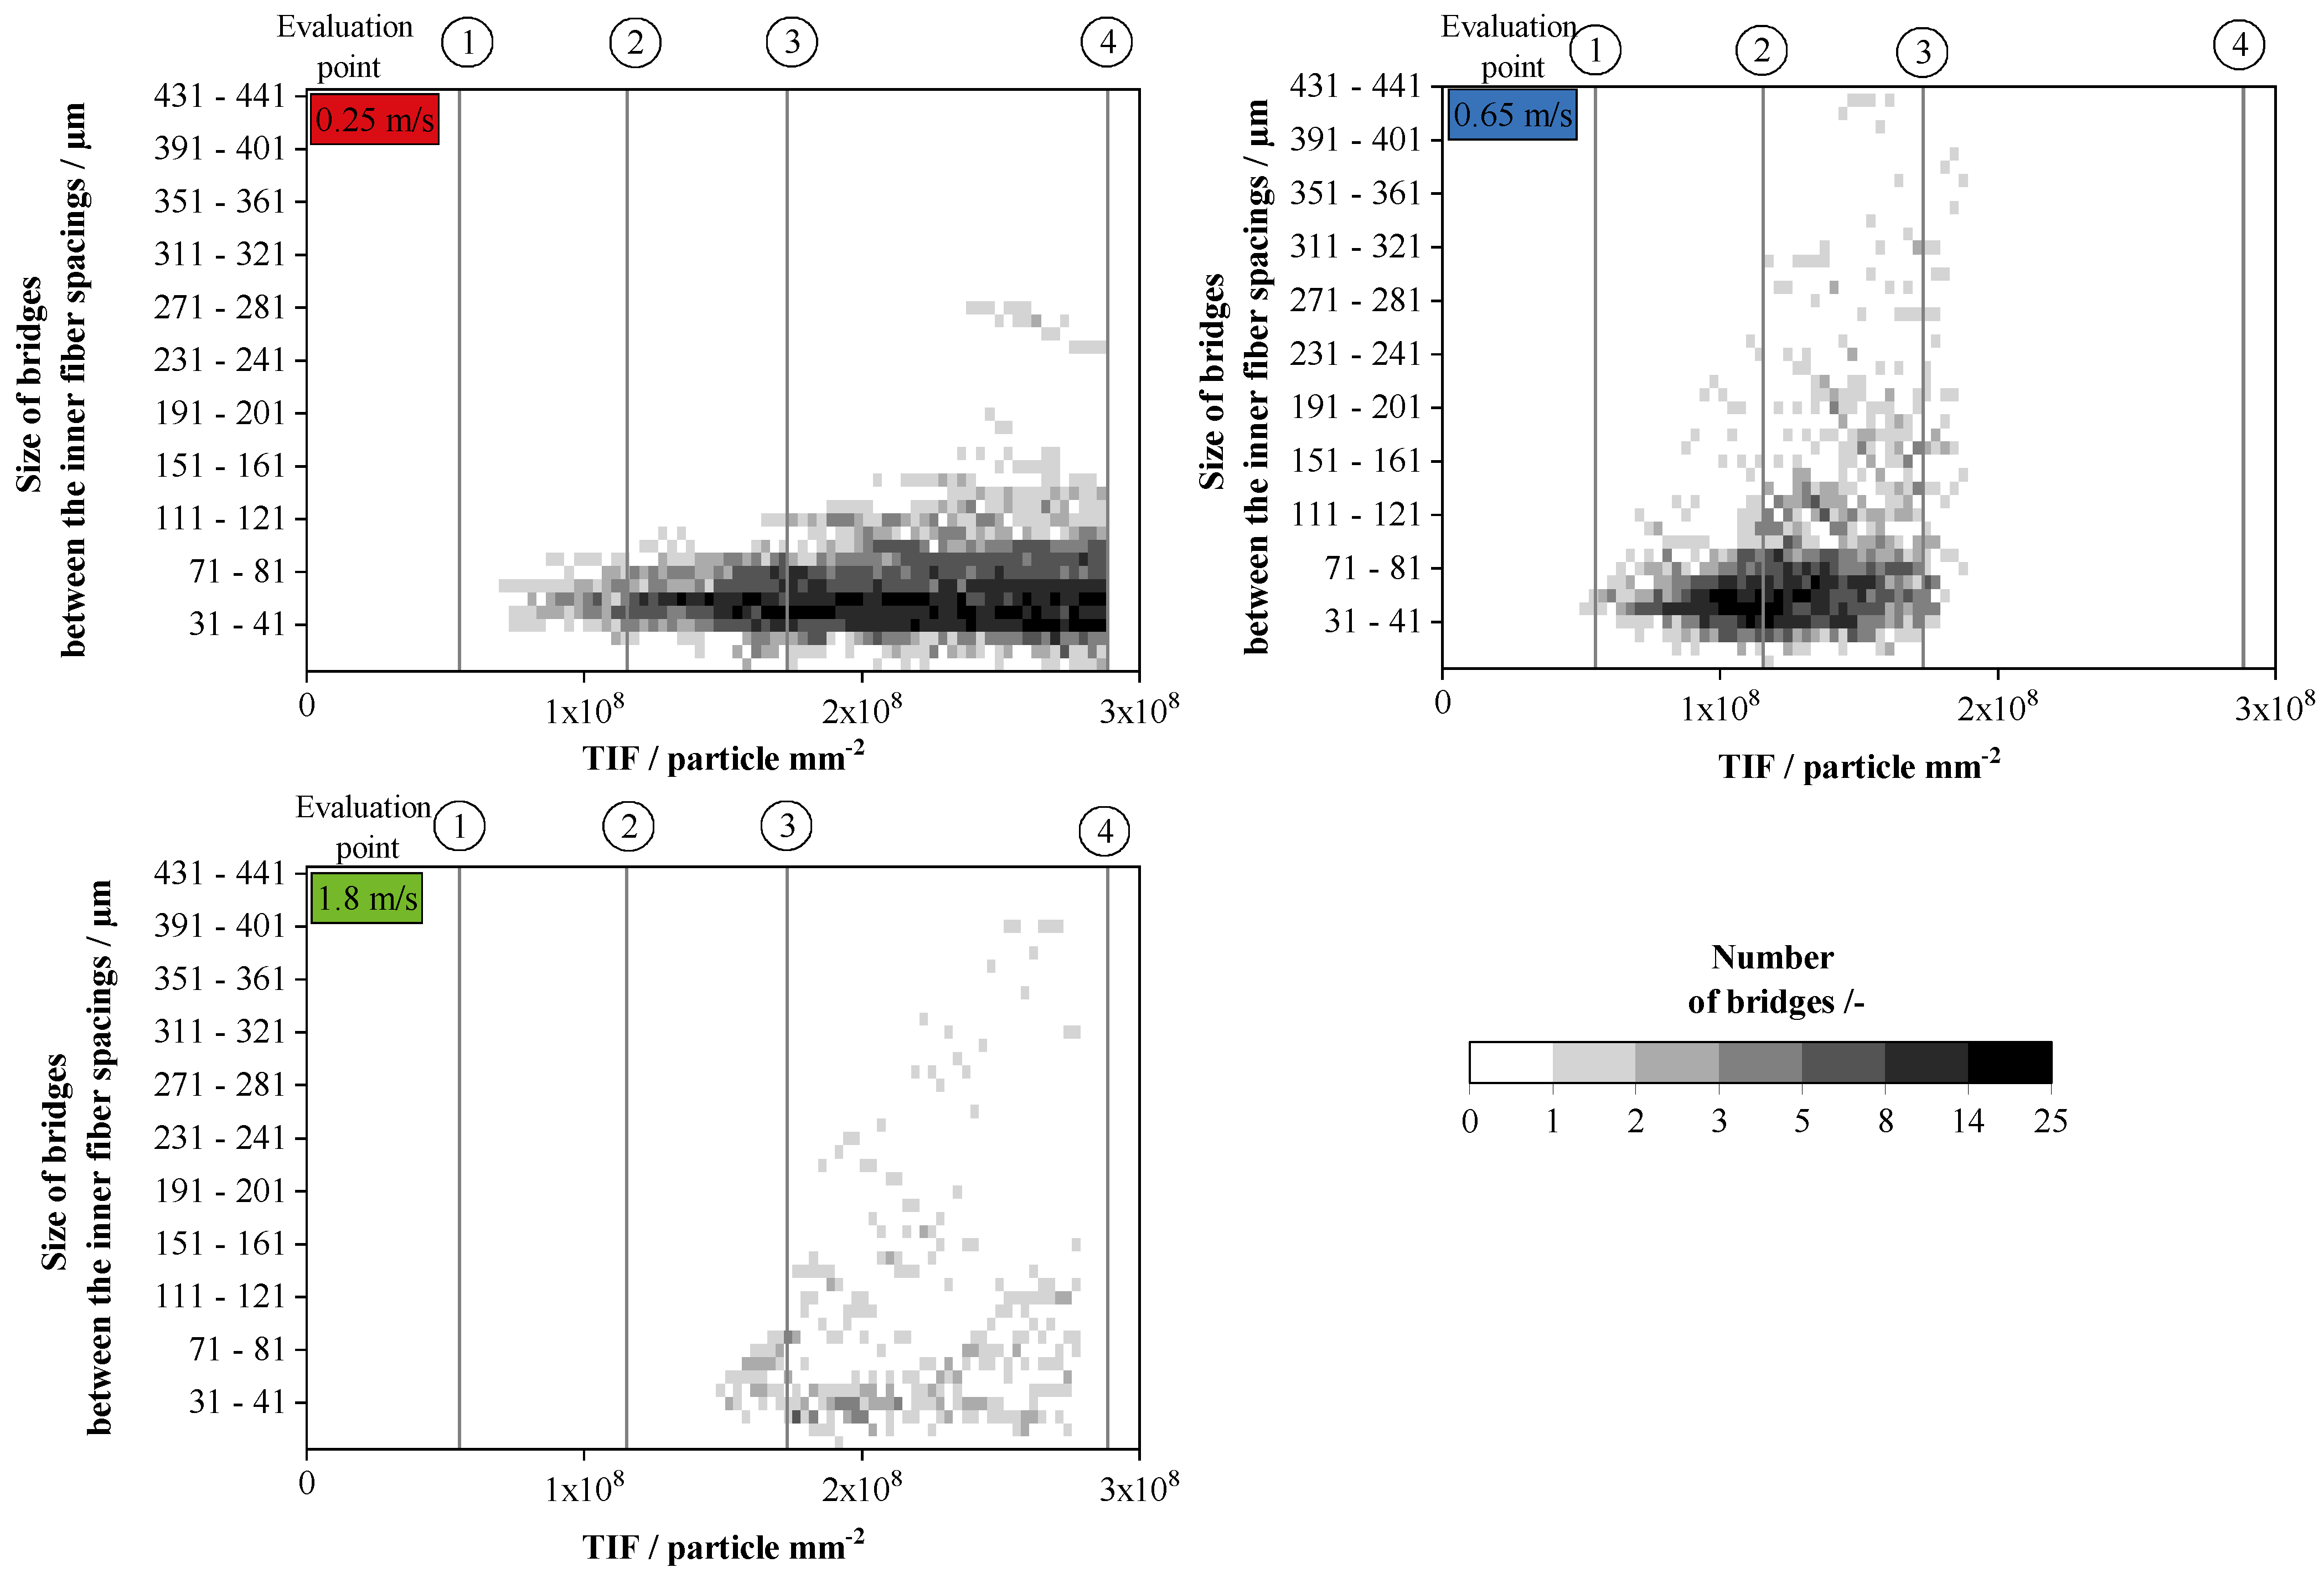
Figure 16 shows the development of maximal size (parallel to fiber axis) and number of bridges with three characteristic airflow velocities as a function of the TIF. This figure follows the principle of a heatmap. The total number of bridges (in the following pores) in each section is visualized using a grayscale code.
At a flow velocity of 0.25 m/s, the first small bridges (71–81 μ m ) develop just before the second evaluation point. At first, the number of bridges simply increases to an average size of 50 μ m . Then, starting at TIF of 1.6 × 10 8 particle · mm 2 , more small bridges are formed while existing bridges grow together to form larger ones. At Evaluation Points 3 and 4, the number of medium-sized bridges (50–60 μ m ) does not increase any further, while the large bridges continue to grow.
As shown in Figure 13, the curve for the increase in particulate material in the interstitial spaces flattens somewhat at a TIF of 1.6 × 10 8 particle · mm 2 . At Evaluation Points 3 and 4, the structures are not fully closed yet (see Figure 12 and Figure 17). The size of bridges reaches a maximum of 281 μ m .
At an airflow velocity of 0.65 m/s, bridge formation occurred earlier than at 0.25 m/s. The size of the first bridges formed in the two sets of experiments was similar. There was a significant growth of bridges between Evaluation Point 2 and Evaluation Point 3, with a considerable number of large bridges (larger than 121 μ m ) and small bridges (ranging between 41 and 71 μ m ) being formed. The bridges continued to grow towards Evaluation Point 3, reaching a maximum size of 441 μ m . The number of bridges, however, was smaller than that at 0.25 m/s. The number of small bridges continued to decrease towards Evaluation Point 4, while bridges of medium size (between 121 and 201 μ m ) increased in size due to particle accumulation.
In the experiments at an airflow velocity of 1.8 m/s, the formation of bridges sized 41–81 μ m occured shortly before Evaluation Point 3 and continued to increase with increasing TIF. The total number of bridges in this size range increased, too. The maximum bridge size reached 401 μ m before Evaluation Point 4, which is twice the size of the bridge observed at 0.25 m/s. The total number of bridges ranged from 8 to 14 and was lower than in the other experiments. This might be due to the fact that the structure between and on the fiber is growing more in the direction of the airflow. As a dendritic structure has more side arms in the horizontal direction that can reach structures on other fibers, the chance of bridge formation is higher.
As discussed in Section 2.3, bridges typically result in the formation of new pores. At the beginning of the filtration process, there are empty spaces between neighboring fibers that gradually become filled with deposited particles. Figure 18 presents the size and number of those pores at the corresponding TIF for three different airflow velocities. They are measured using the hydraulic diameter as a metric for pore size. The free fiber interspaces are detected at the start of each experiment and appear as a single large pore per fiber pair. At a TIF of 0 particle · mm 2 are the unobstructed interspaces between the fibers. As the loading process continues, the size of the interspaces between the fibers narrows. Subsequently, the hydrodynamic diameter starts to decrease. A newly created bridge splits into a large pore into two new pores. The experiments at an airflow velocity of 0.25 m/s exhibit an initial steady decrease in pore size with a constant number of pores from the beginning of the experiment. This indicates a stable growth of the particle structure within the interspace of the fibers. Immediately after Evaluation Point 1, corresponding to a TIF of 1.5 × 10 7 particle · mm 2 , the number of pores increases steadily. After the evaluation point, there is a marked increase in the number of smaller and medium-sized pores, particularly in the size range of 21–41 μ m , which may include small holes within the dendritic structure (observed in Figure 12). After Evaluation Point 4, mainly small pores are formed, while large pores above 100 μ m become less frequent. Just before the fourth evaluation point, additional large pores may form in the deposited structure due to small demolition and fracturing. Moreover, it is possible that formed dendritic arms of the structures may detach and expose void areas between the fibers.
Further particle loading would lead to clogging in the interspaces of the fiber array. The number of small pores continues to increase, which suggests further growth and clogging of already existing pores. The exact TIF at which clogging occurs at this airflow velocity is not known. Figure 12 presents images of the growing structure including pore formation. Figure 17 illustrates the pores and bridges and their aspect ratios. In fiber sections with a slightly smaller fiber spacing the structure recedes more quickly with large pores/spaces and closing fast and almost completely.
At an incident flow velocity of 0.65 m/s, an initial linear decrease in pore diameter at a constant pore number is observed again. The deposited structure, as shown in Figure 12, exhibits a morphology transitioning from dendritic to compact. Pore growth in the size ranges of 41–61 μ m and 21–41 μ m starts just before the second evaluation point. Further development of smaller pores and simultaneous reduction of larger pores indicates the gradual closure of large pores and growth of the structure between the second and third evaluation points. After Evaluation Point 3, the number of small pores continues to increase as the structure slowly closes completely.
Large pores with hydrodynamic diameters of 81–121 μ m occur before Evaluation Point 4. These are actually holes in the previously closed particle structure, which were created by larger particles. The holes are closed by particulate material as the filtration process continues (see Figure 18). Although some pores are still present at the end of the loading process, the combination of different results (accumulated particulate material, number of bridges, and pores) shows that the structure has reached the clogging phase.
When the airflow velocity increases by 1.8 m/s, a compact particle structure is formed on the fiber array in agreement with the investigation by Kanaoka et al. [3]. As depicted in Figure 18 on the lower left, the pores persist up to large values of TIF. The hydraulic diameter decreases to 241–261 μ m because the structure grows in the direction of the stagnation point, rather than horizontally. Large pores form right after the start of the experiment and exist up until Evaluation Point 4. Before the third evaluation point, additional pores develop in the range below 100 μ m . They are formed parallel to the bridges (see Figure 16). The number of individual pores remains very low in the experiment with 1.8 m/s compared to 0.65 m/s and 0.25 m/s. Pores in the size range of 3–21 μ m are found in all experiments. The presence of pores until the end of the experiment, along with the observation of large elongated pores between the fibers, suggests that the structure is not fully closed. These results, together with the findings presented in Section 3.3, support the notion that the structure is not in a completely clogged state. The structures merge due to their length, as reflected by the horizontal bridge size data.

4. Conclusions and Outlook

In this study, the impact of airflow velocity on the formation and development of particulate structures on an array of elastic filter fibers was investigated. The experimental results revealed new details about the morphology of the particulate structures. It depends on the airflow velocity, with dendritic structures forming at low velocities and compact structures at higher velocities.
Visual observation took place in the airflow direction using a special camera that allowed for a comprehensive analysis of the whole deposition process. This technique facilitated the determination of the number and size of pores and bridges between individual fibers or within the structure and of the relationship between the boundary line and the relative accumulated particulate material in the spacing between the fibers. Those investigations of the mass on the fiber array revealed a steeper increase when the fiber structure’s clogging point was exceeded. The ratio of boundary lines for dendritic structures was found to be larger than that for compact structures, indicating a more jagged boundary line in the former case. The technique was also used to determine the size of pores within and between the individual particle structures. The hydraulic diameter of the pores increased the size with an increasing Stokes number. The size of bridges decreased as the Stokes number decreased. The number of bridges was significantly higher for dendritic structures on the fiber than for compact structures, where long bridges are formed during the experiment. The growth rate of the particle structure passes through a maximum at a Stokes number of 3.62. In these experiments, the CP was reached.
Based on the above results, future investigation will focus on the behavior of the separated particle structure (with different morphologies and growth progress) on the fiber array during the stretching (up to 39 % of the filter fibers). The elongation of the fibers causes stresses in the deposited particle structure, which might result in re-arrangement and detachment. The size and effects of particle structure re-arrangement and detachment will be examined and predicted as precisely as possible. It is uncertain how much elongation of the fiber structure is necessary/is possible with an entire filter medium, but it has already been shown in previous experiments that even at small elongations of 5 % the first detachment occurs during the first elongation cycle [12]. Overall, the use of elastic fibers in filter media has the potential of paving the way towards the development of adaptive filter systems in the future.

Author Contributions

Conceptualization, A.D., J.M. and L.P.; methodology, L.P.; software, L.P.; validation, A.D. and J.M.; formal analysis, L.P.; investigation, A.D.; resources, A.D.; data curation, L.P. and B.K.; writing—review and editing, A.D., J.M. and L.P.; visualization, L.P., B.K.; supervision, A.D. and J.M.; project administration, A.D. and J.M.; funding acquisition, A.D. All authors have read and agreed to the published version of the manuscript.

Funding

Gratefully acknowledge funding of this project by the Deutsche Forschungsgemeinschaft (DFG, German Research Foundation)—427981860.

Data Availability Statement

Poggemann, Lukas (2023), “Morphology of Particulate Structures on a Fiber Array before and at Clogging Point of an Aerosol Filtration Process”, Mendeley Data, V1, doi: 10.17632/g7wthghkh9.1.

Acknowledgments

Kindly thank Freudenberg Filtration Technologies SE & Co. KG for donating fiber material. We acknowledge support by the KIT Publication Fund of Karlsruhe Institute of Technology.

Conflicts of Interest

The authors follow no commercial interest with this study.

Abbreviations

The following abbreviations are used in this manuscript:
CPClogging point
MFCMass flow controller
TIFTime-integrated flux
OPCOptical particle counter
PDParticle distribution

References

  1. Thomas, D.; Penicot, P.; Contal, P.; Leclerc, D. Vendel, J. Clogging of fibrous filters by solid aerosol particles Experimental and modelling study. Chem. Eng. Sci. 2001, 56, 3549–3561. [Google Scholar] [CrossRef]
  2. Kanaoka, C. Fine Particle Filtration Technology Using Fiber as Dust Collection Medium. KONA Powder Part. J. 2019, 36, 88–113. [Google Scholar] [CrossRef]
  3. Kanaoka, C.; Emi, H.; Hiragi, S.; Myojo, T. Morphology of particulate agglomerates on a cylindrical fiber and a collection efficiency of a dust loaded fiber. In Proceedings of the Second International Aerosol Conference, Berlin, Germany, 22–26 September 1986; pp. 674–677. [Google Scholar]
  4. Müller, T.; Meyer, J.; Kasper, G. Low Reynolds number drag and particle collision efficiency of a cylindrical fiber within a parallel array. J. Aerosol Sci. 2014, 77, 50–66. [Google Scholar] [CrossRef]
  5. Zoller, J.; Zargaran, A.; Braschke, K.; Meyer, J.; Janoske, U.; Dittler, A. Morphology of particulate deposits formed on a single filter fibre by exposure to mixed aerosol flow. J. Aerosol Sci. 2020, 152, 105718. [Google Scholar] [CrossRef]
  6. Japuntich, D.A.; Stenhouse, J.I.T.; Liu, B.Y.H. Experimental Results of solid monodisperse particle clogging of fibrous filters. J. Aerosol Sci. 1994, 25, 385–393. [Google Scholar] [CrossRef]
  7. Bourrous, S.; Bouilloux, L.; Ouf, F.X.; Lemaitre, P.; Nerisson, P.; Thomas, D.; Appert-Collin, J.C. Measurement and modeling of pressure drop of HEPA filters clogged with ultrafine particles. Powder Technol. 2016, 289, 109–117. [Google Scholar] [CrossRef]
  8. Hoppe, K.; Schaldach, G.; Zielke, R.; Tillmann, W.; Thommes, M.; Pieloth, D. Experimental analysis of particle deposition in fibrous depth filters during gas cleaning using X-ray microscopy. Aerosol Sci. Technol. 2022, 56, 1114–1131. [Google Scholar] [CrossRef]
  9. Przekop, R.; Grzybowski, K.; Gradoń, L. Energy-Balanced Oscillatory Model for Description of Particles Deposition and Re-Entrainment on Fiber Collector. Aerosol Sci. Technol. 2004, 38, 330–337. [Google Scholar] [CrossRef]
  10. Tippayawong, N.; Preechawuttipong, I. (Eds.) Modified kinetic model of particle detachment by aerodynamic drag and vibration. In Proceedings of the World Congress on Engineering and Computer Science 2010 Volume II WCECS 2010, San Francisco, CA, USA, 20–22 October 2010. ISSN 2078-0958; ISSN 2078-0966. [Google Scholar]
  11. Poggemann, L.; Meyer, J.; Dittler, A. A novel method to investigate detachment of particulate structures from an elastic single fiber at low gas flow velocities. J. Aerosol Sci. 2021, 156, 105785. [Google Scholar] [CrossRef]
  12. Poggemann, L.; Meyer, J.; Dittler, A. Experimental Detection of Particle Structures Detachment from a Stretchable Single Fiber during Multiple Consecutive Stretching Cycles. Separations 2022, 9, 168. [Google Scholar] [CrossRef]
  13. Poggemann, L.; Thelen, R.; Meyer, J.; Dittler, A. Experimental investigation on the change of pull-off force between bulk particulate material and an elastic polymeric filter fiber. J. Colloid Interface Sci. 2023, 641, 903–915. [Google Scholar] [CrossRef] [PubMed]
  14. Schweers, E.; Friedrich, L. Analyse der Struktur technischer Tiefenfilter. Staub Reinhalt. Der Luft Qual. Control 1993, 53, 101–107. [Google Scholar]
  15. Müller, T. Trägheitsabscheidung von Partikeln an Parallelen Faserarrays; Verfahrenstechnik, Dr. Hut: München, Germany, 2017. [Google Scholar]
  16. Japuntich, D.A. Clogging of Fibrous Filter with Monodispers Aerosols. Ph.D. Thesis, Loughborough University of Technology, Loughborough, UK, March 1991. [Google Scholar]
  17. Japuntich, D.A.; Stenhouse, J.I.; Liu, B.Y.H. Effective Pore Diameter and Monodisperse Particle Clogging of Fibrous Filters. J. Aerosol Sci. 1997, 28, 147–158. [Google Scholar] [CrossRef]
  18. ASHRAE Standard 52-76; Method of Testing Air-Cleaning Devices Used in General Ventilation for Removing Particulate Matter. Published by Ashrae; American Society of Heating, Refrigerating and Air-Conditioning Engineers: Peachtree Corners, GA, USA, 1976.
  19. Tao, R.; Yang, M.; Li, S. Effect of adhesion on clogging of microparticles in fiber filtration by DEM-CFD simulation. Powder Technol. 2020, 360, 289–300. [Google Scholar] [CrossRef]
  20. Valdes, J.R.; Santamarina, J.C. Clogging: Bridge formation and vibration-based destabilization. Can. Geotech. J. 2008, 45, 177–184. [Google Scholar] [CrossRef]
  21. Zhang, Q. Online–Partikelmessung im Reingas zu Beginn der kuchenbildenden Staubabscheidung mit Nadelfilzen in der Gasreinigung. Chem. Ing. Tech. 2022, 94, 572–584. [Google Scholar] [CrossRef]
  22. Schweers, E. Realistic modelling of the behaviour of fibrous filters through consideration of filter structure. Powder Technol. 1994, 80, 191–206. [Google Scholar] [CrossRef]
  23. Davies, C.N. The clogging of fibrous aerosol filters. J. Aerosol Sci. 1970, 1, 35–39. [Google Scholar] [CrossRef]
  24. Jodeit, H. Untersuchungen zur Partikelabscheidung in technischen Tiefenfiltern. Ph.D. Thesis, Universität Karlsruhe, Düsseldorf, Germany, 1985. [Google Scholar]
  25. Lehmann, M.J. Untersuchungen zur Struktur und zur Beladungskinetik von Tiefenfiltern. Ph.D. Thesis, Universitätsverlag Karlsruhe, Karlsruhe, Germany, 2005. [Google Scholar]
  26. Rembor, H.J. Das Verhalten von Tiefenfiltern bei zunehmender Beladung. Ph.D. Thesis, Universität Karlsruhe, Aachen, Germany, 2002. [Google Scholar]
  27. Hoppe, K.; Wischemann, L.; Schaldach, G.; Zielke, R.; Tillmann, W.; Thommes, M.; Pieloth, D. Filtration Kinetics of Depth Filters—Modeling and Comparison with Tomographic Data of Particle Depositions. Atmosphere 2023, 14, 640. [Google Scholar] [CrossRef]
  28. Müller, T.K.; Meyer, J.; Thébault, E.; Kasper, G. Impact of an oil coating on particle deposition and dust holding capacity of fibrous filters. Powder Technol. 2014, 253, 247–255. [Google Scholar] [CrossRef]
  29. Wang, H.; Zhao, H.; Wang, K.; He, Y.; Zheng, C. Simulation of filtration process for multi-fiber filter using the Lattice-Boltzmann two-phase flow model. J. Aerosol Sci. 2013, 66, 164–178. [Google Scholar] [CrossRef]
  30. Papapostolou, V.; Zhang, H.; Feenstra, B.J.; Polidori, A. Development of an environmental chamber for evaluating the performance of low-cost air quality sensors under controlled conditions. Atmos. Environ. 2017, 171, 82–90. [Google Scholar] [CrossRef]
  31. Kasper, G.; Schollmeier, S.; Meyer, J. Structure and density of deposits formed on filter fibers by inertial particle deposition and bounce. J. Aerosol Sci. 2010, 41, 1167–1182. [Google Scholar] [CrossRef]
  32. Hiller, R.; Löffler, F. Einflussgrad von Auftreffgrad und Haftanteil auf die Partikelabscheidung in Faserfiltern. Staub Reinhalt. Der Luft Air Qual. tealControl 1980, 40, 405–411. [Google Scholar]
  33. Brach, R.M.; Dunn, P.F. Models of Rebound and Capture for Oblique Microparticle Impacts. Aerosol Sci. Technol. 1998, 29, 379–388. [Google Scholar] [CrossRef]
  34. Payatakes, A.C.; Tien, C. Particle deposition in fibrous media with dendrite-like pattern: A preliminary model. J. Aerosol Sci. 1976, 7, 85–100. [Google Scholar] [CrossRef]
  35. Schollmeier, S. Beladungskinetik von Faserfiltern. Ph.D. Thesis, Universität Fridericiana Karlsruhe (TH), Karlsruhe, Germany, 2008. [Google Scholar]
Figure 1. LEFT: Pressure drop as a function of particle mass during the filtration time. RIGHT: Schematic of the filtration phases during a depth filtration process. (a) Depth filter phase, (b) Transition phase, (c) Surface filter phase.
Separations 10 00462 g001
Figure 2. Fiber clamping device with five fibers. Enlarged view on the right: The fibers fixed to the comb have a spacing of 246 μm [28].
Separations 10 00462 g002
Figure 3. Process flow diagram of the array loading procedure, including the optical equipment at the top of the inlet pipe for the observation of the clogging process on the fiber array.
Separations 10 00462 g003
Figure 4. Images of the non-loaded and loaded fiber before (top) and after processing (bottom) with MATLAB. (right) The free space is marked red. (left) The accumulated particle material in the spacing is marked turquoise.
Separations 10 00462 g004
Figure 5. Borderline of a loaded fiber after processing with MATLAB. The orange line symbolizes a single borderline of an unloaded fiber. bottom: Equation for the calculation of the ratio between the borderline of the particle structure to the borderline of the initial structure. Only the two inner fiber spacings are considered.
Separations 10 00462 g005
Figure 6. (left) Cut-out of a frame—original image. (right) Cut-out of a frame/schematic with bridges (red) in the interspaces between the fibers. Particulate material is colored white. The fiber is purple.
Separations 10 00462 g006
Figure 7. Schematic detection procedure of a bridge within the emerging particle structure on the array. The bridges are formed in the interspace between two fibers. A bridge divides one pore into two pores.
Separations 10 00462 g007
Figure 8. Development of mass on the array over fiber length (5 equally spaced fibers) as a function of TIF.
Separations 10 00462 g008
Figure 9. Relative accumulated particulate material in the spacing at the initial three evaluation points of the experiment, representing the depth filter phase and transition phase. A growth rate analysis was conducted for each curve to determine particle accumulation in the interspaces of the fiber array.
Separations 10 00462 g009
Figure 10. Particulate material on the fiber for two different flow velocities. All experiments were performed three times.
Separations 10 00462 g010
Figure 11. Rate of particle accumulation as a function of Stokes before CP.
Separations 10 00462 g011
Figure 12. Particle structures in experiments with three different superficial velocities at 4 evaluation points.
Separations 10 00462 g012
Figure 13. Particulate material on the array and the corresponding total number of bridges. All experiments were performed three times.
Separations 10 00462 g013
Figure 14. Images of the development of particle structure of the array in experiments with three different superficial velocities.
Separations 10 00462 g014
Figure 15. Development of boundary line for the three representative flow velocities over the complete duration of the experiments. The particle concentration in the feed flow was 1.6 × 10 5 # / cm 3 . All experiments were performed three times.
Separations 10 00462 g015
Figure 16. Size and number of bridges between the fibers in the experiments up to CP. At 1.8 m/s, 0.65 m/s, and 0.25 m/s. Scaling of colors (number) is logarithmic. Size of bridges parallel to the axis of the fiber.
Separations 10 00462 g016
Figure 17. Images of the characteristic pores and bridges at three different airflow velocities during the loading procedure at the corresponding TIF.
Separations 10 00462 g017
Figure 18. Hydraulic diameter of the pores between the fibers in the experiments before reaching CP. At 1.8 m/s, 0.65 m/s, and 0.25 m/s. Grayscale (total number) is logarithmic. The pores at TIF = 0 are the interspaces between the fibers. Plot for 0.65 m/s: Hole in the clogged particle structure.
Separations 10 00462 g018
Table 1. Characteristic numbers for the tested flow velocities.
Flow Velocity u
/m/s
Volume Rate (Loading Flow)
/ L · min 1
Re/-Stokes St /-Pe/-R/- β /-
0.11.210.540.51 2.72 × 10 6 0.09 0.773
0.151.760.780.82 3.97 × 10 6 0.09 1.12858
0.253.051.351.30 6.88 × 10 6 0.09 0.95569
0.657.843.483.62 1.77 × 10 7 0.09 5.0245
1.214.486.426.70 3.26 × 10 7 0.09 9.276
1.821.719.6310.05 4.90 × 10 7 0.09 13.914
Table 2. TIF at the evaluation points for video-based analysis of the fiber array.
TIF at Evaluation Point/ Particle · mm 2
Feedrate Aerosol Generator1234
10 5.5 × 10 7 1.15 × 10 8 1.73 × 10 8 2.8 × 10 8
Disclaimer/Publisher’s Note: The statements, opinions and data contained in all publications are solely those of the individual author(s) and contributor(s) and not of MDPI and/or the editor(s). MDPI and/or the editor(s) disclaim responsibility for any injury to people or property resulting from any ideas, methods, instructions or products referred to in the content.

