Article

Optimization of QuEChERS Method for Antibiotic Residue Analysis in Animal Foods via Response Surface Methodology

Jiaxing Center for Disease Control and Prevention, Jiaxing 314050, China
*
Author to whom correspondence should be addressed.
Separations 2023, 10(8), 459; https://doi.org/10.3390/separations10080459
Submission received: 30 June 2023 / Revised: 21 July 2023 / Accepted: 24 July 2023 / Published: 21 August 2023

Abstract

:
The present study employed a modified QuEChERS method to systematically analyze the presence of fifteen quinolone and seven tetracycline antibiotic residues in local animal food. Additionally, a multi-level four-factor Box–Behnken design (BBD) within the framework of response surface methodology (RSM) was utilized to evaluate the factors impacting the detection efficiency of the sample pretreatment procedure. Optimization was performed via Design Expert® 10.0.3, and the factors, including the volume of the acetonitrile, the addition of formic acid, the duration of the extraction, and the addition of EDTA, were combined with experimental design until an optimal solution was reached. Finally, the sample was tested via ultra-high performance liquid chromatography-quadrupole-linear ion trap mass spectrometry (UPLC/MS/MS) in both multiple reaction monitoring (MRM) and enhanced product ion (EPI) scan modes on a QTRAP® 5500 instrument (AB SCIEX instruments, Framingham, MA, USA). The overall average recoveries from actual samples fortified with 22 antibiotics at three levels ranged from 73.8% to 98.5% based on the use of matrix-fortified calibration, with variations ranging from 5.80 to 12.4% (n = 6). The limits of detection and quantification were 0.3 μg kg−1 and 1.0 μg kg−1, respectively. Lastly, the modified method was applied to practical sample analysis in the daily risk monitoring and assessment of food safety with satisfactory stability and robustness.

1. Introduction

Antibiotic resistance, the ability of bacteria to withstand antibiotics, is now recognized as one of the most serious global threats to human health [1,2,3]. Naturally occurring resistance that can ultimately lead to incurable bacterial infections could be accelerated by the improper use of antibiotics in human beings and animals [4]. Except for the misuse of antibiotics in human medicine, antibiotics’ misuse in livestock is also a major contributor to the emergence of antibiotic resistance [5,6]. To satisfy the growing global demand for animal protein, antibiotics have been massively and increasingly used in farmed animal industries for different purposes, including overdoses for disease prevention and subtherapeutic doses for growth stimulation [7,8,9,10,11,12,13]. In September 2017, a report from the World Health Organization (WHO) corroborated that the world is running out of antibiotics [14,15,16,17]. Antibiotic misuse, if left unchecked, can drag human beings into a post-antibiotic era whereby minor injuries or common infections become fatal diseases again [18].
To protect the public from health risks, nations and related organizations had to establish broader maximum-residue limits (MRLs) for further surveillance of antibiotic residues in animal food [19,20]. Therefore, more efficient and robust detection methods were promptly developed in the past few years to satisfy increasingly rigorous regulatory requirements [21,22,23,24,25,26,27]. Triple quadrupole mass spectrometer with multiple reaction monitoring (MRM) scan modes that follow the requirement of ECD 2002/657/EC should be the preferred method of detection of antibiotic residues in animal food [28,29,30]. The Qtrap system (AB Sciex) with the scan mode of multiple reaction monitoring—information-dependent acquisition—enhanced product ion scan mode (MRM—IDA—EPI) was found to efficiently gather comprehensive information from samples in a single run. Consequently, the identification of antibiotic residues in locally sourced animal-derived food was reaffirmed through the successful comparison of antibiotic spectra from the samples with reference spectra. Quinolones and tetracyclines, being the most extensively employed veterinary antibiotics, have contributed to the development of antibiotic resistance, thereby adversely impacting the treatment of severe bacterial infections [31,32,33]. In this study, a diverse range of samples, fortified with fifteen quinolone and seven tetracycline antibiotics at the recommended concentration (RC) of 1 µg L−1, were subjected to analysis using liquid chromatography-tandem mass spectrometry with a QTRAP 5500 instrument.
Sample pretreatment for the separation and concentration of antibiotic residues is also a critical step in the whole analysis process of quinolone and tetracycline detection. There are, alternatively, two purification methods, including QuEChERS and solid-phase extraction. The latter, using commercial cartridges, has been widely used in daily work based on former research (Figure A1) [34]. It can be performed in an automated SPE system (e.g., Reeko, Fotector plus, USA) during non-working hours and minimize human involvement (Table A1), but high-fat or high-protein samples should be excluded, given that they frequently cause blockage in SPE cartridges and heavily prolong the pretreatment process. Since its development in 2003, QuEChERS has gained widespread acceptance for various sample preparation techniques [35,36,37,38,39,40]. It was initially introduced as a cost-effective and time-efficient method for analyzing multi-residue samples containing relatively polar compounds. During the extraction process, the efficiency of the QuEChERS sample preparation method is known to be influenced by several factors. Thus, it is imperative to comprehensively optimize this method for the detection of quinolone and tetracycline residues in this study. As a collection of statistical and mathematical techniques, response surface methodology (RSM) has vital applications in the design, development, and improvement of novel or existing product designs [41,42], especially in multi-variable analysis [43,44]. In the present study, response surface methodology with a multi-level four-factor Box–Behnken design (BBD) was applied to simultaneously evaluate the recovery rate of quinolone and tetracycline residues in sample pretreatment.

2. Materials and Methods

2.1. Standards and Stock Solutions

Standards of the following twenty-two antibiotics were all purchased from Dr. Ehrenstorfer GmbH (Augsburg, Germany): Oxytetracycline (Oxytetracycline hydrochloride, 96.5%), Tetracycline (Tetracycline hydrochloride, 98.0%), Doxycycline (Doxycycline hyclate, 98.7%), Demeclocycline (98.0%), Methacycline (99.0%), Minocycline (99.0%), Chlortetracycline (Chlortetracycline hydrochloride, 94.6%), Enrofloxacin (99.0%), Norfloxacin (99.1%), Pefloxacin (Pefloxacin methanesulfonate dehydrate, 99.0%), Ciprofloxacin (Ciprofloxacin hydrochloride, 94.0%), Ofloxacin (99.0%), Sarafloxacin (Sarafloxacin hydrochloride, 97.0%), Enoxacin (95.8%), Lomefloxacin (Lomefloxacin hydrochloride, 99.5%), Pipemidic acid (99.1%), Nalidixic acid (99.0%), Oxolinic acid (98.0%), Flumequine (98.5%), Cinoxacin (99.0%), Danofloxacin (Danofloxacin mesylate, 94.0%), and Difloxacin (Difloxacin hydrochloride, (99.2%)). Individual standards were weighed using an electronic balance (Metter Toledo, MS 205DU), dissolved in methanol at a concentration of 1.0 mg mL−1 or ethanol solution supplemented with potassium hydroxide (for antibiotics that were practically insoluble in methanol), and provisionally stored at −28 °C.

2.2. Reagents and Chemicals

Methanol and acetonitrile of HPLC grade used in this study were procured from Merck (Darmstadt, Germany). Ethanol of HPLC grade and formic acid (≥98%) were acquired from Aladdin (Shanghai, China). Potassium hydroxide (G.R.) was purchased from Macklin (Shanghai, China). Cleanert® C18 for QuEChERS was purchased from Agela Technologies (Beijing, China). Ultra-pure water was obtained from a Milli-Q water purification system from Millipore (Bedford, MA, USA). Oasis® HLB SPE cartridges (6 cc, 200 mg) were purchased from Waters (Milford, MA, USA). Millipore filters (0.22 μm, polytetrafluoroethylene) were obtained from ANPEL Lab (Shanghai, China). Sodium chloride (A.R.) and sodium sulfate (A.R.) were calcined in a muffle furnace prior to use. Citric acid (A.R.), disodium hydrogen phosphate (A.R.), and disodium ethylenediamine tetraacetic acid (EDTA, A.R.) for sample preparation were purchased from Sinopharm Chemical Reagent (Shanghai, China).

2.3. Instrumentation and Software

HPLC analysis was conducted on a Shimadzu LC-30AD system with a Waters BEH C18 column (1.7 µm 2.1 mm × 100 mm, Waters, Milford, MA, USA). Regarding mass spectrometric detection, all experiments were carried out in the MRM-IDA-EPI scan mode using AB SCIEX QTRAP® 5500 (AB SCIEX instruments, Framingham, MA, USA). The compounds were ionized in a Turbo V™ Ion Source (ESI) interface in the positive ionization mode. An Analyst® software v. 1.6.2 (AB SCIEX instruments, Foster City, Canada) was utilized to remotely control the chromatograph and mass spectrometer. A capillary voltage of 5.50 kV and desolvation temperature of 500 °C were applied to the ESI source. Nitrogen produced by the generator (Claind Nitro35, Tremezzina, Italy) was used as the cone gas (50 psi), desolvation gas (50 psi), and collision gas. Quantitative analysis of the experiments was conducted using MultiQuant® 3.0.1. The optimization of QuEChERS using the response surface method was performed on Design Expert® 10.0.3.

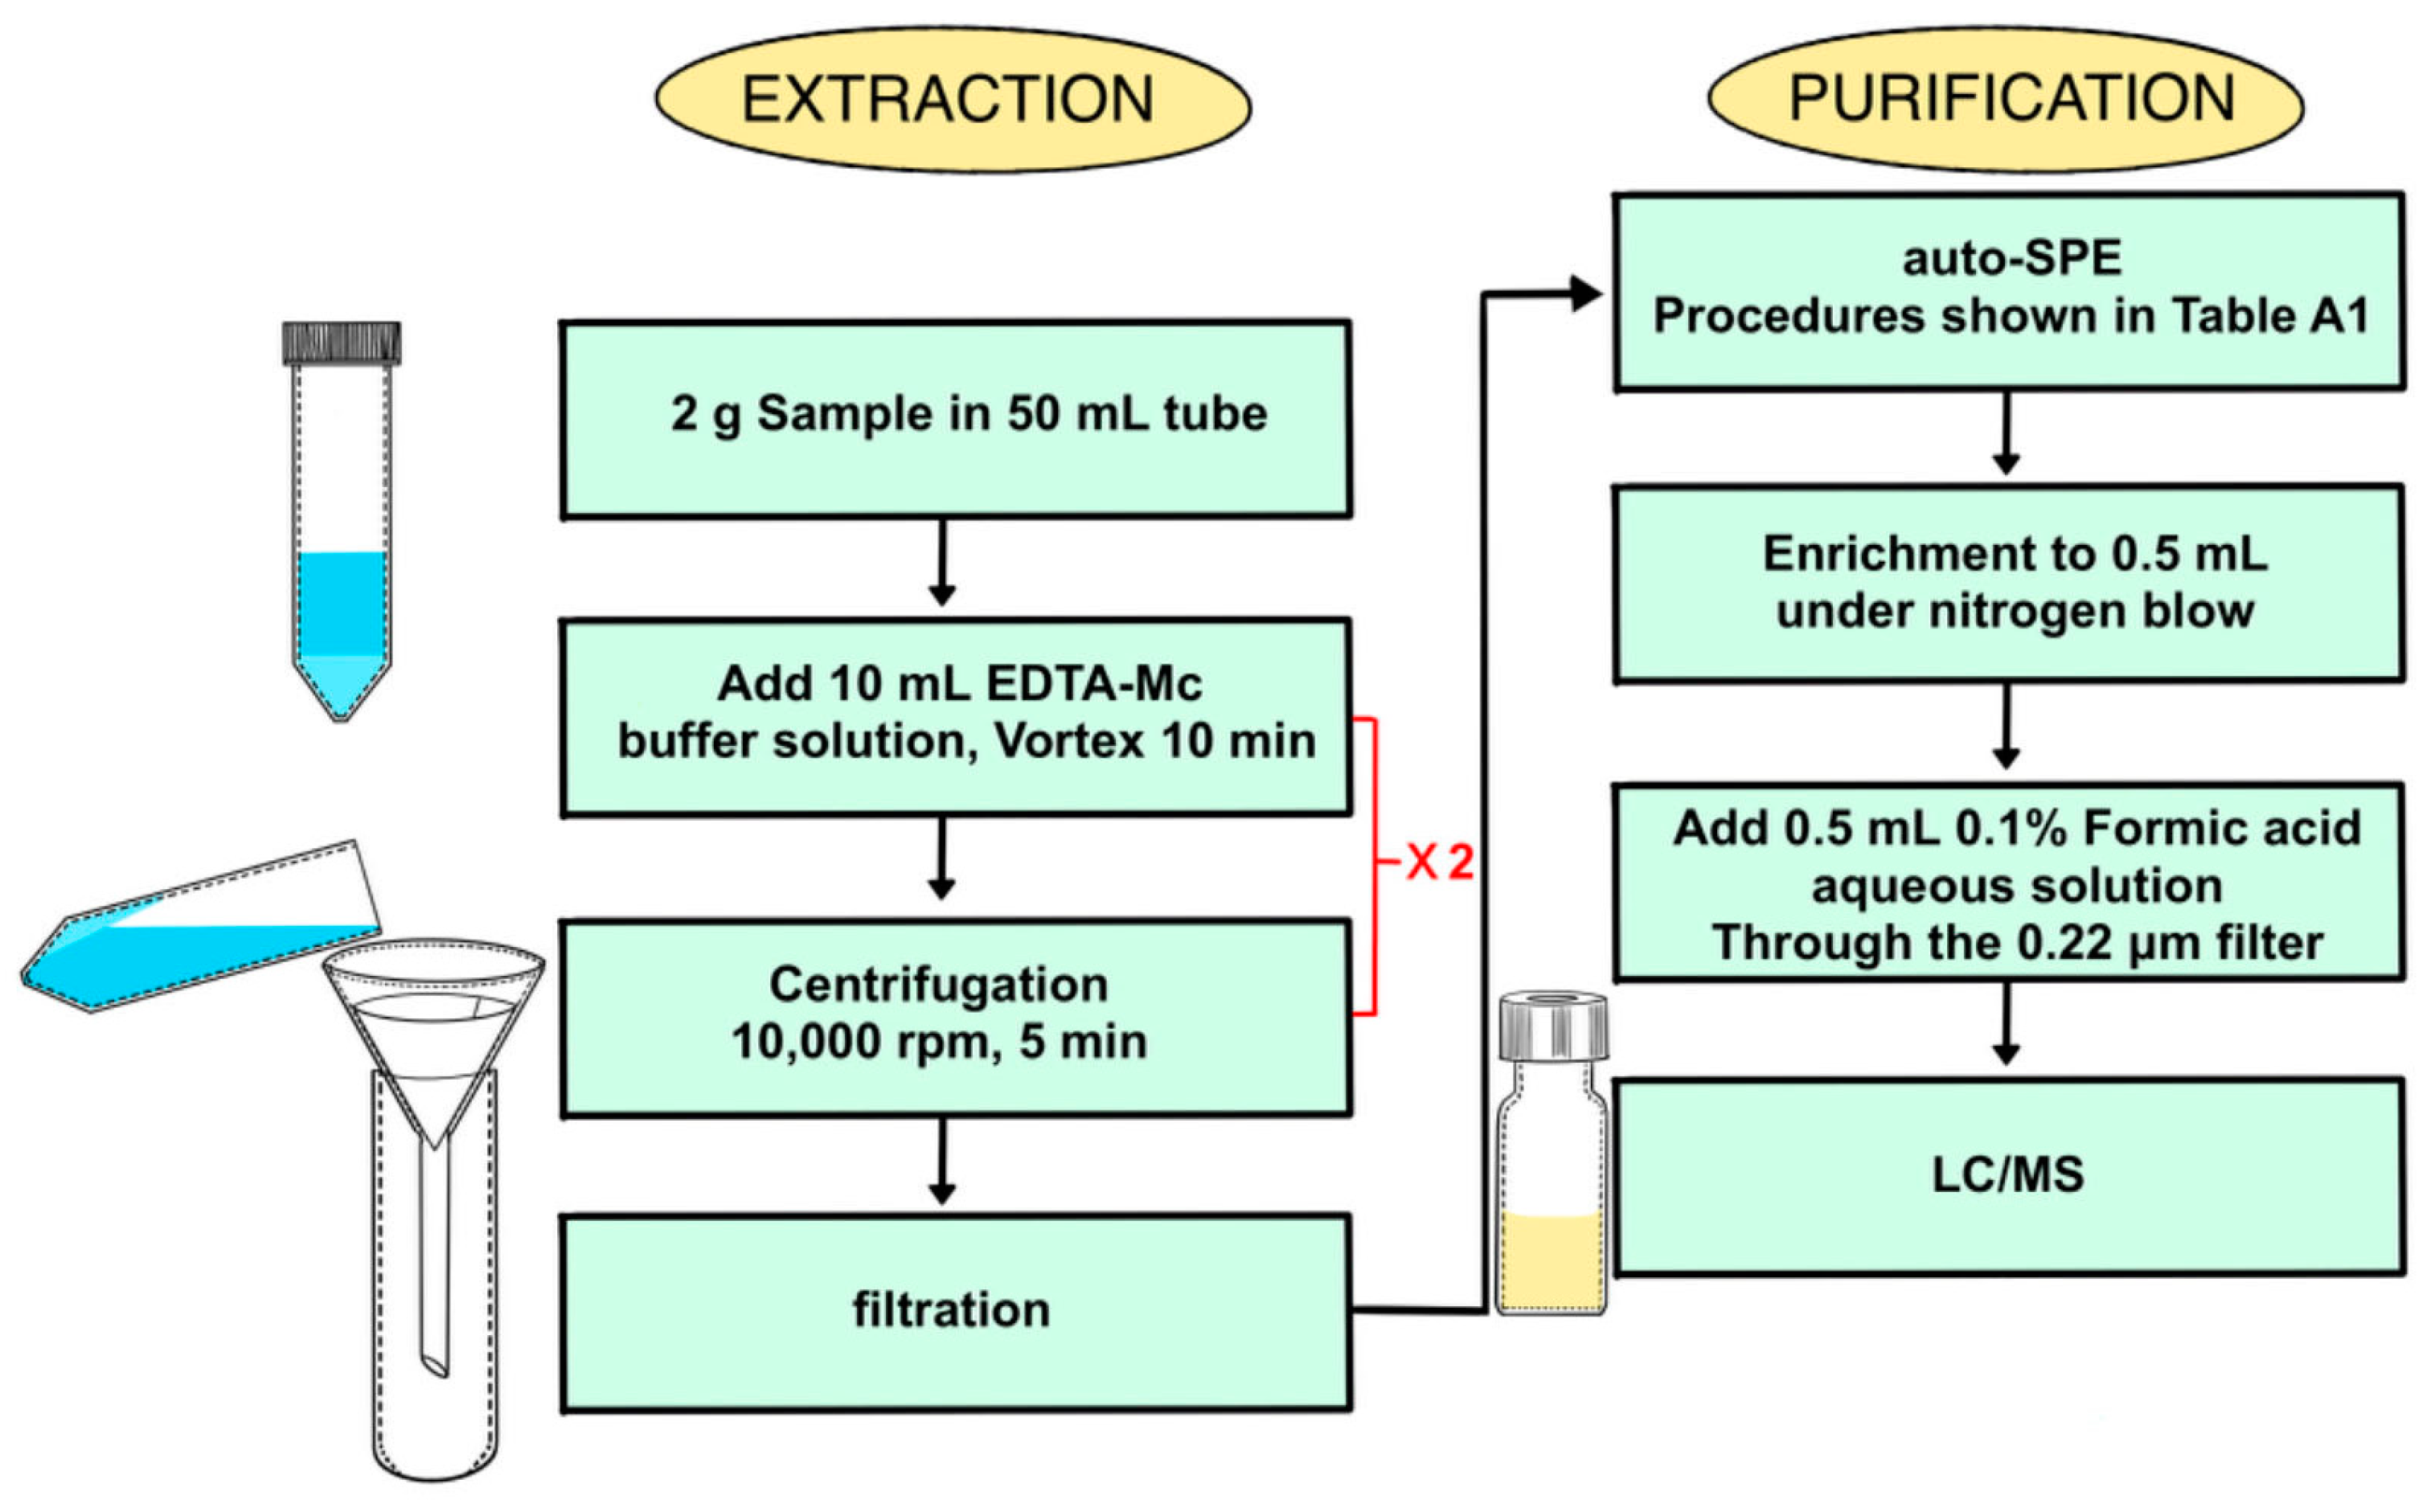
2.4. Sample Collection and Processing

The samples were collected from local markets or supermarkets distributed randomly across neighborhoods of the whole city, including swine, poultry, eggs, milk, and eight cultured aquatic products (Parabramis pekinensis, Carassius auratus, Ctenopharyngodon idella, Ophiocephalus argus Cantor, Macrobranchium nipponense, Macrobrachium rosenbergii, Penaeus chinensis, Procambarus clarkia, Eriocheir sinensis, and Larimichthys crocea). The edible portion of the aforementioned samples was ground and homogenized using a Mixer (BÜCHI, B400, Eastern Switzerland) and stored in polypropylene bottles at −28 °C for the ensuing analyses.

3. Results

In the sample pretreatment process using the SPE extraction method, 0.1 mol L−1 EDTA-Mcllvaine buffer solution (pH = 4.0), a non-volatile, non-poisonous, low-cost, and eco-friendly solution, was used as the extraction solution for quinolone and tetracycline residues [34,45,46,47]. Furthermore, when handling a large amount of sample, the SPE method could enhance stability by increasing the level of automation without increasing human operational time (Table A1). However, during the flowing sample purification procedure, the aqueous solution extracted from high-fat samples, particularly egg-containing samples, may potentially increase the risk of blockage in SPE cartridges and significantly prolong the detection time.

3.1. Experimental Design

The QuEChERS sample preparation method could be applied as an alternative for a quick analysis of quinolone and tetracycline residues in high-fat samples. As documented in former research, the efficiency of the QuEChERS sample preparation method for quinolone and tetracycline residues could be affected by multifarious factors, including the volume of acetonitrile, pH value of the extracted solvent, and duration of the extraction process, among others [35,36,37,38,39,40].
Attributed to the unique chemical structure of quinolones and tetracyclines, agent–agent interactions [48] between antibiotics and metal ions from the experimental environment could influence the recovery rate. As in the EDTA-Mcllvaine buffer solution of the SPE method, EDTA acts as a screening agent for metal ions that could also be introduced in the extraction process of the QuEChERS method. As illustrated in Figure 1, when the amount of added EDTA ranged from 0 to 0.2 g in 2 g of the sample using the QuEChERS preparation, the medium recovery rate of 22 antibiotics progressively plateaued at approximately 100 mg. According to the result of this experiment, 0.1 g of EDTA was selected as the auxiliary reagent in the extraction process.

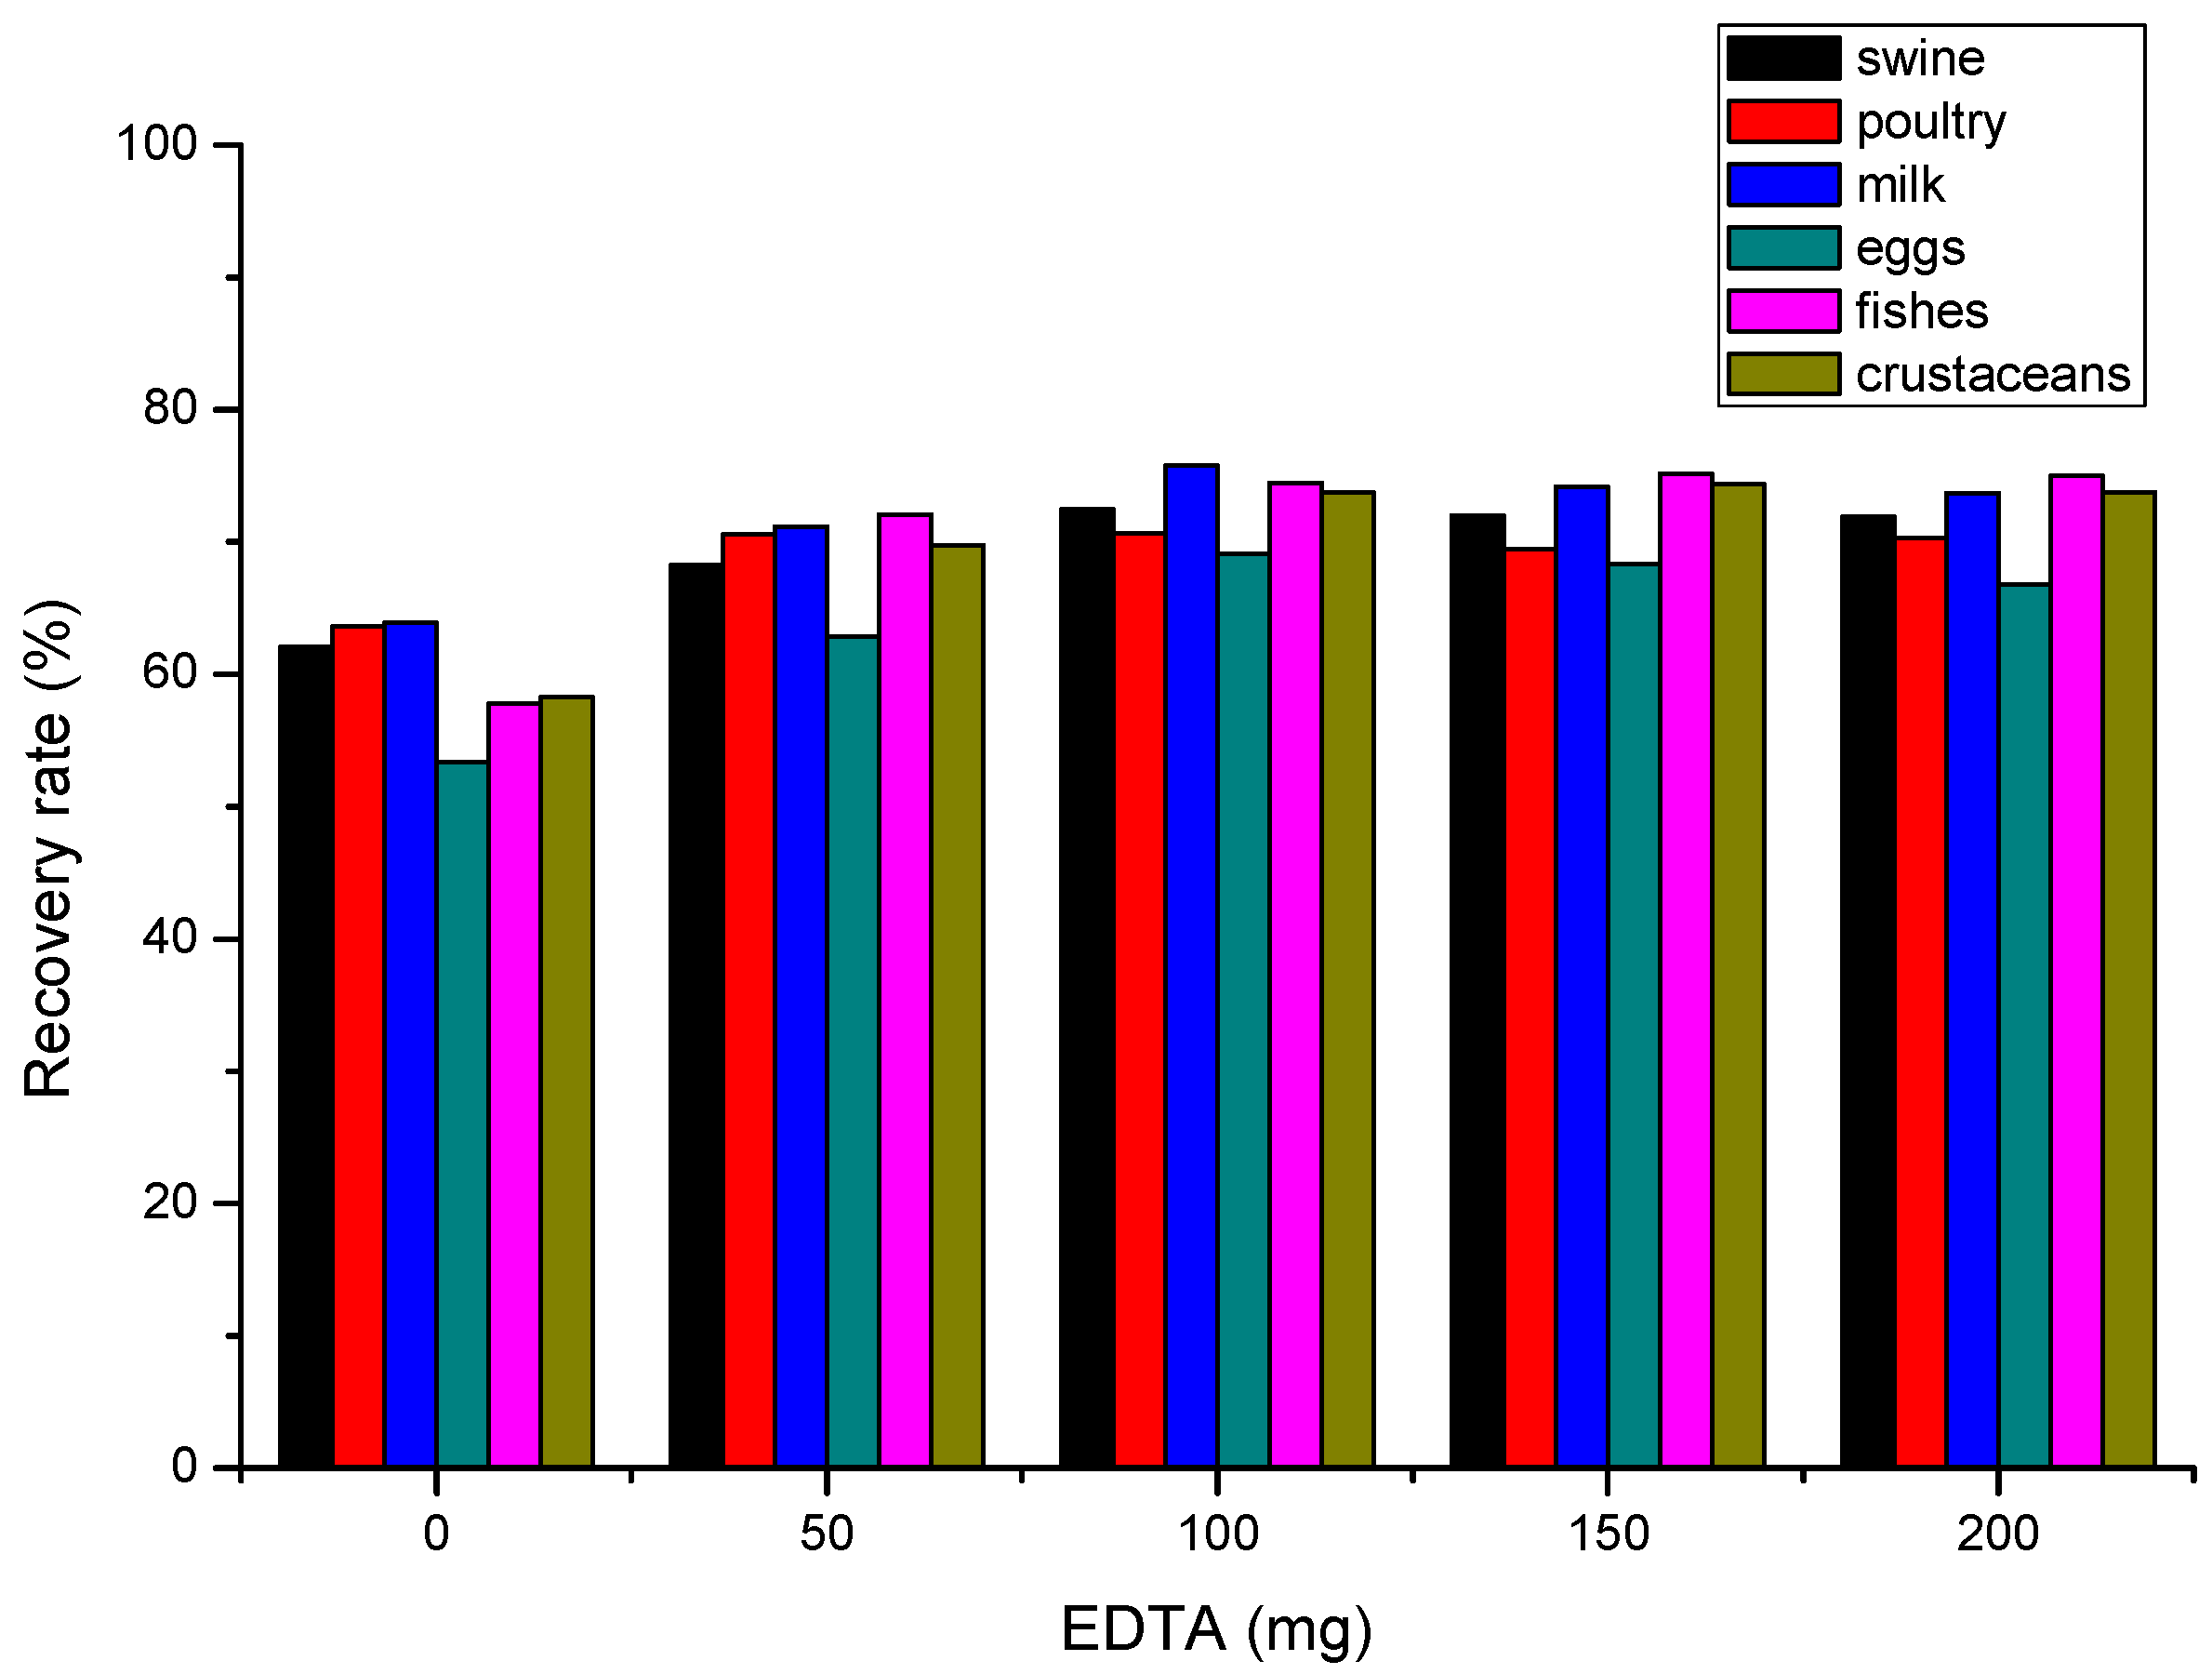
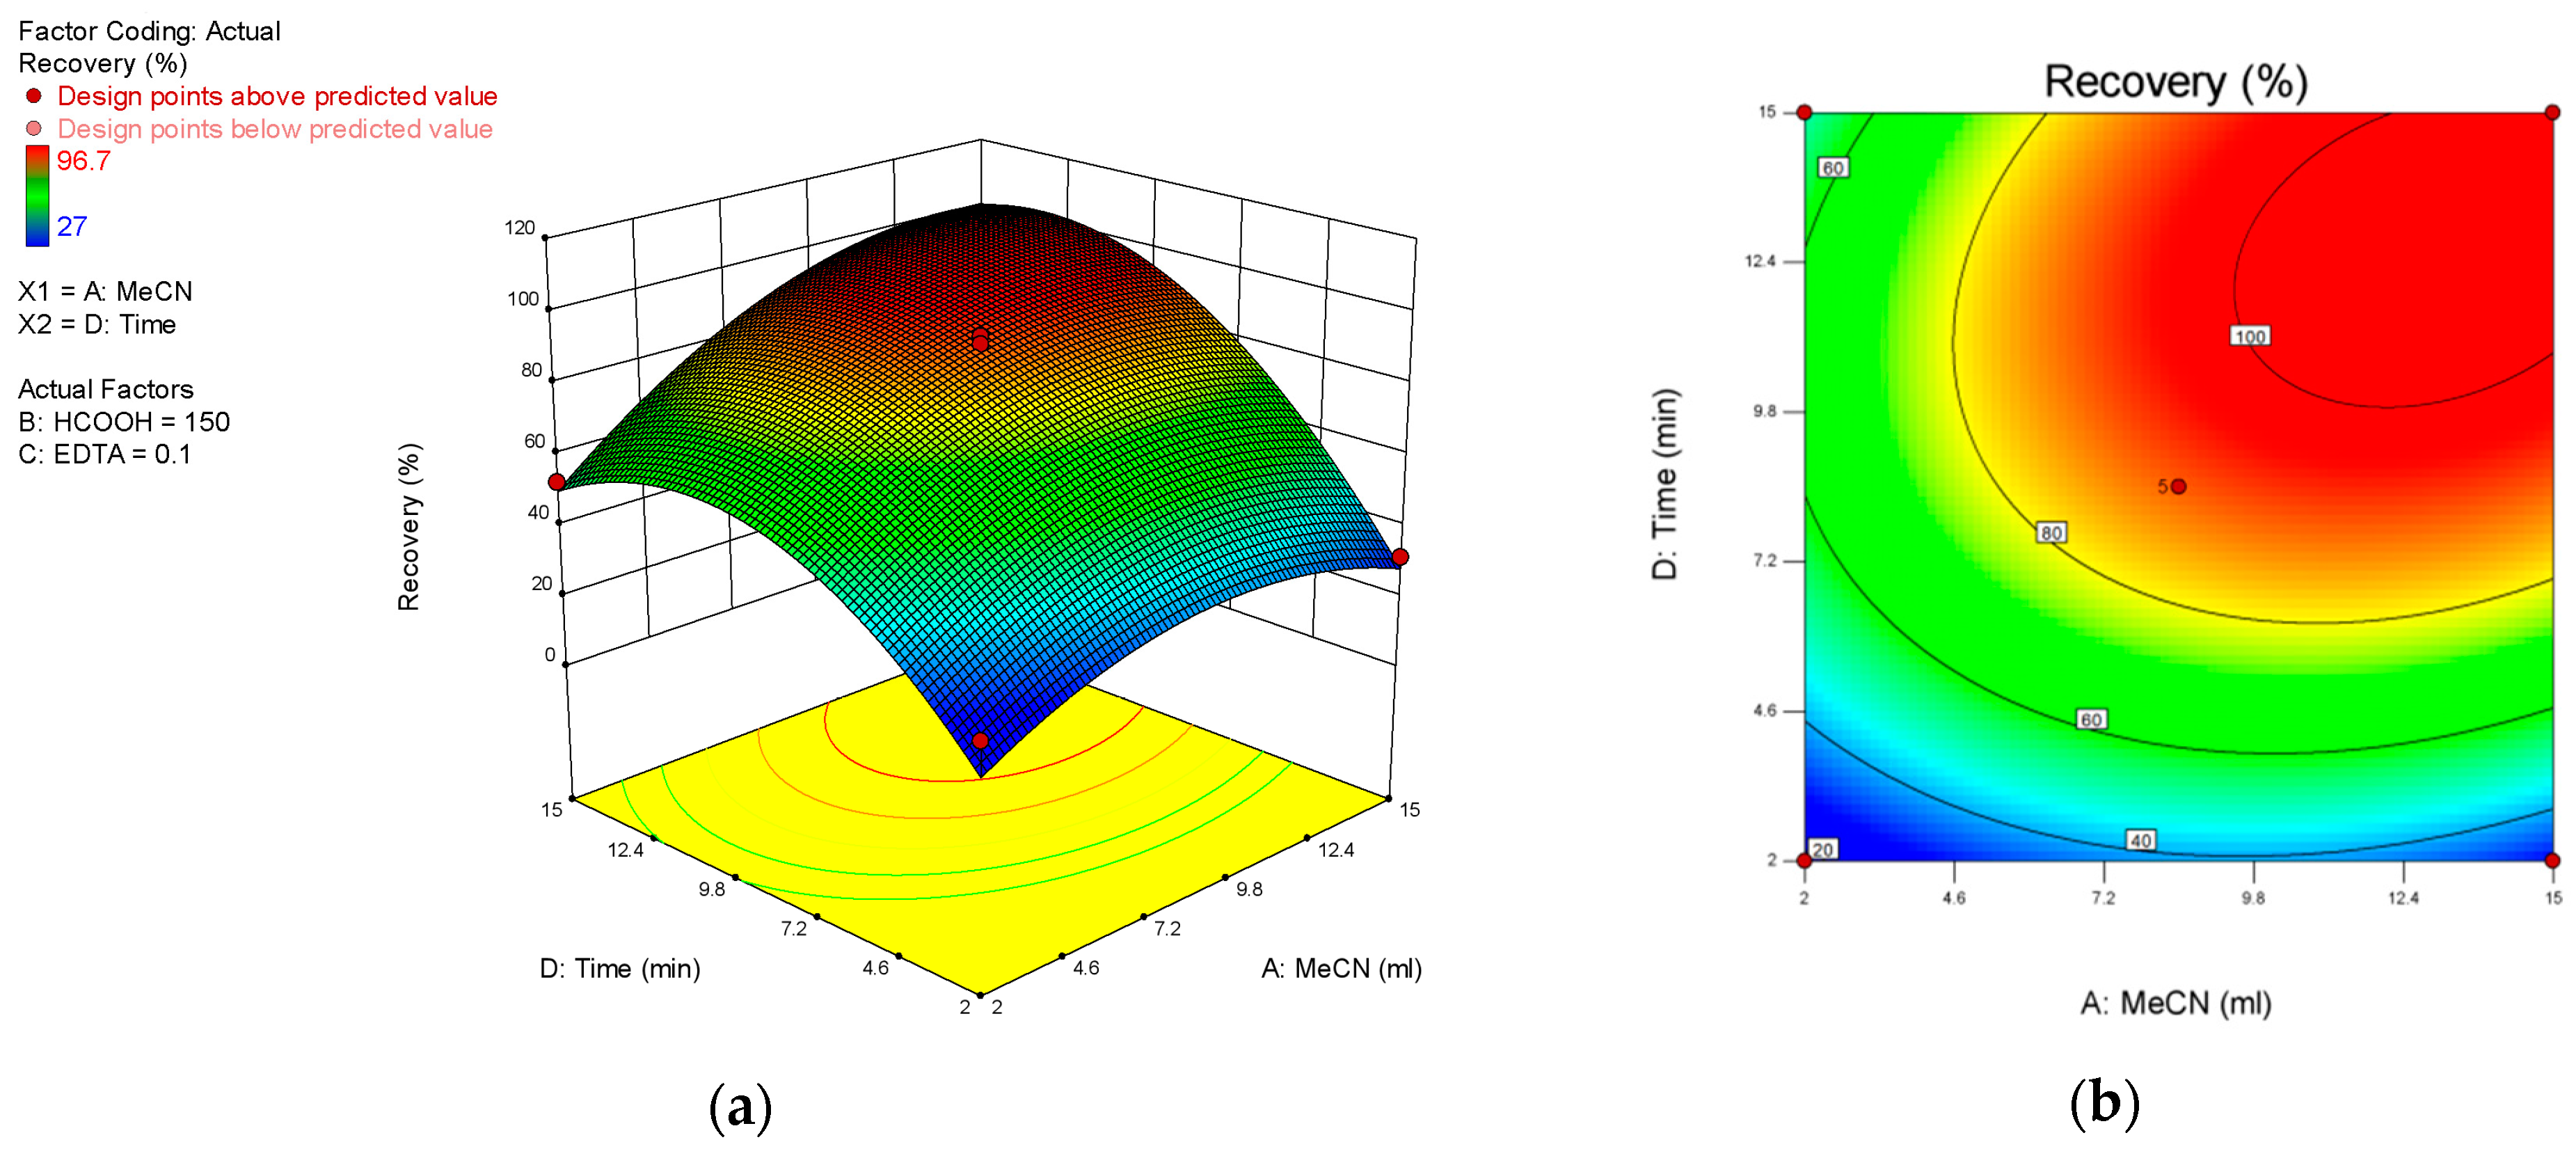
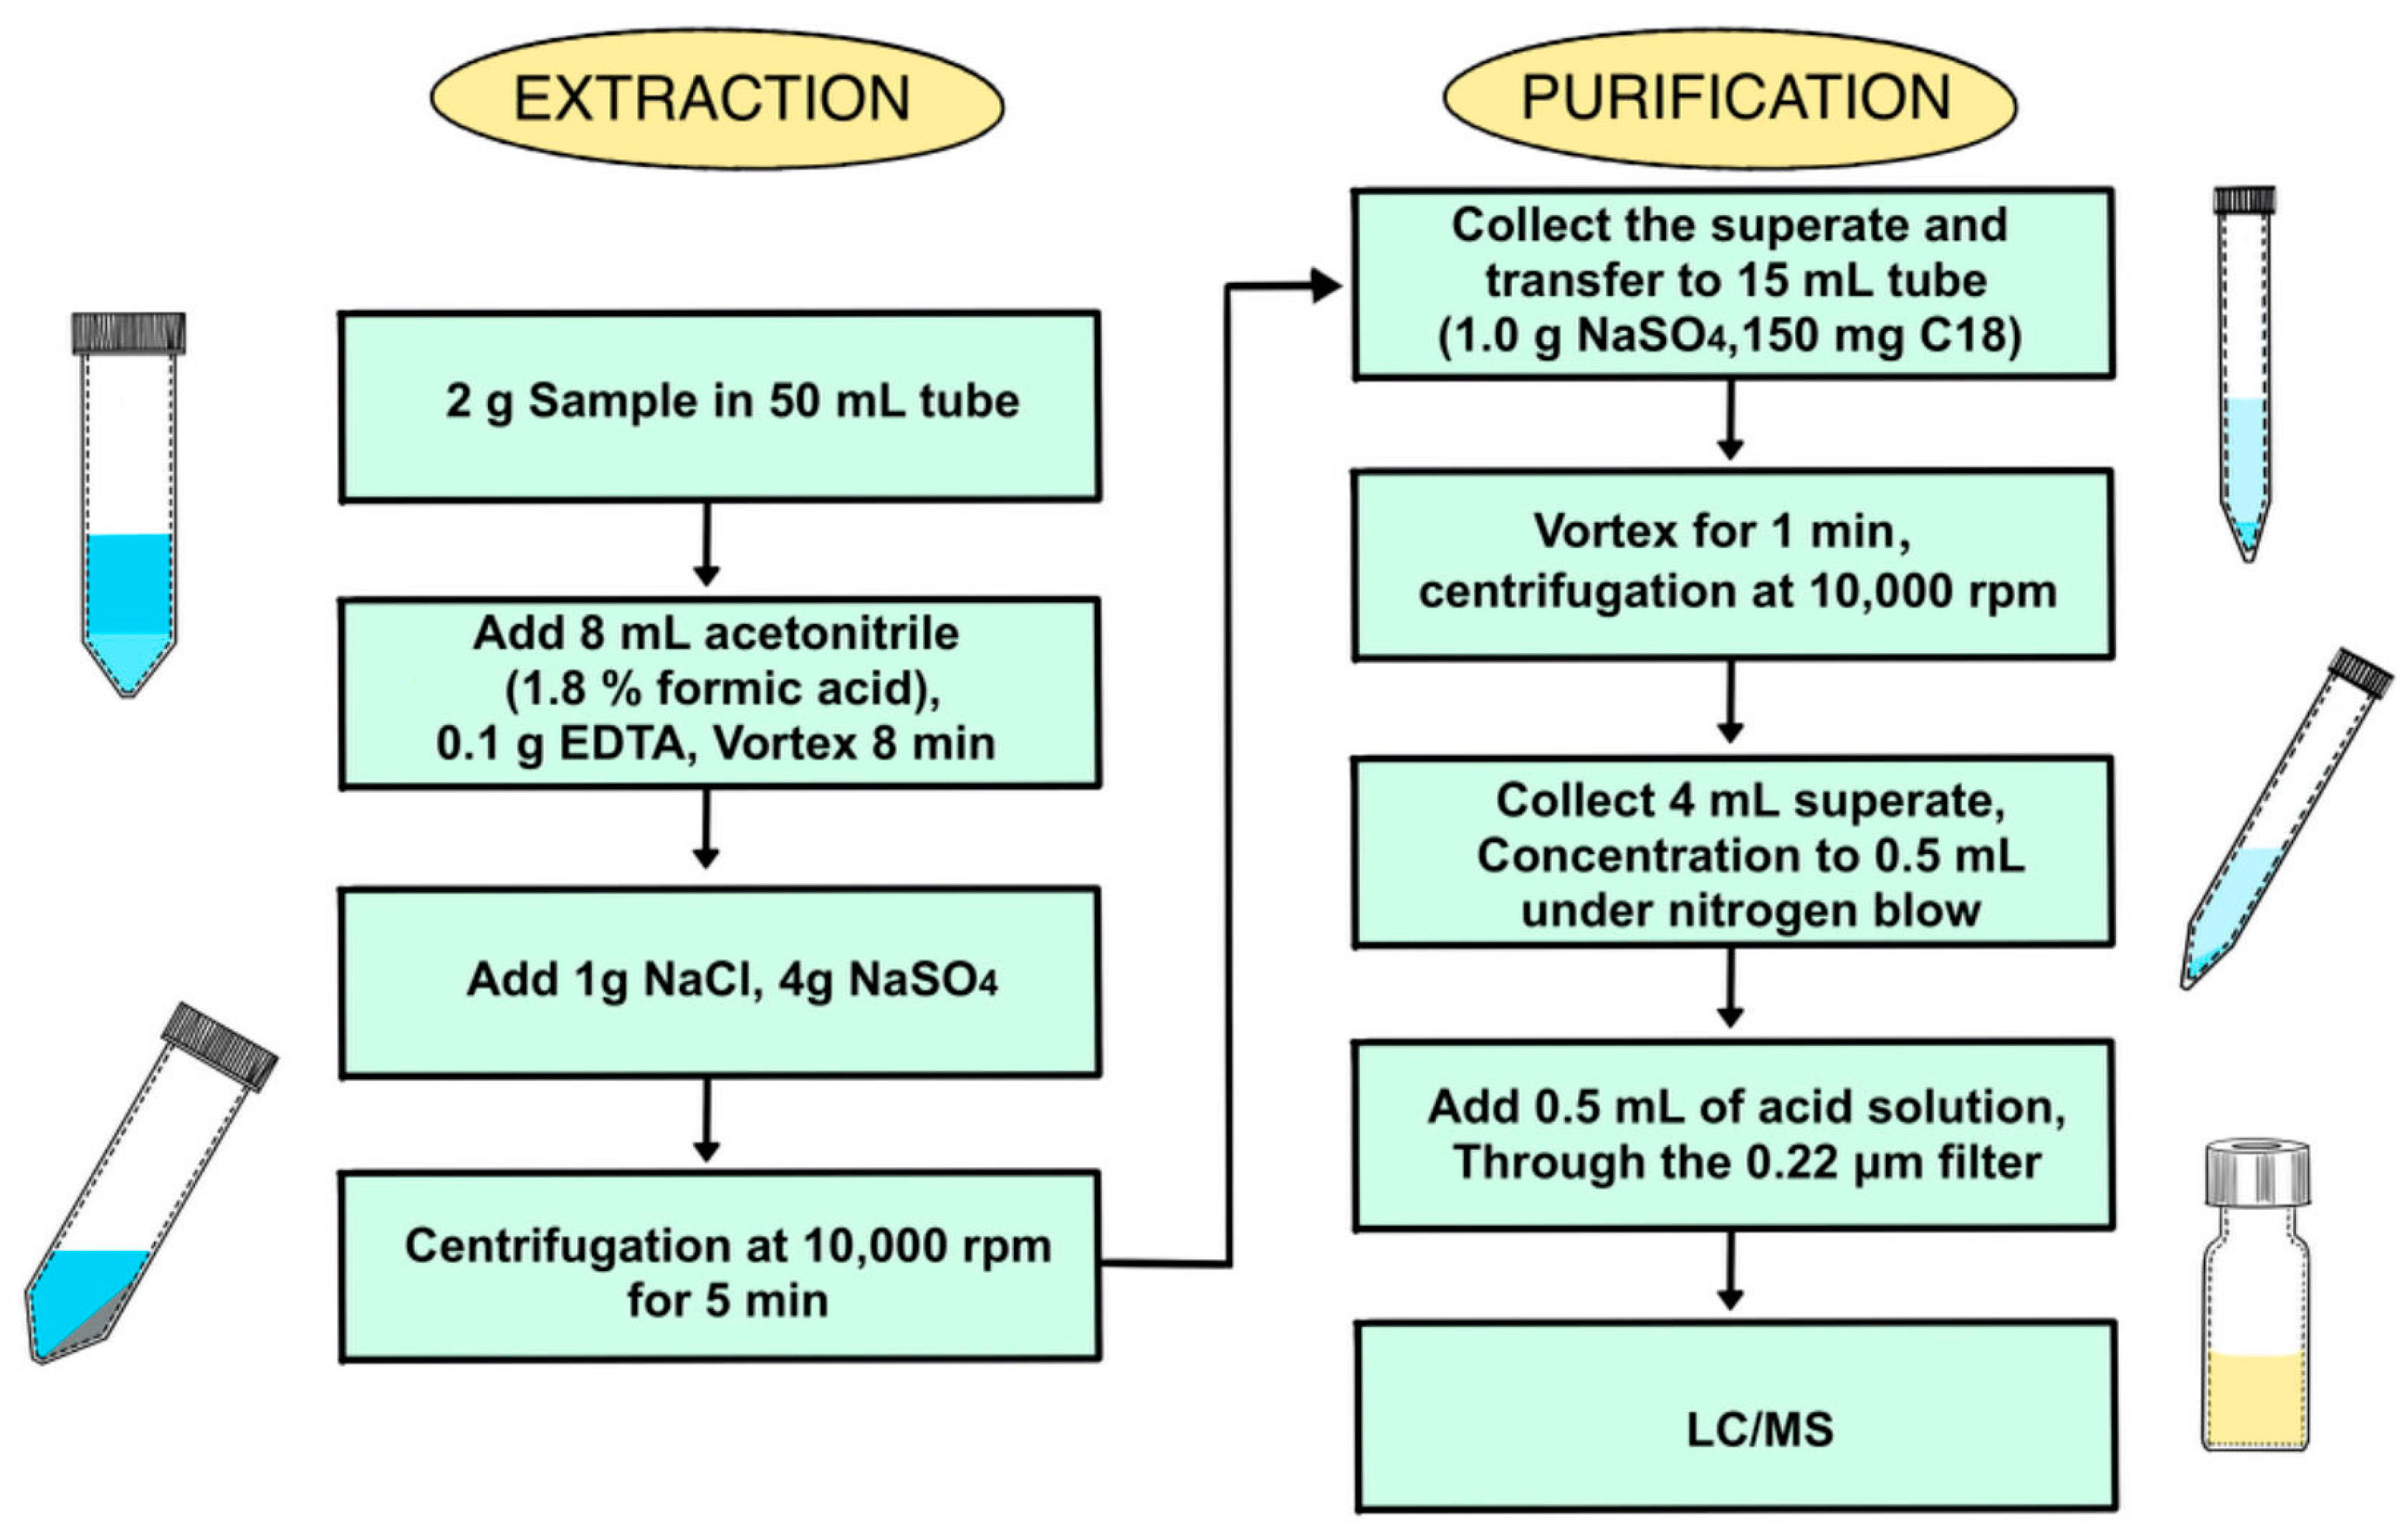
3.2. Optimization of QuEChERS Method Using the Response Surface Method (RSM)

The QuEChERS sample preparation method is multivariable for the optimization of the extraction process. Its efficiency could be affected by multifarious factors, including the volume of the acetonitrile (A), the additive amount of formic acid (B), the additive amount of EDTA (C), and the extraction time (D). Nevertheless, the univariate experiment has limited ability to evaluate the interactions of the extraction conditions in sample preparation. To avoid interactions among extraction conditions while examining the optimal extraction process, possible factors were comprehensively optimized via the response surface method (RSM), including the volume of the acetonitrile (A), the additive amount of formic acid (B), the additive amount of EDTA (C) and the extraction time (D). The median recovery rate of the 22 antibiotics from standard samples (2.0 μg kg−1, n = 3) was chosen as the response. RSM analysis was able to model the relationship between the response (recovery rate) and the four factors. Based on a previous study [48], the respective low and high levels for factors were coded.
The model’s F-value of 15.79 implied that the model was significant. This model can be used to navigate the design space. The final equation in terms of actual factors is as follows:
Recovery = 84 + 21.48 × A + 7.44 × B + 7.58 × C + 8.39 × D + 5.07 × AB + 1.95 × AC + 4.48 × AD + 1.32 × BC + 4.23 × BD + 4.67 × CD − 22.11 × A2 − 9.80 × B2 − 7.41 × C2 − 14.45 × D2
The p-value is generally employed to assess the significance of variables and can also reflect interactions among independent variables [49]. A smaller p-value indicates that the corresponding variable is more significant [50]. The ANOVA for the response surface quadratic model is summarized in Table 1; in this case, A, B, C, D, A2, B2, C2, and D2 were all significant model terms, and the variable volume of the acetonitrile (A) and extraction time (D) were more significant for the recovery rate.
As displayed in Figure 2, the recovery rate of the 22 antibiotics was superior among the solutions with the following settings: acetonitrile (A) = 8 mL, formic acid (B) = 150 μL, EDTA (C) = 0.1 g, and time for extraction (D) = 8 min. Verification tests were carried out six times under the above-mentioned optimized conditions. The median recovery rates of the 22 antibiotics from six parallel tests were 75.4%, 81.6%, 85.9%, 73.6%, 77.9%, and 82.5%, with errors ranging from 7.8% to 15.1%. The sample preparation of the QuEChERS method was finally optimized as the best solution from RSM, and the method is outlined in Figure 3.
Concerning purification, the addition of a cleaning agent, namely C18 powder, was evaluated in fish to identify the highest detection rate of antibiotic residue. The crude extraction of the spiked sample was adequately purified when 150 mg of C18 powder was added (see Figure 4).

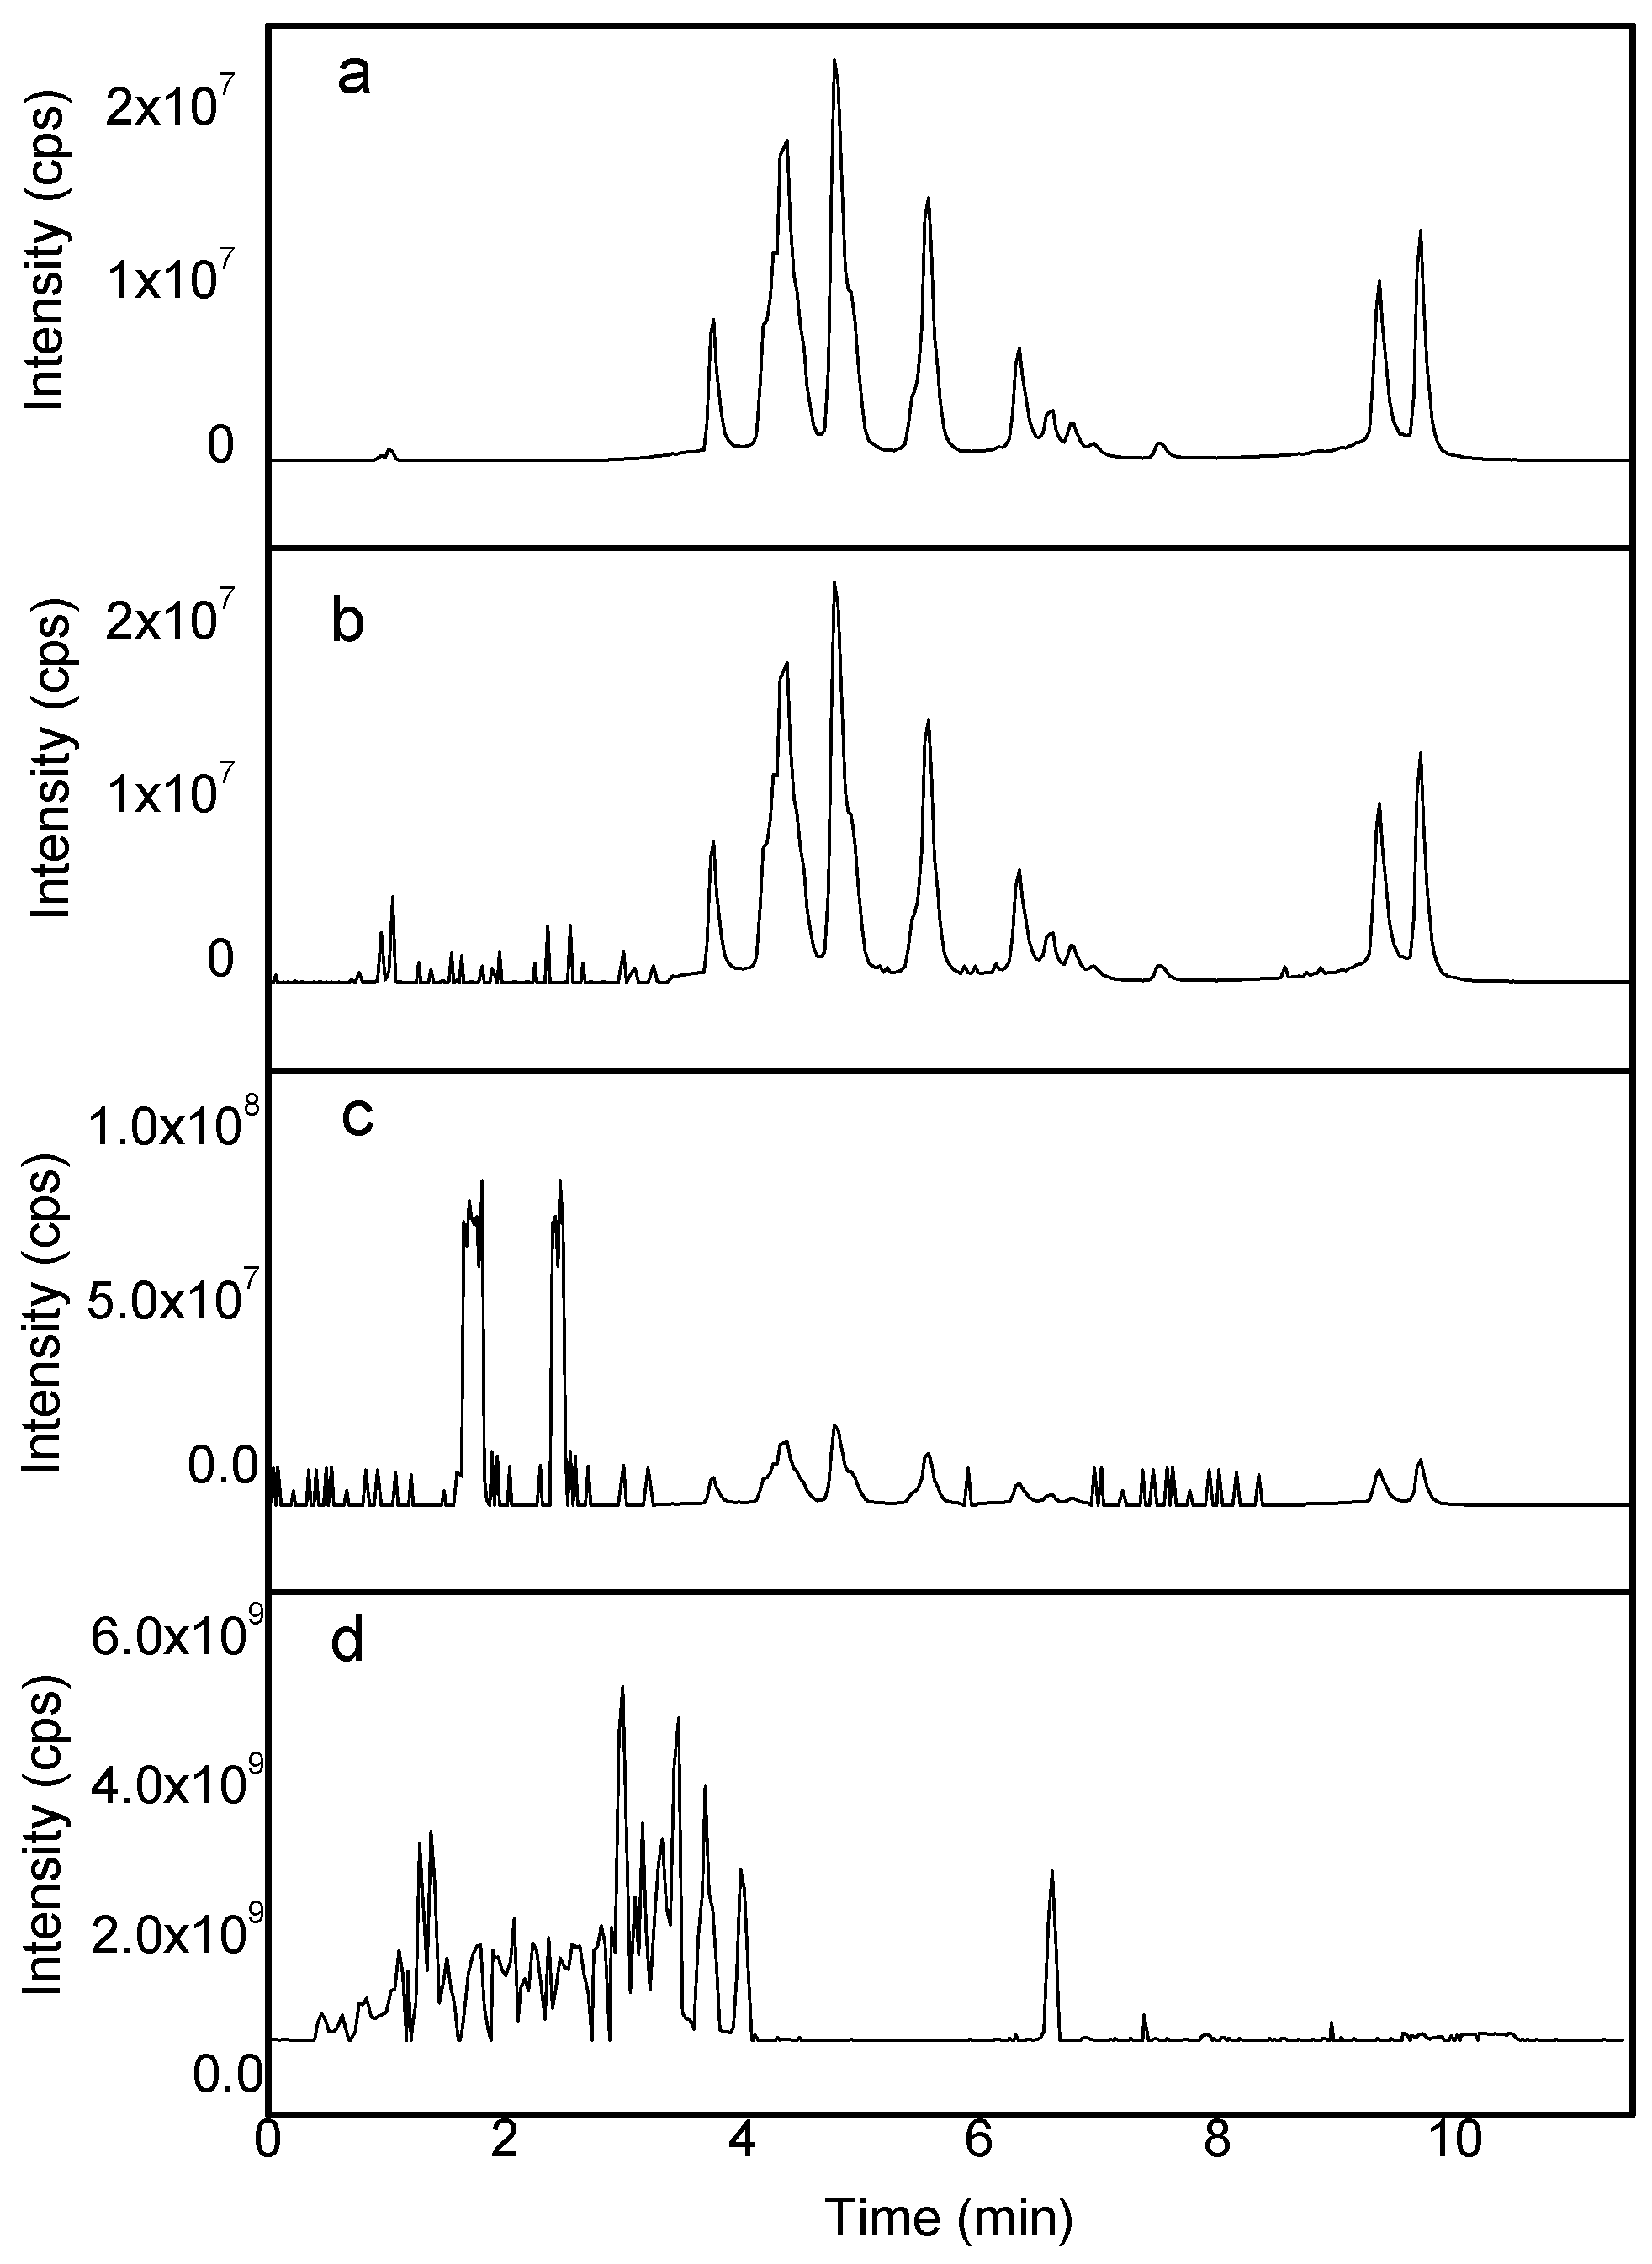
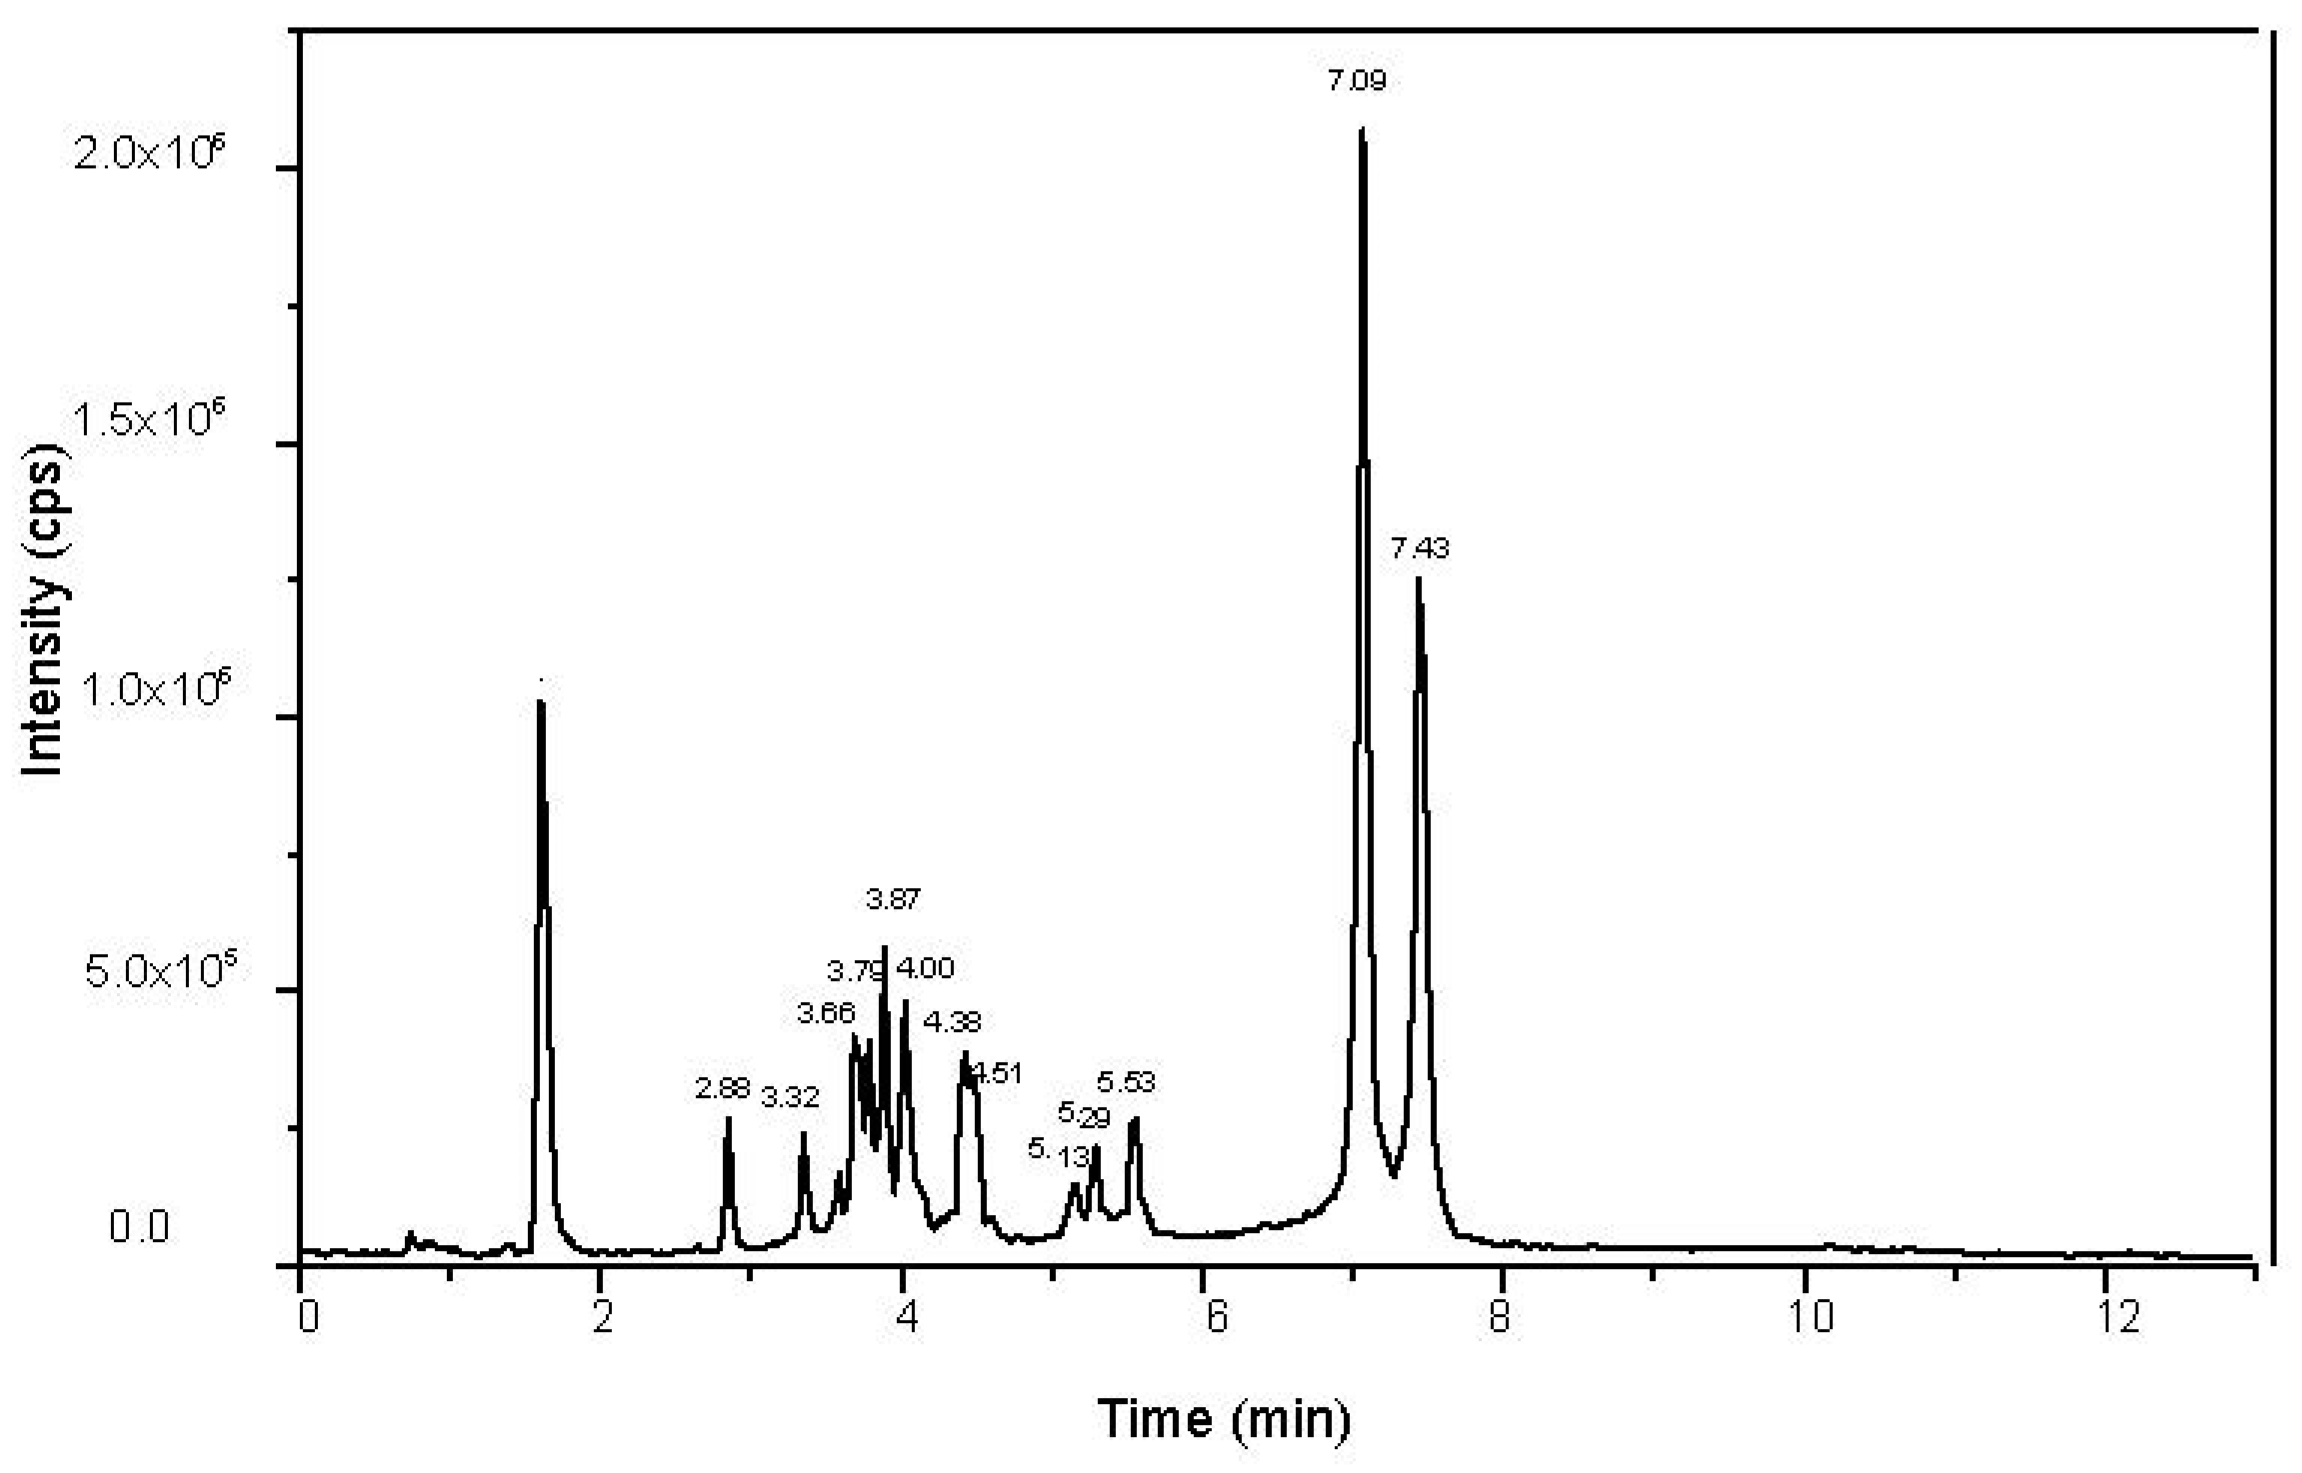
3.3. Optimization of Chromatographic Conditions and Mass Spectrometry

Quinolines and tetracyclines both contain several O and N atoms; consequently, it is easy to obtain protons and a high response in the positive ion mode. To obtain the two ion pairs for quantification, a mixed standard solution of 22 antibiotics at a concentration of 100 µg L−1 was infused into the QTRAP mass spectrometer at a flow rate of 7.0 µL min−1 to achieve automatic analyte optimization via the ESI in the positive mode. Under the optimal mass spectrometry conditions, including declustering potential and collision energy, every antibiotic was assigned two pairs of abundant ions for qualitative and quantitative analysis with high sensitivity. To achieve minimum retention time and symmetric shape of ionic peaks, the elution type, flow rate, and gradient were optimized in this study using the C18 chromatographic column. Therefore, several classical compositions of the mobile phase were performed, including acetonitrile, methanol, water, as well as water with ammonium acetates or formic acid. Finally, water (A) and acetonitrile (B), which were both supplemented with 0.1% formic acid, were chosen as the optimal mobile phase. The final gradient elution at a total flow rate of 0.3 mL min−1 was as follows: 0–0.5 min, 5–20% B; 0.5–2.0 min, 20–25% B; 2.0–7.0 min, 25–45% B; 7.0–10.0 min, 45–90% B; 10.0–12.0 min, 90% B; and 12.1–13.0 min, 95–5%. The column oven was maintained at a temperature of 40 ℃, and the injection volume was 10.0 µL. The representative total ion chromatogram (TIC) was merged in Figure A2. The retention time (RT) and MS information for each antibiotic, including precursor and product ions, DP, and CE, are presented in Table 2.
The EPI scan mode could be activated in the IDA experiment when the ionic intensity exceeded the threshold of 1000 cps. The scan time (including pauses) was 1.57 s for all MRM transitions. EPI mass spectra were acquired over a mass range of m/z 50–500 at a scan rate of 10,000 Da s–1.

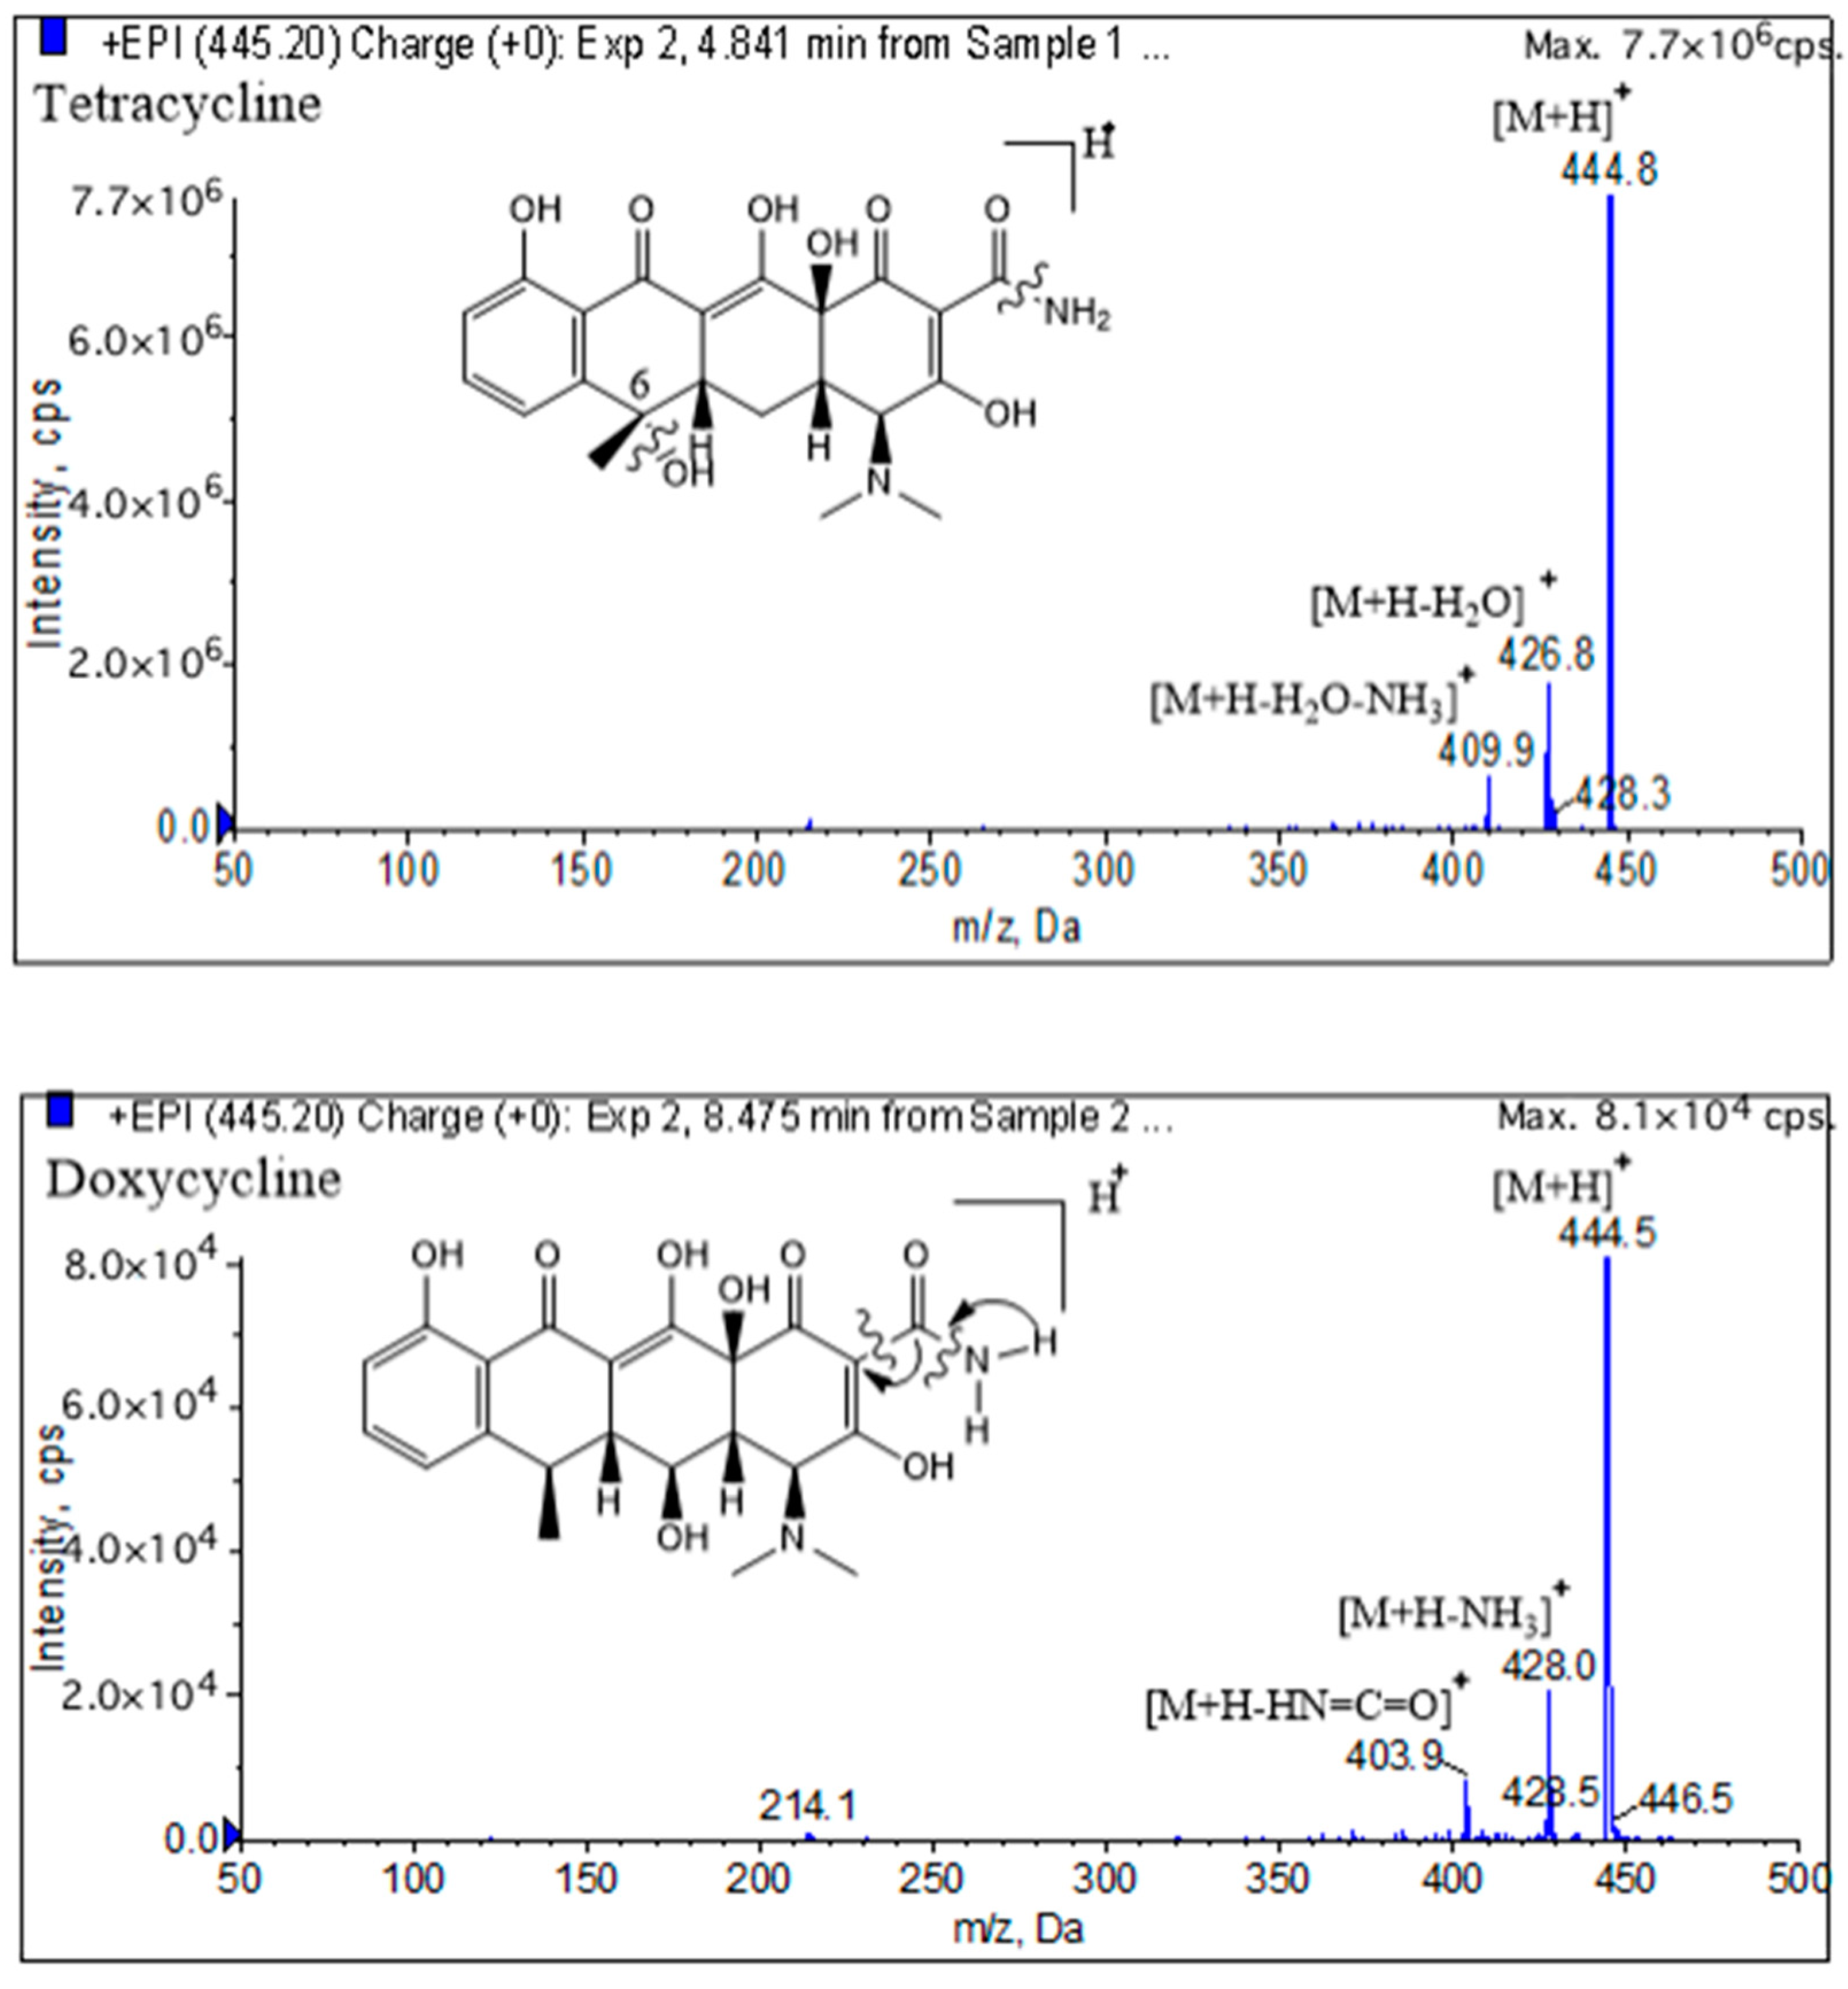
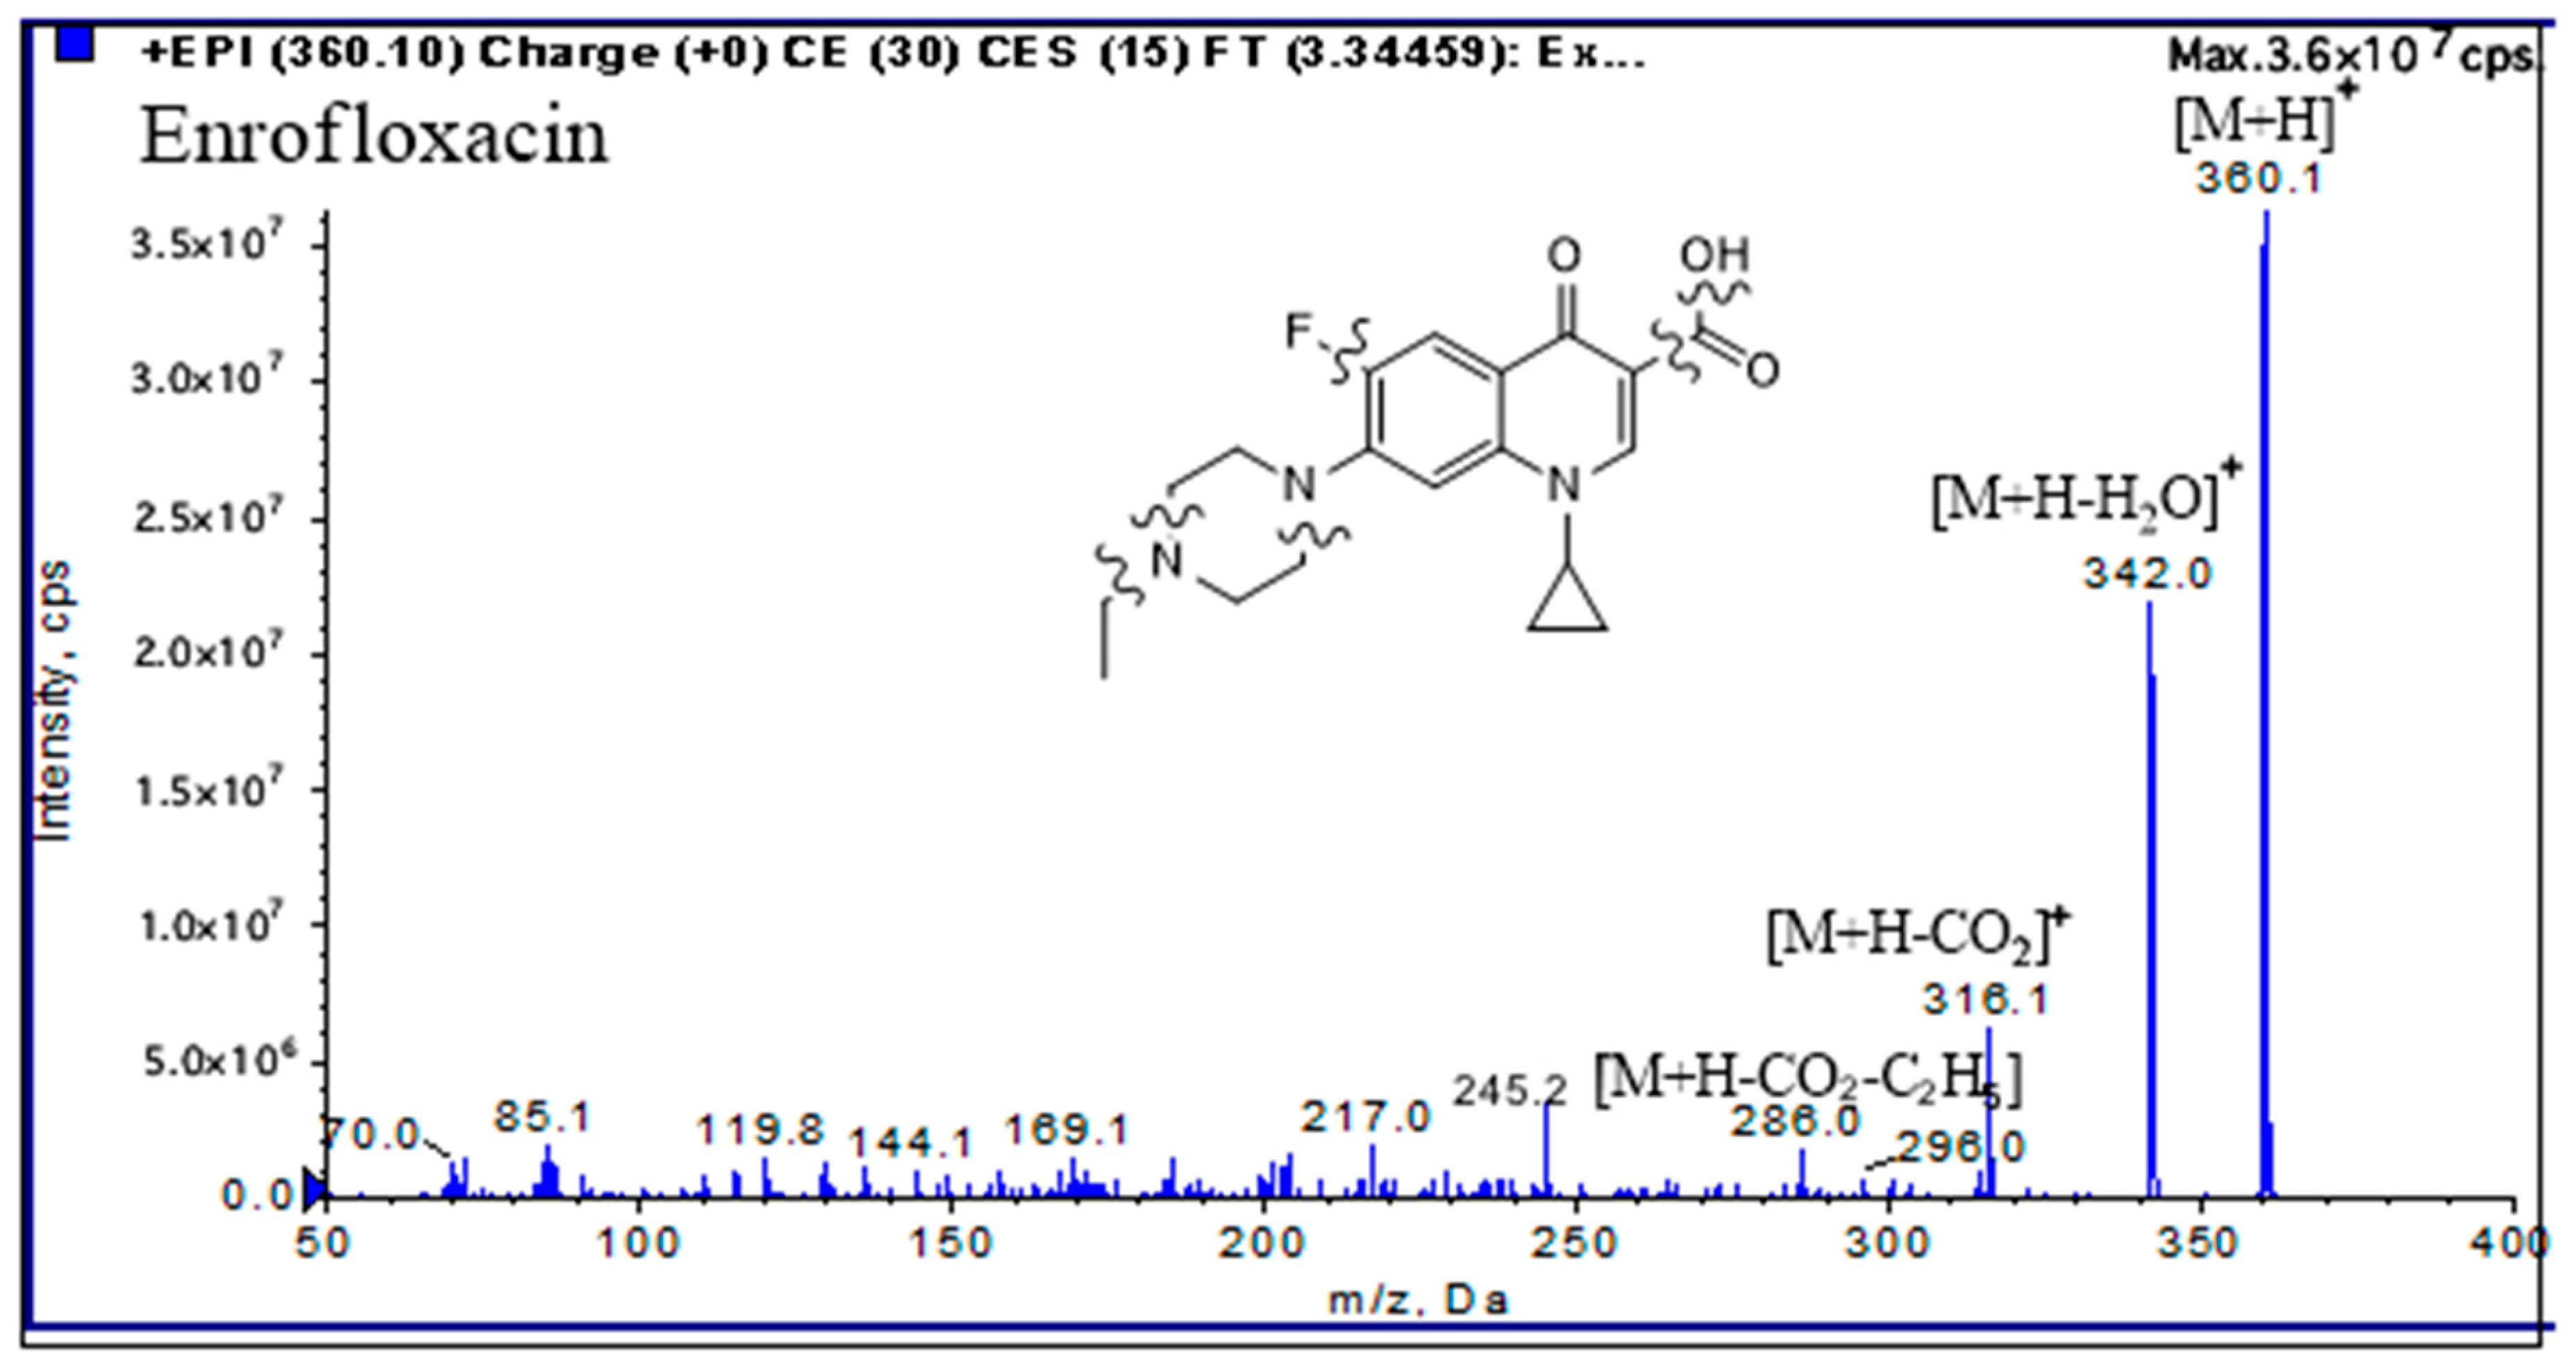
3.4. Fragmentation Approach for Quinolones and Tetracyclines

In the positive mode of electrospray ionization (ESI) mass spectrometry, the proton first binds to the protonation site, usually at the N atom or O atom, and then triggers cleavage by migrating to the reactive center. Although the most basic site in tetracyclines is the dimethylamino group, protonated tetracyclines initially dissociate via the loss of H2O or NH3 from the acylamino group. Regarding tetracycline, demeclocycline, and chlortetracycline, there is no OH at C–6 sites, and, consequently, all presented with successive losses of H2O and NH3. As depicted in Figure 5, tetracyclines without the tertiary OH at C–6 initially lose only NH3 [51].
According to the spectra acquired from the EPI mode (Figure 6), the reactive center of quinolones was located in the carboxylic acid group. The abundant fragment ion [M+H–H2O]+ was formed due to the dehydration of –COOH, while another abundant fragment ion was characterized by the decarboxylation of this group. The neutral loss of m/z 20 Da and m/z 30 Da was most probably formed due to the dissociation of –HF or –CH2CH3. Moreover, another characteristic neutral loss of –CH=CH–NH2 (m/z 20 Da) was produced from the cracking of the azine ring [52].

3.5. Method Validation

3.5.1. Matrix Effect

To evaluate the matrix effects in LC-MS detection, six distinct types of antibiotic-free samples were used as matrix-matched blanks on the ionization of 22 antibiotic residues. The equation is as follows [53]:
M E = A M a t r i x A S × 100 %
where AMatrix represents the peak area of the standard solution with the matrix-matched blank, and AS stands for the peak area of the standard solution in the initial mobile phase. The percentages of the matrix effects of the 22 antibiotics at three different concentrations (2, 20, 200 ng mL−1) ranged from 84.7% to 119.3%. When ion suppression and ion enhancement at the chosen levels were considered, the blank matrix-matching standard curve was adopted to eliminate the effect of the matrix.

3.5.2. Linearity and Sensitivity

Satisfactory linearities (R > 0.99) were obtained for 22 antibiotics in blank matrix-matched curves over concentrations ranging from 0.5 ng mL−1 to 200.0 ng mL−1. The sensitivity of the proposed method was measured according to the limit of detection (LOD) and the limit of quantification (LOQ) values. LOD and the LOQ were calculated using the following equations [53]:
LOD = C S 3 S / N
LOQ = C S 10 S / N
where S/N denotes the average signal-to-noise ratio, and CS represents the concentration of the specific antibiotic. The estimated values were tested using suitable spiked samples containing the 22 antibiotics at the corresponding concentrations. When the concentration ranged between 0.5 and 200.0 ng mL−1 (0.5, 1.0, 2.0, 5.0, 10.0, 20.0, 50.0, 100.0, 200.0, with R.S.D. under 10%, n = 6), the LOD and LOQ values were 0.3 μg kg−1 and 1.0 μg kg−1, respectively, demonstrating the sensitivity of the method for antibiotic residues.

3.5.3. Accuracy and Precision

The accuracy and precision of the method were measured using the intra- and inter-day recoveries and relative standard deviation (R.S.D.). Therefore, the standard mixed solutions of 22 antibiotics were spiked into distinct types of samples, including swine, poultry, eggs, milk, fish, and crustacea, and 18 spiked samples (six types at three concentrations of 2, 20, 200 μg kg−1, shown in Table A2) were obtained. Notably, these spiked samples were detected three times intra-day and three times inter-day. As anticipated, the recovery of 22 antibiotic residues (73.8–98.5%) fell within the recommended guidelines of 60–120% (GB/T 27404-2008, China) [54]. The precision of the analysis measured as the relative standard deviation (R.S.D.) of the recovery, which ranged from 5.80% to 12.4%, was well under the criteria of 30% (GB/T 27404-2008, China) [54].

3.6. Sample Analyses

After validation of the analytical methodology through the above experimentation, it was applied for detection using various real food samples, including swine, poultry, eggs, milk, and nine cultured aquatic products (Parabramis pekinensis, Carassius auratus, Ctenopharyngodon idella, Ophiocephalus argus Cantor, Macrobranchium nipponense, Macrobrachium rosenbergii, Penaeus chinensis, Procambarus clarkia, Eriocheir sinensis, and Larimichthys crocea). In the last six years of detection (2017–2022, total of 781 samples), quinoline or tetracycline residues from swine, eggs, milk, and Eriocheir sinensis were essentially not detected. Compared with the research led by Prof. Treiber [55], tetracycline residues, including tetracycline, oxytetracycline, and chlortetracycline, were also occasionally detected but never exceeded the MRL (200 ug kg−1, GB31650-2019, China [56]) in poultry, Macrobranchium nipponense, Macrobrachium rosenbergii, Penaeus chinensis and Procambarus clarkia. Quinoline residues were generally detected in cultured aquatic products, with the exception of Eriocheir sinensis. The detection rate of quinoline residues was highest in fishes (Parabramis pekinensis, Carassius auratus, Ctenopharyngodon idella, and Ophiocephalus argus Cantor), ranging from 11.36% to 37.51%, with the over-limit rate (MRL, 100 μg kg−1, GB 31650-2019, China [56]) ranging from 1.85% to 9.07%. Furthermore, enrofloxacin and ciprofloxacin were the dominant detected residues among the 22 antibiotics. Meanwhile, among the 12 types of samples, Parabramis pekinensis, with a medium detected concentration of enrofloxacin and ciprofloxacin of 179.9 μg kg−1 and 21.4 μg kg−1, respectively, contributed the maximum detected frequency and value.
A simplified risk assessment of enrofloxacin and ciprofloxacin from fish could be calculated using the following equations:
EXP = A v e r a g e   c o n s u m p t i o n   ( g ) × A v e r a g e   d e t e c t i o n   v a l u e   ( μ g / k g ) × p B W
MOS = A D I D a i l y   d i e t a r y   e x p o s u r e
where EXP represents the daily dietary exposure of enrofloxacin and ciprofloxacin, and MOS denotes the margin of safety. The average consumption of fish is 24.3 g/d, according to the Scientific Research Report on Dietary Guidelines for Chinese Residents of 2021. p represents the effect of food processing and was excluded from this simplified assessment; BW stands for the average body weight (60 kg and 30 kg for adults and children, respectively). According to the National food safety standard GB 31650-2019 [56], the sum of enrofloxacin and ciprofloxacin residues in fish should not exceed 100 μg kg−1, and the related acceptable daily intake (ADI) is 2.0 μg/(kg·d). The results revealed that consuming fish with high levels of quinolone residues may increase the risk of adverse events in children.

4. Conclusions

The analytical approach for antibiotic residue using LC-QTRAP-MS developed in this study is reliable and effective in daily risk monitoring and assessment for food safety. The mass spectrum of each antibiotic obtained from the EPI mode could be used as a corroboration of positive samples. Furthermore, the optimization of the sample pretreatment using the response surface method (RSM) enhanced work efficiency. The analysis of real food origin samples validated the robustness and applicability of the modified QuEChERS method. Over the past six years, massive antibiotic residues have been detected in food from animal origin. Detection rates exceeding the maximum residue limits (MRL, GB 31650-2019, China) have been decreasing year by year from 2020 owing to the strict legal requirements imposed by the National Food Safety Standard—Maximum residue limits for veterinary drugs in foods (GB 31650-2019, China).

Author Contributions

Conceptualization, Y.Z.; methodology, Y.Z.; software, Y.Z.; validation, X.W. and N.O.; formal analysis, Y.Z., X.W. and X.Z.; investigation, Y.L.; resources, Y.L. and X.W.; data curation, Y.Z.; writing, Y.Z. All authors have read and agreed to the published version of the manuscript.

Funding

This research was funded by Jiaxing Science and Technology Bureau, grant number 2019AD32050, 2023AY11055 and 2023AD11048.

Data Availability Statement

Not applicable.

Acknowledgments

The authors would like to thank each other for the support in daily work and thank the help from the Zhejiang Center for Disease Control and Prevention.

Conflicts of Interest

The authors declare no conflict of interest.

Appendix A

Figure A1. Scheme of solid-phase extraction.
Separations 10 00459 g0a1
Figure A2. LC-MS/MS chromatograms of 22 antibiotics (50 ng mL−1).
Separations 10 00459 g0a2
Table A1. Procedures for automated solid-phase extraction.
NO.StepSourceOutputFlow Rate (mL/min)Volume
(mL)
Time
(min)
1Rinse sample pathCH3OH 2.8
2Rinse sample pathH2O 2.8
3Rinse plungerCH3OHSolvent1061.1
4Rinse plungerH2OSolvent1061.1
5Load sample Waste22022.3
6Rinse5% CH3OHSolvent334.3
7Rinse syringeCH3OH 10101.6
8EluteCH3OHCollect1050.9
9Air push Collect1051.1
10End
Total time: 41.8 min.
Table A2. Recoveries and R.S.D. of 22 antibiotics spiked into fish at three levels.
CompoundBackground μg/kgFortification
μg/kg
Average Recovery Rate
%
RSD
n = 3
%
CompoundBackground μg/kgFortification
μg/kg
Average Recovery Rate
%
RSD
n = 3
%
Pipemidic acidND2.074.28.85LomefloxacinND2.082.99.85
20.078.76.9520.089.29.07
200.077.85.86200.086.38.41
EnoxacinND2.073.99.12EnrofloxacinND2.090.25.87
20.079.17.6320.098.56.15
200.080.47.45200.095.45.98
MinocyclineND2.073.89.92DoxycyclineND2.086.212.4
20.082.68.4320.088.410.7
200.075.98.31200.084.911.3
NorfloxacinND2.080.59.01DemeclocyclineND2.079.311.9
20.078.37.6520.088.49.90
200.085.46.14200.089.010.2
OfloxacinND2.075.210.2SarafloxacinND2.078.98.68
20.082.78.7220.088.96.12
200.086.46.96200.078.55.99
PefloxacinND2.089.19.56DifloxacinND2.083.78.69
20.092.49.1720.084.06.81
200.088.57.88200.085.97.04
TetracyclineND2.078.612.1ChlortetracyclineND2.078.411.7
20.083.010.720.088.18.94
200.082.79.57200.082.79.10
CiprofloxacinND2.082.29.07CinoxacinND2.075.59.94
20.078.68.1920.080.28.71
200.089.57.54200.083.48.07
MethacyclineND2.077.310.8Oxolinic acidND2.077.310.4
20.085.19.7620.083.99.29
200.086.48.33200.079.89.38
OxytetracyclineND2.074.811.8Nalidixic acidND2.079.28.93
20.076.110.120.084.67.10
200.075.59.78200.081.75.81
DanofloxacinND2.075.79.64FlumequineND2.087.48.94
20.082.38.7820.092.15.89
200.077.19.15200.088.36.37

References

  1. Qiao, M.; Ying, G.G.; Singer, A.C.; Zhu, Y.G. Review of antibiotic resistance in China and its environment. Environ. Int. 2018, 110, 160–172. [Google Scholar] [CrossRef] [PubMed]
  2. Liu, Y.-Y.; Wang, Y.; Walsh, T.R.; Yi, L.-X.; Zhang, R.; Spencer, J.; Doi, Y.; Tian, G.; Dong, B.; Huang, X.; et al. Emergence of plasmid-mediated colistin resistance mechanism MCR-1 in animals and human beings in China: A microbiological and molecular biological study. Lancet Infect. Dis. 2016, 16, 161–168. [Google Scholar] [CrossRef] [PubMed]
  3. Zhang, Q.Q.; Ying, G.G.; Pan, C.G.; Liu, Y.S.; Zhao, J.L. Comprehensive Evaluation of Antibiotics Emission and Fate in the River Basins of China: Source Analysis, Multimedia Modeling, and Linkage to Bacterial Resistance. Environ. Sci. Technol. 2015, 49, 6772–6782. [Google Scholar] [CrossRef] [PubMed]
  4. Da, V. Origins and Evolution of Antibiotic Resistance. Microbiologia 1996, 12, 9. [Google Scholar]
  5. Do, K.-H.; Byun, J.-W.; Lee, W.-K. Antimicrobial Resistance, Adhesin and Toxin Genes of Porcine Pathogenic Escherichia coli Following the Ban on Antibiotics as the Growth Promoters in Feed. Pak. Vet. J. 2021, 41, 519–523. [Google Scholar]
  6. Hao, R.-Z.; Zhao, R.-T.; Qiu, S.-F.; Wang, L.-G.; Song, H.-B. Antibiotics crisis in China. Science 2015, 348, 1100–1101. [Google Scholar] [CrossRef] [PubMed]
  7. Ullah, M.; Rasool, F.; Khan, N.; Ali, S.; Sheikh, A.A. Antibiotic Resistance and its Gene Profile in Escherichia coli Isolated from Diseased FarmRaised Carps in Punjab, Pakistan. Pak. Vet. J. 2023, 41, 1–7. [Google Scholar]
  8. Ishaq, K. Occurrence and Antimicrobial Susceptibility of Proteus Mirabilis from Chicken Carcass. Pak. Vet. J. 2022, 42, 576–579. [Google Scholar] [CrossRef]
  9. Nawaz, Z.; Aslam, B.; Zahoor, M.A.; Siddique, A.B.; Rafique, A.; Aslam, R.; Qamar, M.U.; Ali, S.; Mubeen, M. Frequency of Extended Spectrum Beta Lactamase Producing Escherichia Coli in Fresh and Frozen Meat. Pak. Vet. J. 2021, 41, 102–106. [Google Scholar] [CrossRef]
  10. Anwar, M.A.; Aziz, S.; Ashfaq, K.; Aqib, A.I.; Shoaib, M.; Naseer, M.A.; Alvi, M.A.; Muzammil, I.; Bhutta, Z.A.; Sattar, H.; et al. Trends in Frequency, Potential Risks and Antibiogram of E. coli Isolated from Semi-Intensive Dairy Systems. Pak. Vet. J. 2022, 4, 167–172. [Google Scholar]
  11. Saeed, E.; Amer, A.A.; Keshta, H.G.; Khalifa, E.A. Prevalence and Antibiogram of Salmonella Enterica Isolated from Raw Dromedary Camel Milk in Matrouh Governorate, Egypt. Int. J. Vet. Sci. 2022, 11, 168–174. [Google Scholar]
  12. Abouelhag, H.A.; Khairy, E.A.; Marie, H.S.; Khalaf, D.D. Prevalence, Antibiogram Pattern and Virulence Genes Profile of Bacillus cereus Isolated from Buffalo Milk. Int. J. Vet. Sci. 2021, 10, 234–239. [Google Scholar]
  13. Bakry, N.M.; Awad, W.S.; Ahmed, S.A. Virulence Genes, Antibiotic Resistance and Phylotyping of Escherichia coli O157 Recovered from Diarrheic Calves. Int. J. Vet. Sci. 2021, 10, 1–7. [Google Scholar]
  14. Nelson, F.E.; Jensen, L.S.; Mcginns, J. Studies on the Stimulation of Growth by Dietary Antibiotics: 1. Changes in Growth Response of Chicks to Antibiotics over a three year Period. Poult. Sci. 1963, 42, 906–909. [Google Scholar] [CrossRef]
  15. Carlet, J.; Rambaud, C.; Pulcini, C. Save Antibiotics: A call for action of the World Alliance Against Antibiotic Resistance (WAAAR). BMC Infect. Dis. 2014, 14, 436–440. [Google Scholar] [CrossRef] [PubMed]
  16. The World Is Running out of Antibiotics, WHO Report Confirms. Available online: https://www.who.int/news/item/20-09-2017-the-world-is-running-out-of-antibiotics-who-report-confirms (accessed on 20 September 2017).
  17. Merkatoris, P.; Schleining, J.; Kruil, A.; Borts, D.; Fajt, V. In vitro Elution of Penicillin, Ampicillin, Tetracycline, Tulathromycin, and Florfenicol From Plaster of Paris Beads. Front. Vet. Sci. 2020, 7, 585423. [Google Scholar] [CrossRef] [PubMed]
  18. Woman Killed by a Superbug Resistant to Every Available Antibiotic—Scientific American. Available online: https://www.scientificamerican.com/article/woman-killed-by-a-superbug-resistant-to-every-available-antibiotic/ (accessed on 13 January 2017).
  19. Commission Regulation. Commission Decision (EU) No 37/2010 of December 2009 on pharmacologically active substances and their classification regarding maximum residue limits in foodstuffs of animal origin. Off. J. Eur. Union 2010, 15, 1–72. [Google Scholar]
  20. Codex Alimentatius Commission; Food and Agriculture Organization of the United Nations; World Health Organization. Maximum Residue Limits (MRLs) and Risk Management Recommendations (RMRs) for Residues of Veterinary Drugs in Foods. (CX/MRL 2-2021). Available online: https://www.fao.org/fao-who-codexalimentarius/codex-texts/maximum-residue-limits/en/ (accessed on 27 July 2023).
  21. Getahun, M.; Abebe, R.B.; Sendekie, A.K.; Woldeyohanis, A.E.; Kasahun, A.E.; Regmi, B. Evaluation of Antibiotics Residues in Milk and Meat Using Different Analytical Methods. Int. J. Anal. Chem. 2023, 2023, 1–13. [Google Scholar] [CrossRef]
  22. Chung, H.-H.; Lee, J.-B.; Chung, Y.-H.; Lee, K.-G. Analysis of sulfonamide and quinolone antibiotic residues in Korean milk using microbial assays and high performance liquid chromatography. Food Chem. 2009, 113, 297–301. [Google Scholar] [CrossRef]
  23. Hernandez-Arteseros, J.A.; Barbosa, J.; Compaó, R.; Prat, M. Analysis of quinolone residues in edible animal products. J. Chromatogr. A 2002, 945, 1–24. [Google Scholar] [CrossRef]
  24. Muscarella, M.; Magro, S.L.; Palermo, C.; Centonze, D. Validation according to European Commission Decision 2002/657/EC of a confirmatory method for aflatoxin M 1 in milk based on immunoaffinity columns and high performance liquid chromatography with fluorescence detection. Anal. Chim. Acta 2007, 594, 257–264. [Google Scholar] [CrossRef]
  25. Önal, A. Overview on liquid chromatographic analysis of tetracycline residues in food matrice. Food Chem. 2011, 127, 197–203. [Google Scholar] [CrossRef]
  26. Sinem, R.; Sezer, A.; Zge, E.; Emir, A.S. Validation of two UHPLC-MS/MS methods for fast and reliable determination of quinolone residues in honey. Food Addit. Contam. Part A 2021, 38, 807–819. [Google Scholar]
  27. Yamaguchi, T.; Okihashi, M.; Harada, K.; Uchida, K.; Konishi, Y.; Kajimura, K.; Hirata, K.; Yamamoto, Y. Rapid and easy multiresidue method for the analysis of antibiotics in meats by ultrahigh-performance liquid chromatography-tandem mass spectrometry. J. Agric. Food Chem. 2015, 63, 5133. [Google Scholar] [CrossRef] [PubMed]
  28. Zhang, L.; Shi, L.; He, Q.; Li, Y. A rapid multiclass method for antibiotic residues in goat dairy products by UPLC-quadrupole/electrostatic field orbitrap high-resolution mass spectrometry. J. Anal. Sci. Technol. 2021, 12, 14. [Google Scholar] [CrossRef]
  29. Zhou, Y.; Guan, J.; Gao, W.; Lv, S.; Ge, M. Quantification and Confirmation of Fifteen Carbamate Pesticide Residues by Multiple Reaction Monitoring and Enhanced Product Ion Scan Modes via LC-MS/MS QTRAP System. Molecules 2018, 23, 2496. [Google Scholar] [CrossRef] [PubMed]
  30. Li, Y.-Y.; Wang, H.; Zhao, C.; Huang, Y.-Q.; Tang, X. Identification and Characterization of Kukoamine Metabolites by Multiple Ion Monitoring Triggered Enhanced Product Ion Scan Method with a Triple-Quadruple Linear Ion Trap Mass Spectrometer. J. Agric. Food Chem. 2015, 63, 10785–10790. [Google Scholar] [CrossRef]
  31. Lode, H. Development of clinically important resistance to quinolones and other antibiotic groups. J. Int. Med. Res. 1990, 18, 27–36. [Google Scholar]
  32. Roberts, M.C. Tetracyclines: Mode of Action and Their Bacterial Mechanisms of Resistance, (Bacterial Resistance to Antibiotics—From Molecules to Man); Wiley Online Library: Hoboken, NJ, USA, 2019; pp. 101–124. [Google Scholar]
  33. Yan, M.; Chen, X.; Huang, Y.; Nie, H.; Wang, J. Tetracyclines, sulfonamides and quinolones and their corresponding resistance genes in the Three Gorges Reservoir, China. Sci. Total Environ. 2018, 631–632, 840–848. [Google Scholar] [CrossRef]
  34. Shao, B.; Jia, X.; Wu, Y.; Hu, J.; Tu, X.; Zhang, J. Multi-class confirmatory method for analyzing trace levels of tetracyline and quinolone antibiotics in pig tissues by ultra-performance liquid chromatography coupled with tandem mass spectrometry. Rapid Commun. Mass Spectrom. 2007, 21, 3487–3496. [Google Scholar] [CrossRef]
  35. Ajibola, A.S.; Tisler, S.; Zwiener, C. Simultaneous determination of multiclass antibiotics in sewage sludge based on QuEChERS extraction and liquid chromatography-tandem mass spectrometry. Anal. Methods 2020, 12, 576–586. [Google Scholar] [CrossRef]
  36. Chen, L.; Qi, W.Y.; Zhao, Z.Y.; Zhao, X.Y.; Zhou, C.Y. Rapid Determination of 19 Fluoroquinolones Antibiotic Residues in Soil by QuEChERS/Ultra Performance Liquid Chromatography-Tandem Mass Spectrometry. J. Instrum. Anal. 2019, 38, 194–200. [Google Scholar]
  37. Frenich, A.G.; Romero-González, R.; Gómez-Pérez, M.; Vidal, J. Multi-mycotoxin analysis in eggs using a QuEChERS-based extraction procedure and ultra-high-pressure liquid chromatography coupled to triple quadrupole mass spectrometry. J. Chromatogr. A 2011, 1218, 4349–4356. [Google Scholar] [CrossRef] [PubMed]
  38. Gao, Y.; Zhang, T.; Huang, S.; Lin, X.; Chen, M. Screening of 49 antibiotic residues in aquatic products using modified QuEChERS sample preparation and UPLC-QToFMS analysis. PeerJ Anal. Chem. 2021, 3, e8. [Google Scholar] [CrossRef]
  39. Wilkowska, A.; Biziuk, M. Determination of pesticide residues in food matrices using the QuEChERS methodology. Food Chem. 2011, 125, 803–812. [Google Scholar] [CrossRef]
  40. Zhang, C.; Deng, Y.; Zheng, J.; Zhang, Y.; Luo, A. The Application of the QuEChERS Methodology in the Determination of Antibiotics in Food: A review. TrAC Trends Anal. Chem. 2019, 118, 517–537. [Google Scholar] [CrossRef]
  41. Andre, I.K.; Siuli, M. Response Surface Methodology. Comput. Stat. 2010, 2, 128–149. [Google Scholar]
  42. Myers, R.H.; Montgomery, D.C.; Anderson-Cook, C.M. Response Surface Methodology: Process and Product Optimization Using Designed Experiments, 4th ed.; John Wiley & Sons: Hoboken, NJ, USA, 2016. [Google Scholar]
  43. Bezerra, M.A.; Santelli, R.E.; Oliveira, E.P.; Villar, L.S.; Escaleira, L.A. Response surface methodology (RSM) as a tool for optimization in analytical chemistry. Talanta 2008, 76, 965–977. [Google Scholar] [CrossRef]
  44. Ferreira, S.L.C.; Bruns, R.E.; Ferreira, H.S.; Matos, G.D.; David, J.M.; Brandao, G.C.; da Silva, E.G.P.; Portugal, L.A.; Reis, P.S.; Souza, A.S.; et al. Box-Behnken design An alternative for the optimization of analytical methods. Anal. Chim. Acta 2007, 597, 179–186. [Google Scholar] [CrossRef]
  45. Li, Y.W.; Mo, C.H.; Zhao, N.; Zhang, R.J.; Yi, R.H. Determination of Sulfonamides Antibiotics in Water and Soil Using High Performance Liquid Chromatography. Chin. J. Anal. Chem. 2008, 36, 954–958. [Google Scholar]
  46. Luo, H.T.; Huang, X.L.; Wu, H.Q.; Zhu, Z.X.; Lin, X.S. Simultaneous Determination of 33 Medicine Residues in Aquatic Products by Rapid Resolution Liquid Chromatography-Tandem Mass Spectrometry. Chin. J. Anal. Chem. 2012, 40, 273–279. [Google Scholar] [CrossRef]
  47. Yue, Z.; Qiu, Y.; Liu, X.; Ji, C. Determination of Multi-Residues of Tetracyclines and Their Metabolites in Milk by High Performance Liquid Chromatography-Tandem Positive-ion Electrospray Ionization Mass Spectrometry. Chin. J. Anal. Chem. 2006, 34, 1255–1259. [Google Scholar] [CrossRef]
  48. Sapadin, A.N.; Fleischmajer, R. Tetracyclines: Nonantibiotic properties and their clinical implications. J. Am. Acad. Dermatol. 2006, 54, 258–265. [Google Scholar] [CrossRef] [PubMed]
  49. Gao, J.; Xu, H.; Li, Q.J.; Feng, X.H.; Li, S. Optimization of medium for one-step fermentation of inulin extract from Jerusalem artichoke tubers using Paenibacillus polymyxa ZJ-9 to produce R,R-2,3-butanediol. Bioresour. Technol. 2010, 101, 7076–7082. [Google Scholar] [CrossRef] [PubMed]
  50. Liu, J.Z.; Weng, L.P.; Zhang, Q.L.; Xu, H.; Ji, L.N. Optimization of glucose oxidase production by Aspergillus niger in a benchtop bioreactor using response surface methodology. World J. Microbiol. Biotechnol. 2003, 19, 317–323. [Google Scholar] [CrossRef]
  51. Amin, M.K.; Hassan, G.F.; Phyllis, R.B.; Burnaby, M. Mass spectral characterization of tetracyclines by electrospray ionization, H/D exchange, and multiple stage mass spectrometry. J. Am. Soc. Mass Spectrom. 2002, 13, 543–557. [Google Scholar]
  52. Bin, M.; Yuming, S.; Chen, X. Analysis of fluroquinolones by electrosprayion trap mass spectrometry. J. Chin. Mass Spectrom. Soc. 2006, 27, 163–167. [Google Scholar]
  53. Matraszek-Zuchowska, I.; Wozniak, B.; Posyniak, A. Comparison of the Multiple Reaction Monitoring and Enhanced Product Ion Scan Modes for Confirmation of Stilbenes in Bovine Urine Samples Using LC–MS/MS QTRAP®System. Chromatographia 2016, 79, 1003–1012. [Google Scholar] [CrossRef]
  54. GB/T 27404-2008; Criterion on Quality Control of Laboratories. Chemical Testing of Food. National Certification and Accreditation Standardization Technical Committee: Beijing, China, 2008.
  55. Treiber, F.M.; Beranek-Knauer, H. Antimicrobial Residues in Food from Animal Origin-a Review of the Literature Focusing on Products Collected in Stores and Markets Worldwide. Antibiotics 2021, 10, 534. [Google Scholar] [CrossRef]
  56. GB 31650-2019; National Food Safety Standard Maximum Residue Limits for Veterinary Drugs in Foods. Ministry of Agriculture and Rural Affairs; National Health Commission; State Administration for Market Regulation: Beijing, China, 2019.
Figure 1. Variation in recovery rate with EDTA (Enrofloxacin).
Separations 10 00459 g001
Figure 2. (a) Response surface plot; (b) response surface contour plots of optimization results.
Separations 10 00459 g002
Figure 3. Scheme of QuEChERS sample preparation method.
Separations 10 00459 g003
Figure 4. Variations in total ion chromatogram with C18 addition (spiked in fishes): (a) 150 mg; (b) 100 mg; (c) 50 mg; (d) no addition.
Separations 10 00459 g004
Figure 5. Production spectra and proposed fragmentation pathway of tetracycline and doxycycline.
Separations 10 00459 g005
Figure 6. Production spectra and proposed fragmentation pathway of enrofloxacin.
Separations 10 00459 g006
Table 1. ANOVA for the recovery rate according to the response surface quadratic model.
SourceSum of SquaresdfMean SquareF-Valuep-Value
Model12,099.4814864.2515.79<0.0001
A-MeCN5538.4015538.40101.21<0.0001
B-HCOOH664.541664.5412.140.0036
C-EDTA690.081690.0812.610.0032
D-Time845.041845.0415.440.0015
A23171.1713171.1757.95<0.0001
B2622.751622.7511.380.0045
C2356.241356.246.510.0231
D21354.0811354.0824.740.0002
Cor total12,865.5828
R2 (Pred) = 0.7 R2 (Adj) = 0.8809. Significant at a 95% confidence degree (p < 0.05).
Table 2. Retention time and MS parameters of the 22 antibiotics.
No.CompoundRetention Time (min)CAS No.Precursor Ion (m/z)Product Ion (m/z)Declustering Potential (V)Collision Energy (eV)
1Pipemidic acid2.8851940-44-4304.3217.1 *7018
189.07027
2Enoxacin3.3274011-58-8321.4303.3 *8022
233.98033
3Minocycline3.5910118-90-8458.5441.4 *8020
352.48030
4Norfloxacin3.6470458-96-7320.3302.3 *8026
276.38035
5Ofloxacin3.6682419-36-1362.2318.3 *8026
261.28038
6Pefloxacin3.7070458-92-3334.3290.3 *8027
233.28025
7Tetracycline3.7460-54-8445.4410.4 *8024
427.78019
8Ciprofloxacin3.7585721-33-1332.2314.3 *8025
288.38033
9Methacycline3.77914-00-1443.3426.4 *6018
201.26010
10Oxytetracycline3.7879-57-2461.4426.4 *8025
443.68017
11Danofloxacin3.82112398-08-0358.3340.3 *8012
82.08035
12Lomefloxacin3.8798079-51-7352.3265.2 *8033
308.38028
13Enrofloxacin3.9693106-60-6360.3316.4 *8025
342.38035
14Doxycycline4.00564-25-0445.5428.5 *8024
154.08035
15Demeclocycline4.0764-73-3465.3430.4 *7523
448.47528
16Sarafloxacin4.3898105-99-8386.3342.3 *8025
299.38038
17Difloxacin4.5198106-17-3400.1356.1 *8028
299.18041
18Chlortetracycline5.1357-62-5479.3444.4 *8024
462.38028
19Cinoxacin5.2928657-80-9263.1244.1 *8025
188.88035
20Oxolinic acid5.5314698-29-4262.1244.1 *7026
155.97040
21Nalidixic acid7.09389-08-2233.1187.0 *6818
244.16834
22Flumequine7.4342835-25-6262.2244.1 *7019
202.17032
CAS: chemical abstracts service; *: quantitative ion.
Disclaimer/Publisher’s Note: The statements, opinions and data contained in all publications are solely those of the individual author(s) and contributor(s) and not of MDPI and/or the editor(s). MDPI and/or the editor(s) disclaim responsibility for any injury to people or property resulting from any ideas, methods, instructions or products referred to in the content.

