Article

Study of Estimated Ultimate Recovery Prediction and Multi-Stage Supercharging Technology for Shale Gas Wells

1
Sichuan Changning Natural Gas Development Co., Ltd., Yibin 610051, China
2
School of Petroleum Engineering, China University of Petroleum (East China), Qingdao 266580, China
*
Author to whom correspondence should be addressed.
Separations 2023, 10(8), 432; https://doi.org/10.3390/separations10080432
Submission received: 17 June 2023 / Revised: 18 July 2023 / Accepted: 24 July 2023 / Published: 29 July 2023
(This article belongs to the Topic Oil, Gas and Water Separation Research)

Abstract

:
The development of shale gas reservoirs often involves the utilization of horizontal well segmental multi-stage fracturing techniques. However, these reservoirs face challenges, such as rapid initial wellhead pressure and production decline, leading to extended periods of low-pressure production. To address these issues and enhance the production during the low-pressure stage, pressurized mining is considered as an effective measure. Determining the appropriate pressurization target and method for the shale gas wells is of great practical significance for ensuring stable production in shale gas fields. This study takes into account the current development status of shale gas fields and proposes a three-stage pressurization process. The process involves primary supercharging at the center station of the block, secondary supercharging at the gas collecting station, and the introduction of a small booster device located behind the platform separator and in front of the outbound valve group. By incorporating a compressor, the wellhead pressure can be reduced to 0.4 MPa, resulting in a daily output of 12,000 to 14,000 cubic meters from the platform. Using a critical liquid-carrying model for shale gas horizontal wells, this study demonstrates that reducing the wellhead pressure decreases the critical flow of liquid, thereby facilitating the discharge of the accumulated fluid from the gas well. Additionally, the formation pressure of shale gas wells is estimated using the mass balance method. This study calculates the cumulative production of different IPR curves based on the formation pressure. It develops a dynamic production decline model for gas outlet wells and establishes a relationship between the pressure depletion of gas reservoirs and the cumulative gas production before and after pressurization of H10 −2 and H10 −3 wells. The final estimated ultimate recovery of two wells is calculated. In conclusion, the implementation of multi-stage pressurization, as proposed in this study, effectively enhances the production of, and holds practical significance for, stable development of shale gas fields.

1. Introduction

Shale gas exhibits inherent traits, such as self-generation and self-storage, water-sealed reservoir interfaces, extensive and continuous distribution, low porosity, and low permeability. Typically, it lacks natural production capabilities or possesses low yields, necessitating the implementation of large-scale hydraulic fracturing and horizontal well technologies for economically viable exploitation [1,2,3,4]. Nevertheless, after years of shale gas well development, the pressure experiences a rapid decline, with the wellhead pressure approaching the transportation pressure, resulting in a minimal production pressure difference. Consequently, shale gas production experiences a steep decline [5,6]. Employing pressurized mining serves as an effective approach to enhance the production performance of the low-pressure stage. By incorporating a compressor to elevate the pressure energy of low-pressure gas, the flow pressure increases, along with the disparity between the flow pressure and external transmission pressure. This facilitates a smooth transportation of the low-pressure gas. Accurately determining the pressurization target and adopting a reasonable pressurization method for shale gas wells holds practical significance for ensuring stable production in shale gas fields.
Since the 1970s, Columbia Company in the United States has implemented gas field pressurization production through the construction of a compressor booster device [7]. Most of the coalbed methane fields developed in the United States utilize a centralized compression system, commonly referred to as the central station level processing [8,9]. The coalbed methane field in the San Juan Basin of the United States employs a centralized pressurization procedure, allowing for the central pressurization and transportation of coalbed methane by utilizing the wellhead pressure. Each treatment station is outfitted with a minimum of two skid-mounted reciprocating compressors powered by coalbed methane engines, utilizing a three-stage compression process [10]. The Marcellus shale gas field in the United States employs a two-stage pressurization mode. A throttle valve is installed at the wellhead to regulate the flow of shale gas. After passing through the pipeline following throttling, the shale gas enters the well site. Upon undergoing treatment with a separator and de-sanding device, it proceeds to the gas collection station for pressurization. Subsequently, the gas undergoes secondary pressurization at the central processing station [11]. The Waddell Ranch [12] project conducted an economic comparison between centralized pressurization and single-well pressurization, ultimately determining the feasibility of the single-well boosting scheme. The project was implemented in three phases over a three-year period, involving pressurization tests on 63 wells at the well sites and the installation of 52 compressors, resulting in increased gas production from low-pressure wells. However, it was observed that although gas well production significantly increased after pressurization, the production decline rate also escalated accordingly. The Ranger field and the Panham gas field [13] have also achieved positive application results by employing pressurization devices and utilizing negative pressure gas gathering processes for production. Josifovic et al. [14] found that reducing the cut diameter and running the pump at a higher speed can increase pump efficiency by as much as 4.6%. In China, the adoption of pressurization processes commenced relatively late. The first use of a compressor in the pressurization process took place in 1982 in the Sichuan Xing3 well [7]. Since then, the domestic utilization of pressurization processes has become widespread. Field development practices have indicated that when the pressure of a gas well approaches the pipeline network pressure, production starts to decline, and the gas well lacks the ability to maintain stable production. Studying the dynamics of production indicators such as gas field production and pressure decline is a crucial aspect of the second phase of pressurization. Production history fitting serves as the basis for forecasting production dynamics [15]. ARPS [16] proposed a systematic approach to the decline laws of oil and gas fields in the 1950s. Yu et al. [17] defined three new capacity reduction rates based on the instantaneous decline rate, derived the expression for capacity reduction under the three types of reductions in Arps’ decline theory, and provided a clearer representation of the relationship among capacity, pressure, and production degree. Chen et al. [18] proposed a method to detect the reservoir volumetric fracturing effect by using longitudinal wave velocity radial sequence imaging technology and shear wave remote exploration and processing technology. Zhang et al. [19] proposed a new production optimization framework combining advanced deep reinforcement learning techniques. Zhang et al. [20] proposed a new multi-scale fracture network characterization method and a strong dimensionality reduction method based on a model parameter autoencoder. Zhang et al. [21] established a deep learning model based on FNO for three types of PDE control problems of two-dimensional subsurface oil–water two-phase flow. Meng et al. [22] analyzed the fundamental characteristics and exploitation status of the West Sichuan gas reservoir and employed ReO software and linear programming principles to determine the optimal pressurization scheme based on parameters such as maximum production output and minimal unit energy consumption. However, their study did not delve into the research of early-stage pressurization processes. Hu et al. [23] adopted a process known as “drainage gas production, low-pressure gas gathering, inter-well connection, wellhead measurement, composite material utilization, dual-site pressurization, station–site separation, and centralized treatment”. However, this mode is applicable only when the wellhead pressures are equal. In the later stages of production, when the wellhead pressures vary, inter-well interference occurs, and the gas backflow prevents it from entering the gas collection station. Shang et al. [24] and others implemented a pressurization process with “regional pressurization as the primary approach, supplemented by single-station pressurization” during the middle and late stages of the Jingbian gas field. However, the regional pressurization operation was inflexible and not applicable to more complex scenarios. Liu et al. [25] implemented a second-phase booster project at the gas gathering station in Daniudi, building upon the first phase of centralized pressurization. This allowed for the realization of a two-stage pressurization and transportation system. However, this pressurization mode focused on the location and method of pressurization within the long-distance natural gas pipeline network gathering and transmission system, without addressing the timing of pressurization. Shi et al. [26] adopted the gas gathering station pressurization and production mode in the Fuling shale gas field. This method minimized the waste pressure of the pressurized gas well and met the transmission requirements of the gas gathering station’s new regulating well. However, it neglected the inter-well disturbance caused by different pressures between the wells due to long-term mining or the blockage of long-term operating pipelines, resulting in a significant pressure loss. This led to the failure of gas from well to well to reach the gas collection station and incurred substantial economic losses. China’s shale gas exploration and development started later, and the geological environment and exploitation methods of shale gas fields differ from those in the United States. Therefore, it is not feasible to simply replicate advanced foreign technologies for boosting and increasing production. Consequently, this study incorporated the development status of the Xx shale gas field. Based on primary supercharging at the central station of the Xx block and secondary supercharging at the gas gathering station, a small piece of pressurization equipment was installed behind the platform separator and in front of the outbound valve group to create a three-stage pressurization process. The critical liquid-carrying model of shale gas horizontal wells was used to determine the influence of wellhead pressure on the critical flow of liquid carrying in wellheads. Through the analysis of field test data, the inflow dynamic relationship (IPR) curve was successfully established. The mass balance method was applied to the estimation of the formation pressure in shale gas wells. By calculating the cumulative yield of different IPR curves, the dynamic decline model of gas outlet well production revealed the relationship between the waste pressure and the pressurization effect of the gas well’s gas reservoir. Based on the above, we predicted the estimated ultimate recovery of the gas well.

2. Theoretical Research

2.1. The Selection of the Supercharging Mechanism and Mode

The addition of a compressor is intended to augment the pressure energy of gas with low pressure levels by means of a supplementary apparatus, thereby elevating the flow pressure and the pressure differential between the flow pressure and the external transmission pressure. This facilitates the smooth transportation of low-pressure gas. The purpose is to improve the starting transmission pressure of the gas pipeline and compensate for resistance losses during fluid flow within the pipeline. It also ensures that the transmission pressure meets the requirements of the gas gathering pipeline network. As the development of the gas fields progresses, the pressure in the gas wells gradually decreases over time. In the later stages of development, the well pressure may no longer meet the requirements of the gathering pipeline network’s gas inlet pressure. Therefore, pressurization is necessary to increase the gas pressure for transmission into the pipeline network. By utilizing the suction action of the compressor at the inlet, the wellhead pressure of the gas well can be reduced over a period of time, while the reservoir pressure remains unchanged. This increases the pressure difference between the bottom of the well and the wellhead. Due to long-term exploitation, some gas wells experience relatively low wellhead pressures and gas production rates, which hinders the export of natural gas and severely impacts the normal production operations. Hence, it is imperative to study the pressurization processes. Common pressurization methods employed both domestically and internationally include single-well pressurization, pressurization at gas gathering stations, and regional pressurization [27]. Single-well pressurization refers to the installation of a compressor at the wellhead to pressurize the raw gas for transmission into the gas pipeline network [28]. This process offers operational flexibility and can be customized based on the specific conditions of each gas field. It is highly adaptable. However, for large low-pressure gas fields, a significant number of compressors may be required, resulting in high investment costs. Pressurization at gas gathering stations involves the centralized installation of compressors at the stations to provide increased pressure. This approach reduces investment costs. However, it is only applicable to gas fields where the wellhead pressure is sufficient to reach the gas gathering station without the need for additional pressurization. This method is not suitable for gas fields with low wellhead pressures [29]. This mode involves the independent establishment of a booster station, which increases the flexibility of scheduling for the gas gathering network. In this study, a comprehensive pressurization scheme was developed by combining the advantages of various pressurization modes. According to the Xx H10 platform gas gathering process (Figure 1a), the gas flowed from the platform (gas well) to the gathering station and then to the centralized booster station before being transported externally. The pressurization equipment was installed behind the separator and before the outbound valve group. It was connected to the reserved manifold of the pipeline at the back end of the separator, and the pressurized gas was then connected to the outbound manifold through the pipeline. The modified process flow included a bypass function that determined whether the gas entered the pressurization device based on the production conditions of each individual well. This allowed low-pressure natural gas to be transported to the next station and reduced the cost of transporting non-pressurized gas. Within the gas gathering station, the installation of mobile-type two-stage boosting equipment was determined based on the inlet pressure. For example, the gas produced from the Xx H10 platform was pressurized and transported to the central station of the Xx well area for centralized boosting and external transmission through the Xx H3 platform. The gas was then transported to the central station for centralized pressurization and subsequent external transmission (Figure 1b).

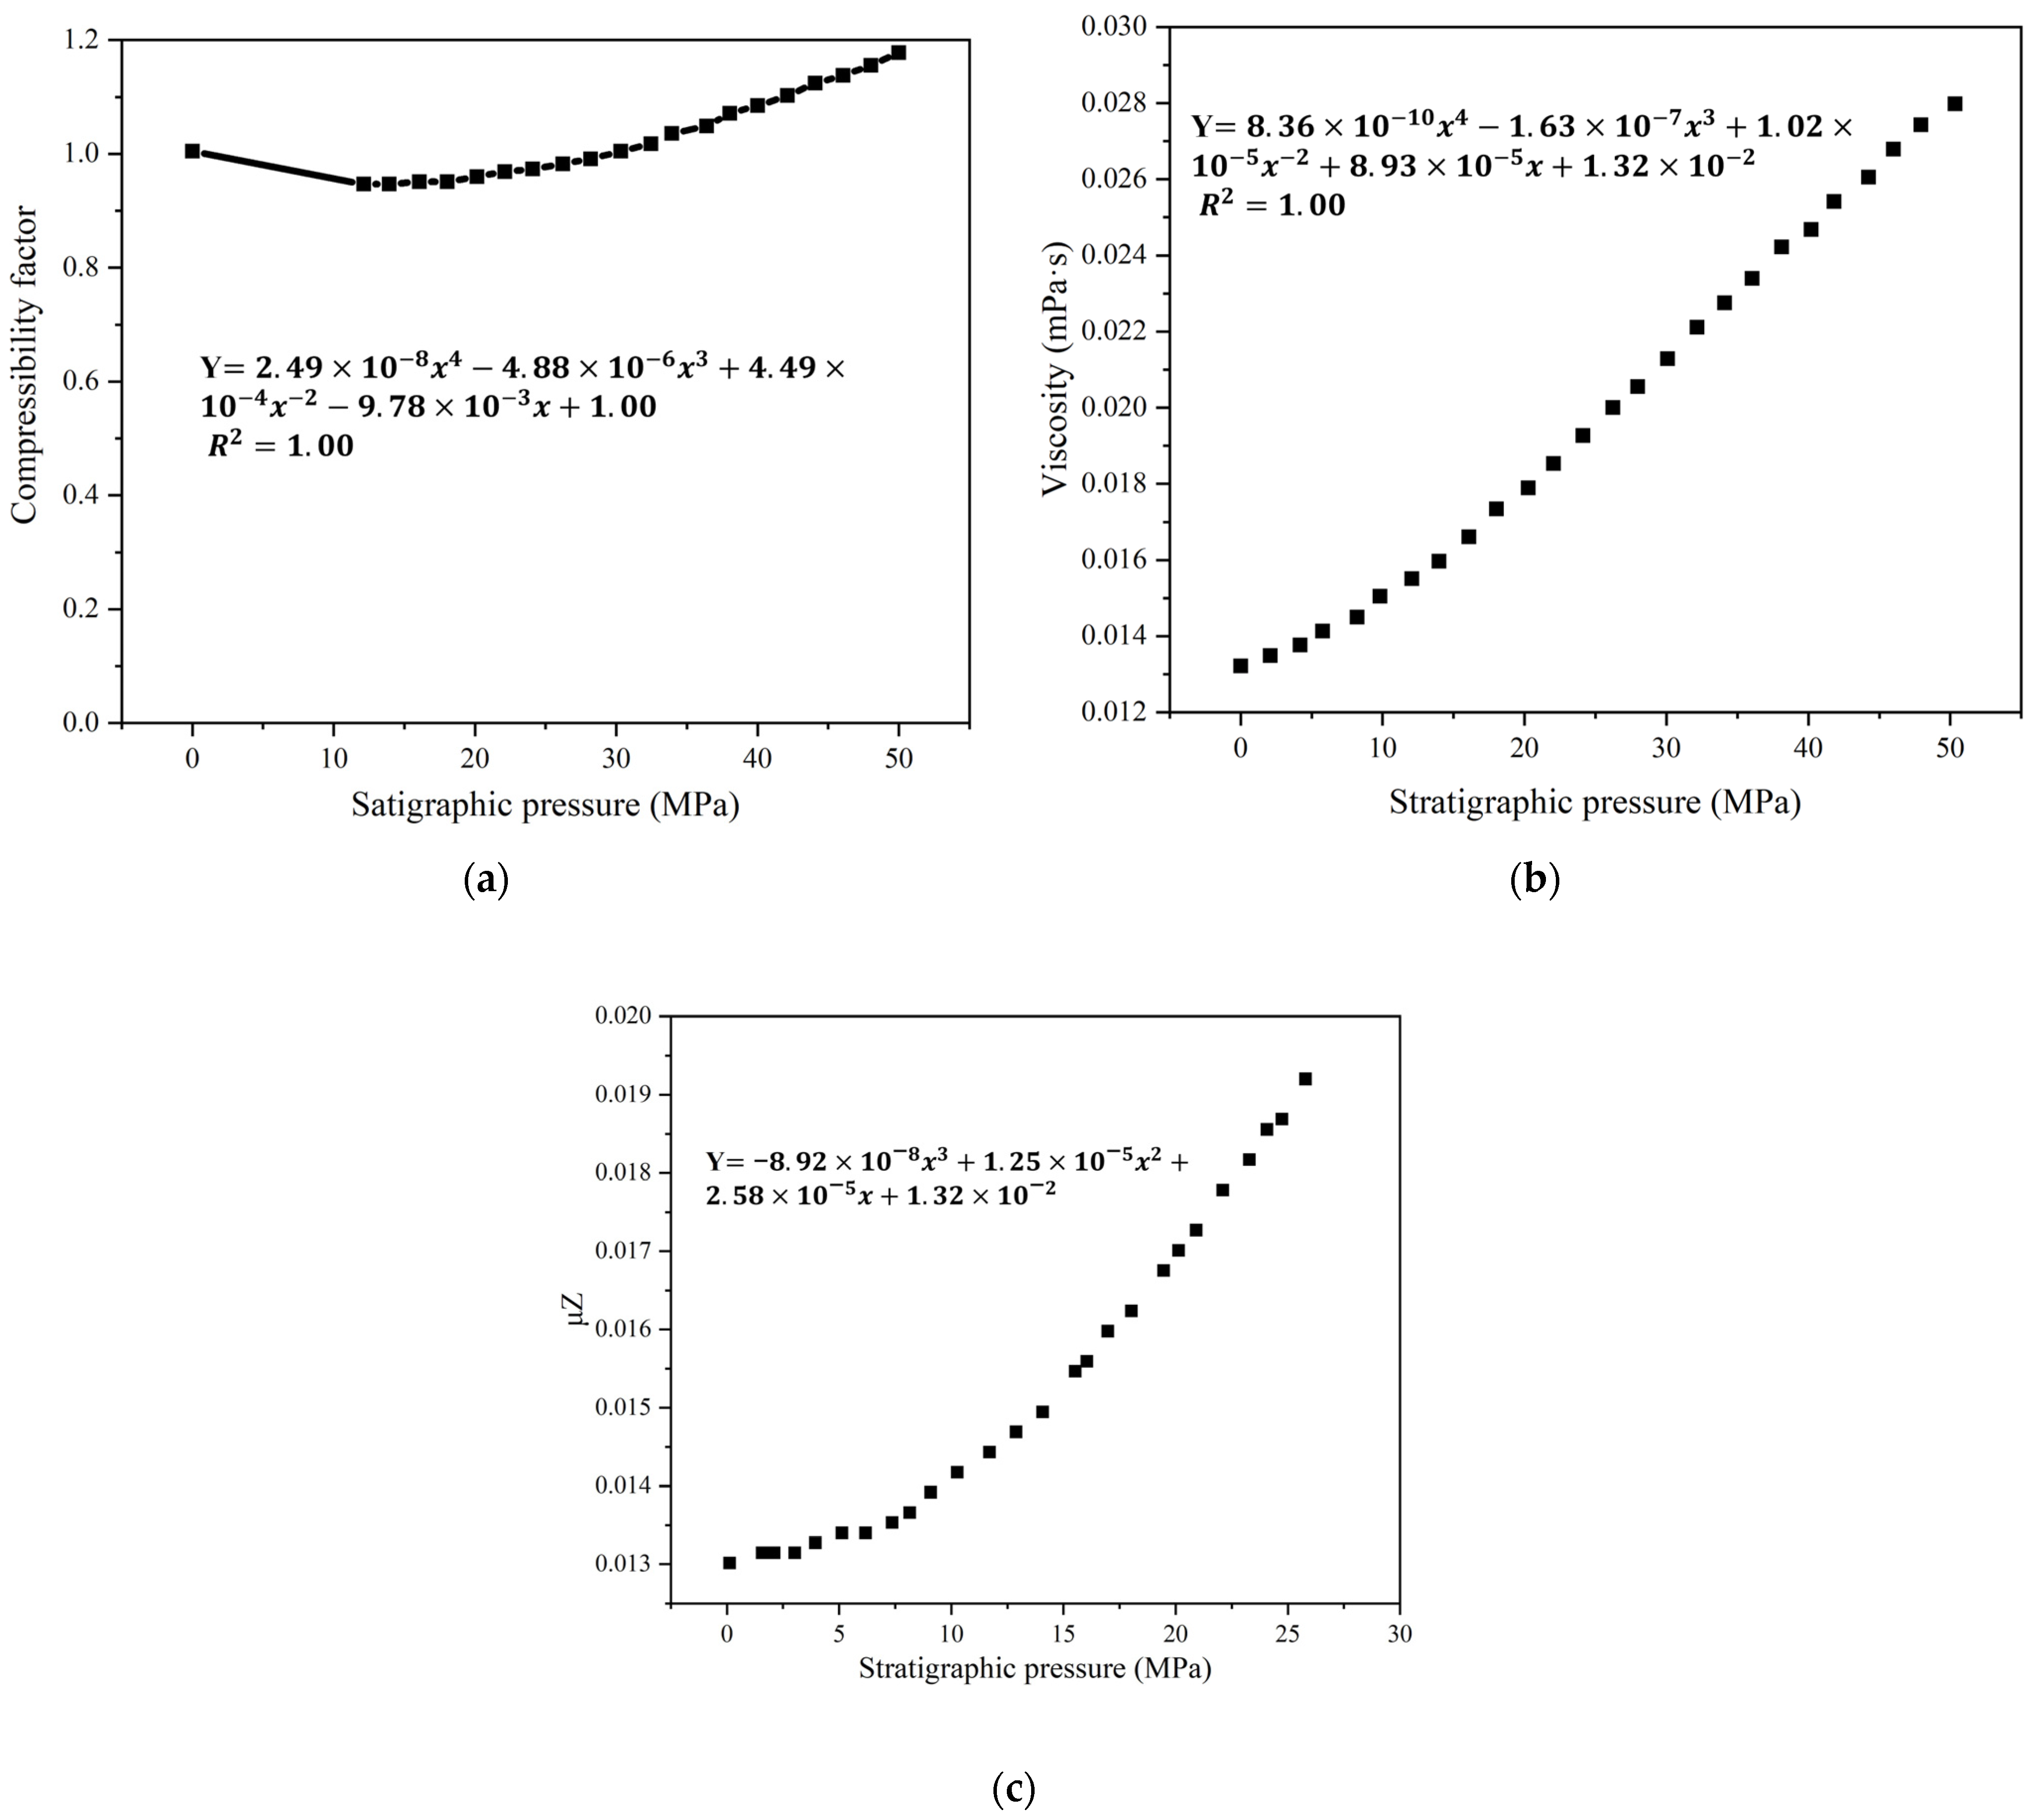
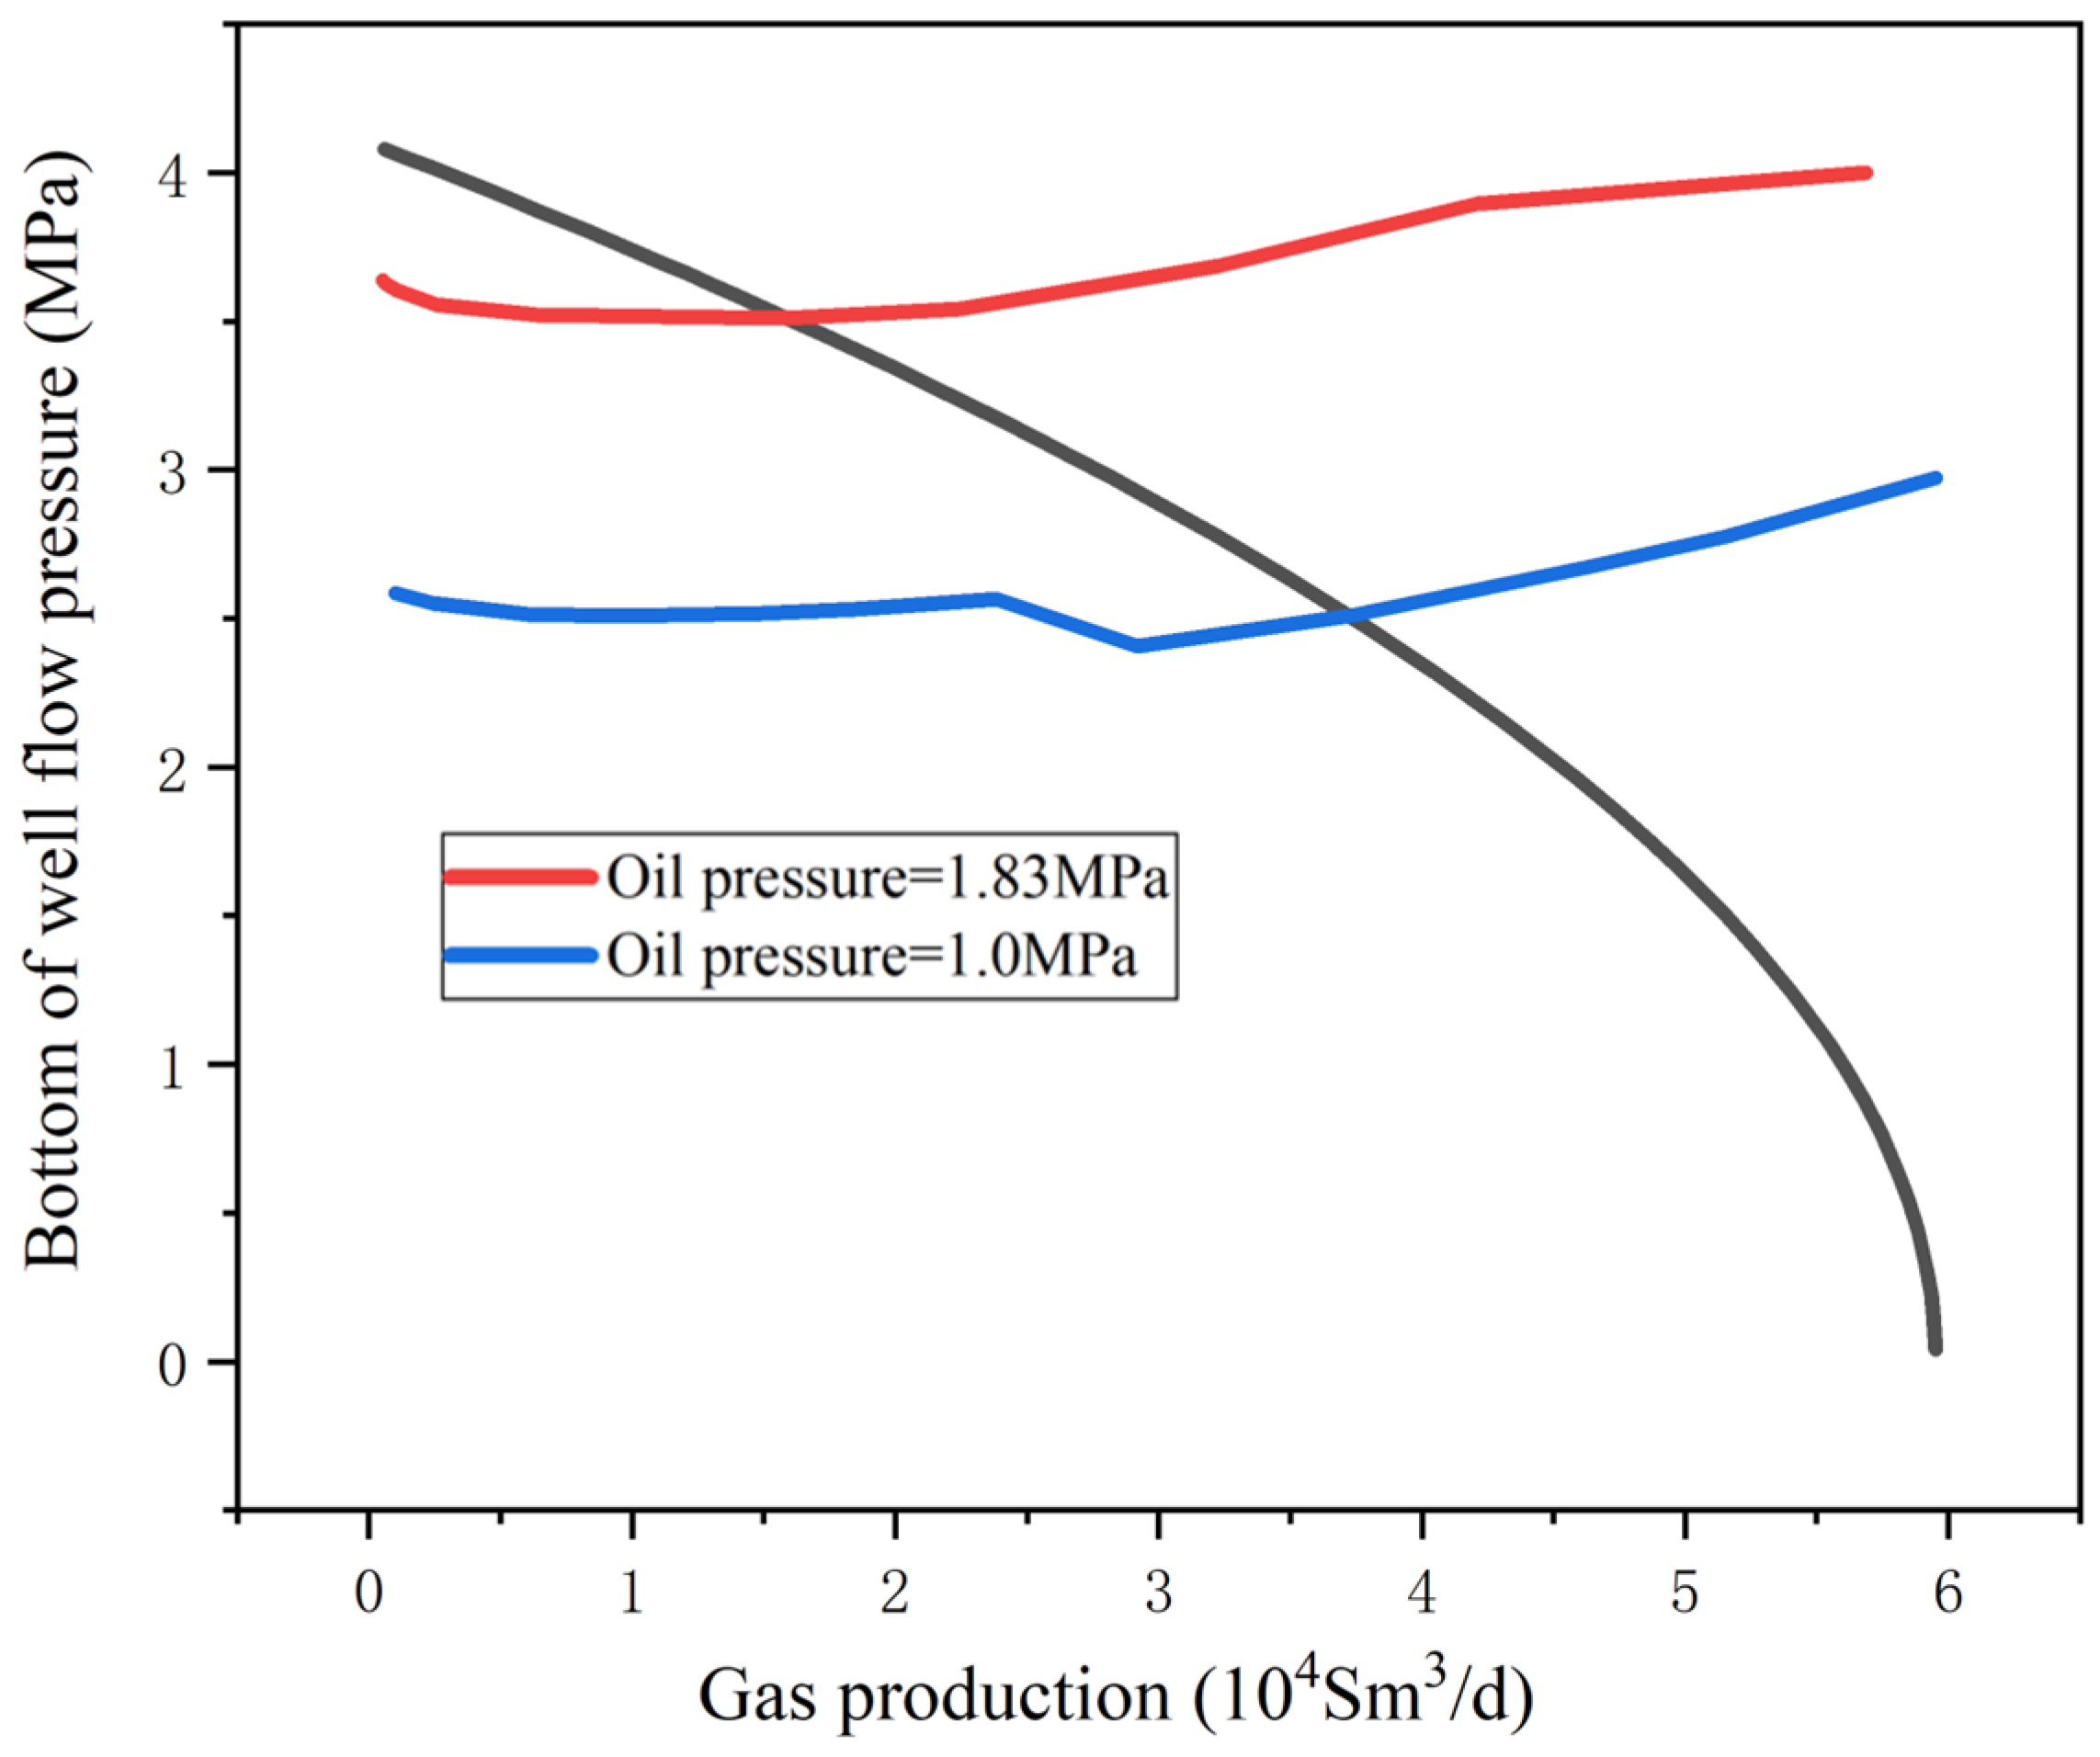
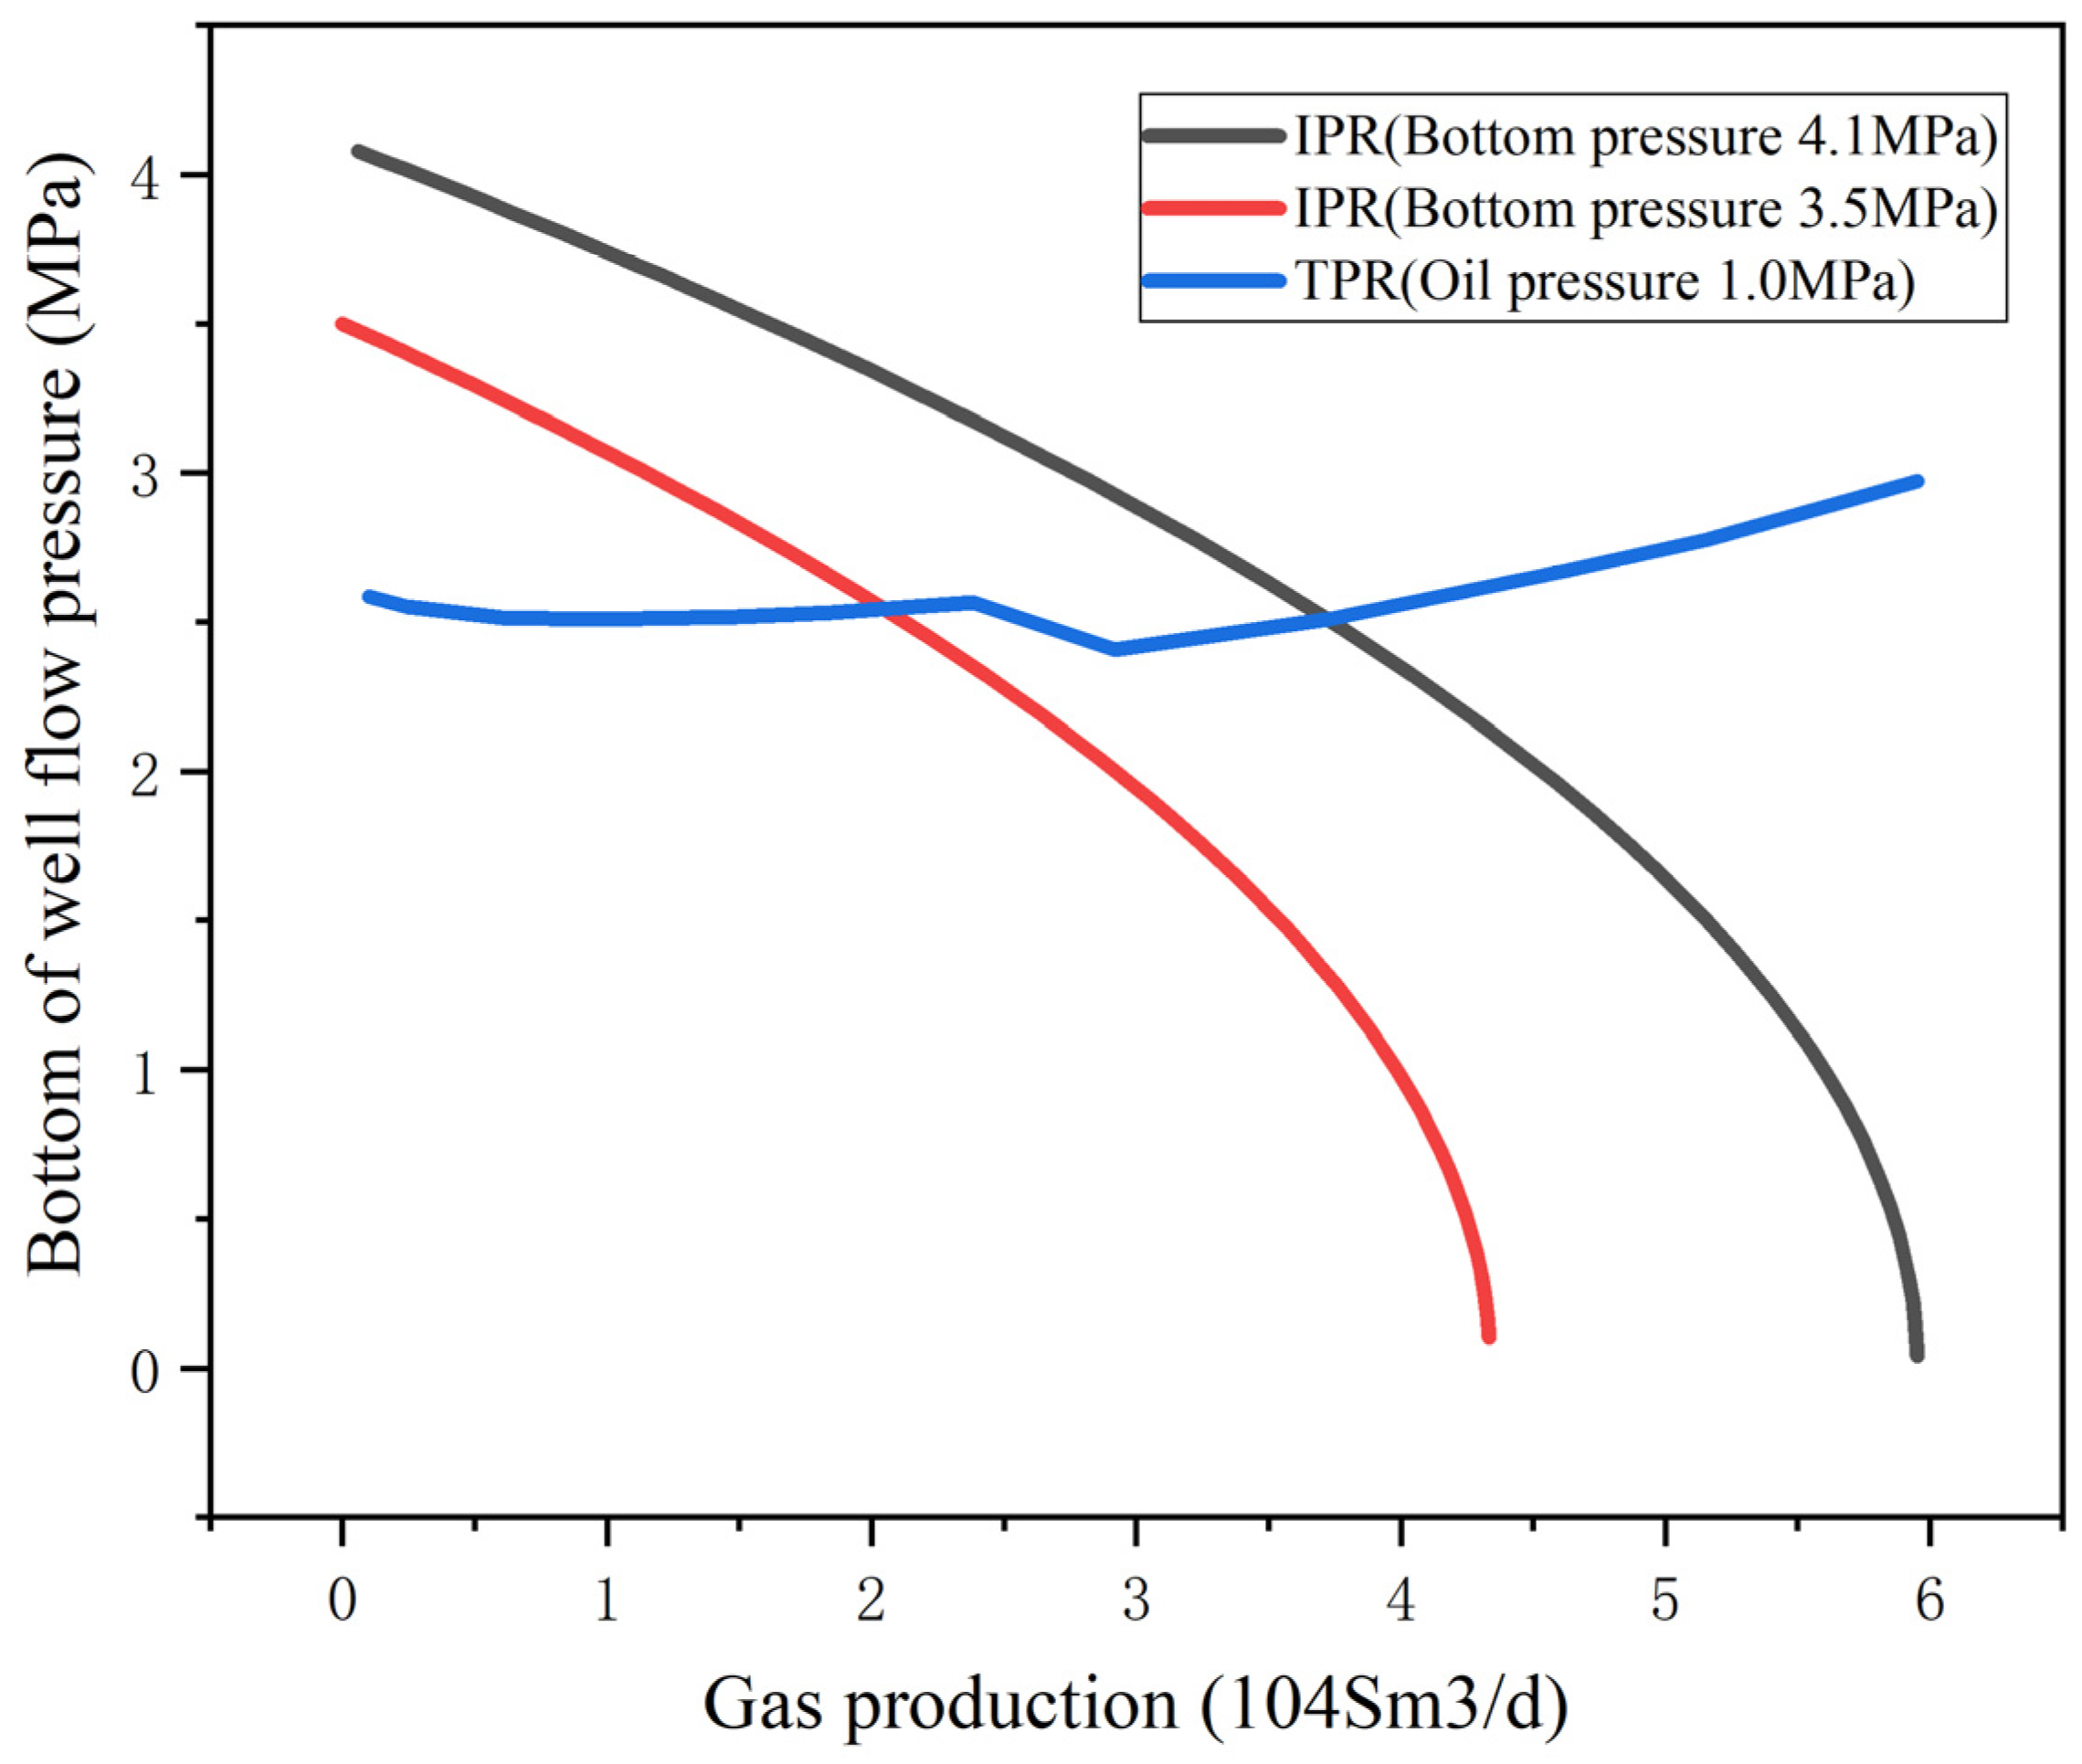
2.2. Calculation Method of the IPR Curve

Determining the inflow performance relationship (IPR) curve is an essential step in the calculation of gas well production. This involves integrating the geological properties of shale gas and the seepage characteristics of fractured horizontal wells, taking into account the variable mass flow from the formation to the fracture. By applying the superposition principle, a steady-state stage production capacity equation was proposed for multi-stage fractured horizontal wells in shale gas reservoirs.
The flow rate at any given position within the artificial fracture [30]:
v f x = M R T P Z K f μ d P f d x = 1 2 K f M R T d ψ f d x
Considering the additional pressure drop caused by the high-speed non-Darcy effect and the epidermal effect [30]:
ψ e ψ w f = q g f s c Z e c h k m 1 1 e c x f P s c T Z 0 T s c 1 + S + D q g f s c
Assuming that a shale gas multi-stage fractured horizontal well has n uniformly distributed fractures, the total gas production from the well is qgsc, the gas production from each fractured fracture is qgsc/n, and the shale gas well capacity equation satisfies the binomial form [30]:
P e 2 μ e Z e P w f 2 μ w f Z w f = A q g s c + B q g s c 2
Thereinto:
A = 1 4 n Z e c h k m 1 1 e c x f p s c T Z 0 T s c 1 + S
B = 1 8 n 2 Z e c h k m 1 1 e c x f P s c T Z 0 T s c D
c = 2 k m k f z e ω
In the case of well Xx H10 −1, the fundamental formation parameters are presented in Table 1, sourced from the pressure recovery test conducted on well Xx 10−1. The measured PVT (pressure–volume–temperature) curve is fitted, as shown in Figure 2. The goal was to calculate the product of compression factor and viscosity at various pressures.
After substituting the given data from Table 1 into the binomial equation for gas wells, the values A = 124.754377 and B = 0.037499 were obtained. The gas well capacity equation can be expressed as follows:
P e 2 P w f 2 = μ Z ) p 124.754377 q g s c + 0.037499 q g s c 2
Based on the 2021 pressure test data of well Xx H10 −1 (as shown in Table 2), the formation static pressure test value was recorded as 3.379 MPa, while the model-calculated value was 3.210 MPa. This resulted in a relative error of 5.0%. The relatively low relative error indicated the accuracy and correctness of the IPR (inflow performance relationship) curve of well Xx H10 −1.
In order to analyze the impact of pressurization measures on EUR, the decay process of the formation pressure in gas wells under different cumulative gas production scenarios needs to be clarified. In this study, based on shale gas reserves and an analysis of the mechanism, we fitted shale gas well reserves based on the material balance method, and then predicted the variation of the formation pressure under different cumulative production scenarios.
The material balance equation for shale gas wells [31]:
G p B g = G m B g B g i + G f B g B g i + G m B g i B g ρ b 1 S m i Φ m Φ a V L P 0 P L + P 0 V L P P L + P G m B g i ρ b ρ s c 1 S m i Φ m Φ a ρ S m i x V L P 0 P L + P 0 V L P P L + P + G m B g i Φ m 1 S m i Φ m Φ a c x + c w S m P 0 P + G f B g i 1 S f c f + c w S f P 0 P
Y M = G f + F M G m
Y = G p B g
M = B g B g i + B g i 1 S f i c f + c w S f i P 0 P
F = B g B g i + B g i B g V L 1 S m i Φ m Φ a P 0 P L + P 0 P P L + P B g ρ s c ρ S m i x + B g i Φ m 1 S m i Φ m Φ a c x + c w S m P 0 P
Based on the formation pressure and dynamic production data obtained during the production of well Xx H10 −1 (Table 3), the well reserves were calculated using the material balance equation. The calculated values of Y/M and F/M were plotted (Figure 3). By applying Equation (11), the slope was determined as the matrix-free gas storage volume Gm = 0.5271 × 10⁸ m3, and the intercept represented as the fracture-free gas storage volume Gf = 0.0691 × 10⁸ m3. The adsorbed gas storage capacity was calculated as 1.3226 × 10⁸ m3. The total storage capacity was determined to be 1.9188 × 10⁸ m3. To predict the decay process of the average formation pressure under different cumulative production scenarios, the reserves of well Xx H10 −1 (Table 4) were used. The predicted results were then compared with the actual measured data (Figure 4) to verify the accuracy of the calculations. The comparison showed a close resemblance between the predicted and actual decay processes of the average formation pressure under different cumulative production scenarios. By establishing the correspondence between the cumulative production and the average formation pressure, the IPR curve under different cumulative production levels was calculated. This curve served as a basis for determining gas well production under various formation pressures.

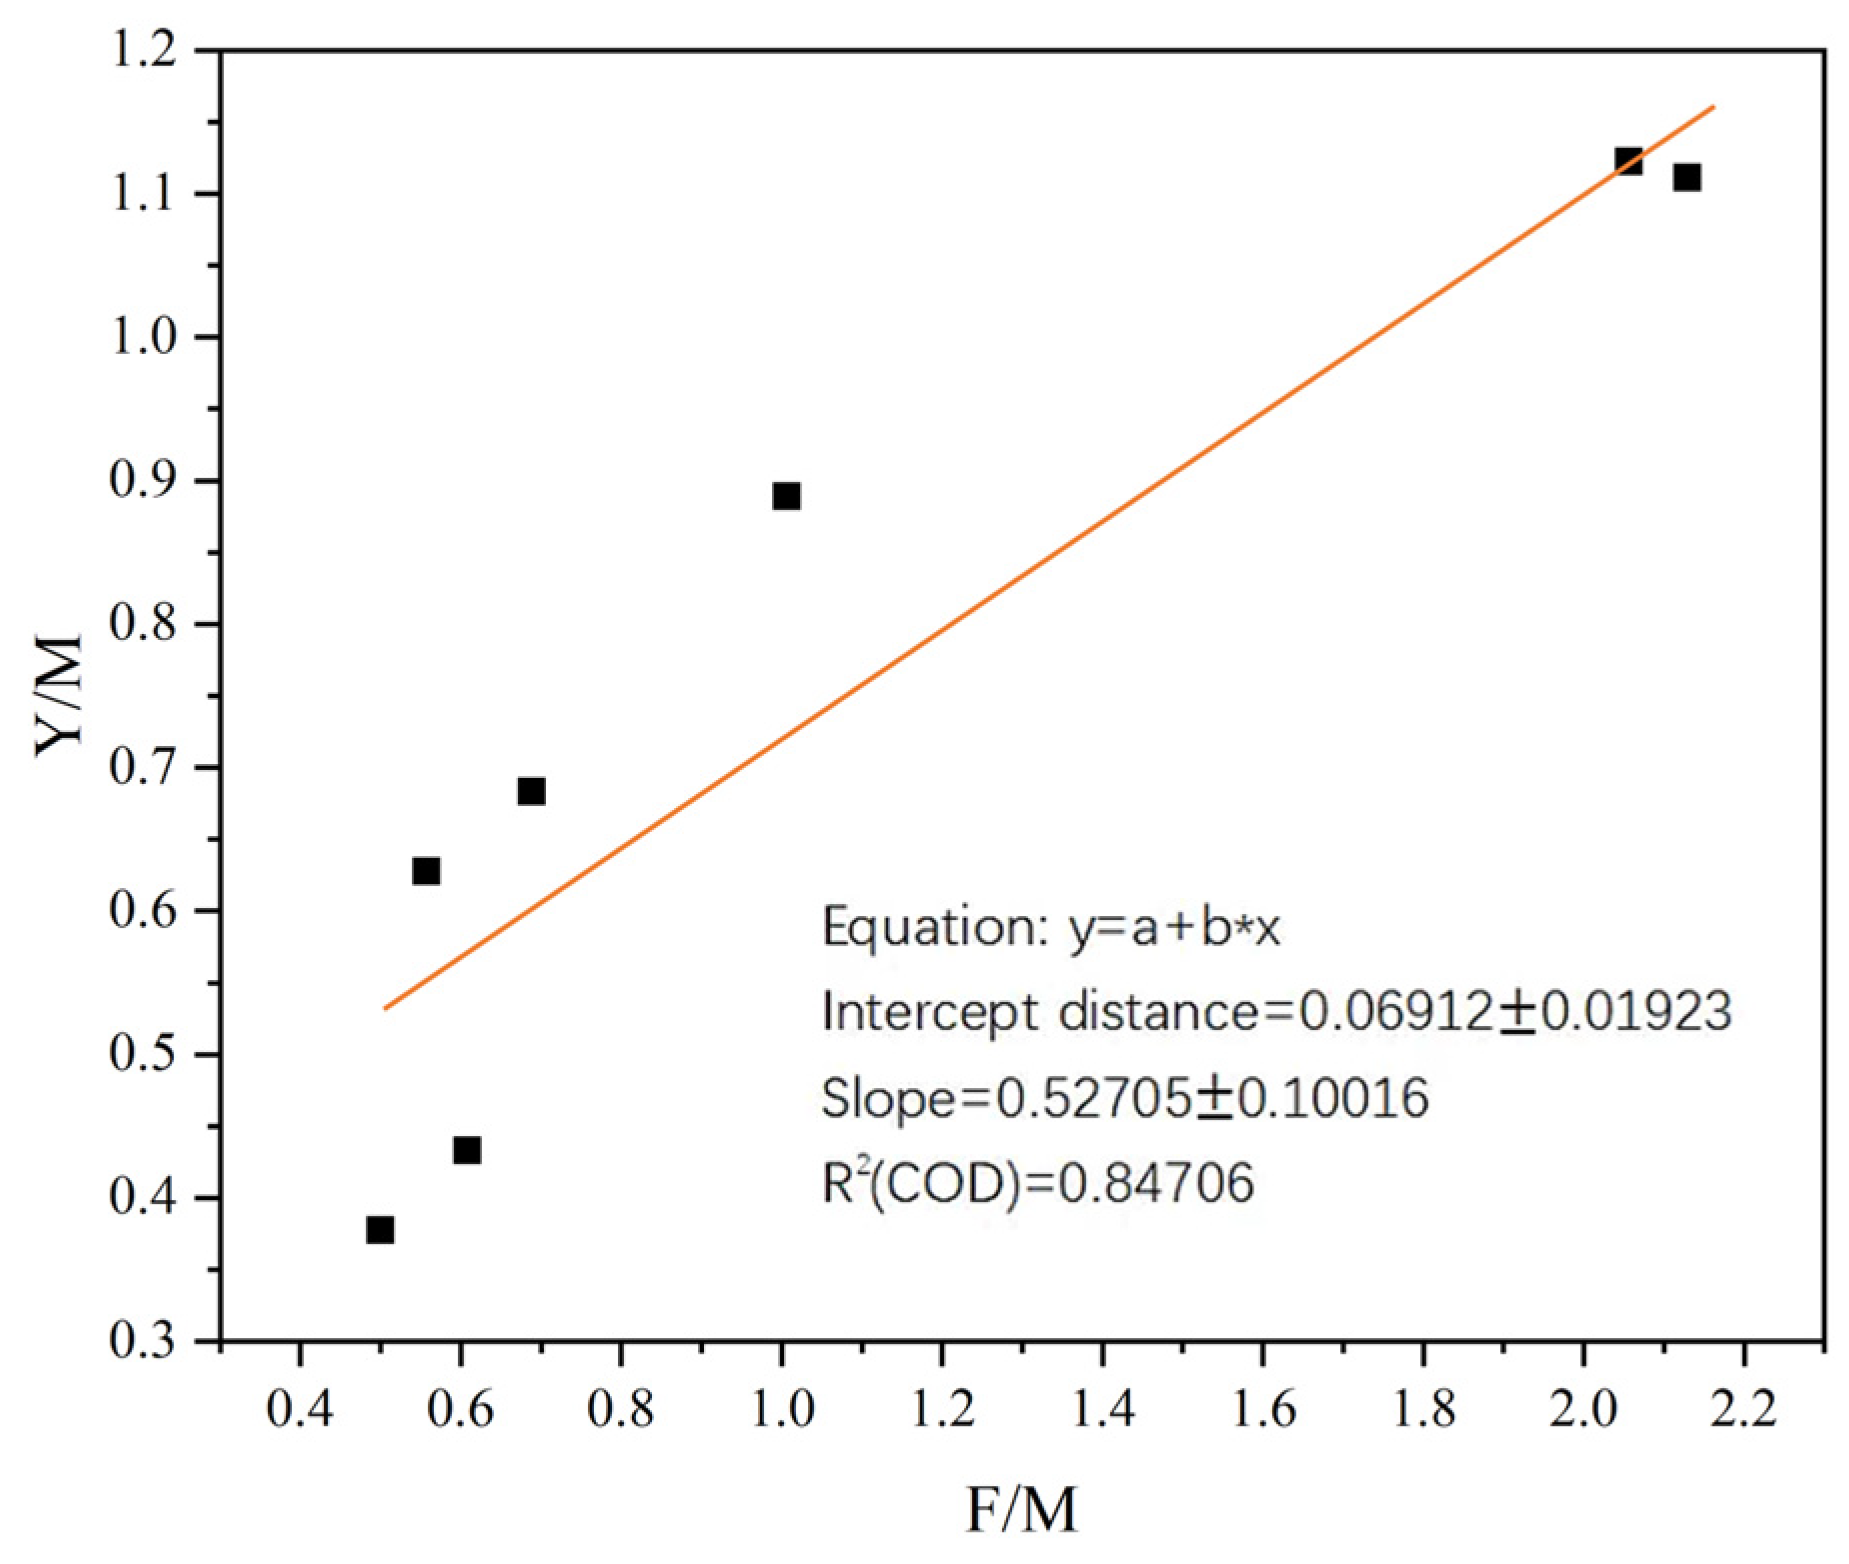
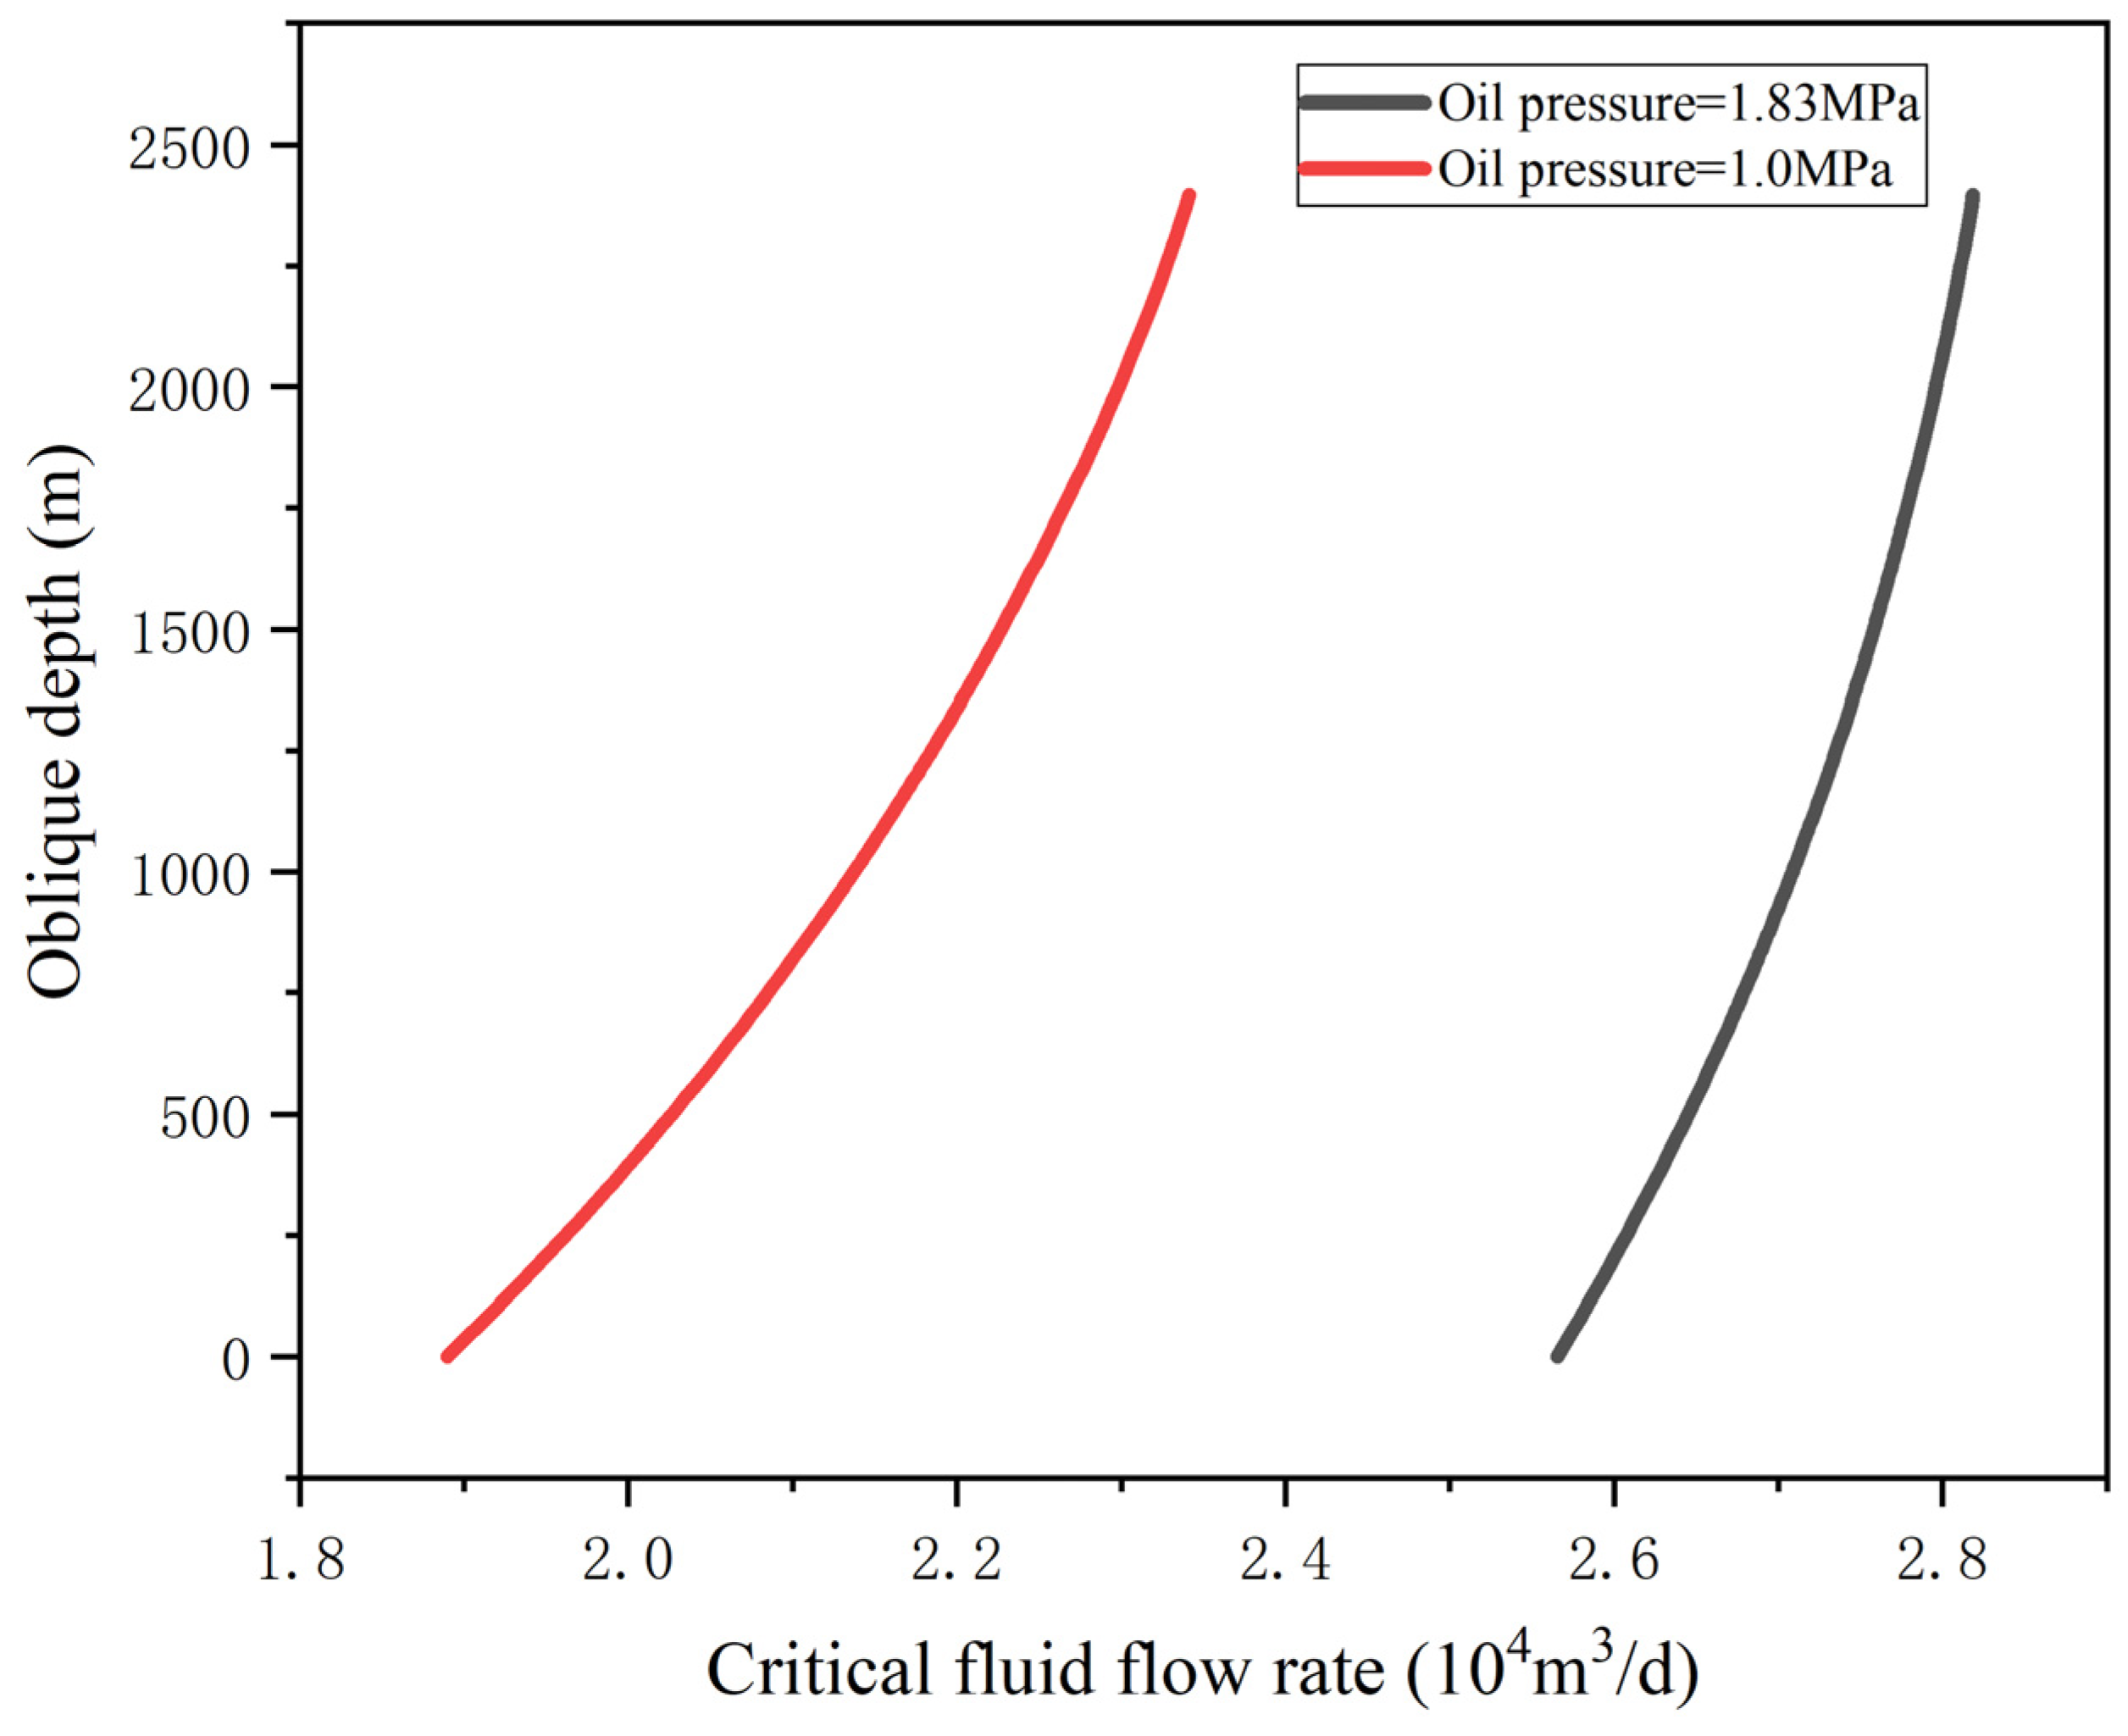
2.3. Establishment of a Critical Fluid-Carrying Model for Horizontal Shale Gas Wells

Statistical data show that [32] water-bearing gas reservoirs in the Sichuan gas field account for more than 80% of the total reserves. As gas fields are developed, the proportion of water-producing gas wells has been increasing annually. Most water-producing gas wells exhibit a ring fog flow during normal production. In instances where the flow rate of the gas phase is insufficient to consistently lift the fluid out of the wellbore, a fluid pool is formed at the bottom of the well. This accumulation of fluid in the wellbore results in an elevation in back pressure on the gas formation, thereby restricting the productivity of the well. Excessive fluid in the wellbore can even result in wellbore liquid loading, causing the gas well to cease flowing. Furthermore, when the actual gas flow rate in the wellbore is lower than the critical flow rate, the airflow becomes unable to remove all the liquid from the wellhead, resulting in liquid accumulation at the bottom of the well. The flow pattern in the wellbore will change, including the emergence of segment plug flow, necessitating a comprehensive examination of the multi-phase tubular flow pattern theory. This investigation holds significant value in accurately comprehending the fluid-carrying and accumulation characteristics within gas wellbores and in providing guidance for gas well production. In 2019, Liu et al. [33] conducted a study on wellbore flow calculation methods based on pressure and temperature test data from 40 wells in shale gas fields. They proposed using the modified Hagedorn–Brown model for sections with well slope angles <45° and the modified Beggs–Brill model for sections with well slope angles >45°. The use of horizontal wells in tight gas reservoirs has become increasingly common in recent years. This is mainly because horizontal wells can significantly increase the drainage area of the reservoir, thereby enhancing the productivity of a single well. However, due to the different borehole trajectories and complex flow patterns in horizontal wells, conventional prediction models, such as the Turner model and the Li Min model [34], which are based on straight wells, are not applicable to horizontal wells. In this study, a combination of research from the literature [34] and field experience was employed to select the modified Min model for calculating the critical velocity of liquid carry (Equation (13)) and the flow (Equation (14)). By comparing the critical flow rates of fluid carry at oil pressures of 1.83 MPa and 1.0 MPa (Figure 5), it was found that lowering the wellhead pressure reduced the critical flow rate of fluid carrying, thus facilitating the discharge of fluid accumulation from the gas wells.
υ c r i t = 5 σ ρ l ρ g ρ g 2 0.25 s i n 1.7 β 0.38 0.74
Q c r i t = 2.5 × 10 4 × A P υ c r Z T

2.4. Establishment of Booster Timing

Currently, there is a consensus among scholars [27,28,29,32,33,34,35] that during the normal production of gas wells, the gas and liquid phases in the wellbore typically exhibit an annular flow, with the gas phase carrying the liquid phase in an upward movement. This state is known as continuous liquid carry. However, if the gas flow rate falls below the critical gas flow rate for continuous liquid carry, liquid accumulation occurs in the gas well. To prevent liquid accumulation, gas production from the well must exceed the critical flow rate for liquid carry. The decline in gas well production and liquid carry capacity was determined by considering both the gas reservoir’s supply capacity and the wellbore’s production capacity. Using the nodal analysis method, the inflow curve (gas well IPR curve) and the outflow curve (wellbore TPR curve) were plotted, with the bottom of the well as the reference point for the solution. The gas well production was determined by the intersection of these two curves. Taking well Xx H10 −1 as an example, based on the pressure recovery interpretation results on 17 September 2021, the formation pressure pr was 4.1 MPa, and when the wellhead pressure pt was 1.83 MPa, the nodal analysis results (Figure 6) indicated a gas production of 1.47 × 10⁴ m3/d. By reducing the wellhead pressure to 1.0 MPa through pressure boosting measures, the TPR curve moved downward, and the intersection of the TPR curve and IPR curve shifted to the right. As a result, the gas production of the well increased, reaching 3.72 × 10⁴ m3/d. Lowering the wellhead pressure enhanced the wellbore delivery capacity. The improvement in wellbore delivery capacity also relied on the gas reservoir’s supply capacity to achieve stable production. As well Xx H10 −1 continued to produce, its formation pressure gradually decreased, causing the IPR curve of the gas well to shift downward (Figure 7). Even if the wellhead pressure remained constant (TPR curve remained constant), the intersection of the IPR curve and TPR curve shifted to the left, leading to a decrease in the gas well production. For instance, when the formation pressure dropped to 3.5 MPa, the gas well production decreased to 2.05 × 10⁴ m3/d, even with a constant wellhead pressure of 1.0 Mpa. In such cases, the production can be increased by reducing the wellhead pressure and shifting the intersection of the TPR and IPR curves to the right.

3. Actual Production Research

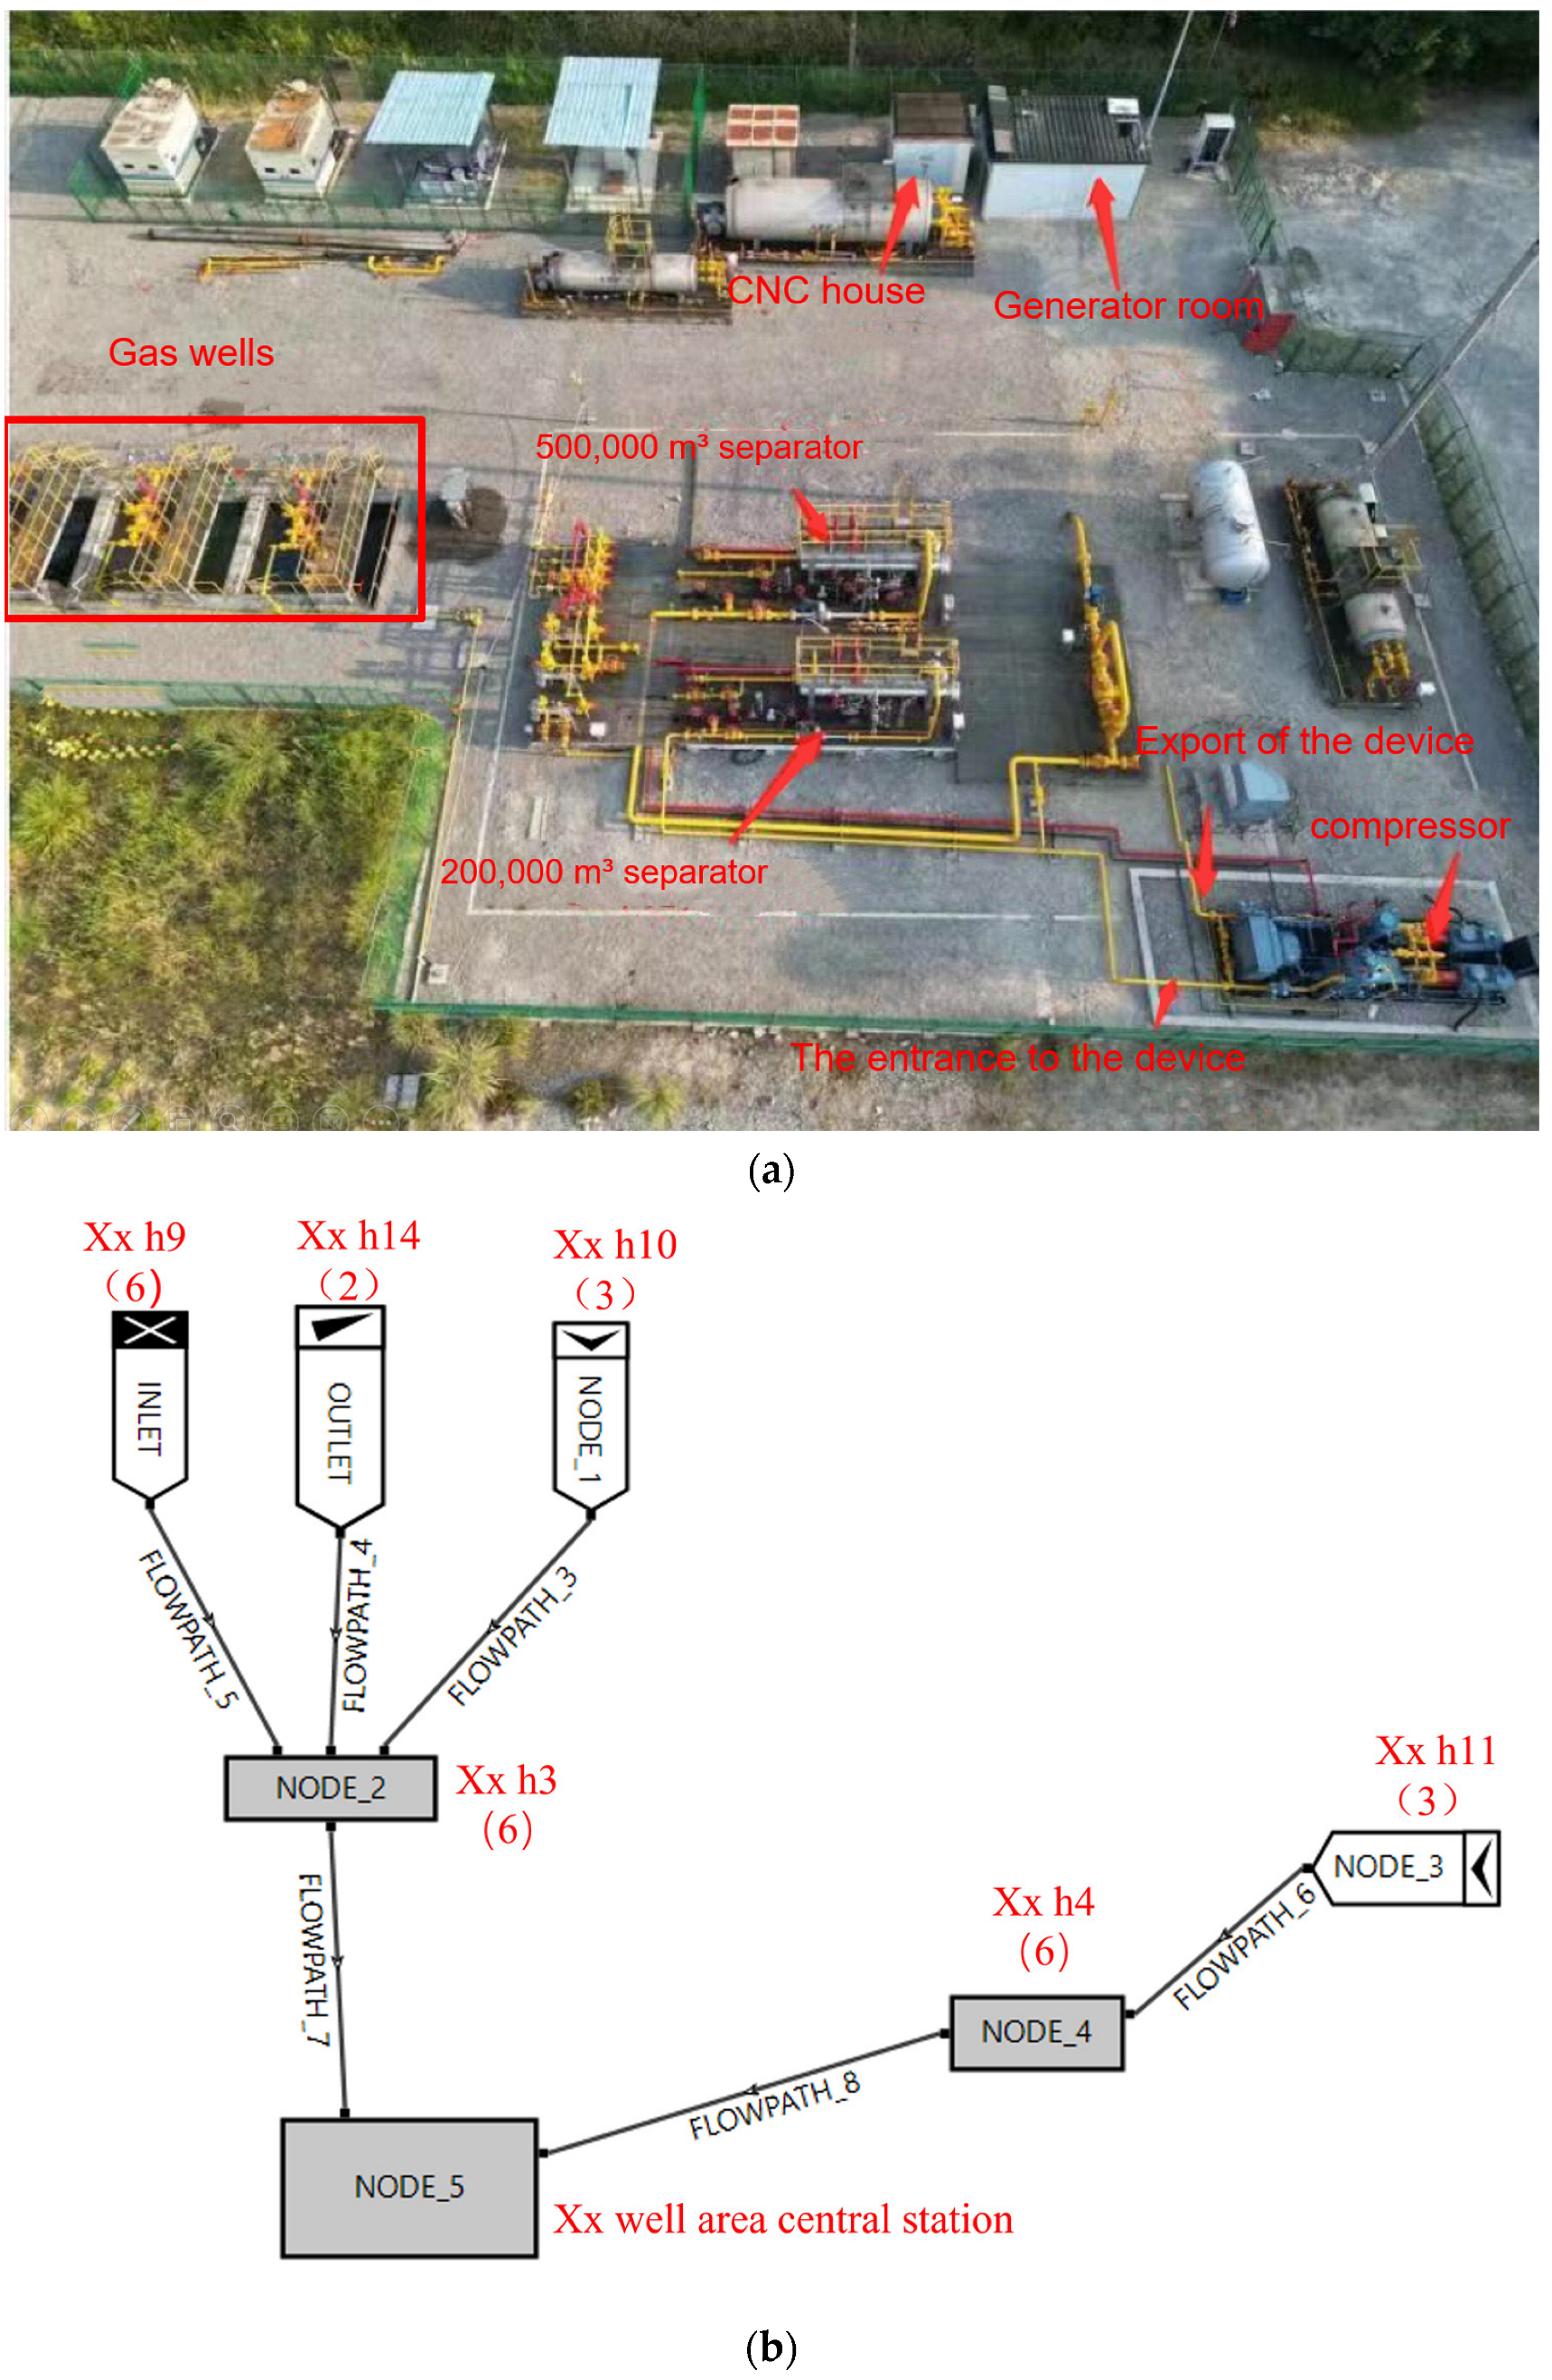
3.1. Equipment Selection

The compressor unit is the core piece of equipment in the booster station, with high investment and complex operating conditions, and the rationality of the unit selection is closely related to the booster program. Combined with the characteristics of the Xx gas field, the matching compressor was selected. ① Because the natural gas in the Xx booster station often contains water, condensate oil, sand, and so on, and the gas well production varies widely, the compressor to be used in the gas field gathering system should be selected from the compressor with strong adaptability to the gas medium and a wide range of working conditions. ② The Xx platform collection network covers a small area, so compressor sets should be skid-mounted equipment, as far as possible, to reduce the footprint. ③ Suitable for multi-stage pressurization requirements, the ability to create negative pressure should be strong—the stronger the ability to create negative pressure, the greater the production pressure difference and the higher the output. ④ It is necessary to meet the requirements of the Xx platform wellhead pressure, gas production, and the pressure differential between the compressor inlet pressure and the external transmission pressure. ⑤ The Xx platform location is remote, so if the equipment failure rate is high, maintenance experts will be required to visit often, resulting in higher maintenance costs; thus, this selection must have simple installation, a simple system, easy maintenance, and a low failure rate. Based on the above requirements, this study considered the star rotary mixed air pump as the booster equipment of this platform and compared it with the traditional equipment in Table 5 to highlight the superiority of the equipment.

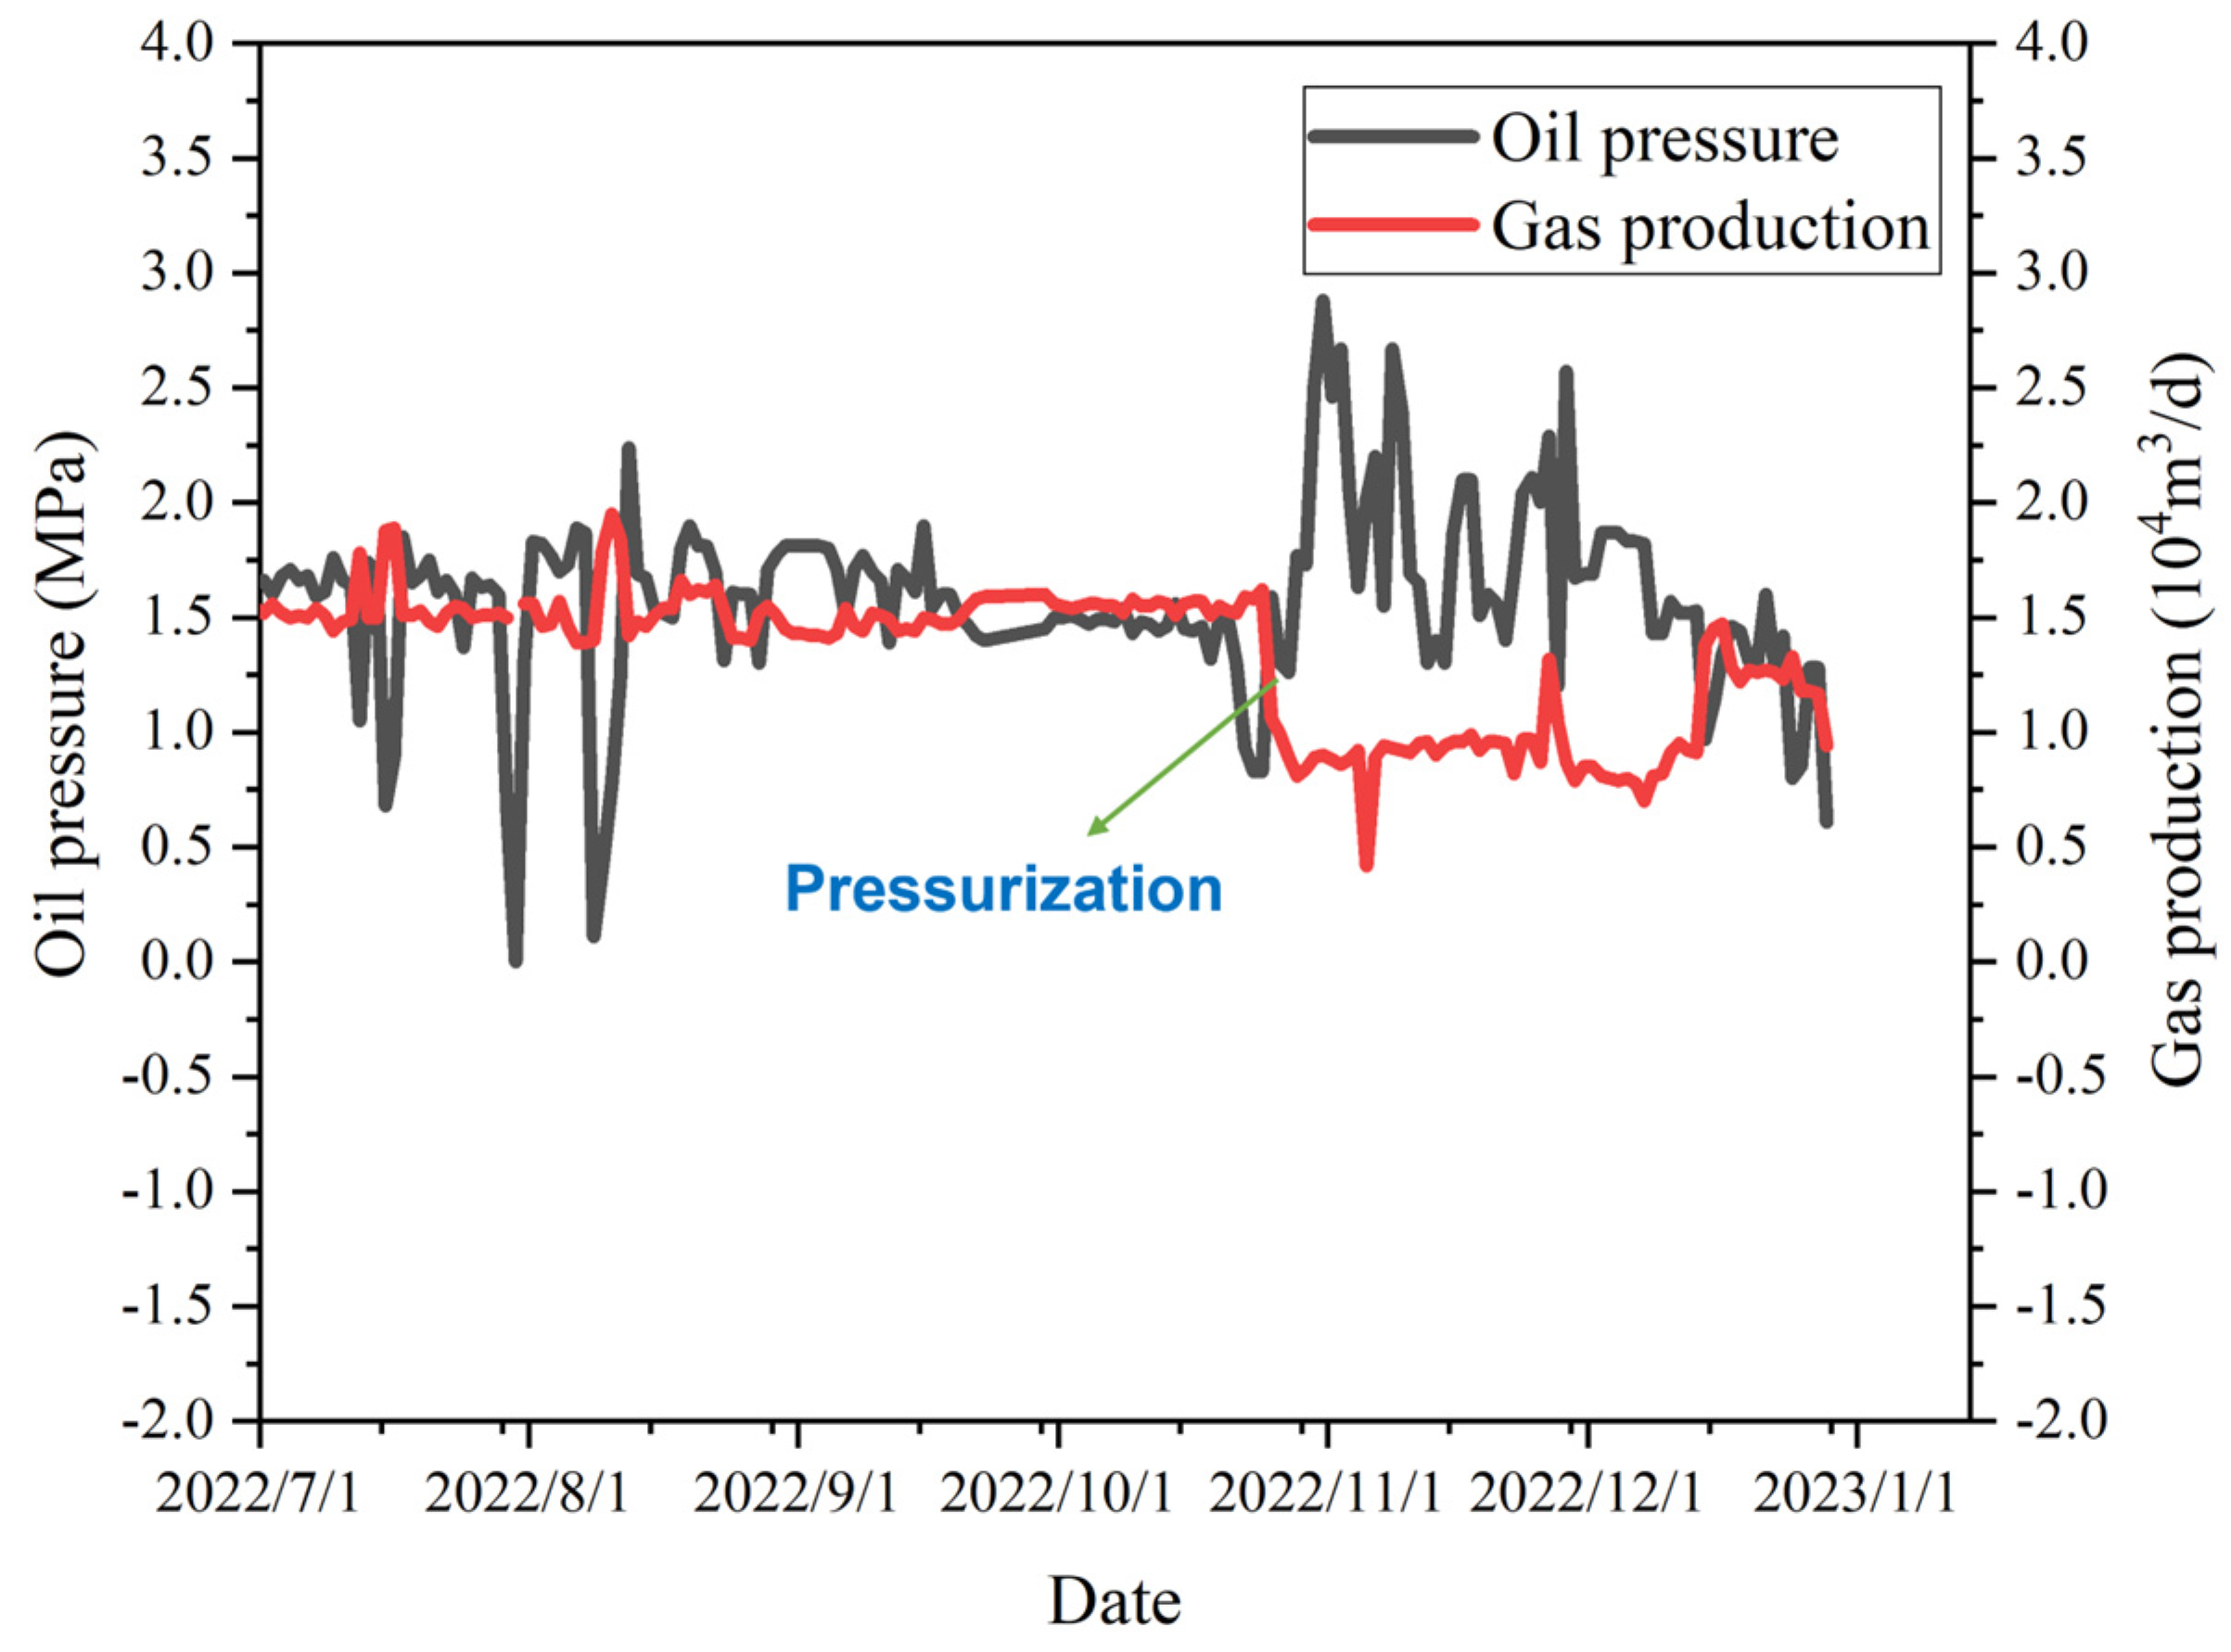
3.2. Platform Pressurization Process Effect Analysis

The Xx platform conducted a test run from 18–28 August on wells 2 and 3 to increase the pressure while suspending bubble row refilling. During this test period, the wellhead pressure decreased, resulting in increased production from the platform, and no abnormal gas well production was observed. Subsequently, on 21 October, the platform officially began pressurizing, this time including three wells simultaneously, while discontinuing bubble row refilling. After approximately 15 days of operation, wells 2 and 3 were flooded successively, and gas lift operations were resumed. To maintain continuous production from the gas wells, a combination of pressurization with bubble drainage and plunger gas lift techniques was employed. This refined the cooperation between the bubble drainage and plunger gas lift processes, which allowed for the reduction in the minimum wellhead pressure to 0.4 MPa under the full load of the booster unit (as shown in Figure 8). So far, the production has been relatively smooth, and the platform has achieved an increase in production by 12 to 14 thousand cubic meters per day, effectively achieving the expected results of the implemented measures.

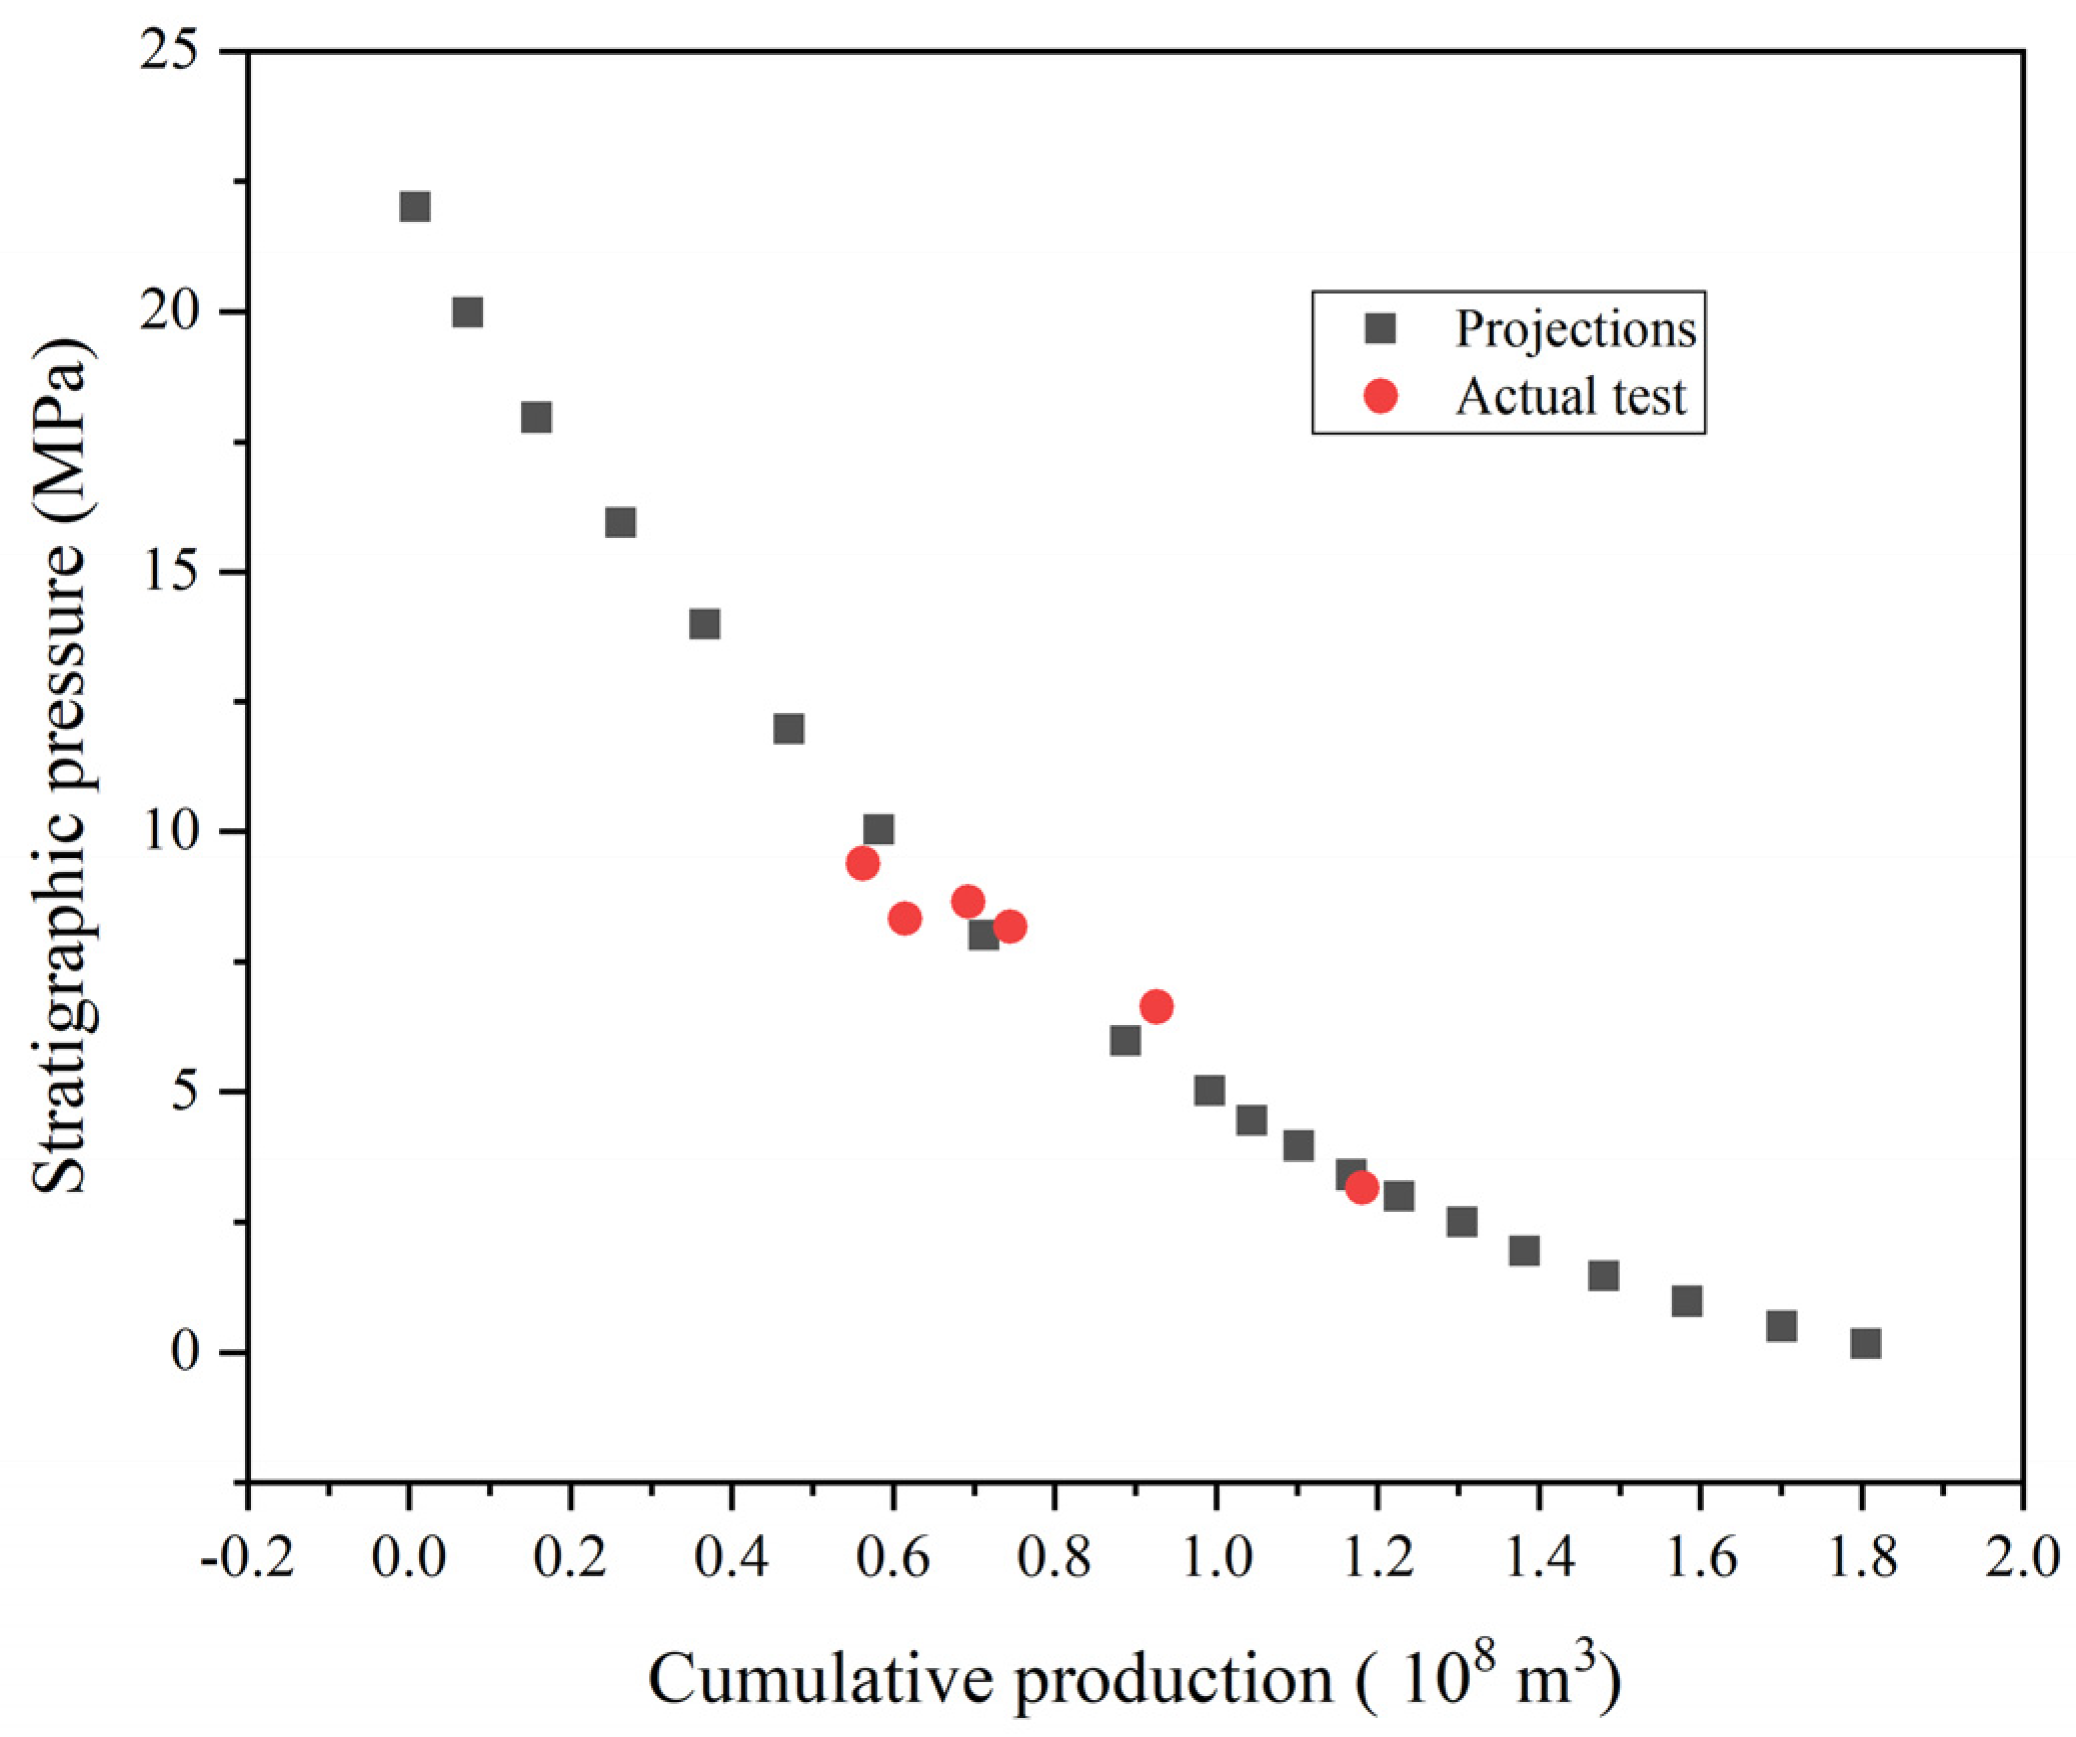
3.3. Platform Pressurization Process Predictive Analysis

If the economic limit production of Xx shale gas well is 2890 m3/day, the minimum wellhead pressure before boosting is 1.5 Mpa, and the minimum wellhead pressure after depressurization is 0.9 MPa. According to the relationship between gas reservoir abandonment pressure and cumulative gas production established by the research, the changes of reservoir abandonment pressure and cumulative gas production (EUR) in well H10 −2 and well H10 −3 were calculated in Table 6. Calculations showed that the abandoned formation pressure in wells H10 −2 and H10 −3 decreased from 3.03 MPa and 3.16 MPa to 2.34 MPa and 2.43 MPa, respectively, as a result of the pressure boosting measures, and the EUR of the two wells increased by 10.33 million cubic meters and 10.43 million cubic meters, respectively.

4. Conclusions

This study focused on the development of the Xx shale gas field and proposed a three-stage pressurization process to address the specific conditions of the field. The primary pressurization occurred at the central station of the Xx block, followed by secondary pressurization at the gas gathering station. Finally, small pressure boosting equipment was installed after the platform separator and in front of the outlet valve group, forming a three-stage pressurization process. The main objective of this pressurization process was to lower the wellhead pressure, which, in turn, reduced the critical liquid-carrying flow rate of gas wells and enhanced their liquid-carrying capacities. By introducing a compressor, the wellhead pressure could be reduced to 0.4 MPa, resulting in a daily output of 12,000 to 14,000 cubic meters from the platform. Through the utilization of the critical liquid-carrying model for shale gas horizontal wells, it has been determined that reducing the pressure at the wellhead had a positive impact on the critical flow of liquid carrying. This reduction facilitated the discharge of accumulated fluids from the gas wells, allowing for improved operational efficiency. This study successfully established an inflow performance relationship (IPR) curve by analyzing the field test data, demonstrating a high level of accuracy, with an error value of only 5%. Furthermore, the mass balance method was applied to estimate the formation pressure of shale gas wells, which exhibited a strong correlation with the actual values, indicating the reliability of the estimation process. By calculating the cumulative production based on different IPR curves and fitting a dynamic production decline model for gas outlet wells, this study revealed the relationship between the waste pressure of the gas reservoirs and the boost effect on wells H10 −2 and H10 −3. The results showed a significant decrease in the waste formation pressure of H10 −2 and H10 −3 wells from 3.03 MPa and 3.16 MPa to 2.34 MPa and 2.43 MPa, respectively. Additionally, the estimated ultimate recovery (EUR) of these wells demonstrated a considerable increase of 103.3 million cubic meters and 104.3 million cubic meters, respectively. Consequently, the implementation of multi-stage pressurization, as investigated in this study, proved to be an effective approach for enhancing the production in shale gas fields. This finding holds practical significance for ensuring stable production and development in the shale gas industry. By achieving lower well waste pressure, the production time of gas wells can be extended, leading to improved recovery rates in the gas fields. However, it is important to note that due to the late stage of platform development and low formation pressure, the pressurized gas wells may not meet the requirements for continuous liquid carrying. Therefore, drainage gas production processes must still be maintained to mitigate the risk of flooded wells. If there is still a possibility of fluid accumulation after pressurization, it is crucial to combine pressurization measures with drainage techniques, such as bubble drainage or plunger gas lift. To maximize the gas well capacity, it is necessary to make timely adjustments to the drainage process regime. This includes coordinating the switch-on and switch-off well regime for platform plunger gas lift wells. Additionally, the timing of pressurization should be based on the critical liquid-carrying yield of the gas wells with fluid, and a reasonable interval for pressurization timing should be analyzed. From the perspectives of formation pressure, cumulative gas production, gas production, and EUR increment, the reasonable interval of pressurization timing was explored.

Author Contributions

Conceptualization, Y.L., J.Y. and M.C.; methodology, Y.L. and L.Z.; validation, Y.L. and L.Z.; formal analysis, Y.L., J.Y. and L.Y.; writing—original draft, Y.L., M.C. and J.L.; writing—review and editing, M.C., L.Y., H.P., J.L. and L.Z.; supervision, L.Y. and H.P.; project administration, Y.L., J.Y. and M.C.; funding acquisition, Y.L. and L.Z. All authors have read and agreed to the published version of the manuscript.

Funding

This research was funded by the National Natural Science Foundation of China under Grants 52325402, 51874335, 52274057, and 52074340; the Major Scientific and Technological Projects of CNPC under Grant ZD2019-183-008; the Major Scientific and Technological Projects of CNOOC under Grant CCL2022RCPS0397RSN; the Science and Technology Support Plan for Youth Innovation of University in Shandong Province under Grant 2019KJH002; and 111 Project under Grant B08028.

Data Availability Statement

Not applicable.

Conflicts of Interest

The authors declare no conflict of interest.

Nomenclature

G f original free gas reserves of the gas reservoir, 104 m3
G m free gas reserves in the matrix system, m3
B g i gas volume factor at primordial formation pressure, m3/m3
V L volume constant, m3/t
Pformation pressure, MPa
P L pressure constant, MPa
ρ b apparent density of matrix rocks, g/m3
φ m matrix system porosity
B g gas volume coefficient at formation pressure P, m3/m3
ρ s c natural gas density in the standard state, g/m3
C f fracture system compression coefficient, MPa−1
C w formation water compression coefficient, MPa−1
G p cumulative gas production, 104 m3
q g s c daily gas production in shale gas wells under standard conditions, 104 m3
p s c standard pressure, MPa
T s c standard temperature, K
Sepidermal coefficient
Dhigh-speed non-Darcy coefficient
ν f x gas flow rate, cm/s
ψ e quasi-pressure corresponding to the formation pressure of the two adjacent fracture centerlines (at the choke boundary), (0.1 MP)2/(mPa · s )
ψ f quasi-pressure corresponding to the crack pressure at the fracturing fracture x position, (0.1 MP)2/(mPa · s )
υ c r i t critical flow rate of gas well discharge, m/s
Atank cross-sectional area, m2
Zgas deviation coefficient under P and T conditions
Runiversal gas constant, j/(mol·k)

References

  1. Mingqiang, W.; Yonggang, D.; Quantang, F.; Tingkuan, C.; Rong, W. Research status of pore permeability structure characteristics and seepage mechanism in shale gas reservoirs. Oil Gas Reserv. Eval. Dev. 2011, 1, 73–77. [Google Scholar]
  2. Zhou, J.; Tian, S.; Zhou, L.; Xian, X.; Yang, K.; Jiang, Y.; Zhang, C.; Guo, Y. Experimental investigation on the influence of sub- and super-critical CO2 saturation time on the permeability of fractured shale. Energy 2020, 191, 116574. [Google Scholar] [CrossRef]
  3. Ren, J.; Tan, S.; Goodsite, M.E.; Sovacool, B.K.; Dong, L. Sustainability, shale gas, and energy transition in China: Assessing barriers and prioritizing strategic measures. Energy 2015, 62, 551–562. [Google Scholar] [CrossRef]
  4. Hu, J.; Khan, F.I.; Zhang, L.; Tian, S. Data-driven early warning model for screen out scenarios in shale gas fracturing operation. Comput. Chem. Eng. 2020, 143, 107116. [Google Scholar] [CrossRef]
  5. Jacobs, T. Renewing Mature Shale Wells Through Refracturing. J. Pet. Technol. 2014, 66, 52–60. [Google Scholar] [CrossRef]
  6. Wang, K.; Li, H.; Wang, J.-C.; Jiang, B.; Bu, C.; Zhang, Q.; Wei, L. Predicting production and estimated ultimate recoveries for shale gas wells: A new methodology approach. Appl. Energy 2017, 206, 1416–1431. [Google Scholar] [CrossRef]
  7. Zongming, Y.; Daoming, D. Technical characteristics of low pressure gas gathering and transportation project. Nat. Gas Ind. 1997, 17, 71–75+11. [Google Scholar]
  8. Guarnone, M.; Rossi, F.; Negri, E.; Grassi, C.; Genazzi, D.; Zennaro, R. An unconventional mindset for shale gas surface facilities. J. Nat. Gas Sci. Eng. 2012, 6, 14–23. [Google Scholar] [CrossRef]
  9. Mancini, F.; Zennaro, R.; Buongiorno, N.; Broccia, P.; Chirico, M. Surface Facilities For Shale Gas: A Matter Of Modularity, Phasing And Minimal Operations. In Proceedings of the Offshore Mediterranean Conference and Exhibition, Ravenna, Italy, 23–25 March 2011; p. 158. [Google Scholar]
  10. Arthur, J.D.; Bohm, B.K.; Layne, M.A. Considerations for development of Marcellus Shale gas. World Oil 2009, 512–513, 36–42. [Google Scholar]
  11. Kang, C.; Xin, J.; Yuanxing, Z.; Longsheng, Z.; Zhen, X. Current status and enlightenment of surface gathering and transportation technology of shale gas in the United States. Nat. Gas Ind. 2014, 34, 102–110. [Google Scholar]
  12. Behl, N.; Kiser, K.E.; Ryan, J. Improved Production in Low-Pressure Gas Wells by Installing Wellsite Compressors. In Proceedings of the SPE Gas Technology Symposium, Calgary, AB, Canada, 15–17 May 2006. [Google Scholar]
  13. Chuanlei, W. Research on Pressurized Gathering and Transportation Technology in Daniudi Gas Field. Master’s Thesis, China University of Petroleum (East China), Dongying, China, 2014. [Google Scholar]
  14. Josifovic, A.; Roberts, J.; Corney, J.; Davies, B. Reducing the environmental impact of hydraulic fracturing through design optimisation of positive displacement pumps. Energy 2015, 115, 1216–1233. [Google Scholar] [CrossRef] [Green Version]
  15. Yeten, B.; Castellini, A.; Guyaguler, B.; Chen, W.H. A Comparison Study on Experimental Design and Response Surface Methodologies. In Proceedings of the SPE Reservoir Simulation Symposium, The Woodlands, TX, USA, 31 January–2 February 2005. [Google Scholar]
  16. Arps, J.J. Analysis of Decline Curves. Pet. Trans. 1945, 160, 228–247. [Google Scholar] [CrossRef]
  17. Qiulan, Y.; Hai, D.; Dongliang, L.; Chunzhi, L.; Linyao, Y. Study on the law of decreasing production capacity of gas wells. Nat. Gas Explor. Dev. 2012, 35, 41–43+52+84. [Google Scholar]
  18. Chen, H.; Zhang, W.; Lin, J.; Shao, G.; Zhou, J.; Gao, Y.; Yu, H.; Yu, X. Application of multipole array acoustic logging in volume fracturing effect evaluation. Energies 2020, 112–115. [Google Scholar]
  19. Zhang, K.; Wang, Z.; Chen, G.; Zhang, L.; Yang, Y.; Yao, C.; Wang, J.; Yao, J. Training effective deep reinforcement learning agents for real-time life-cycle production optimization. J. Pet. Sci. Eng. 2022, 208, 109766. [Google Scholar] [CrossRef]
  20. Zhang, K.; Zhang, J.; Ma, X.; Yao, C.; Zhang, L.; Yang, Y.; Wang, J.; Yao, J.; Zhao, H. History matching of naturally fractured reservoirs using a deep sparse autoencoder. SPE J. 2021, 26, 1700–1721. [Google Scholar] [CrossRef]
  21. Zhang, K.; Zuo, Y.; Zhao, H.; Ma, X.; Gu, J.; Wang, J.; Yang, Y.; Yao, C.; Yao, J. Fourier Neural Operator for Solving Subsurface Oil/Water Two-Phase Flow Partial Differential Equation. SPE J. 2022, 27, 1815–1830. [Google Scholar] [CrossRef]
  22. Qinghua, M. Late pressurization mining technology for development of tight sandstone gas field in western Sichuan. J. Sichuan Univ. Arts Sci. 2007, 5, 43–45. [Google Scholar]
  23. Jianguo, H.; Xin, Z.; Gang, X.; Xiaofeng, Y.; Yanliang, W.; Lei, P. Analysis of CBM station standardization and skid installation design in Qinshui Basin. China Coalbed Methane 2017, 14, 38–42. [Google Scholar]
  24. Wanning, S. Discussion on the pressurization process of gas gathering station suitable for the characteristics of Jingbian gas field. Nat. Gas Ind. 2007, 2, 98–100+158. [Google Scholar]
  25. Zhengfen, L.; Baoli, Z. Research on process optimization of gas gathering station in two-stage pressurization stage of Daniudi gas field. Oil Gas Field Surf. Eng. 2018, 37, 44-4. [Google Scholar]
  26. Shi, W.; Zhang, C.; Jiang, S.; Liao, Y.; Shi, Y.; Feng, A.; Young, S. In Study on pressure-boosting stimulation technology in shale gas horizontal wells in the Fuling shale gas field. Energy 2022, 254, 124364. [Google Scholar] [CrossRef]
  27. Xinquan, R.; Tianshou, Z.; Yi, L.; Yongjie, L.; Denghai, W.; Guang, Y. Standardized construction of ground system in Sulige gas field. Oil Plan. Des. 2008, 4, 1–3+6+50. [Google Scholar]
  28. Zhangbing, C.; Xin, S.; Lin, Z. Low-pressure gas gathering and transportation process. Oil Gas Storage Transp. 2009, 28, 1–3+79+83. [Google Scholar]
  29. Xinan, Y.; Quanhua, H.; Chengli, G.; Jian, Y. Determination of the timing of pressurized mining in Shaanxi Block 45 of Jingbian Gas Field. J. Oil Gas Technol. 2009, 31, 329–331. [Google Scholar]
  30. Hua, L.; Xiaohu, H.; Weihong, W.; Yong, Z.; Yandong, G. Study on production capacity evaluation method of quasi-steady-state stage of shale gas fracturing horizontal well. J. Xi’an Shiyou Univ. 2016, 31, 76–81. [Google Scholar]
  31. Yingxue, S.; Xiaoping, L.; Li, S. The mass balance equation and reserve calculation method of shale gas reservoir considering water-soluble gas. Nat. Gas Geosci. 2015, 26, 1183–1189. [Google Scholar]
  32. Luguang, L. Overview of natural gas exploration, development and utilization in Sichuan Basin. Situat. Sichuan Prov. 2007, 1, 31–32. [Google Scholar]
  33. Yuhong, L. Research on Drainage and Production Technology of Horizontal Well of Shale Gas in Changning; Southwest Petroleum University: Chengdu, China, 2019. [Google Scholar]
  34. Min, L.; Ping, G.; Guangtian, T. A new view of gas well carrying fluids. Oil Explor. Dev. 2001, 5, 105–106+10-0. [Google Scholar]
  35. Shilun, L. Natural Gas Engineering, 2nd ed.; Petroleum Industry Press: Beijing, China, 2008. [Google Scholar]
Figure 1. (a) Xx H10 platform gas delivery process flow diagram; (b) Xx station gas transmission process flow diagram.
Separations 10 00432 g001
Figure 2. (a) Graphs of different formation pressures and compression factors; (b) graphs of different formation pressures and viscosities; (c) product plot of different formation pressures with compression factors and viscosity.
Separations 10 00432 g002
Figure 3. Relationship between Y/M and F/M.
Separations 10 00432 g003
Figure 4. Comparison between predicted and measured data of the decay process of the average formation pressure under different cumulative production cases.
Separations 10 00432 g004
Figure 5. Effect of wellhead pressure on fluid-carrying critical flow rate.
Separations 10 00432 g005
Figure 6. Effect of wellhead pressure on fluid-carrying critical flow rate (black line meas IPR (Bottom pressure 4.1 MPa)).
Separations 10 00432 g006
Figure 7. Effect of wellhead pressure on fluid-carrying critical flow rate.
Separations 10 00432 g007
Figure 8. Change in oil pressure and gas production before and after pressurization of Xx H10 −3 well.
Separations 10 00432 g008
Table 1. Basic stratigraphic parameters of well Xx H10 −1.
Stratigraphic Temperature (K)Crack Height/Shale Thickness (cm)Uncaused Fracture
Infusion
Capacity
Shale
Matrix
Permeability
(μm2)
Crack Half-Length (cm)Fracturing
Section Length
(cm)
Number of CracksTotal Epidermal
Coefficient
364.93350010.043.1 × 10−510,750136,200190.0133
Table 2. Pressure test data of well Xx H10 −1 in 2021.
DateTesting Central Pressure (MPa)Bottom Hole Flow Pressure (MPa)Daily Gas Production Capacity
(105 m3/d)
Average Calculated
Formation Pressure (MPa)
20 August 20212.7332.7431.663.210
23 August 2021Well shutdown pressure recovery
17 September 20213.344 (Measuring static pressure)None03.379 (Static pressure)
Table 3. Dynamic production data of well Xx H10 −1.
DateTesting Central Pressure (MPa)Discounted Bottomhole Flow Pressure
(MPa)
Daily Gas
Production
Capacity
(105 m3)
Average Calculated
Formation Pressure (MPa)
Cumulative Gas
Production (105 m3)
14 October 20167.7488.13212.0829.3915619.912
8 December 20167.257.5247.9998.7266125.840
24 March 20177.5637.8897.2368.9926843.317
19 June 20178.026 (Static pressure)8.226 (Static pressure)0None7451.635
19 July 20185.1325.9055.2616.6109209.911
20 August 20212.7332.7431.663.21011,792.283
17 September 20213.344 (Static pressure)3.379 (Static pressure)0None11,797.364
Table 4. Decay process of the average formation pressure under different cumulative production scenarios for the reservoir prediction of well Xx H10 −1.
Stratigraphic Pressure (MPa)Cumulative Yield
(108 m3)
Stratigraphic Pressure
(MPa)
Cumulative Yield (108 m3)
2204.51.03712
200.0668941.09471
180.155713.51.15672
160.2595531.22405
140.364322.51.29787
120.4685221.37972
100.581691.51.47155
80.717111.57597
60.884680.51.69641
50.983230.11.8074
Table 5. Comparison of equipment selection.
TypeAdvantages and Disadvantages
Reciprocating CompressorsAdvantages
  • Strong applicability to variable conditions. Reciprocating compressor is not limited by the booster pressure and volume range, can be adjusted by adjusting the compressor cylinder size and speed to adjust and control the flow rate.
  • Low material requirements, conventional steel can meet the requirements, low price, simple installation system.
  • Low noise.
  • Highly serviceable and easy to modify when used in different working conditions.
Disadvantages
  • Needs more installation space, heavy weight is not conducive to operation.
  • The output airflow has a certain pulsation and vibration during operation.
  • Reciprocating motion can easily cause damage to parts, and routine maintenance is more complicated.
Screw compressorsAdvantages
  • Simple structure, not easy to damage, stable operation, high volumetric efficiency, easy maintenance.
  • Unique cooling method to ensure the stability of the gas compression process, can meet the requirements of low exhaust temperature.
  • Uniform air flow with good stability and easy installation
  • Simple structure, not easy to damage, stable operation, high volumetric efficiency, easy maintenance.
Disadvantages
  • Low pump efficiency.
  • Short life, high price, screw pump stator using rubber material, easy to damage.
Star rotary mixer pumpAdvantages
  • Simplify crude oil gathering process and saves capital investment in oil and gas separation and transfer.
  • Reduces wellhead back pressure and increases production.
  • Small footprint and easy skid-mounting.
  • Automatic control, the protection function is perfect, realizes unattended and remote control.
  • The form of motion of the piston and cylinder by rolling friction instead of the traditional sliding friction, and has two high-pressure compression type functions to solve the existing technology of various compressors and pumps of low efficiency, energy consumption, can be used in the need for higher pressure occasions.
Disadvantages
  • Does not smoke gases containing weak corrosion
Table 6. Comparison of booster measure yield and EUR.
Serial NumberWell NumberBefore BoosterAfter PressurizationEUR
Incremental/108 m3
Abandoned Stratigraphic Pressure/MPaEUR/108 m3Abandoned Stratigraphic Pressure/MPaEUR/108 m3
1Xx H10 −23.031.21982.341.32310.1033
2Xx H10 −33.161.62692.431.63120.1043
Disclaimer/Publisher’s Note: The statements, opinions and data contained in all publications are solely those of the individual author(s) and contributor(s) and not of MDPI and/or the editor(s). MDPI and/or the editor(s) disclaim responsibility for any injury to people or property resulting from any ideas, methods, instructions or products referred to in the content.

