

Validation of the Ultra-Performance Liquid Chromatography with Tandem Mass Spectrometry Method for Simultaneous Analysis of Eighteen Compounds in the Traditional Herbal Prescription, Sanjoin-Tang


Abstract
:1. Introduction
2. Materials and Methods
2.1. Chemicals and Reagents
2.2. Plant Materials and Preparation of the SJIT Water Extract
2.3. Analytical Method for UPLC–MS/MS Analysis
2.4. Preparation of Standard Stock and Sample Solutions
2.5. Validation of the UPLC–MS/MS MRM Analytical Method
3. Results and Discussion
3.1. Selection of Target Marker Components for Simultaneous Analysis Using UPLC–MS/MS in SJIT Samples
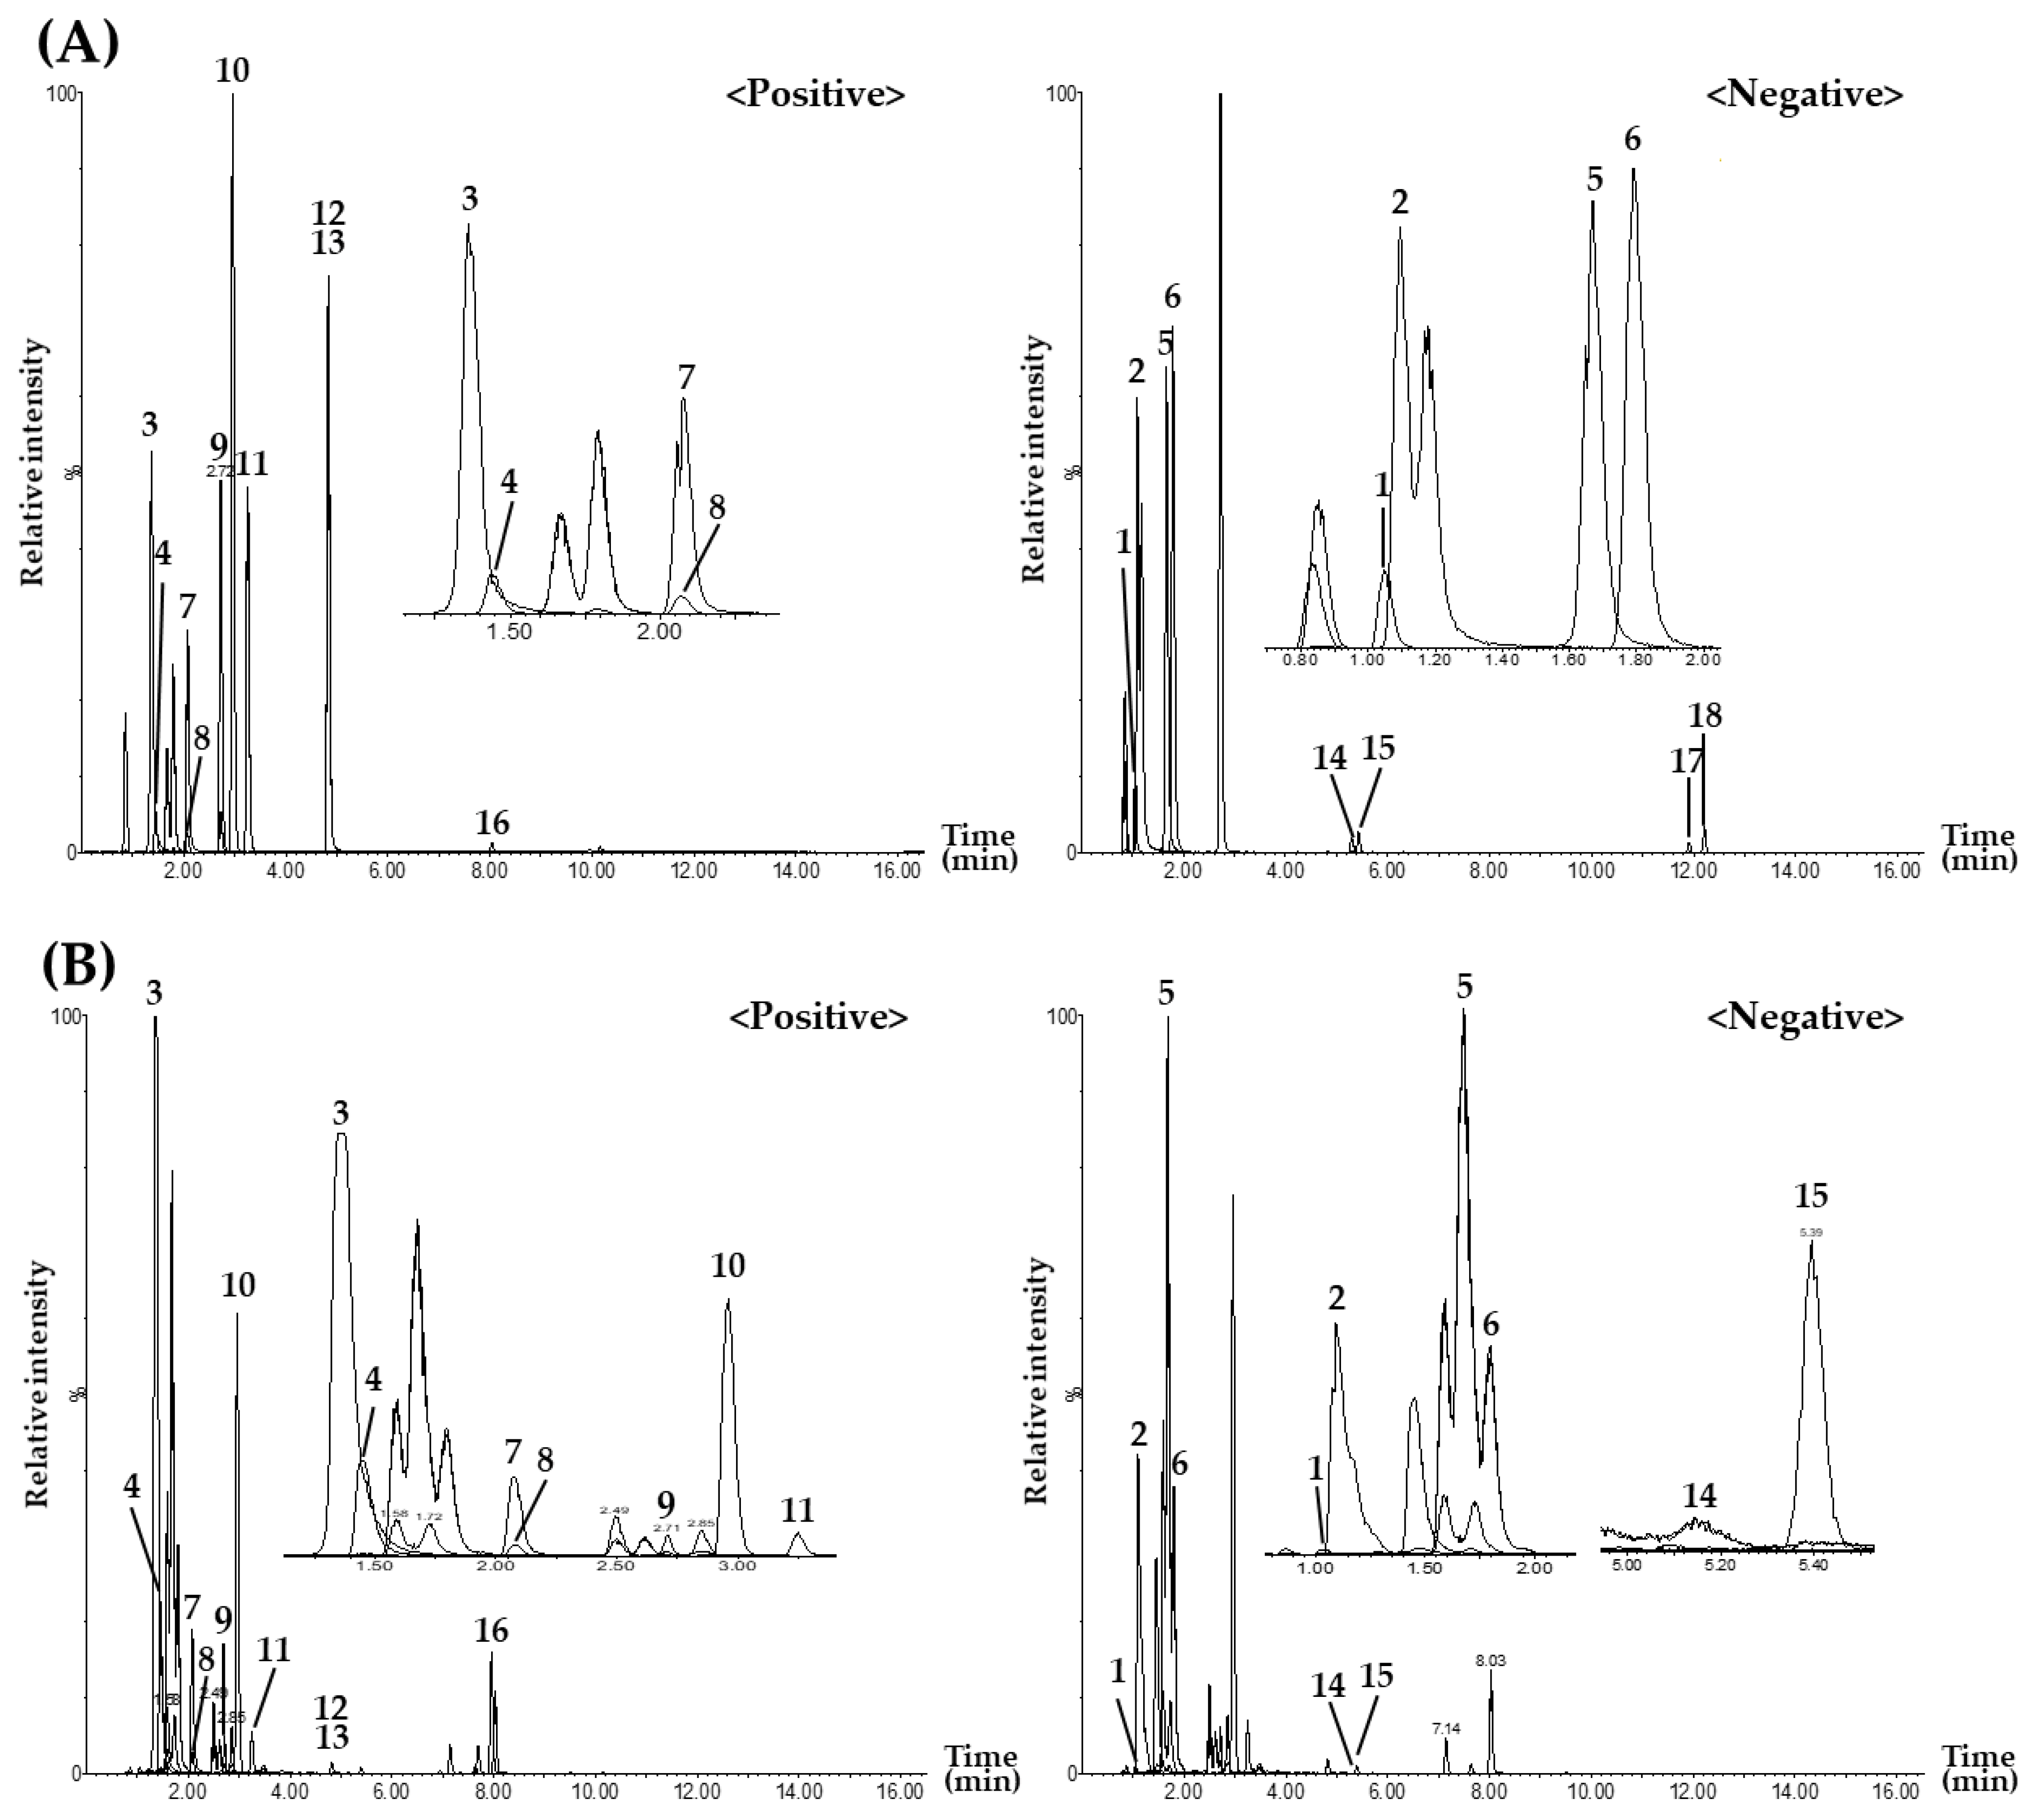
3.2. Multiple Reaction Monitoring Conditions for UPLC–MS/MS Analysis of SJIT Samples
3.3. Validation of the Developed UPLC–MS/MS MRM Analytical Method
3.4. Simultaneous Quantitation of the Eighteen Targets in SJIT Samples by the UPLC–MS/MS MRM Method
4. Conclusions
Supplementary Materials
Author Contributions
Funding
Institutional Review Board Statement
Informed Consent Statement
Data Availability Statement
Conflicts of Interest
References
- Yeh, C.H.; Arnold, C.K.; Chen, Y.H.; Lai, J.N. Suan zao ren tang as an original treatment for sleep difficulty in climacteric women: A prospective clinical observation. Evid.-Based Complement. Altern. Med. 2011, 2011, 673813. [Google Scholar] [CrossRef] [PubMed] [Green Version]
- Cao, J.X.; Zhang, Q.Y.; Cui, S.Y.; Cui, X.Y.; Zhang, J.; Zhang, Y.H.; Bai, Y.J.; Zhao, Y.Y. Hypnotic effect of jujubosides from Semen Ziziphi Spinosae. J. Ethnopharmacol. 2010, 130, 163–166. [Google Scholar] [CrossRef] [PubMed]
- Wu, H.C.; Chen, Y.H.; Lai, J.N.; Hwang, J.S.; Wang, J.D. Improving sleep quality in climacteric women with insomnia: A randomized, head-to-head trial between Jia-Wei-Shiau-Yau San (JWSYS) and Suan-Zao-Ren Tang (SZRT). Eur. J. Integr. Med. 2011, 3, 143–151. [Google Scholar] [CrossRef]
- Peng, W.H.; Hsieh, M.T.; Lee, Y.S.; Lin, Y.C.; Liao, J. Anxiolytic effect of seed of Ziziphus jujuba in mouse models of anxiety. J. Ethnopharmacol. 2000, 72, 435–441. [Google Scholar] [CrossRef] [PubMed]
- Park, J.H.; Lee, H.J.; Koh, S.B.; Ban, J.Y.; Seong, Y.H. Protection of NDMA-induced neuronal cell damage by methanol extract of Zizyphi Spinosi Semen in cultured rat cerebellar granule cells. J. Ethnopharmacol. 2004, 95, 39–45. [Google Scholar] [CrossRef]
- Kuang, X.; She, G.; Ma, T.; Cai, W.; Zhao, J.; Liu, B.; Xu, F. The pharmacology, pharmacokinetics, and toxicity of spinosin: A mini review. Front. Pharmacol. 2022, 13, 938395. [Google Scholar] [CrossRef]
- Hoffmann, K.M.; Beltrán, L.; Ziemba, P.M.; Hatt, H.; Gisselmann, G. Potentiating effect of glabridin from Glycyrrhiza glabra on GABAA receptors. Biochem. Biophys. Rep. 2016, 6, 197–202. [Google Scholar]
- Cho, S.M.; Shimizu, M.; Lee, C.J.; Han, D.S.; Jung, C.K.; Jo, J.H.; Kim, Y.M. Hypnotic effects and binding studies for GABAA and 5-HT2C receptors of traditional medicinal plants used in Asia for insomnia. J. Ethnopharmacol. 2010, 132, 225–232. [Google Scholar] [CrossRef]
- Shah, V.K.; Choi, J.J.; Han, J.Y.; Lee, M.K.; Hong, J.T.; Oh, K.W. Pachymic acid enhances pentobarbital-induced sleeping behaviors via GABAA-ergic systems in mice. Biomol. Ther. 2014, 22, 314–320. [Google Scholar] [CrossRef] [Green Version]
- Kim, H.; Park, I.; Park, K.; Park, S.; Kim, Y.I.; Park, B.G. The positive effects of Poria cocos extract on quality of sleep in insomnia rat models. Int. J. Environ. Res. Public Health 2022, 19, 6629. [Google Scholar] [CrossRef]
- Lee, S.Y.; Lee, J.Y.; Kim, J.S.; Lee, J.H.; Kang, S.S. Flavonoids from the seeds of Zizyphus jujuba var. spinosa. Korean J. Pharmacogn. 2012, 43, 127–136. [Google Scholar]
- Yang, Y.N.; Liu, Y.Y.; Feng, Z.M.; Jiang, J.S.; Zhang, P.C. Seven new flavonoid glycosides from the roots of Glycyrrhiza uralensis and their biological activities. Carbohydr. Res. 2019, 485, 107820. [Google Scholar] [CrossRef] [PubMed]
- Li, L.M.; Liao, X.; Peng, S.L.; Ding, L.S. Chemical constituents from the seeds of Ziziphus jujuba var. spinosa (Bunge) Hu. J. Intergr. Plant Biol. 2005, 47, 494–498. [Google Scholar] [CrossRef]
- Li, G.; Xu, M.L.; Lee, C.S.; Woo, M.H.; Chang, H.W.; Son, J.K. Cytotoxicity and DNA topoisomerases inhibitory activity of constituents form the sclerotium of Poria cocos. Arch. Pharm. Res. 2004, 27, 829–833. [Google Scholar] [CrossRef]
- Liu, Y.Y.; Yang, Y.N.; Feng, Z.M.; Jiang, J.S.; Zhang, P.C. Eight new triterpenoid saponins with antioxicant activity from the roots of Glycyrrhaiza uralensis Fisch. Fitoterapia 2019, 133, 186–192. [Google Scholar] [CrossRef] [PubMed]
- Bae, K.E.; Choi, Y.W.; Kim, S.T.; Kim, Y.K. Components of rhizome extract of Cnidium officinale Makino and their in vitro biological effects. Molecules 2011, 16, 8833–8847. [Google Scholar] [CrossRef] [PubMed] [Green Version]
- Baek, M.E.; Seong, G.U.; Lee, Y.J.; Won, J.H. Quantitative analysis for the quality evaluation of active ingredients in Cnidium Rhizome. Yakhak Hoeji 2016, 60, 227–234. [Google Scholar] [CrossRef]
- Xu, L.; Li, A.; Sun, A.; Liu, R. Preparative isolation of neomangiferin and mangiferin form Rhizoma Anemarrhenae by high-speed countercurrent chromatography using ionic liquids as a two-phase solvent system modifier. J. Sep. Sci. 2010, 33, 31–36. [Google Scholar] [CrossRef]
- Yang, B.Y.; Zhang, J.; Liu, Y.; Kuang, H.X. Steroidal saponins from the Rhizomes of Anemarrhena asphodeloides. Molecules 2016, 21, 1075. [Google Scholar] [CrossRef] [Green Version]
- Kim, W.I.; Zhao, B.T.; Zhang, H.Y.; Lee, J.H.; Son, J.K.; Woo, M.H. Quantitative and pattern recognition analyses of magnoflorine, spinosyn, 6‴-feruloyl spinosyn and jujuboside A by HPLC in Zizyphi Semen. Arch. Pharm. Res. 2014, 37, 1139–1147. [Google Scholar] [CrossRef] [Green Version]
- Niu, C.; Zhang, J. Quantitative analysis and chromatographic fingerprinting of the semen zizyphi spinosae by ultra-high-performance liquid chromatography coupled with diode-array detector. J. Sep. Sci. 2011, 34, 2989–2996. [Google Scholar] [CrossRef] [PubMed]
- Seo, C.S.; Ha, H.; Kim, Y.J.; Jung, J.Y. HPLC–PDA simultaneous determination and protective effect of Anemarrhena asphodeloides against acute renal failure. Nat. Prod. Commun. 2014, 9, 829–832. [Google Scholar] [CrossRef] [PubMed]
- Peng, Y.; Zhao, L.; Lin, D.; Liu, Y.; Zhang, M.; Song, S.J. Determination of the chemical constituents of the different processed products of Anemarrhena asphodeloides Rhzomes by high-performance liquid chromatography quadrupole time-of-flight mass spectrometry. Biomed. Chromatogr. 2016, 30, 508–519. [Google Scholar] [CrossRef]
- Wu, L.F.; Wang, K.F.; Mao, X.; Liang, W.Y.; Chen, W.J.; Li, S.; Qi, Q.; Cui, Y.P.; Zhang, L.Z. Screening and analysis of the potential bioactive components of Poria cocos (Schw.) Wolf by HPLC and HPLC–MSn with the aid of chemometrics. Molecules 2016, 21, 227. [Google Scholar] [CrossRef] [PubMed] [Green Version]
- Zhou, S.; Cao, J.; Qiu, F.; Kong, W.; Yang, S.; Yang, M. Simultaneous determination of five bioactive components in Radix Glycyrrhizae by pressurized liquid extraction combined with UPLC–PDA and UPLC/ESI–QTOF–MS confirmation. Phytochem. Anal. 2013, 24, 527–533. [Google Scholar] [CrossRef] [PubMed]
- Wu, Y.P.; Meng, X.S.; Bao, Y.R.; Wang, S.; Kang, T.G. Simultaneous quantitative determination of nine active chemical compositions in traditional Chinese medicine Glycyrrhiza by RP–HPLC with full-time five-wavelength fusion method. Am. J. Chin. Med. 2013, 41, 211–219. [Google Scholar] [CrossRef] [PubMed]
- Zhu, Y.; Chen, L.; Gong, J.; Wang, S. Identification of constituents in Suanzaoren tang by LC-Q-TOF-MS and LC-IT-MS. China J. Chin. Mater. Medica 2014, 39, 457–465. [Google Scholar]
- Pang, B.; Zhu, Y.; Lu, L.; Gu, F.; Chen, H. The applications and features of liquid chromatography-mass spectrometry in the analysis of traditional Chinese medicine. Evid.-Based Complement. Altern. Med. 2016, 2016, 3837270. [Google Scholar] [CrossRef] [Green Version]
- Wang, X.; Zhang, A.; Yan, G.; Han, Y.; Sun, H. UHPLC-MS for the analytical characterization of traditional Chinese medicines. Trends Anal. Chem. 2014, 63, 180–187. [Google Scholar] [CrossRef]
- International Conference on Harmonisation (ICH). Guidance for Industry, Q2B, Validation of Analytical Procedures: Methodology; Food and Drug Administration: Rockville, MD, USA, November 1996.
- Ma, C.; Wang, L.; Tang, Y.; Fan, M.; Xiao, H.; Huang, C. Identification of major xanthones and steroidal saponins in rat urine by liquid chromatography–atmospheric pressure chemical ionization mass spectrometry technology following oral administration of Rhizoma Anemarrhenae decoction. Biomed. Chromatogr. 2008, 22, 1066–1083. [Google Scholar] [CrossRef]
- Zhang, Y.Y.; Wang, Q.; Qi, L.W.; Qin, X.Y.; Qin, M.J. Characterization and determination of the major constituents in Belamcandae Rhizoma by HPLC–DAD–ESI–MSn. J. Pharm. Biomed. Anal. 2011, 56, 304–311. [Google Scholar] [CrossRef] [PubMed]
- Seo, C.S.; Shin, H.K. Liquid chromatography tandem mass spectrometry for the simultaneous quantification of eleven phytochemical constituents in traditional Korean medicine, Sogunjung decoction. Processes 2021, 9, 153. [Google Scholar] [CrossRef]
- Yan, Y.; Liu, J.; Zhang, M.; Zhang, Y.; Shi, B.; Qin, X.; Du, C. A strategy to explore the quality markers of Ziziphi Spinosae semen by combining metabolic in vivo study with network pharmacology. Biomed. Chromatogr. 2023, 37, e5530. [Google Scholar] [CrossRef] [PubMed]
- Xiao, H.B.; Krucker, M.; Albert, K.; Liang, X.M. Determination and identification of isoflavnolids in Radix astragali by matrix solid-phase dispersion extraction and high-performance liquid chromatography with photodiode array and mass spectrometric detection. J. Chromatogr. A 2004, 1032, 117–124. [Google Scholar] [CrossRef] [PubMed]
- Chen, L.; Qi, J.; Chang, Y.; Zhu, D.; Yu, B. Identification and determination of the major constituents in traditional Chinese medicinal formula Danggui-Shaoyao-San by HPLC–DAD–ESI–MS/MS. J. Pharm. Biomed. Anal. 2009, 50, 127–137. [Google Scholar] [CrossRef]
- Li, Z.; Wen, R.; Du, Y.; Zhao, S.; Zhao, P.; Jiang, H.; Rong, R.; Lv, Q. Simultaneous quantification of fifteen compounds in rat plasma by LC-MS/MS and its application to a pharmacokinetic study of Chaihu-Guizhi decoction. J. Chromatogr. B 2019, 1105, 15–25. [Google Scholar] [CrossRef]
- Zhang, Y.; Xie, J.; Zhang, Y.; Zhang, M. Degradation kinetics of jujuboside A by rat intestinal flora and identification of the metabolites by HPLC-MS/MS. Int. J. Food Prop. 2014, 17, 1841–1849. [Google Scholar] [CrossRef] [Green Version]
- Meng, X.; Li, H.; Song, F.; Liu, C.; Liu, Z.; Liu, S. Studies on triterpenoids and flavones in Glycyrrhiza uralensis Fisch. By HPLC-ESI-MSn and FT-ICR-MSn. Chin. J. Chem. 2009, 27, 299–305. [Google Scholar] [CrossRef]
- Liu, X.; Zhu, X.; Zhu, H.; Xie, L.; Ma, J.; Xu, Y.; Zhou, Q.; Wu, Z.; Cai, B. Simultaneous quantification of six bioactive components in decoction of Ziziphi spinosae semen using ultrahigh performance liquid chromatography coupled with triple-quadrupole mass spectrometry. J. Anal. Methods Chem. 2018, 2018, 8397818. [Google Scholar] [CrossRef]
- Li, J.; Wang, H.; Liu, J.; Du, C.; Yan, Y. Quality evaluation of Suanzaoren decoction by integrating fingerprint and quantitative analysis of multi-component. Chin. Tradit. Herb. Drugs 2022, 53, 4698–4708. [Google Scholar]
- Miyaoka, T.; Kawano, K.; Furuya, M.; Wake, R.; Hashioka, S.; Liaury, K.; Limoa, E.; Tsuchie, K.; Fukushima, M.; Araki, T.; et al. Efficay and safety of Sansoninto in insomnia with psychiatric disorder: An open-label study. Altern. Integr. Med. 2015, 4, 181. [Google Scholar] [CrossRef]


| Analyte 1 | Ion Mode | Molecular Weight | Precursor Ion | Product Ion | Cone Voltage (V) | Collision Energy (eV) |
|---|---|---|---|---|---|---|
| 1 | − | 584.5 | 583.3 [M−H]− | 331.0 | 45 | 35 |
| 2 | − | 422.3 | 421.1 [M−H]− | 301.0 | 30 | 20 |
| 3 | + | 342.4 | 342.4 [M]+ | 297.2 | 30 | 20 |
| 4 | + | 608.5 | 609.5 [M+H]+ | 327.2 | 40 | 25 |
| 5 | − | 550.5 | 549.3 [M−H]− | 255.0 | 45 | 30 |
| 6 | − | 418.4 | 417.4 [M−H]− | 255.2 | 30 | 15 |
| 7 | + | 194.2 | 195.0 [M+H]+ | 177.0 | 15 | 10 |
| 8 | + | 784.7 | 785.5 [M+H]+ | 327.1 | 35 | 25 |
| 9 | + | 418.4 | 419.3 [M+H]+ | 257.0 | 35 | 15 |
| 10 | + | 430.4 | 431.3 [M+H]+ | 269.0 | 25 | 15 |
| 11 | + | 256.3 | 257.2 [M+H]+ | 137.0 | 35 | 25 |
| 12 | + | 1207.3 | 1225.1 [M+H2O]+ | 473.5 | 30 | 20 |
| 13 | + | 256.3 | 257.2 [M+H]+ | 137.0 | 15 | 20 |
| 14 | − | 822.9 | 821.9 [M−H]− | 351.2 | 45 | 40 |
| 15 | − | 1045.2 | 1043.8 [M−H]− | 911.5 | 30 | 35 |
| 16 | + | 190.1 | 191.0 [M+H]+ | 91.0 | 30 | 25 |
| 17 | − | 526.7 | 525.7 [M−H]− | 59.0 | 30 | 35 |
| 18 | − | 528.8 | 527.6 [M−H]− | 465.4 | 45 | 35 |
| Analyte 1 | Retention Time (min) | Linear Range (μg/L) | Regression Equation 2 y = ax + b | r2 | LOD (μg/L) | LOQ (μg/L) |
|---|---|---|---|---|---|---|
| 1 | 1.06 | 10.00–500.00 | y = 296.00x + 3082.84 | 0.9992 | 0.071 | 0.213 |
| 2 | 1.08 | 10.00–500.00 | y = 1550.26x + 24,896.50 | 0.9980 | 0.058 | 0.174 |
| 3 | 1.35 | 10.00–500.00 | y = 23,534.20x + 432,415.00 | 0.9996 | 0.011 | 0.032 |
| 4 | 1.45 | 10.00–500.00 | y = 2543.55x − 4216.33 | 0.9968 | 0.017 | 0.050 |
| 5 | 1.65 | 10.00–500.00 | y = 2188.31x + 13,166.60 | 0.9993 | 0.073 | 0.218 |
| 6 | 1.79 | 10.00–500.00 | y = 3298.34x + 23772.50 | 0.9992 | 0.010 | 0.030 |
| 7 | 2.06 | 10.00–500.00 | y = 11,957.40x + 44,248.70 | 0.9988 | 0.075 | 0.224 |
| 8 | 2.07 | 10.00–500.00 | y = 1041.87x + 3654.02 | 0.9989 | 0.118 | 0.353 |
| 9 | 2.69 | 10.00–500.00 | y = 19,090.10x + 157,649.00 | 0.9991 | 0.028 | 0.083 |
| 10 | 2.92 | 10.00–500.00 | y = 37,870.70x + 471,200.00 | 0.9990 | 0.002 | 0.005 |
| 11 | 3.25 | 10.00–500.00 | y = 19,416.40x + 221,079.00 | 0.9994 | 0.015 | 0.045 |
| 12 | 4.83 | 250.00–5000.00 | y = 0.30x − 49.79 | 0.9978 | 11.825 | 35.474 |
| 13 | 4.83 | 10.00–500.00 | y = 28,495.50x + 368,896.00 | 0.9992 | 0.008 | 0.024 |
| 14 | 5.26 | 10.00–500.00 | y = 71.87x + 65.45 | 0.9985 | 0.975 | 2.925 |
| 15 | 5.42 | 10.00–500.00 | y = 78.53x + 378.80 | 0.9989 | 2.148 | 6.444 |
| 16 | 8.04 | 10.00–500.00 | y = 609.03x + 5526.79 | 0.9991 | 6.276 | 18.827 |
| 17 | 11.91 | 10.00–500.00 | y = 44.84x + 99.89 | 0.9985 | 1.207 | 3.622 |
| 18 | 12.21 | 10.00–500.00 | y = 109.76x + 523.95 | 0.9980 | 1.582 | 4.747 |
| Analyte 1 | Spiked Amount (μg/L) | Found Amount (μg/L) | Recovery (%) | SD 2 | RSD (%) |
|---|---|---|---|---|---|
| 1 | 40.00 | 37.15 | 92.86 | 8.87 | 9.55 |
| 80.00 | 81.21 | 101.52 | 4.82 | 4.75 | |
| 160.00 | 168.60 | 105.37 | 4.70 | 4.46 | |
| 2 | 120.00 | 119.47 | 99.56 | 4.22 | 4.24 |
| 240.00 | 250.58 | 104.41 | 8.73 | 8.36 | |
| 480.00 | 525.41 | 109.46 | 6.23 | 5.69 | |
| 3 | 40.00 | 38.28 | 95.71 | 6.98 | 7.30 |
| 80.00 | 82.12 | 102.65 | 6.59 | 6.42 | |
| 160.00 | 170.78 | 106.74 | 4.11 | 3.85 | |
| 4 | 40.00 | 39.64 | 99.10 | 9.13 | 9.21 |
| 80.00 | 89.88 | 112.35 | 7.36 | 6.55 | |
| 160.00 | 172.27 | 107.67 | 7.90 | 7.34 | |
| 5 | 80.00 | 80.70 | 100.88 | 1.17 | 1.16 |
| 160.00 | 170.10 | 106.31 | 1.85 | 1.74 | |
| 320.00 | 344.46 | 107.65 | 4.54 | 4.22 | |
| 6 | 80.00 | 78.89 | 98.61 | 3.32 | 3.36 |
| 160.00 | 169.20 | 105.75 | 2.88 | 2.72 | |
| 320.00 | 343.38 | 107.31 | 3.80 | 3.54 | |
| 7 | 10.00 | 9.78 | 97.81 | 6.26 | 6.40 |
| 20.00 | 20.73 | 103.63 | 7.33 | 7.08 | |
| 40.00 | 42.51 | 106.28 | 4.34 | 4.09 | |
| 8 | 8.00 | 8.16 | 102.06 | 6.69 | 6.55 |
| 16.00 | 17.12 | 106.99 | 0.94 | 0.88 | |
| 32.00 | 33.49 | 104.65 | 4.54 | 4.34 | |
| 9 | 80.00 | 82.71 | 103.39 | 2.56 | 2.48 |
| 160.00 | 168.82 | 105.51 | 1.83 | 1.73 | |
| 320.00 | 333.96 | 104.36 | 1.86 | 1.78 | |
| 10 | 4.00 | 3.94 | 98.60 | 5.32 | 5.39 |
| 8.00 | 8.18 | 102.19 | 3.49 | 3.42 | |
| 16.00 | 16.43 | 102.71 | 2.89 | 2.81 | |
| 11 | 80.00 | 78.72 | 98.39 | 3.91 | 3.98 |
| 160.00 | 162.03 | 101.27 | 3.91 | 3.86 | |
| 320.00 | 332.91 | 104.03 | 3.93 | 3.78 | |
| 12 | 600.00 | 526.21 | 87.70 | 8.04 | 9.16 |
| 1200.00 | 1200.96 | 100.08 | 9.37 | 9.36 | |
| 2400.00 | 2741.03 | 114.21 | 4.83 | 4.23 | |
| 13 | 20.00 | 20.28 | 101.42 | 1.56 | 1.54 |
| 40.00 | 40.46 | 101.16 | 1.62 | 1.60 | |
| 80.00 | 79.62 | 99.52 | 4.00 | 4.02 | |
| 14 | 200.00 | 191.87 | 95.94 | 3.62 | 3.78 |
| 400.00 | 399.28 | 99.82 | 4.39 | 4.39 | |
| 800.00 | 828.35 | 103.54 | 5.10 | 4.93 | |
| 15 | 100.00 | 109.39 | 109.39 | 6.00 | 5.48 |
| 200.00 | 211.04 | 105.52 | 6.13 | 5.81 | |
| 400.00 | 396.60 | 99.15 | 4.10 | 4.13 | |
| 16 | 80.00 | 84.39 | 105.49 | 2.99 | 2.84 |
| 160.00 | 171.35 | 107.10 | 3.93 | 3.67 | |
| 320.00 | 337.40 | 105.44 | 4.00 | 3.80 | |
| 17 | 20.00 | 17.05 | 85.26 | 8.02 | 9.41 |
| 40.00 | 41.81 | 104.54 | 6.59 | 6.30 | |
| 80.00 | 87.37 | 109.21 | 4.01 | 3.67 | |
| 18 | 20.00 | 18.54 | 92.72 | 8.45 | 9.11 |
| 40.00 | 41.77 | 104.43 | 1.55 | 1.49 | |
| 80.00 | 85.50 | 106.88 | 7.62 | 7.13 |
| Analyte 1 | Conc. (μg/L) | Intraday (n = 5) | Interday (n = 5) | Repeatability (n = 6) | |||||
|---|---|---|---|---|---|---|---|---|---|
| Observed Conc. (μg/L) | Precision (RSD, %) | Accuracy (%) | Observed Conc. (μg/L) | Precision (RSD, %) | Accuracy (%) | RSD (%) of Retention Time | RSD (%) of Peak Area | ||
| 1 | 40.00 | 39.57 | 3.67 | 98.93 | 39.20 | 7.08 | 97.88 | 1.67 | 3.94 |
| 80.00 | 82.34 | 4.32 | 102.93 | 84.10 | 4.29 | 105.17 | |||
| 160.00 | 174.14 | 5.00 | 108.84 | 175.40 | 4.44 | 109.61 | |||
| 2 | 120.00 | 122.09 | 5.22 | 101.74 | 119.90 | 6.09 | 99.92 | 1.82 | 8.05 |
| 240.00 | 263.26 | 4.93 | 109.69 | 259.70 | 6.08 | 108.21 | |||
| 480.00 | 522.62 | 4.86 | 108.88 | 526.20 | 4.96 | 109.62 | |||
| 3 | 40.00 | 37.43 | 7.34 | 93.58 | 38.60 | 7.13 | 96.49 | 1.21 | 4.17 |
| 80.00 | 85.02 | 5.89 | 106.28 | 86.10 | 5.68 | 107.58 | |||
| 160.00 | 170.04 | 5.65 | 106.27 | 175.30 | 4.21 | 109.55 | |||
| 4 | 40.00 | 36.00 | 8.20 | 90.01 | 39.00 | 7.54 | 97.55 | 1.15 | 8.73 |
| 80.00 | 77.88 | 6.15 | 97.35 | 87.50 | 4.57 | 109.36 | |||
| 160.00 | 153.80 | 8.73 | 96.12 | 170.90 | 5.81 | 106.80 | |||
| 5 | 80.00 | 79.53 | 3.95 | 99.41 | 79.40 | 3.19 | 99.26 | 1.31 | 4.24 |
| 160.00 | 169.62 | 2.78 | 106.01 | 167.50 | 2.21 | 104.67 | |||
| 320.00 | 340.06 | 3.41 | 106.27 | 338.70 | 3.28 | 105.83 | |||
| 6 | 80.00 | 78.11 | 3.19 | 97.64 | 79.57 | 3.91 | 99.46 | 1.14 | 6.01 |
| 160.00 | 169.50 | 2.34 | 105.94 | 170.58 | 2.11 | 106.61 | |||
| 320.00 | 341.85 | 1.95 | 106.83 | 342.48 | 3.20 | 107.02 | |||
| 7 | 10.00 | 9.53 | 5.30 | 95.33 | 9.80 | 5.33 | 98.34 | 1.43 | 4.75 |
| 20.00 | 19.96 | 8.27 | 99.80 | 20.20 | 6.50 | 101.18 | |||
| 40.00 | 39.47 | 5.70 | 98.67 | 40.60 | 6.01 | 101.52 | |||
| 8 | 8.00 | 7.74 | 3.98 | 96.76 | 8.10 | 4.69 | 100.96 | 1.15 | 7.87 |
| 16.00 | 16.36 | 3.10 | 102.26 | 16.60 | 2.39 | 104.02 | |||
| 32.00 | 33.04 | 3.71 | 103.24 | 33.40 | 3.06 | 104.37 | |||
| 9 | 80.00 | 77.81 | 3.24 | 97.27 | 73.90 | 4.70 | 92.42 | 1.09 | 3.85 |
| 160.00 | 172.29 | 0.69 | 107.68 | 164.60 | 3.78 | 102.86 | |||
| 320.00 | 329.53 | 2.64 | 102.98 | 328.30 | 3.92 | 102.61 | |||
| 10 | 4.00 | 4.05 | 3.53 | 101.33 | 4.00 | 4.52 | 99.07 | 1.13 | 4.45 |
| 8.00 | 8.28 | 3.72 | 103.54 | 8.20 | 2.98 | 102.27 | |||
| 16.00 | 16.55 | 2.51 | 103.43 | 16.70 | 2.44 | 104.21 | |||
| 11 | 80.00 | 81.95 | 0.86 | 102.44 | 81.00 | 2.45 | 101.25 | 1.11 | 5.74 |
| 160.00 | 166.62 | 2.54 | 104.14 | 164.10 | 3.99 | 102.53 | |||
| 320.00 | 333.34 | 3.16 | 104.17 | 329.80 | 3.98 | 103.07 | |||
| 12 | 600.00 | 618.67 | 9.71 | 103.11 | 540.90 | 9.24 | 90.15 | 0.83 | 7.52 |
| 1200.00 | 1245.69 | 3.77 | 103.81 | 1232.90 | 7.54 | 102.74 | |||
| 2400.00 | 1958.18 | 7.55 | 81.59 | 2441.50 | 7.09 | 101.73 | |||
| 13 | 20.00 | 19.76 | 3.33 | 98.80 | 19.90 | 2.71 | 99.45 | 0.92 | 1.10 |
| 40.00 | 41.96 | 1.84 | 104.90 | 41.60 | 2.53 | 104.11 | |||
| 80.00 | 82.51 | 3.05 | 103.14 | 82.20 | 3.66 | 102.77 | |||
| 14 | 200.00 | 208.51 | 2.10 | 104.25 | 199.40 | 2.49 | 99.72 | 0.72 | 4.48 |
| 400.00 | 442.18 | 2.55 | 110.55 | 414.30 | 3.79 | 103.56 | |||
| 800.00 | 898.90 | 3.48 | 112.36 | 835.60 | 3.64 | 104.45 | |||
| 15 | 100.00 | 103.36 | 9.94 | 103.36 | 74.60 | 7.08 | 100.76 | 0.73 | 6.57 |
| 200.00 | 205.13 | 6.23 | 102.56 | 150.10 | 6.60 | 103.41 | |||
| 400.00 | 441.67 | 1.12 | 110.42 | 301.40 | 3.68 | 103.52 | |||
| 16 | 80.00 | 84.93 | 4.79 | 106.17 | 82.40 | 3.66 | 102.97 | 0.82 | 3.54 |
| 160.00 | 175.47 | 4.59 | 109.67 | 169.70 | 3.50 | 106.06 | |||
| 320.00 | 332.33 | 1.46 | 103.85 | 333.20 | 2.52 | 104.12 | |||
| 17 | 20.00 | 18.50 | 8.46 | 92.51 | 18.00 | 8.96 | 90.09 | 0.46 | 4.85 |
| 40.00 | 44.91 | 3.44 | 112.28 | 43.00 | 5.52 | 107.60 | |||
| 80.00 | 84.25 | 8.21 | 105.32 | 87.20 | 5.35 | 108.99 | |||
| 18 | 20.00 | 21.47 | 3.57 | 107.34 | 20.30 | 5.72 | 101.47 | 0.45 | 8.15 |
| 40.00 | 42.54 | 3.67 | 106.36 | 41.90 | 3.42 | 104.73 | |||
| 80.00 | 82.83 | 6.02 | 103.54 | 83.40 | 5.88 | 104.22 | |||
| Analyte 1 | SJIT–1 2 | SJIT–2 | SJIT–3 | SJIT–4 | ||||
|---|---|---|---|---|---|---|---|---|
| Mean (mg/g) | RSD (%) | Mean (mg/g) | RSD (%) | Mean (mg/g) | RSD (%) | Mean (mg/g) | RSD (%) | |
| 1 | 2.265 | 4.687 | 0.043 | 5.906 | 0.648 | 7.163 | 0.406 | 4.768 |
| 2 | 9.553 | 2.823 | 0.087 | 3.694 | 0.510 | 0.486 | 3.751 | 5.533 |
| 3 | 2.885 | 0.539 | 0.096 | 7.088 | 0.100 | 1.462 | 1.128 | 5.727 |
| 4 | 1.481 | 1.204 | 0.218 | 4.676 | 0.053 | 4.677 | 0.368 | 2.905 |
| 5 | 3.368 | 3.073 | 0.260 | 1.309 | 0.246 | 0.470 | 0.960 | 2.167 |
| 6 | 0.911 | 1.188 | 0.062 | 6.332 | 0.032 | 2.652 | 0.055 | 8.212 |
| 7 | 0.429 | 1.702 | 0.015 | 6.049 | 0.037 | 4.512 | 0.226 | 6.107 |
| 8 | 0.412 | 1.693 | 0.076 | 6.829 | 0.023 | 3.091 | 0.216 | 3.549 |
| 9 | 0.016 | 4.267 | 0.007 | 5.049 | 0.005 | 6.585 | 0.061 | 9.730 |
| 10 | 0.325 | 3.114 | 0.048 | 5.819 | 0.027 | 0.911 | 0.052 | 5.128 |
| 11 | 0.035 | 3.444 | 0.002 | 6.671 | 0.001 | 0.886 | 0.173 | 0.323 |
| 12 | 0.162 | 4.013 | ND | − | ND | − | 0.140 | 4.147 |
| 13 | 0.006 | 5.085 | 0.002 | 3.399 | ND | − | 0.032 | 2.157 |
| 14 | 9.084 | 1.003 | 1.097 | 9.726 | 0.816 | 2.173 | 2.564 | 2.621 |
| 15 | 0.050 | 7.549 | ND | − | 0.007 | 7.890 | 0.077 | 2.755 |
| 16 | 2.962 | 4.361 | ND | − | 0.174 | 0.651 | 2.019 | 1.653 |
| 17 | ND 3 | − | ND | − | ND | − | 0.030 | 3.253 |
| 18 | ND | − | ND | − | 0.001 | 4.623 | 0.080 | 5.340 |
Disclaimer/Publisher’s Note: The statements, opinions and data contained in all publications are solely those of the individual author(s) and contributor(s) and not of MDPI and/or the editor(s). MDPI and/or the editor(s) disclaim responsibility for any injury to people or property resulting from any ideas, methods, instructions or products referred to in the content. |
© 2023 by the authors. Licensee MDPI, Basel, Switzerland. This article is an open access article distributed under the terms and conditions of the Creative Commons Attribution (CC BY) license (https://creativecommons.org/licenses/by/4.0/).
Share and Cite
Seo, C.-S.; Shin, H.-K. Validation of the Ultra-Performance Liquid Chromatography with Tandem Mass Spectrometry Method for Simultaneous Analysis of Eighteen Compounds in the Traditional Herbal Prescription, Sanjoin-Tang. Separations 2023, 10, 411. https://doi.org/10.3390/separations10070411
Seo C-S, Shin H-K. Validation of the Ultra-Performance Liquid Chromatography with Tandem Mass Spectrometry Method for Simultaneous Analysis of Eighteen Compounds in the Traditional Herbal Prescription, Sanjoin-Tang. Separations. 2023; 10(7):411. https://doi.org/10.3390/separations10070411
Chicago/Turabian StyleSeo, Chang-Seob, and Hyeun-Kyoo Shin. 2023. "Validation of the Ultra-Performance Liquid Chromatography with Tandem Mass Spectrometry Method for Simultaneous Analysis of Eighteen Compounds in the Traditional Herbal Prescription, Sanjoin-Tang" Separations 10, no. 7: 411. https://doi.org/10.3390/separations10070411