Article

A One-Step Sample Processing Method in Combination with HPLC-MS/MS for the Simultaneous Quantification of Atorvastatin, Ezetimibe and Three Metabolites including o-Hydroxyl Atorvastatin, p-Hydroxyl Atorvastatin, and Ezetimibe-Glucuronide in Human Plasma

by
T. Nguyen Nguyen Le
1,
Nai Ngoc Chuong
1 and
Tuan Duc Nguyen
2,*
1
BA/BE Test Center, Institute of Drug Quality Control Ho Chi Minh City, Ho Chi Minh City 700000, Vietnam
2
Faculty of Pharmacy, University of Medicine and Pharmacy at Ho Chi Minh City, Ho Chi Minh City 700000, Vietnam
*
Author to whom correspondence should be addressed.
Separations 2023, 10(7), 409; https://doi.org/10.3390/separations10070409
Submission received: 16 June 2023 / Revised: 10 July 2023 / Accepted: 11 July 2023 / Published: 17 July 2023

Abstract

:
A simple and sensitive liquid chromatography–tandem mass spectrometry (LC-MS/MS) method has been developed for the simultaneous determination of atorvastatin (ATOR), ezetimibe (EZM), and their three metabolites, including o-hydroxyl atorvastatin (o-OH ATOR), p-hydroxyl atorvastatin (p-OH ATOR), and ezetimibe–glucuronide (EZM-G) in human plasma using benzyl paraben (BP) as the internal standard (IS). The analytes and IS were ionized using ESI positive ion mode (ATOR, o-OH ATOR, and p-OH ATOR), ESI negative ion mode (EZM, EZM-G, and BP), and operated in multiple reaction monitoring (MRM) mode. They were then extracted via salting-out assisted liquid–liquid extraction with acetonitrile and analyzed via liquid chromatography on a reversed-phase chromatographic column (50 mm × 4.6 mm; 3.5 µm) using a mixture of acetonitrile and an acetic acid solution (0.5%) as the mobile phase, showing high extraction efficiency (>70%), and a minimized matrix effect. The method was satisfactorily validated, and it showed excellent linearity over wide concentration ranges of 0.06–15 ng/mL, 0.6–150 ng/mL, 0.4–100 ng/mL, 0.12–30 ng/mL, and 0.05–3 ng/mL for EZM, EZM-G, ATOR, o-OH ATOR, and p-OH ATOR, respectively.

Graphical Abstract

1. Introduction

According to the American College of Cardiology/American Heart Association (ACC/AHA)’s 2018 Guidelines on the Management of Blood Cholesterol, statin therapy is the preferred choice of drugs used to treat hypercholesterolemia. However, in patients who have not achieved their LDL-C goal despite maximal statin therapy or who are at high cardiovascular risk, ezetimibe is the first choice, albeit in combination with a statin [1]. To ensure convenience, a fixed-dose combination (FDC) of statins and ezetimibe has been marketed.
Atorvastatin, which is a second-generation statin, is a synthetic inhibitor of HMG-CoA reductase that affects endogenous cholesterol synthesis and, subsequently, increases the expression of the LDL receptor. This process results in an upregulated catabolic rate for LDL-cholesterol. In the human body, atorvastatin is metabolized by the enzyme CYP3A4 to two create active acidic metabolites, namely o-OH ATOR and p-OH ATOR. Additionally, all parent drug and active acidic metabolites were reversibly metabolized and became inactive lactonized forms [2]. In order to evaluate the bioequivalence of atorvastatin products, according to the FDA, all parent compounds and active metabolites in human plasma must be analyzed [3].
Up to 2022, ezetimibe has held the distinction of being the first and, currently, only marketed inhibitor of intestinal uptake of dietary and biliary cholesterol. Its most important advantage is that ezetimibe reduces the absorbed cholesterol without affecting the absorption of fat-soluble nutrients. Following oral administration, in the intestines, ezetimibe is extensively metabolized (>80%) to EZM-G. Both EZM and EZM-G are rapidly absorbed and show similar bioactivity [4]. Therefore, to evaluate bioequivalence for ezetimibe products, the FDA suggests measuring both ezetimibe (unconjugated) and total ezetimibe (EZM after deconjugation) [3]. The nature of the assays is direct and indirect quantification of EZM and EZM-G, respectively, through measuring ezetimibe before and after deconjugation with β-glucuronidase. As a result, the extraction efficiency was difficult to control, and the measured total EZM concentration did not accurately reflect the actual concentrations of EZM and EZM-G in the human body.
To evaluate the bioequivalence of the fixed-dose combination (FDC) of atorvastatin and ezetimibe, regulatory agencies, such as the US-FDA and the EMA, have established specific guidelines regarding the measurement of parent drugs and active metabolites. The US-FDA requires the measurement of all parent drugs and active metabolites [3], while the EMA focuses on the measurement of parent drugs after deconjugation [5]. Researchers have made significant efforts to meet these requirements by developing various bioanalytical methods. Some of these methods have been specifically designed to accurately quantify atorvastatin and its active metabolites [6,7,8,9,10,11,12,13,14,15,16]. Other methods aim to determine ezetimibe and total ezetimibe levels in human plasma through separate sample preparations [17,18,19]. Only one study has successfully quantified ezetimibe and its glucuronide metabolite using a single extraction procedure; however, this method was not validated for atorvastatin compounds [20]. Furthermore, several attempts have been made to quantify atorvastatin and ezetimibe in human plasma, though these methods did not account for their active metabolites [21,22,23]. Some studies have also explored the simultaneous determination of ezetimibe using other statins, such as simvastatin [24,25] and rosuvastatin [26,27,28]. It is worth noting that one author has successfully quantified four analytes, including atorvastatin, ezetimibe, and two active metabolites of atorvastatin, though the quantification of ezetimibe–glucuronide remains elusive [29]. Despite the dedicated efforts of researchers, there is currently no analytical method available in the literature that can simultaneously quantify five analytes, including both parent drugs and all three metabolites, in a single sample treatment.
Previous studies have extensively utilized mass spectrometry-based techniques for the analysis of atorvastatin and ezetimibe and their metabolites. These techniques involve essential steps such as sample extraction, chromatographic separation, and detection/quantification. Detection conditions commonly include the use of an ESI (electrospray ionization) ionization source and MRM (multiple reaction monitoring) mode via Triple Quad mass spectrometry. Reverse-phase chromatography is often used due to the medium-to-high distribution factors exhibited by the analytes. However, researchers have explored various sample preparation techniques used to optimize the analysis of these compounds. Solid-phase extraction (SPE), liquid–liquid extraction (LLE), and protein precipitation (PPT) have been found to address the specific distribution characteristics of the analytes. Mass spectrometry-based techniques involving sample extraction, chromatographic separation, and detection/quantification were commonly employed. Detection conditions, such as ESI ionization source and MRM mode using Triple Quad mass spectrometry, were consistent across these methods. Reverse-phase chromatography was often used due to the medium-to-high distribution factors. In the realm of sample preparation techniques, researchers have investigated several approaches, such as solid-phase extraction (SPE), liquid–liquid extraction (LLE), and protein precipitation (PPT), taking into consideration the distribution characteristics of the analytes. Notably, two studies have emerged as noteworthy contributions in this field. The first study employed solid-phase extraction (SPE) and used an HLB (hydrophilic–lipophilic balance) cartridge as the chosen method for quantifying ezetimibe and ezetimibe–glucuronide. This approach allowed efficient extraction and analysis of these compounds [21]. The second study utilized a salting-out assisted liquid–liquid extraction technique for the simultaneous quantification of atorvastatin and its active and inactive metabolites [7]. The salting-out assisted liquid–liquid extraction (SALLE) technique has been widely employed in analysis for an extended period [30,31]. SALLE leverages the salting-out effect, which is a phenomenon that aids in the extraction of polar analytes from a polar matrix [31]. This methodology has demonstrated its efficacy in extracting and quantifying the targeted compounds.
By employing SALLE technique, we can make significant strides in the accurate quantification of ezetimibe and atorvastatin and their active metabolites. This method can meet the stringent requirements of the FDA for evaluating the bioequivalence of the fixed-dose combination of atorvastatin and ezetimibe.

2. Materials and Methods

2.1. Chemicals and Materials

The reference standards used in this study were carefully sourced from reputable suppliers to ensure the reliability and accuracy of the analyses. Toronto Research chemicals, Canada, provided the reference standards for EZM (99.4%), EZM-G (99.7%), o-OH ATOR, and p-OH ATOR. ATOR and BP were obtained from the Institute of Drug Quality Control, which is located in Ho Chi Minh City, Vietnam. To meet the specific requirements of the analysis, J.T.Baker supplied the necessary solvents, including methanol and acetonitrile for LC-MS applications, as well as ethyl acetate for general analysis. Fisher supplied ammonium acetate and ammonium formate used for LC-MS purposes, along with methyl tert-butyl ether for the required extractions. Additionally, Merck provided the required acids, including perchloric acid, phosphoric acid, acetic acid, and formic acid, all of which were used for analytical purposes.

2.2. Liquid Chromatography and Mass Spectrometry Conditions

A Shimadzu HPLC system built from modules including 2 pumps (LC-30AD), an autosampler (SIL-30AC), a solvent degasser (DGU-20A3R), and a temperature-controlled compartment for columns (CTO-20AC) was used for reversed-phase chromatographic analysis.
After preparation, the sample was kept at 15 °C in an autosampler, which was kept until analyzed. The liquid chromatographic separation of the analytes and internal standard (IS) was performed using a reversed-phase chromatographic column: the Zorbax XDB C8 column (50 mm × 4.6 mm, 3.5 µm). The separation was achieved by employing an isocratic elution method with a mobile phase composed of a mixture of 45 parts of acetonitrile and 55 parts of a 0.5% acetic acid solution. The flow rate of the mobile phase was maintained at 1.0 mL/min, resulting in a system pressure of 70 bar. Finally, 7.0 µL of the eluant was injected into the chromatographic system.
A triple quadrupole mass spectrometer LCMS-8040 was equipped with an electrospray ionization source. The optimized source parameters, including capillary voltage, desolvation line temperature, heatblock temperature, drying gas flow, and nebulizing gas flow, were kept at 4500 V, 250 °C, 400 °C, 15 L/min, and 3 L/min, respectively. The ESI source was operated in negative mode for EZM, EZM-G and BP, while ATOR, o-OH ATOR, and p-OH ATOR were analyzed in positive mode. Thanks to being ionized via an ESI source, EZM, EZM-G, ATOR, o-ATOR and p-ATOR gave parent ions at 408, 584, 559, 575 and 575 m/z, respectively. These ions were then fragmented in a collision cell to product ions at 271, 271, 440, 440 and 440 m/z, respectively.
Labsolutions version 5.82 SP1 was the software used to control all parameters of LC and MS/MS.

2.3. Calibrators and Quality Control Samples

Calibrators and quality control (QC) samples were prepared by spiking standard solutions to plasma to identify simulated samples (containing 5% solvent).
The calibrators were designed over the ranges of 0.06–15 ng/mL, 0.6–150 ng/mL, 0.4–100 ng/mL, 0.12–30 ng/mL, and 0.05–3 ng/mL for EZM, EZM-G, ATOR, o-OH ATOR, and p-OH ATOR, respectively.
The quality control (QC) samples were prepared at four concentrations: 0.06, 0.18, 7.6, and 12 ng/mL for EZM; 0.6, 1.8, 75, and 120 ng/mL for EZM-G; 0.4, 1.2, 50, and 80 ng/mL for ATOR; 0.12, 0.36, 15, and 24 ng/mL for o-OH ATOR; and 0.05, 0.15, 1.5, and 2.5 ng/mL for p-OH ATOR.

2.4. Extraction Efficiency and Matrix Factor

To examine extraction parameters, three samples (simulated sample, spiked post-extraction sample, and spiked reconstitution solvent at individual concentrations of 1 μg/mL) were tested. The extraction efficiency and the matrix factor were calculated using the following formulas:
Extraction efficiency = RE = Stest/Sspiked × 100 (%)
Matrix factor = MX (MF) = Sspiked/Ssolvent × 100 (%)
where Stest, Sspiked, and Ssolvent are the signals of the analytes in the extracted simulated sample, the spiked post-extraction sample, and the spiked reconstitution solvent, respectively.

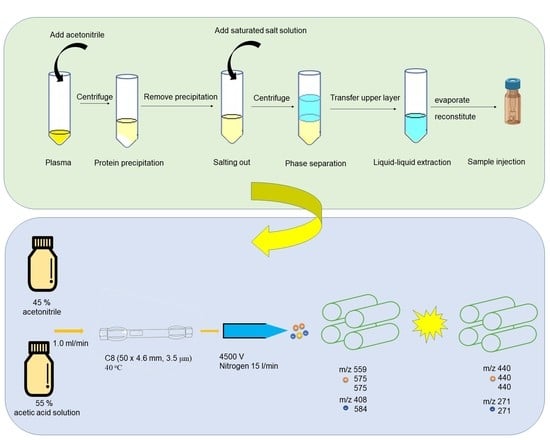
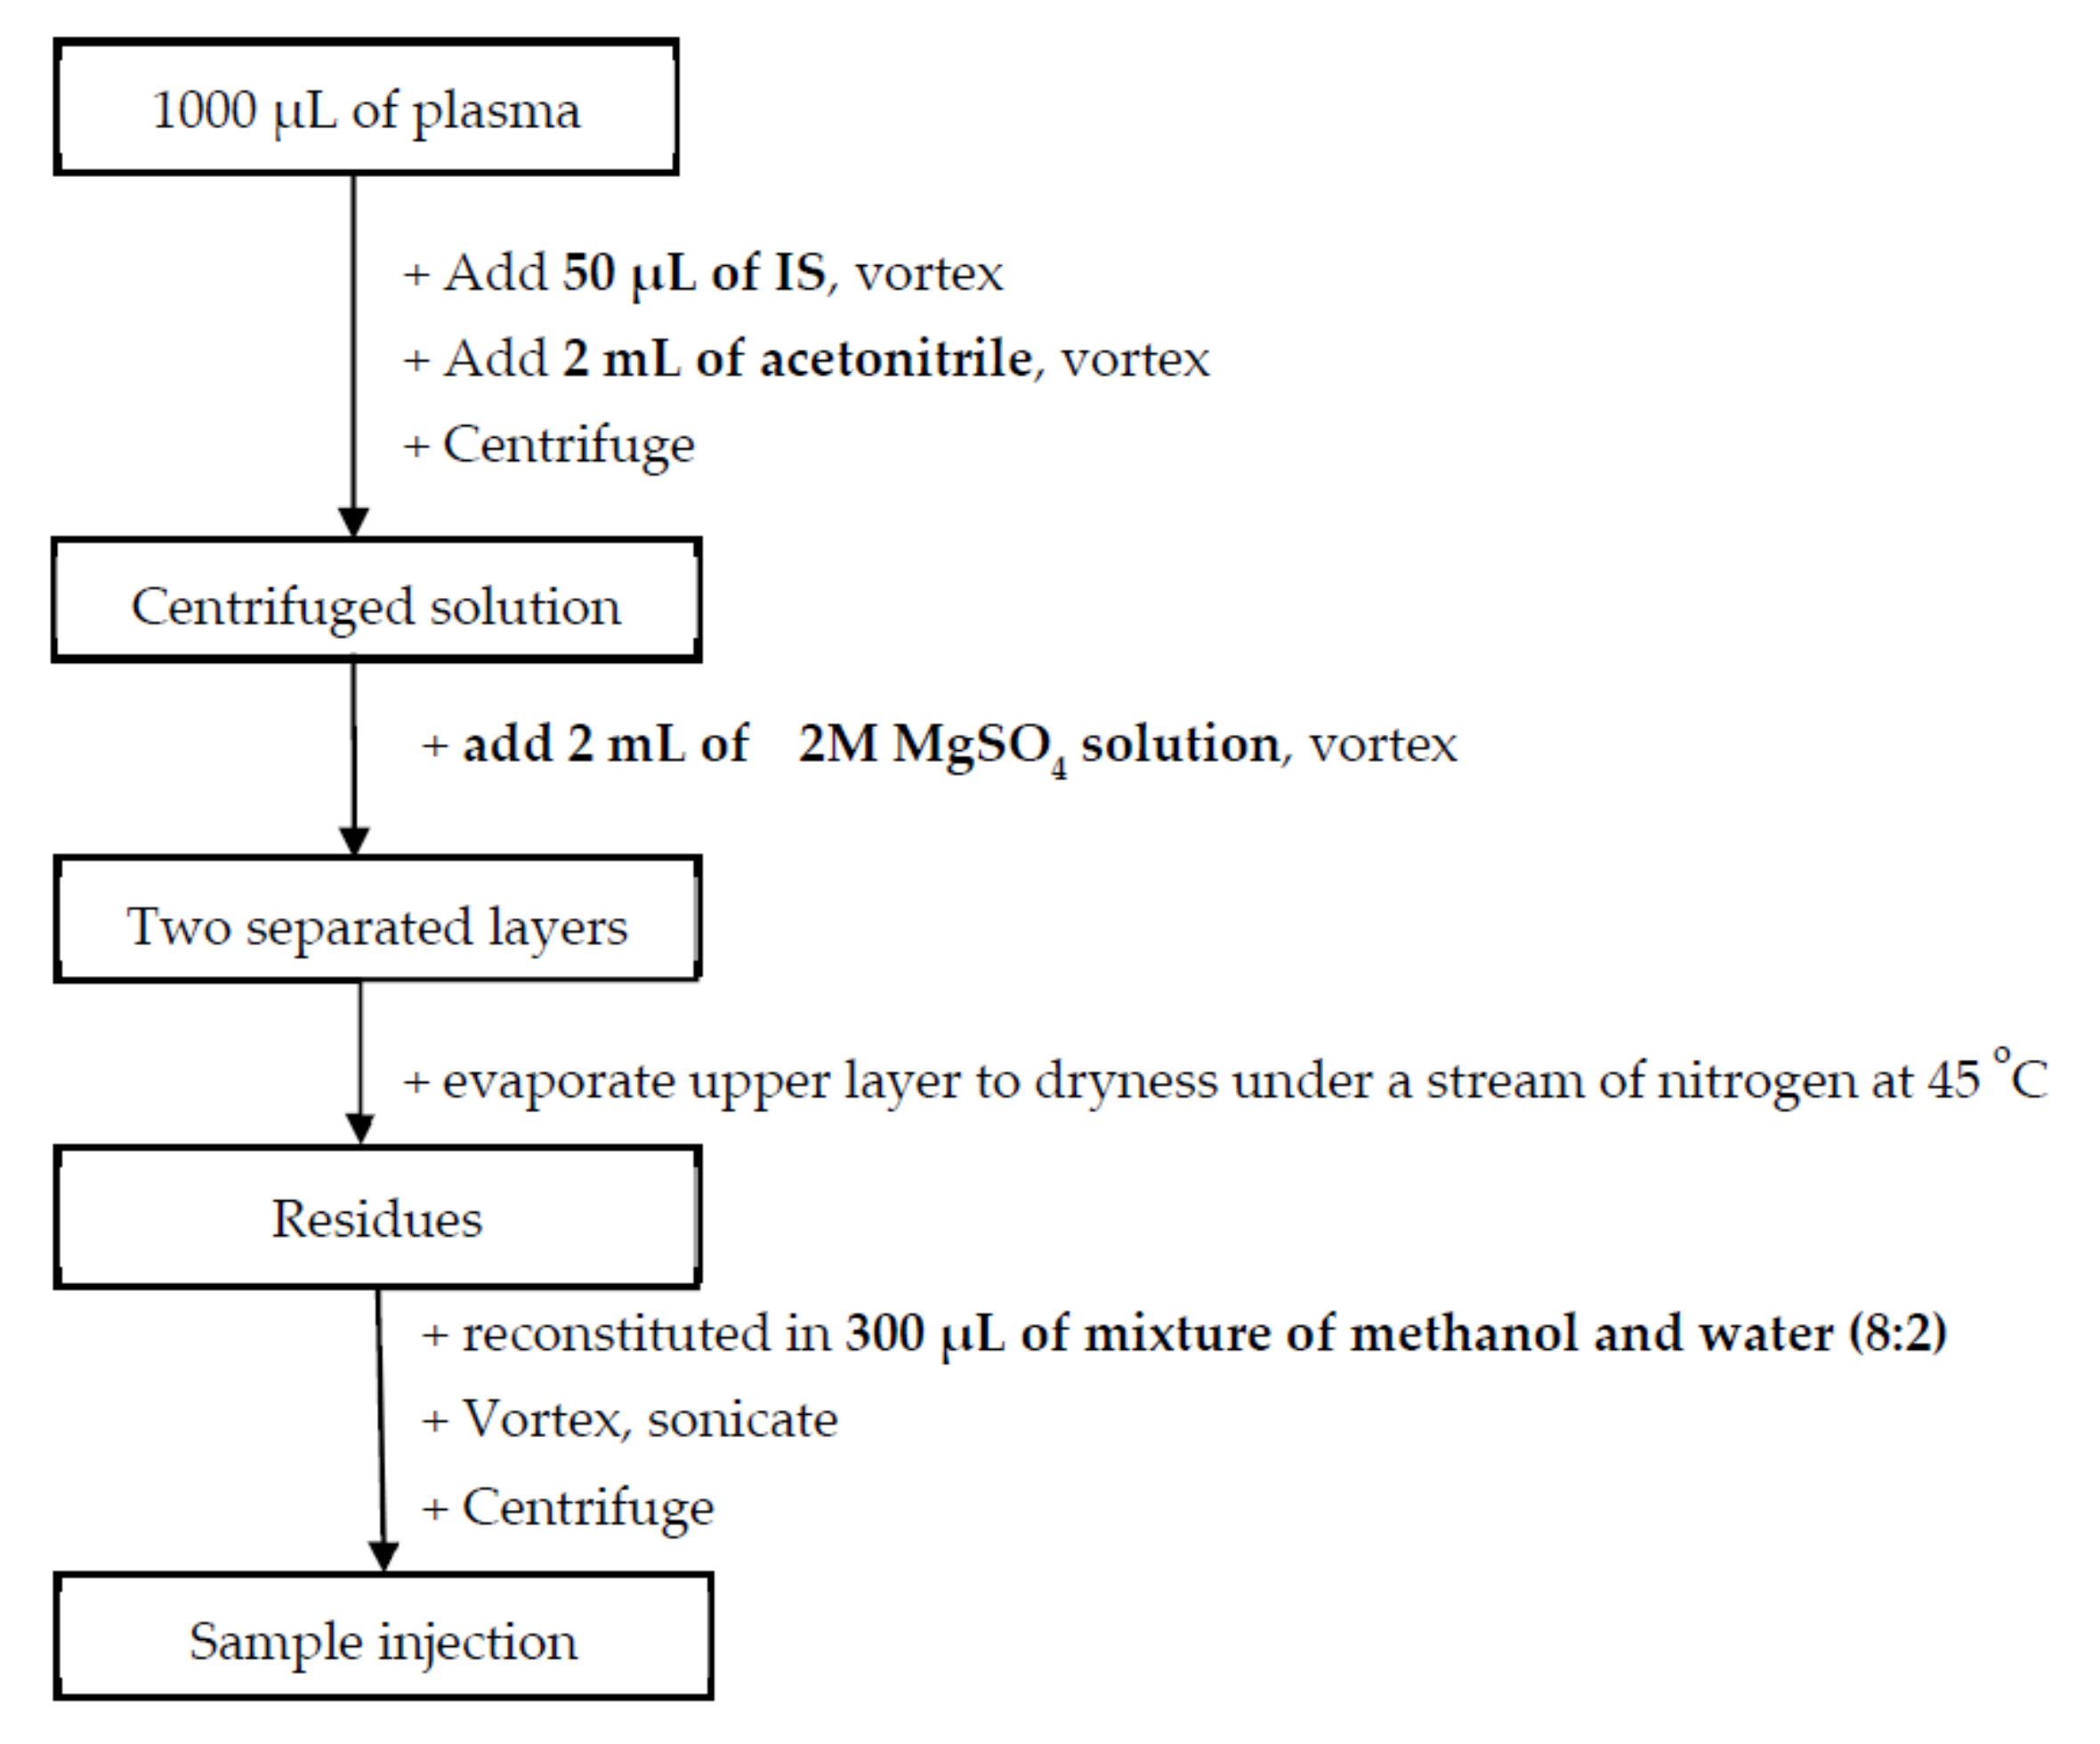
2.5. Protocol for Sample Preparation

Before extraction, frozen samples were thawed to room temperature. To 1000 µL of the samples, 50 µL of the internal standard solution at a concentration of 1 μg/mL in acetonitrile was added and vortexed for 10 s. Further, 2 mL of acetonitrile was also added and vortexed. Thereafter, samples were centrifuged at 4000 rpm for 5 min. The supernatant was carefully transferred to a fresh tube that contained 2 mL of 2-molarity MgSO4 and vortexed. After being centrifuged at 4000 rpm at 0 °C for 5 min, the upper layer was evaporated to dryness under a stream of nitrogen. After that step, the residues were reconstituted in 300 µL of methanol–water (8:2) and filtered through nylon filters with a pore size of 0.22 µm into vials. The flowchart of extraction procedure is provided in Figure 1.

2.6. Method Validation

The method underwent a thorough validation process in accordance with the regulatory requirements set by the FDA. This validation included assessing various parameters, such as specification, selectivity, linearity, recovery, accuracy, precision, low limit of qualification, carry-over, and stability [32]. Additionally, considering the absence of a matrix effect, the validation of the matrix effect was conducted following the guidelines provided by the EMA [33].

3. Results and Discussion

All five analytes are polar molecules with medium masses; thus, they can be detected via a TripleQuad detector using an ESI source. To minimize the matrix effect, the analytes need to be separated from extremely polar impurities in the matrix in chromatographic condition and via sample preparation. Regarding chromatographic condition, the polar impurities in the plasma matrix were mostly not retained via reversed-phase chromatographic columns. For sample preparation, most impurities are soluble in water and practically insoluble in non-polar solvents. Moreover, all analytes are acidic molecules and can be dissolved in non-polar solvents (logP > 2). Thus, to prolong the retention time of the analytes (especially EZM-G), the study was directed toward preparing samples via liquid–liquid extraction following separation on reversed-phase chromatographic columns using an acidic mobile phase.

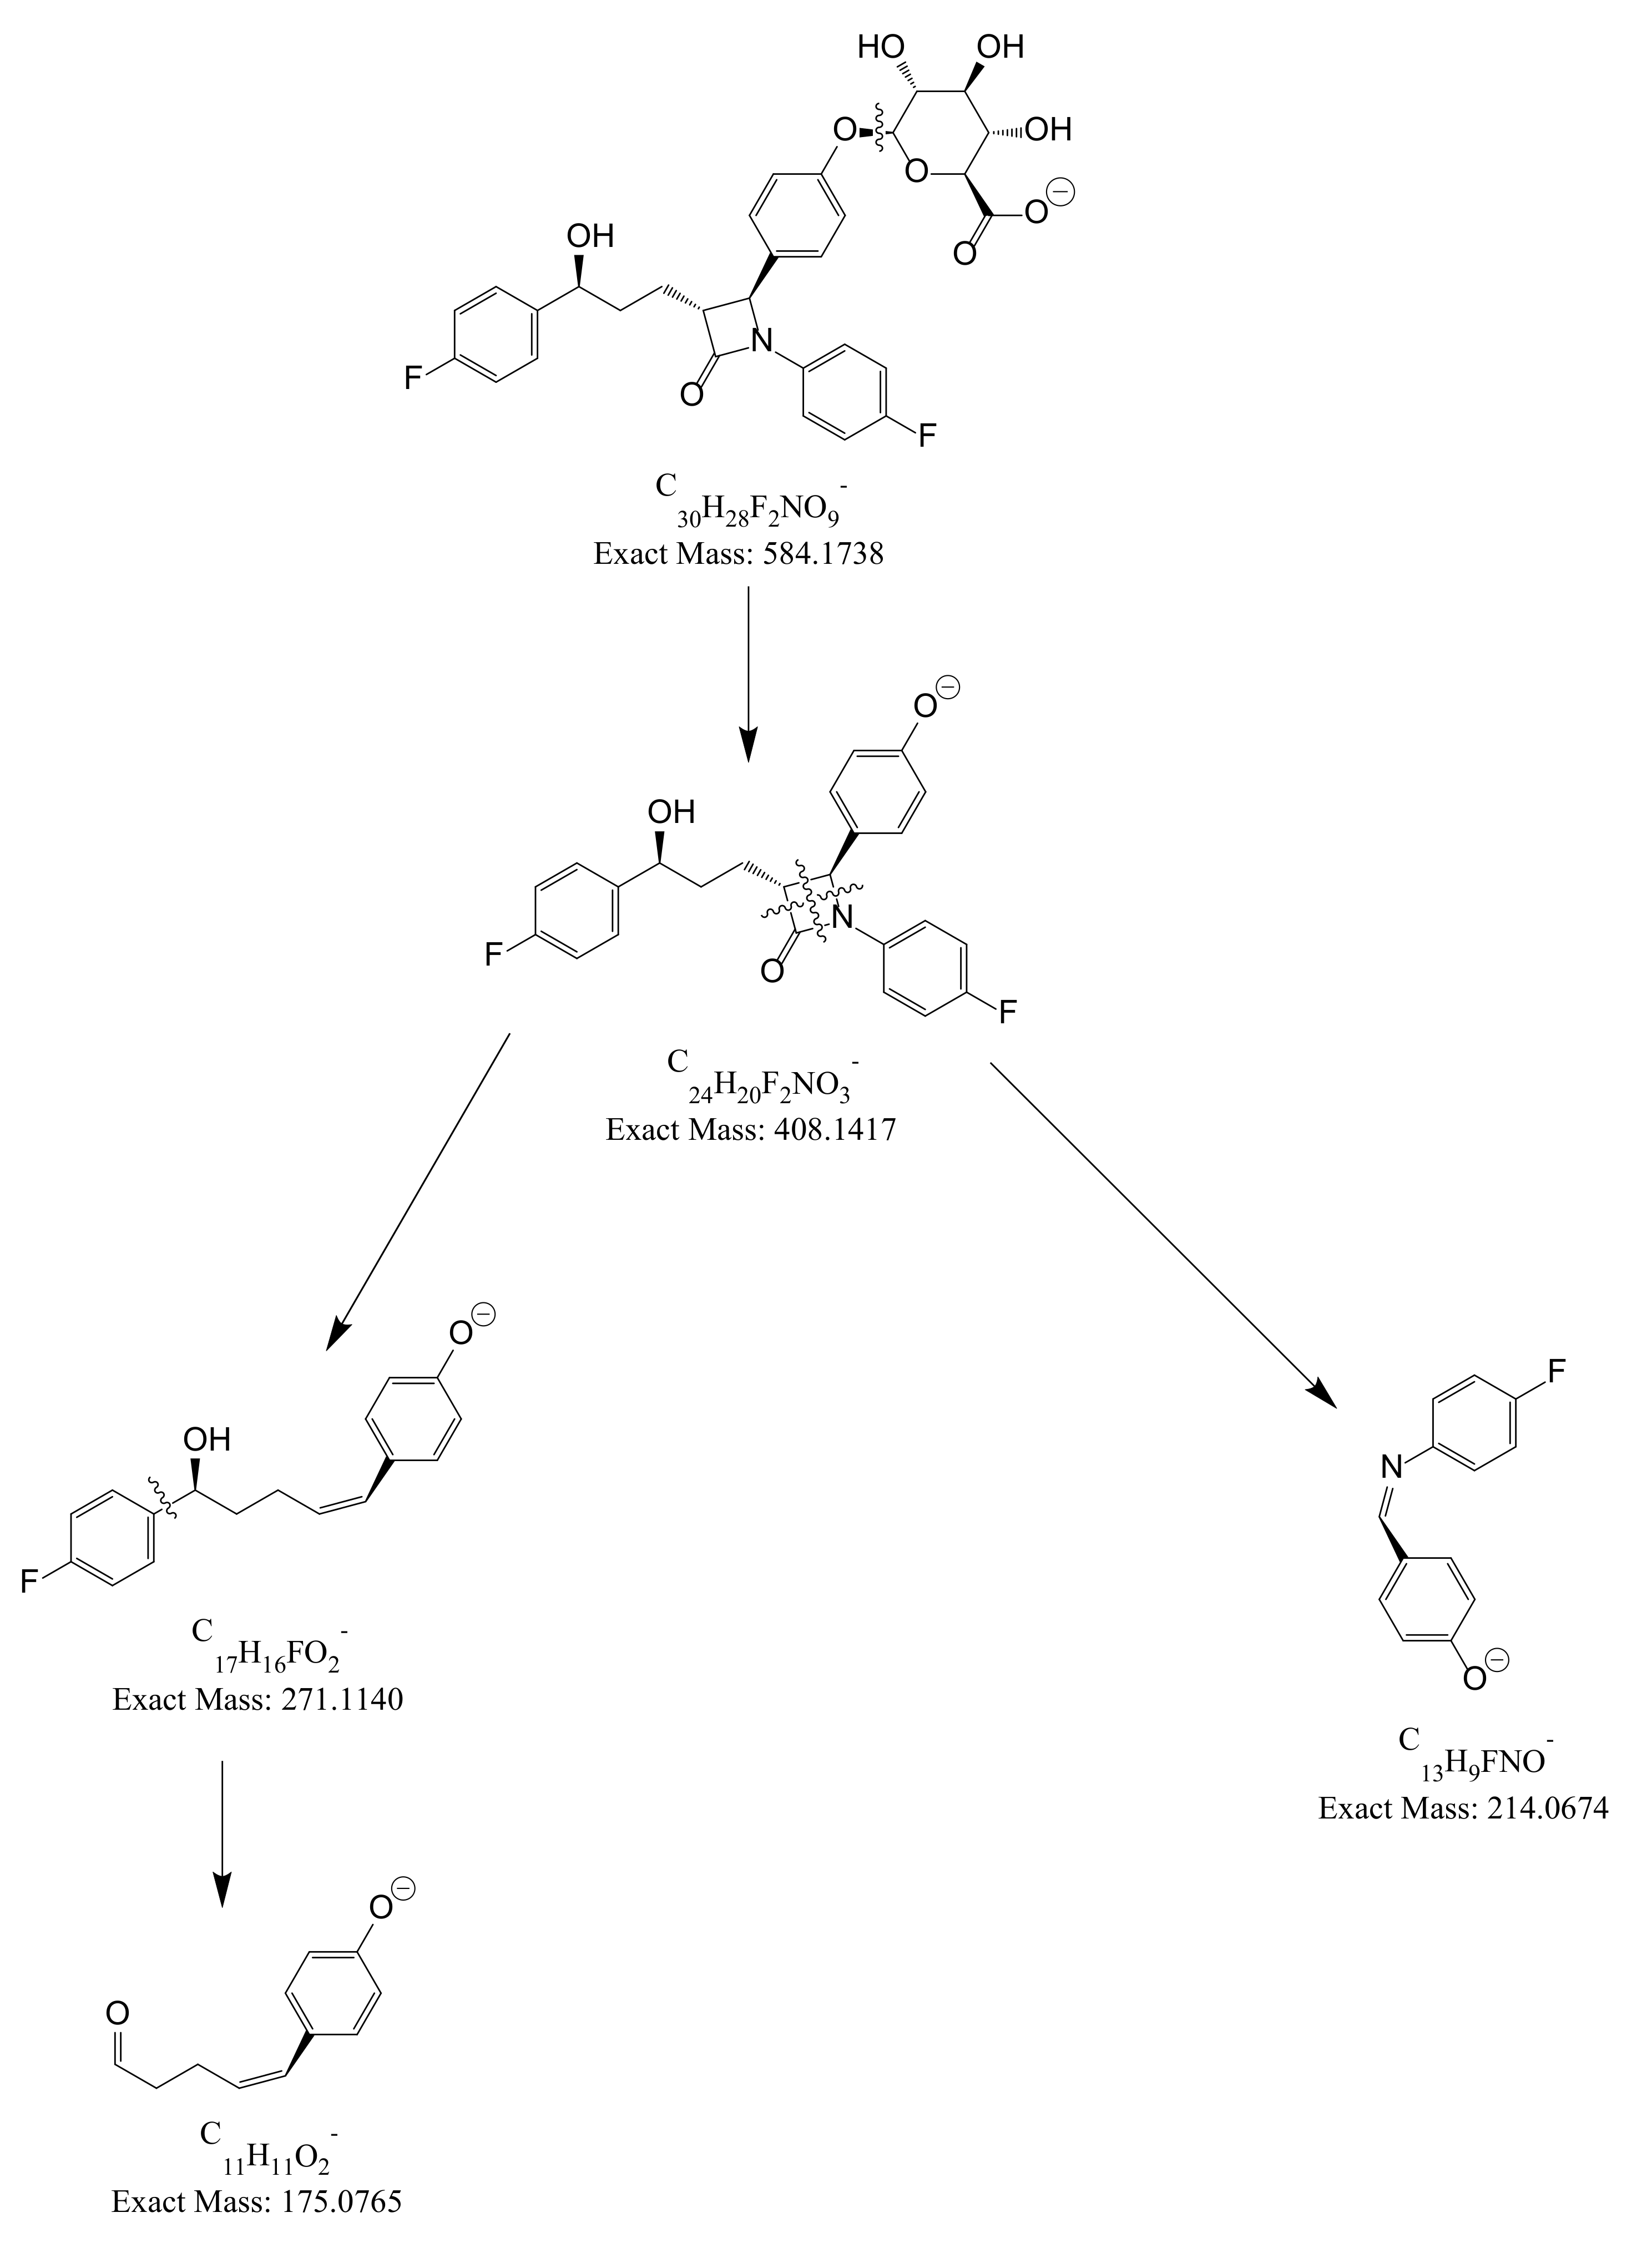
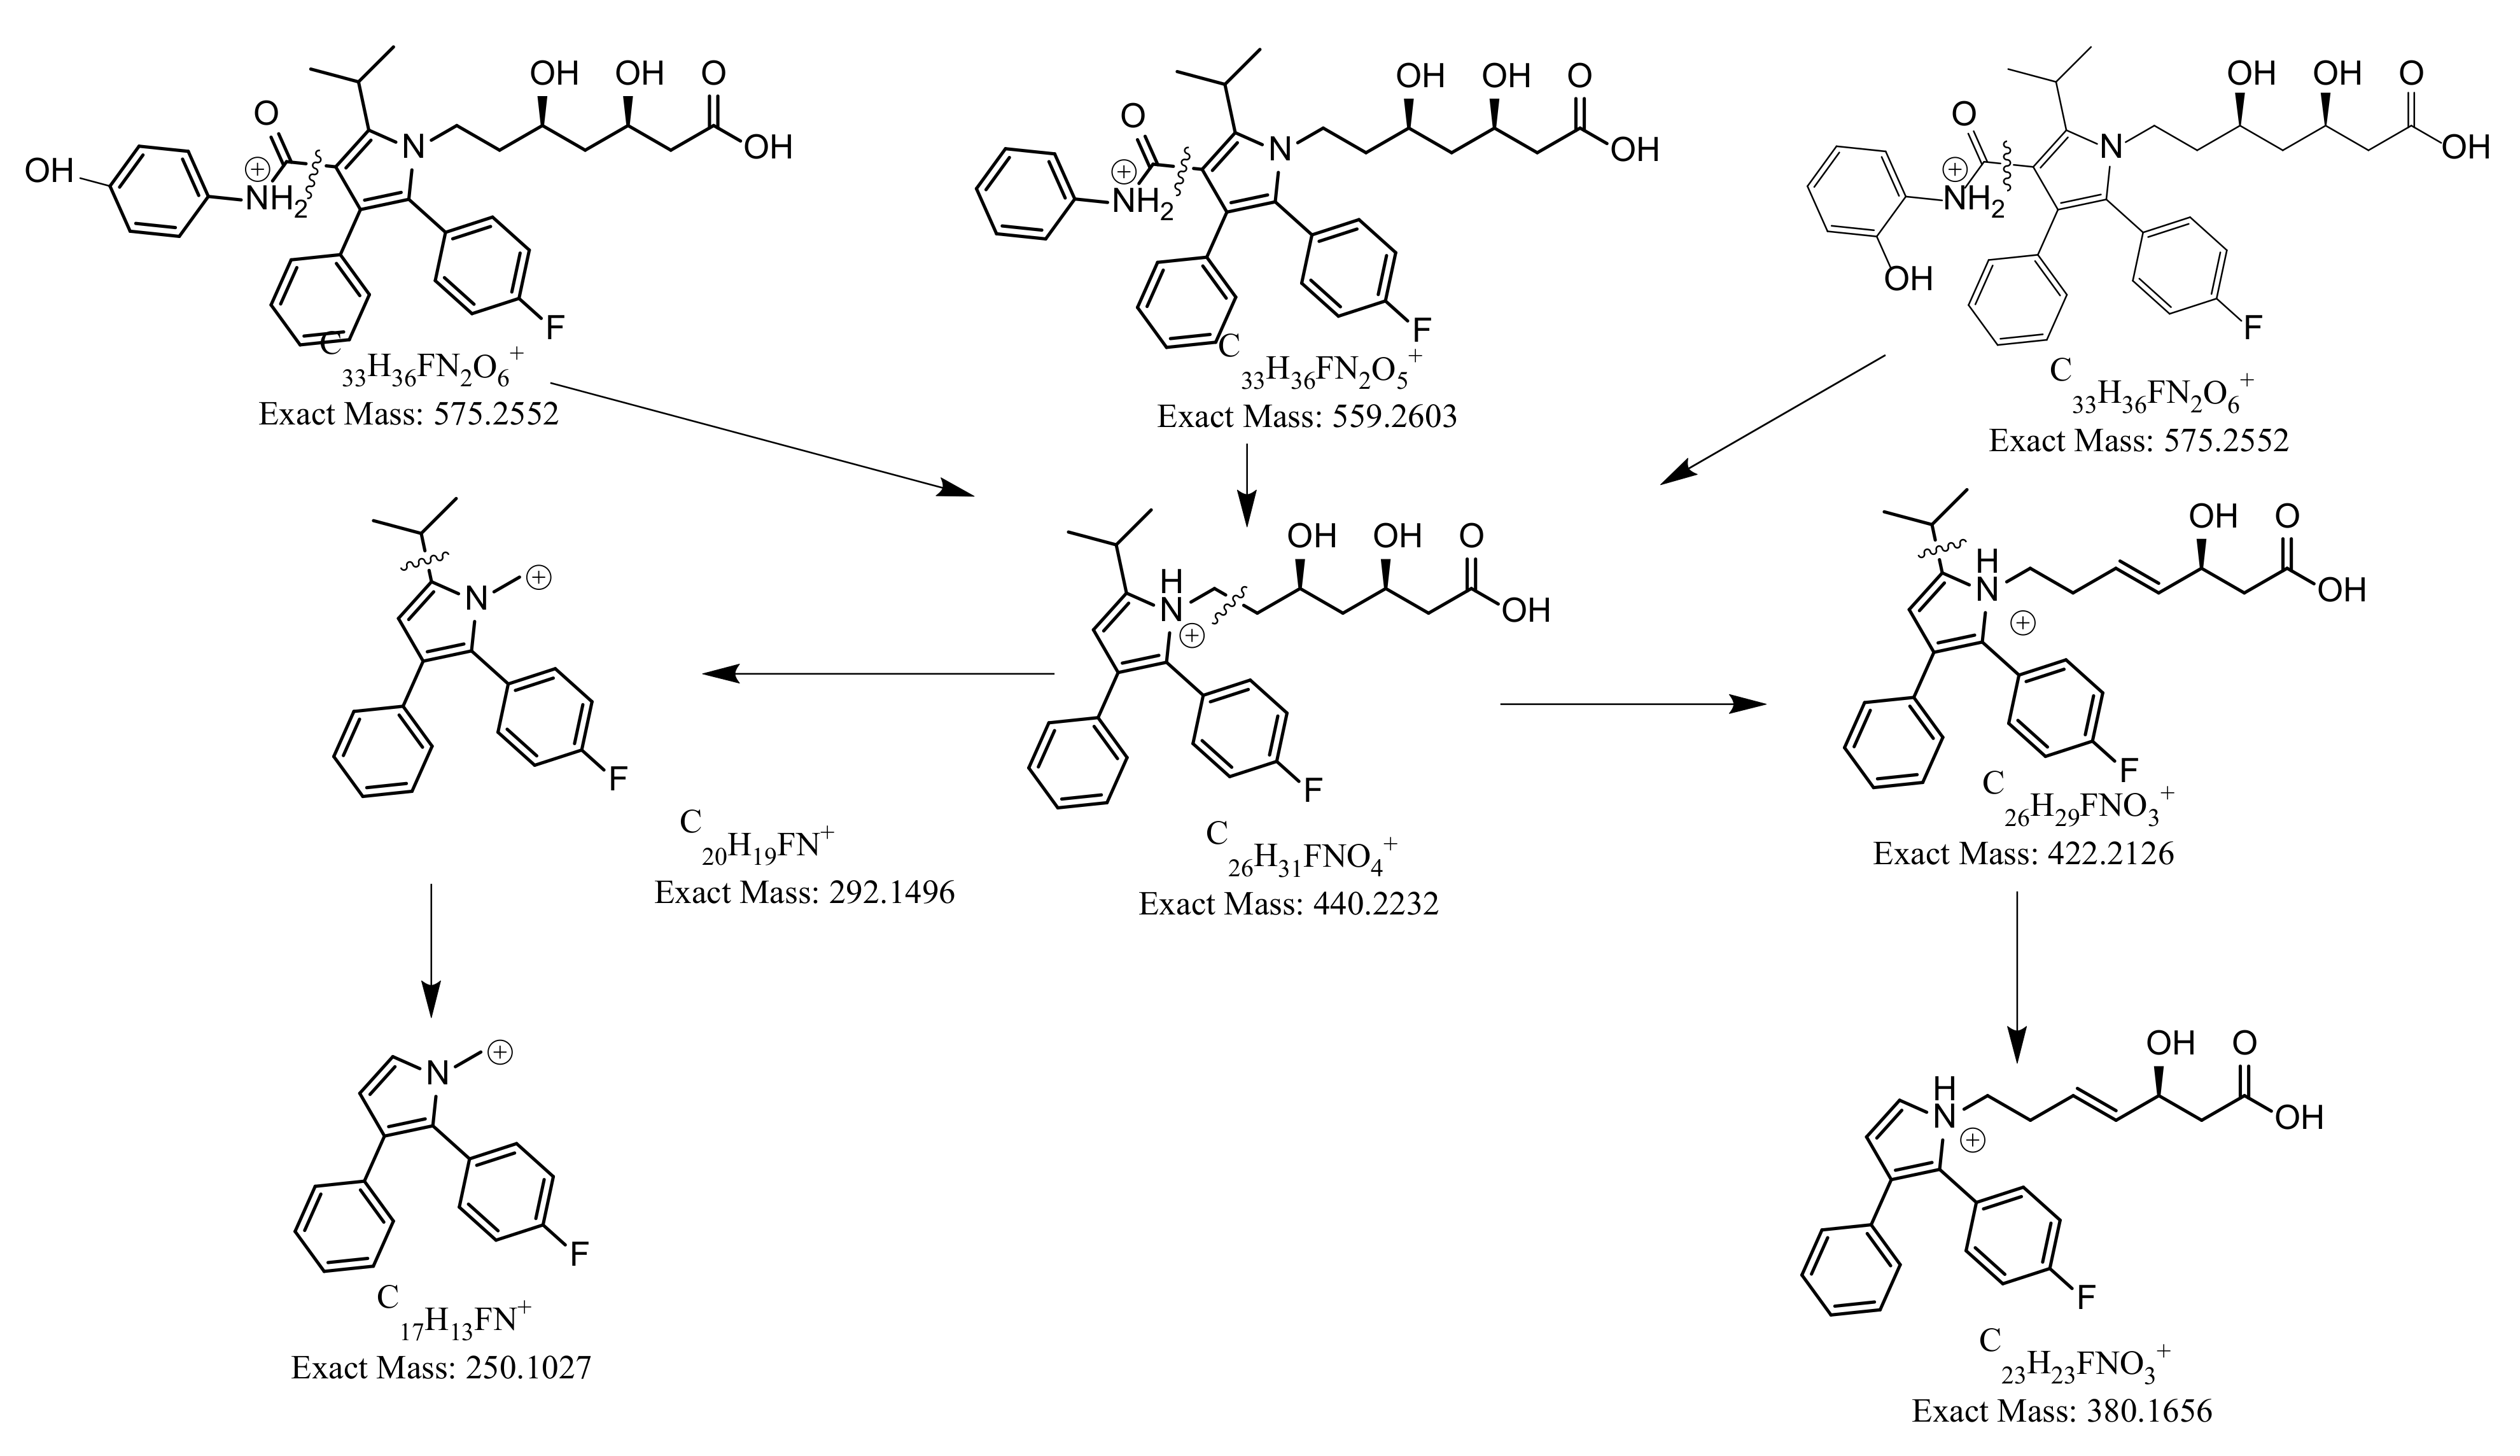
3.1. LC-ESI-MS/MS Method Development

It was observed that EZM and EZM-G were only ionized in negative mode, while ATOR, o-OH ATOR, and p-OH ATOR could be ionized in both positive and negative modes (the positive mode showed higher responses than the negative mode). Thus, in this study, EZM and EZM-G were analyzed in negative ion mode, while ATOR, o-OH ATOR, and p-OH ATOR were in positive ion mode for high sensitivity.
According to the scan mass spectra, the parent ions, being deprotonated molecule ions [M-H]- at m/z 408 and 584, were found for EZM and EZM-G, respectively, while protonated molecule ions of [M + H]+ at m/z 559, 575 and 575 were presented as parent ions for ATOR, o-OH ATOR, and p-OH ATOR, respectively.
Using SIM mode without chromatographic columns, the dependence of parent ions’ response on variable parameters, including the buffer, acidic solutions, and concentrations of acidic solutions, was studied to select the most suitable water phase. With a fixed pH of 3.0, in comparison to the ammonium formate buffer, the ammonium acetate buffer showed higher responses for the groups of two EZM compounds and lower responses for the group of three ATOR compounds. However, the ammonium acetate buffer (pH 3.0) showed lower responses than a 0.1% solution of acetic acid (pH 2.6). Therefore, the acetic acid solution was further considered. After reviewing the concentration range of 0.1–0.5%, we selected 0.5% as the acetic acid solution’s concentration to ensure suitable sensibility for all analytes. Higher concentrations were not necessary due to instrument durability.
Using parent ions achieved in the full scan mass spectra, the daughter ions were determined via product ion scan spectra. Fragmentations of the parent ions into daughter ions were consistent with data found via MassBank of North America (MoNA) and our proposed fragmentation mechanism (Figure 2 and Figure 3). The parent and daughter ions are shown in Table 1.
Using an acidic mobile phase, all five acidic analytes could be retained via the reversed-phase chromatographic column. They were separated from each other and polar impurities in the matrix due to differences in solubility and distribution. After chromatographic parameters were considered, the samples were analyzed via a Zorbax XDB C8 (50 mm × 4.6 mm; 3.5 μm) column for 4.3 min using a mixture of acetonitrile and a 0.5% solution of acetic acid (45:55) as a mobile phase at a flow rate of 1.0 mL/min. The mobile phase and the column were warmed and kept at 40 °C to reduce system pressure.

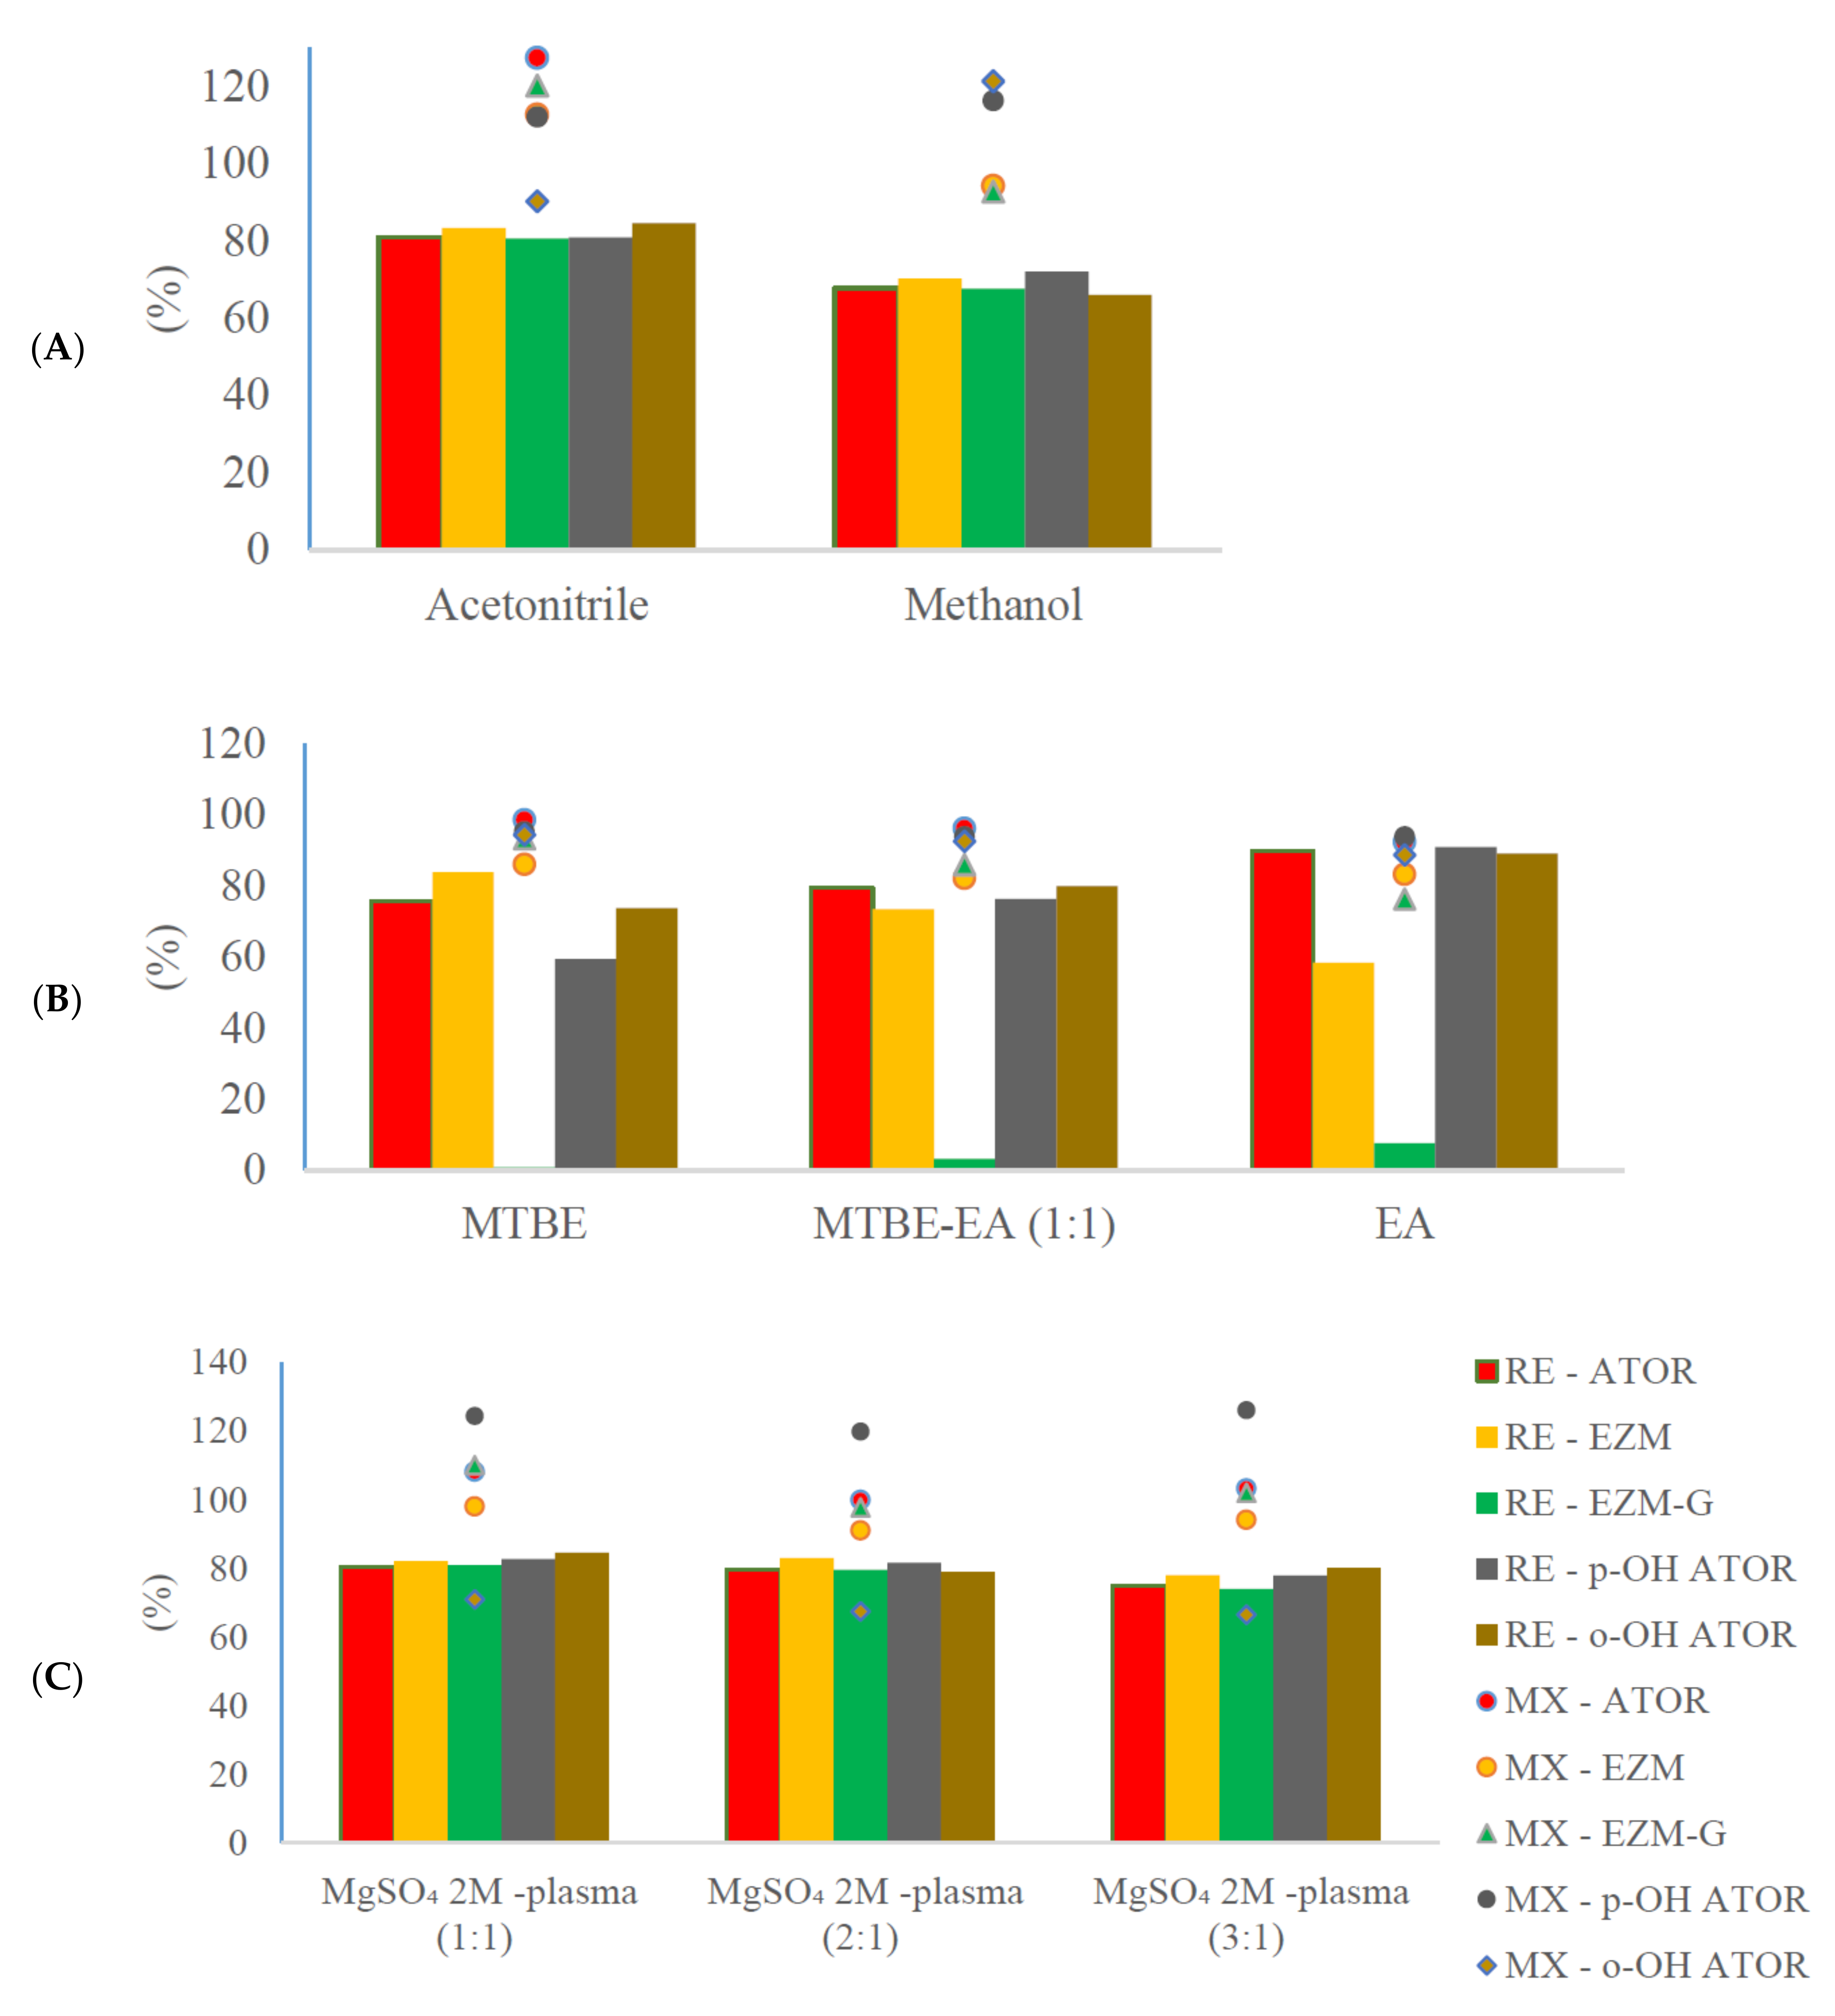
3.2. Optimization of Sample Preparation

To reduce the amount of unexpected impurities analyzed via chromatographic columns, thereby minimizing the matrix effect and improving sensibility, it is necessary to carry out suitable sample preparation. Protein precipitation (PPT), liquid–liquid extraction (LLE), and solid-phase extraction (SPE) are the most common biological sample preparation methods.
The expense per sample extracted via SPE is high, making it uncommon in developing countries, where simple extraction at a lower cost is required. As a result, SPE was not selected in this study, in spite of its applicability for extracting analytes from complicated matrices and the possibility of automation.
Due to simple and fast processing, PPT with two solvents (methanol and acetonitrile) was investigated. After almost solely eliminating macromolecules like proteins in plasma, PPT gave a high extraction efficiency (>60%) for all analytes, though the matrix effect was extremely serious. Moreover, to improve sensibility, extracts (containing water and the solvent) ought to be enriched through drying and redissolved, which is time consuming. Thus, PPT was not selected in this study.
Past studies extracted EZM and three compounds of the ATOR group from plasma using LLE with common solvents, including methyl tert-butyl ether, ethyl acetate, and mixtures of both compounds with and without acidification. In fact, it is not possible to extract the metabolite EZM-G using these non-polar solvents (recovery < 10%) due to the high polarity and high water solubility of this glucuronide conjugate. However, it is observed that the higher the polarity of the solvent, the higher the recovery of EZM-G. Therefore, using more polar solvents than ethyl acetate can increase the extraction efficiency of EZM-G. Nevertheless, such solvents (e.g., tetrahydrofuran, isopropanol, acetonitrile, etc.) are mixed with water to create a homogeneous solution, meaning that they cannot be applied in LLE without special effects. Though understood for a long time, the salting-out effect has only recently been used to assist LC-MS/MS bioanalysis: this technique is called salting-out assisted liquid–liquid extraction (SALLE). The salting-out effect is recognized as the decrease in the solubility of substances in the aqueous phase in the presence of salts, leading to three consequences: protein precipitation, a decrease in the solubility of analytes, and phase separation, which would assist LLE.
In a typical SALLE procedure for bioanalysis, initially, analytes exist in plasma (aqueous phase). After the protein precipitate is mixed with a water-miscible solvent (acetonitrile) as a homogeneous mixture, a saturated salt solution is added to cause phase separation. After that step, the extraction takes place. Involving both protein precipitation and an LLE procedure, the SALLE technique shows better extraction efficiency for polar analytes from polar matrices than typical LLE, as well as a reduced matrix effect in comparison to PPT.
In previous SALLE studies, acetonitrile and a 2-molarity solution of magnesium sulfate in water were used as the most common water-miscible organic solvent and the most effective salting-out agent, respectively. Following previous studies of these agents, we tested parameters including acidification, acetonitrile-to-plasma ratios, and salt solution-to-plasma ratios to find a suitable extraction efficiency and a minimum matrix effect. The reconstituted solvents were also tested for optimal ionization.
All analytes are acidic; thus, acidifying agents were added to ensure that they existed as base molecules. An HClO4 solution (4%) was tested in a volume range of 0–100 μL. The results showed that acidification did not improve the extraction efficiency and the matrix effect. Thus, acidification with a strong acid (such as HClO4) was not necessary for SALLE preparation.
It was observed that the higher the acetonitrile ratio (from 2 to 4), the higher the extraction efficiency (60–80%) and the bigger the matrix effect (100–140%). The drying time was expanded, while the sensibility was not improved significantly. Thus, an acetonitrile-to-plasma ratio of 2:1 was suitable for this procedure.
The effect of salt solution-to-plasma ratios was also tested. In the range of 1 to 3, the extraction efficiency and the matrix effect did not change significantly. With a ratio of 2:1 or higher, phase separation took place completely, while a ratio lower than 2:1 did not cause the same phenomenon. Therefore, we selected 2:1 as the MgSO4 2M-to-plasma ratio.
Methanol and acetonitrile were the most common reconstitution solvents due to their solubility, though the addition of an aqueous solution to these organic solvents could result in higher ionization. Methanol gave higher responses for all analytes than acetonitrile. Using a mixture of methanol and water gave higher responses than using only methanol, and acidification with formic acid caused lower ionization. As a result, a mixture of methanol and water was chosen as the reconstitution solvent in this study. Figure 4 summarizes all of our results for the investigation of sample preparation.
In conclusion, typical LLE with non-polar organic solvents was effective for extracting EZM, ATOR, o-OH ATOR, and p-OH ATOR, though it was not effective for extracting EZM-G. PPT eliminated almost all proteins while keeping analyte solutes. Therefore, the recovery was high, while the matrix effect was serious and analytes were diluted, which would result in reduced sensibility. SALLE, as a combination of PPT and LLE, shows efficiency in extraction, reduces the matrix effect, increases sensitivity, and shortens the analysis time.

3.3. Method Validation

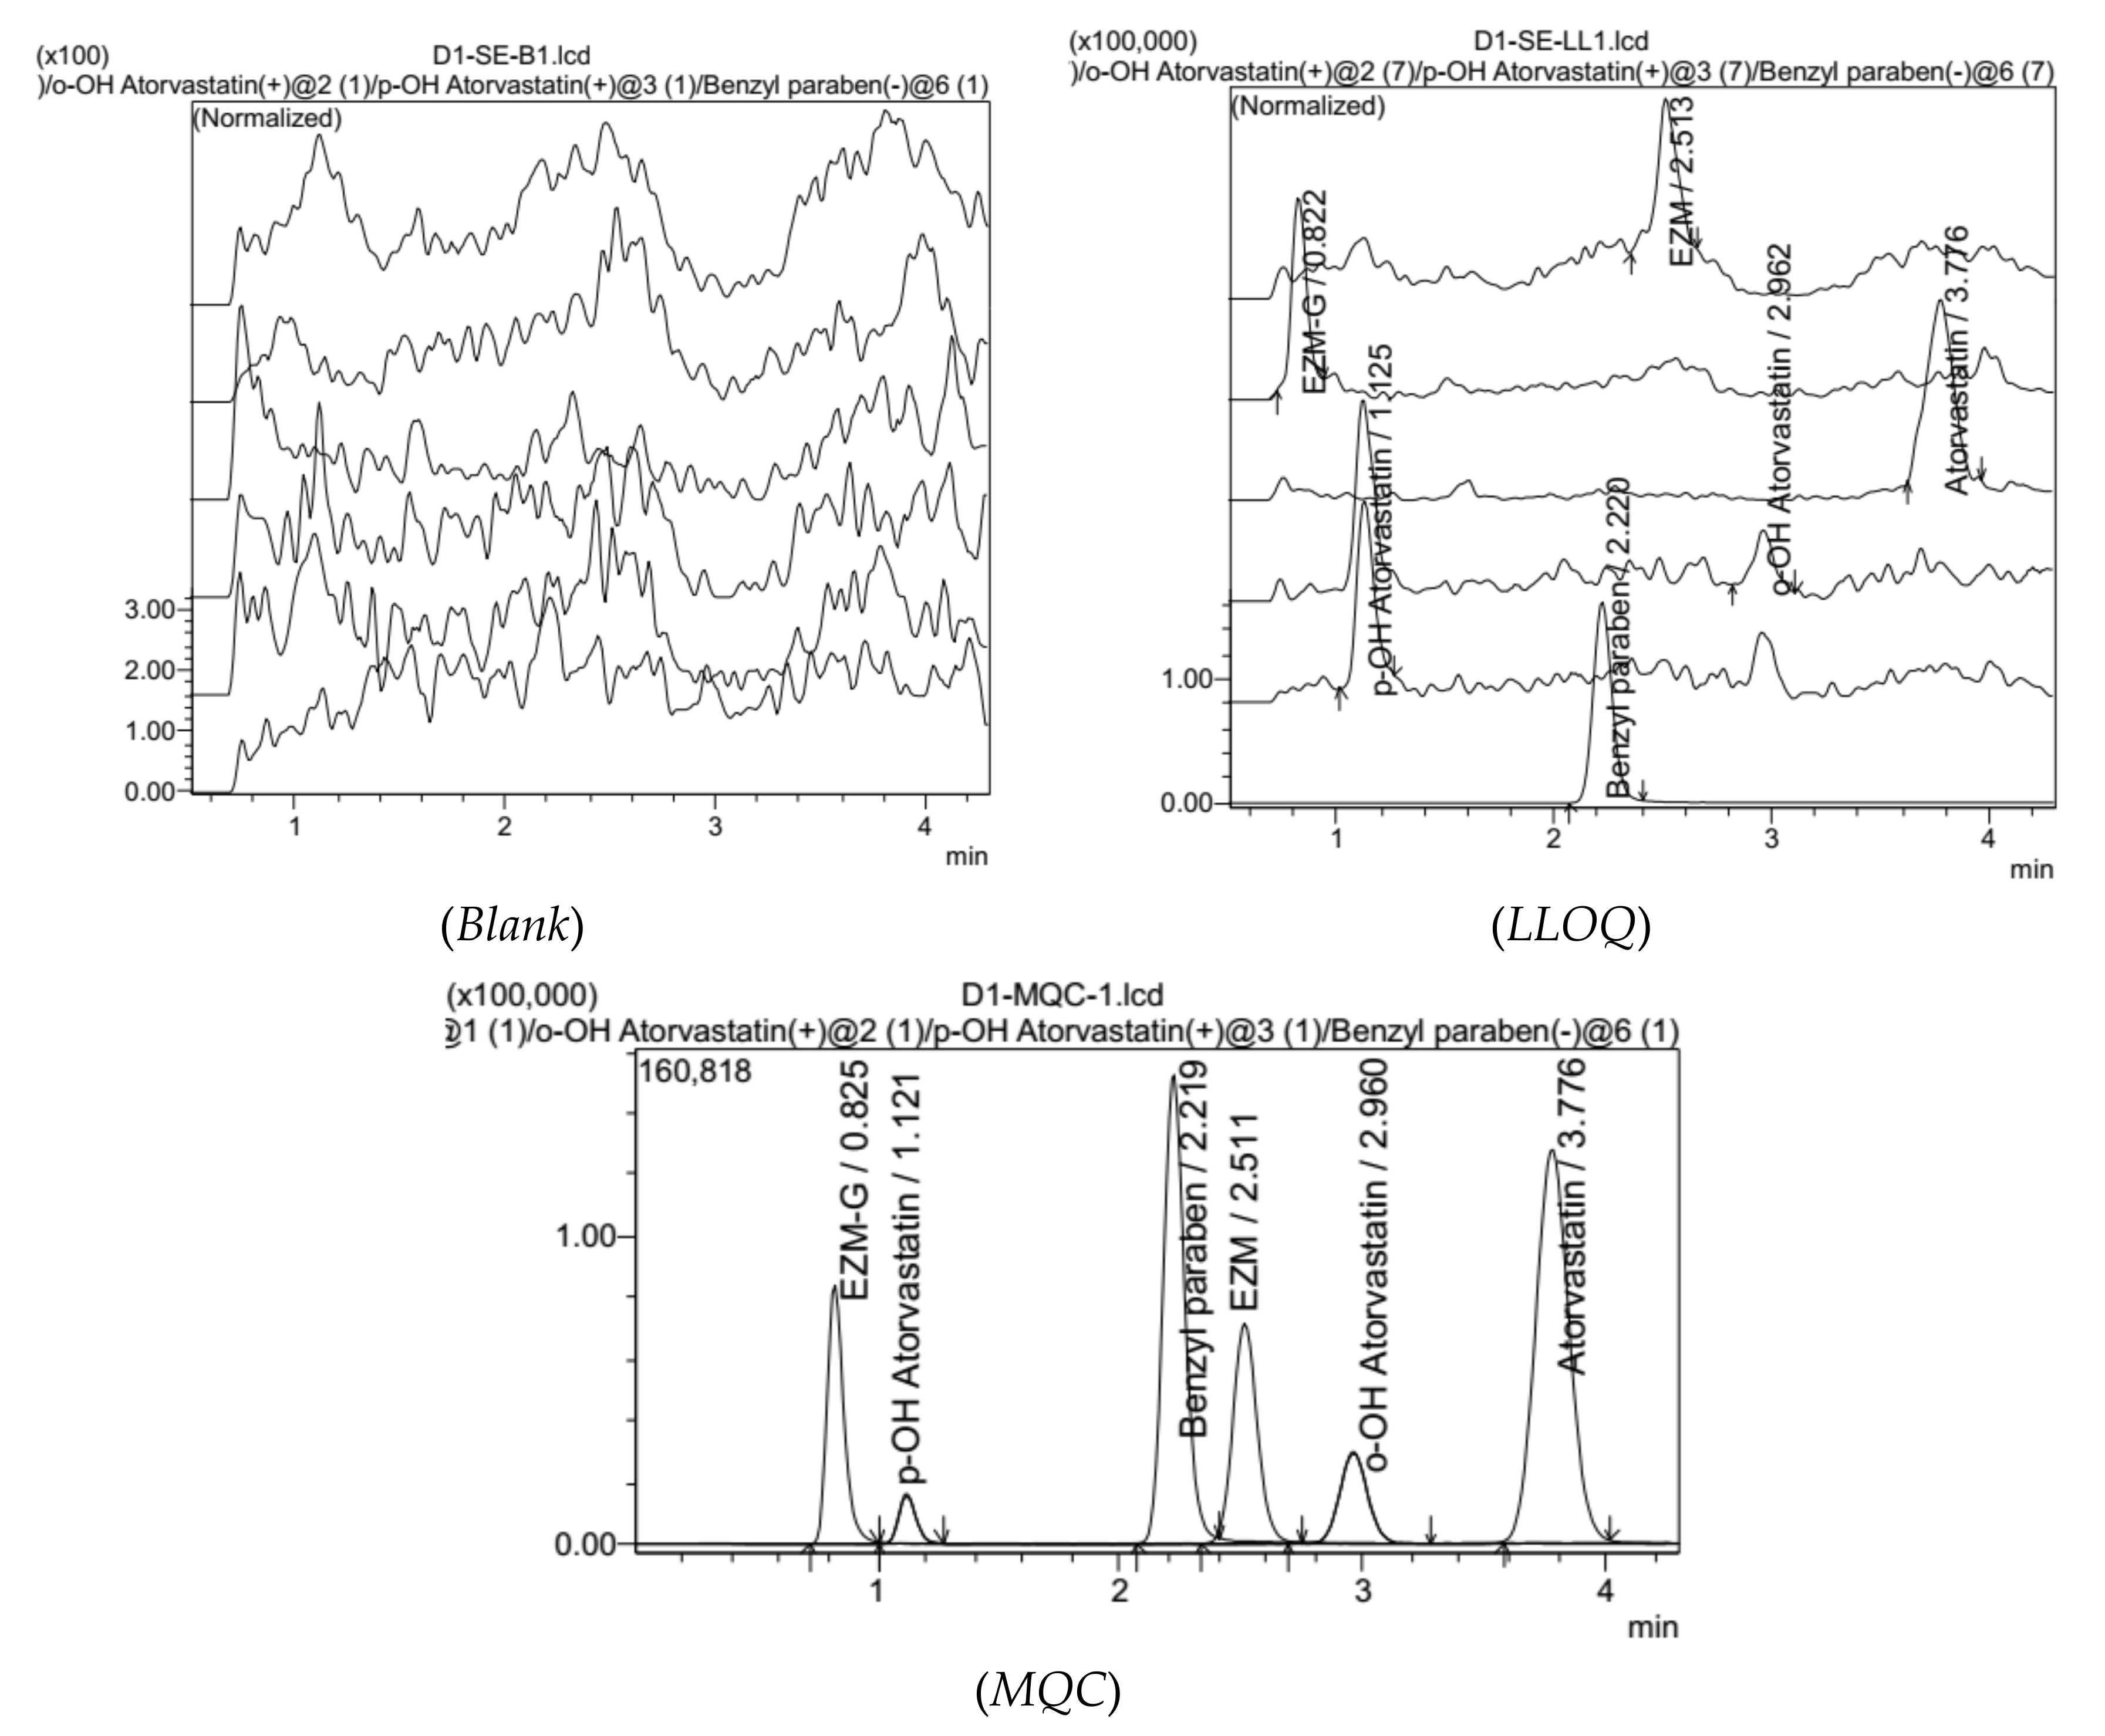
3.3.1. Specifications, Selectivity

All compounds in the same group (the group of EZM compounds and the group of ATOR compounds) had the same quantitative ions, despite having different parent ions. Indeed, o-OH ATOR and p-OH ATOR had the same parent and product ions. Therefore, it is essential to separate the compounds in the same group via chromatograms.
At the LLOQ concentration level, the chromatogram of our samples showed an EZM peak at Rt = 2.52, while an EZM-G peak was recorded at Rt = 0.82. Moreover, the ATOR peak was recorded at Rt = 3.77, while those of o-OH ATOR and p-OH ATOR were recorded at Rt = 2.97 and Rt = 1.12, respectively. All peaks were completely separated via the chromatogram.
Chromatograms of blank plasma showed no peak at the positions of our analytes and IS. Figure 5 provides chromatograms of blank plasma sample and low limit of qualification (LLOQ) and Medium quality control (MQC) level plasma samples.

3.3.2. Linearity

Calibration curves were designed to cover the ranges of 0.06–15 ng/mL, 0.6–150 ng/mL, 0.4–100 ng/mL, 0.12–30 ng/mL, and 0.05–3 ng/mL for EZM, EZM-G, ATOR, o-OH ATOR, and p-OH ATOR, respectively. To establish these calibration curves, linear models were employed that had a weighting factor of 1/x2, which yielded a strong correlation (r > 0.99) between the response and the concentration of the analytes. The calibration equation utilized in this study, which incorporates an internal standard (IS), follows the form y = ax + b. The specific concentration ranges and individual equations for each analyte can be found in Table 2.

3.3.3. Recovery and Matrix Effect

The implementation of the SALLE procedure yielded exceptional and consistent extraction efficiency for all analytes and internal standards, with a particular emphasis on polar compounds, such as EZM-G. Notably, the recovery rate of EZM-G exceeded 85%, surpassing the recovery rates reported in a previous study that utilized liquid–liquid extraction (LLE) after deconjugation with β-glucuronidase [18], as well as in another study that employed solid–phase extraction (SPE) [20]. This result highlights the advantage of direct quantification and emphasizes the reproducibility of the extraction procedure, affirming its reliability in consistently capturing and isolating target compounds from the sample matrix.
During the study, it was found that the signal of EZM-G was suppressed, with matrix factors ranging from 85.94 to 91.30%, while the signal of p-OH ATOR was enhanced, with matrix factors ranging from 129.18 to 129.28%. This difference in matrix factors between the two compounds highlights a limitation of the SALLE procedure compared to traditional liquid–liquid extraction (LLE) [7,8,12,15], as it may lead to the extraction of small amounts of polar impurities alongside the analytes. However, it is important to note that achieving matrix factors of exactly 100.0 (within ±15%) is not necessary; rather, their stability across multiple plasma samples is critical. To assess the matrix effect, the IS-normalized matrix factor was calculated by dividing the analyte’s matrix factor by the matrix factor of the internal standard (IS). It is required that the coefficient of variation (CV) for the IS-normalized matrix factor, which is calculated via the analysis of six different plasma lots, remains below 15%. In our study, the CV values were below 8.4%. Furthermore, the accuracy and precision results demonstrated the reliability of the developed method, indicating its suitability for practical applications.

3.3.4. Accuracy and Precision

The intra- and inter-day precision data are summarized in Table 3, suggesting that our results were reliable.

3.3.5. Low Limit of Qualification
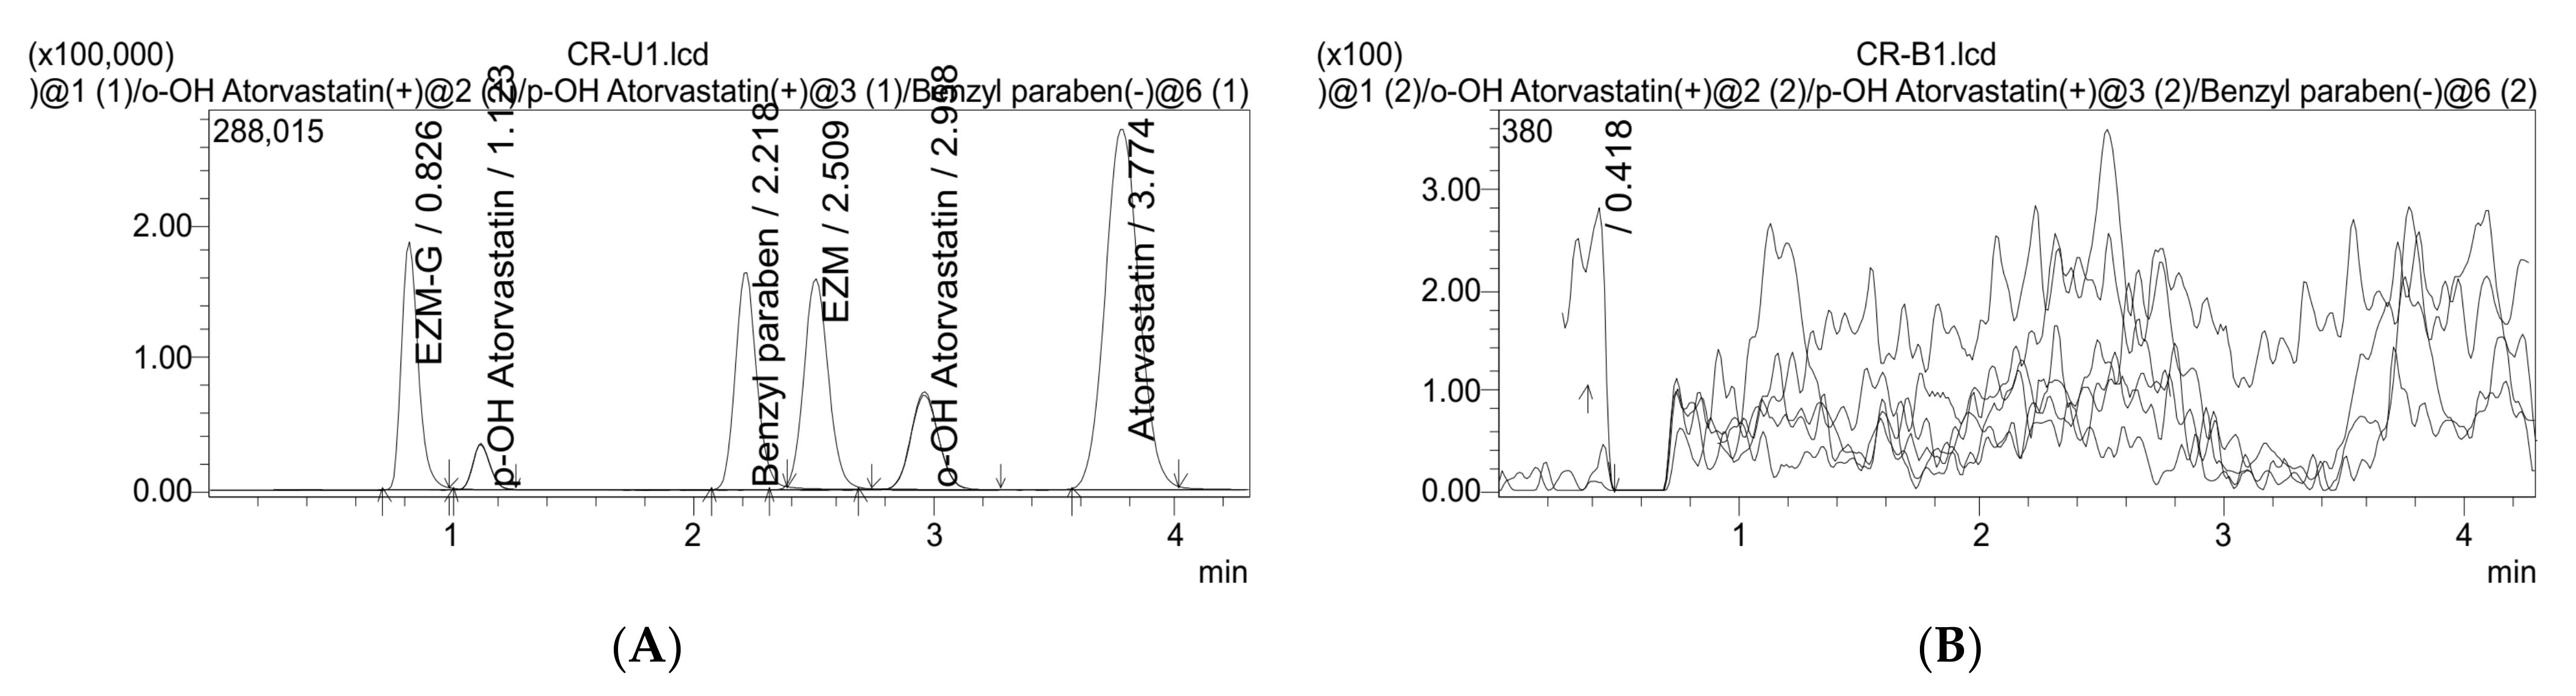
At concentrations of 0.06, 0.600, 0.400, 0.122, and 0.050 ng/mL for EZM, EZM-G, ATOR, o-OH ATOR and p-OH ATOR, respectively, the signal-to-noise ratios were above 5.0, while the results showed good accuracy and precision. Thus, these concentrations were regarded as the LLOQ of the method.

3.3.6. Carry-Over

The chromatogram of the blank sample after ULOQ injection showed no peak at the positions of analytes and IS, providing in Figure 6.

3.3.7. Stability

The stability of analytes and IS was extensively evaluated in stock solutions, plasma samples, and wet extract samples under different storage conditions.
Both stock solutions and plasma samples were kept stable after being stressed in bench-top condition at room temperature for up to 6 h, as well as after storage for a minimum of 67 days at ultralow refrigerated temperature (<−70 °C). Plasma samples were also stable after three freeze–thaw cycles. Accuracy and precision results were reliable after the wet extract samples were kept at 15 °C in an autosampler for 45 h.
The results of different stability experiments are shown in Table 4.

3.4. Comparison to Previous Analytical Methods

The important characteristics-based advantages of the proposed SALLE-LC-MS/MS method compared to some previously reported methods are shown in Table 5. The most remarkable advantage of our method is its ability to simultaneously quantify five analytes with only one sample preparation step and without deconjugation. As a result, the method could save sample volume and sample preparation time. Moreover, all analytes showed high and stable extraction efficiency, making the method sensitive and reproducible.

4. Conclusions

The bioanalytical method presented in this study is of significant importance in terms of evaluating drug efficacy and safety. Accurate and reliable measurements of drug levels in biological fluids are crucial for developing, approving, and assessing new drugs, especially fixed-dose combination drugs like ATOR/EZM, which require precise control of component levels to achieve optimal therapeutic outcomes.
The developed method overcomes challenges associated with simultaneous quantification of multiple analytes in complex matrices, such as human plasma. High recovery rates and minimized matrix effects were achieved by carefully optimizing chromatographic and extraction conditions. Additionally, a simple and cost-effective liquid–liquid extraction technique was utilized, eliminating the need for deconjugation and reducing the risk of sample contamination.
The validation results of the method meet the stringent requirements set by the FDA for bioanalytical methods. In summary, this method provides a valuable tool for use in assessing the bioequivalence of the ATOR/EZM fixed-dose combination. Enhancing the accuracy and reliability of drug measurements ensures that patients receive safer and more effective treatments.

Author Contributions

Conceptualization, N.N.C. and T.D.N.; data curation, N.N.C.; formal analysis, T.N.N.L.; investigation, T.N.N.L.; methodology, T.N.N.L.; project administration, N.N.C.; supervision, T.D.N.; validation, T.N.N.L.; writing—original draft, T.N.N.L.; writing—review and editing, N.N.C. and T.D.N. All authors have read and agreed to the published version of the manuscript.

Funding

This study was financially supported by University of Medicine and Pharmacy at Ho Chi Minh City.

Data Availability Statement

The data presented in this study are available upon request.

Acknowledgments

We would like to thank University of Medicine and Pharmacy at Ho Chi Minh City, Vietnam and colleagues at Institute of Drug Quality Control Ho Chi Minh City, Vietnam for supporting the study.

Conflicts of Interest

The authors declare no conflict of interest.

References

  1. Grundy, S.M.; Stone, N.J.; Bailey, A.L.; Beam, C.; Birtcher, K.K.; Blumenthal, R.S.; Lynne, T.; De Ferranti, S.; Faiella-Tommasino, J.; Forman, D.E.; et al. AHA/ACC/AACVPR/AAPA/ABC/ACPM/ADA/AGS/APhA/ASPC/NLA/PCNA guideline on the management of blood cholesterol: A report of the American College of Cardiology/American Heart Association Task Force on Clinical Practice Guidelines. Circulation 2019, 139, e1082–e1143. [Google Scholar]
  2. Lennernäs, H. Clinical pharmacokinetics of atorvastatin. Clin. Pharmacokinet. 2003, 42, 1141–1160. [Google Scholar] [CrossRef] [PubMed]
  3. FDA. Draft Guidance on Atorvastatin Calcium and Ezetimibe; FSA: Silver Spring, ML, USA, 2014.
  4. Kosoglou, T.; Statkevich, P.; Johnson-Levonas, A.; Paolini, J.; Bergman, A.; Alton, K. Ezetimibe: A review of its metabolism, pharmacokinetics and drug interactions. Clin. Pharmacokinet. 2005, 44, 467–494. [Google Scholar] [CrossRef] [PubMed]
  5. EMA. Ezetimibe Tablet 10 mg Product Specific Bioequivalence Guidance; EMA: Amsterdam, The Netherlands, 2019.
  6. Macwan, J.S.; Ionita, I.; Dostalek, M.; Akhlaghi, F. Development and validation of a sensitive, simple, and rapid method for simultaneous quantitation of atorvastatin and its acid and lactone metabolites by liquid chromatography-tandem mass spectrometry (LC-MS/MS). Anal. Bioanal. Chem. 2011, 400, 423–433. [Google Scholar] [CrossRef]
  7. Ghosh, C.; Jain, I.; Gaur, S.; Patel, N.; Upadhyay, A.; Chakraborty, B. Simultaneous estimation of atorvastatin and its two metabolites from human plasma by ESI-LC-MS/MS. Drug Test. Anal. 2011, 3, 352–362. [Google Scholar] [CrossRef]
  8. El-Zailik, A.; Cheung, L.; Wang, Y.; Sherman, V.; Chow, D.S.-L. Simultaneous LC–MS/MS analysis of simvastatin, atorvastatin, rosuvastatin and their active metabolites for plasma samples of obese patients underwent gastric bypass surgery. J. Pharm. Biomed. Anal. 2019, 164, 258–267. [Google Scholar] [CrossRef]
  9. Hermann, M.; Christensen, H.; Reubsaet, J.L.E. Determination of atorvastatin and metabolites in human plasma with solid-phase extraction followed by LC–tandem MS. Anal. Bioanal. Chem. 2005, 382, 1242–1249. [Google Scholar] [CrossRef]
  10. Nirogi, R.V.S.; Kandikere, V.N.; Shukla, M.; Mudigonda, K.; Maurya, S.; Boosi, R.; Anjaneyulu, Y. Simultaneous quantification of atorvastatin and active metabolites in human plasma by liquid chromatography–tandem mass spectrometry using rosuvastatin as internal standard. Biomed. Chromatogr. 2006, 3, 924–936. [Google Scholar] [CrossRef]
  11. Partani, P.; Verma, M.; Gurule, S.; Khuroo, A.; Monif, T. Simultaneous quantitation of atorvastatin and its two active metabolites in human plasma by liquid chromatography/(–) electrospray tandem mass spectrometry. J. Pharm. Anal. 2014, 4, 26–36. [Google Scholar] [CrossRef] [Green Version]
  12. Zhou, Y.; Li, J.; He, X.; Jia, M.; Liu, M.; Li, H.; Xiong, Z.; Fan, Y.; Li, W. Development and validation of a liquid chromatography–tandem mass spectrometry method for simultaneous determination of amlodipine, atorvastatin and its metabolites ortho-hydroxy atorvastatin and para-hydroxy atorvastatin in human plasma and its application in a bioequivalence study. J. Pharm. Biomed. Anal. 2013, 83, 101–107. [Google Scholar] [CrossRef]
  13. Borek-Dohalský, V.; Huclová, J.; Barrett, B.; Nemec, B.; Ulc, I.; Jelínek, I. Validated HPLC–MS–MS method for simultaneous determination of atorvastatin and 2-hydroxyatorvastatin in human plasma—Pharmacokinetic study. Anal. Bioanal. Chem. 2006, 386, 275–285. [Google Scholar] [CrossRef] [PubMed]
  14. Crevar-Sakač, M.; Vujić, Z.; Brborić, J.; Kuntić, V.; Uskoković-Marković, S. An improved HPLC method with the aid of a chemometric protocol: Simultaneous determination of atorvastatin and its metabolites in plasma. Molecules 2013, 18, 2469–2482. [Google Scholar] [CrossRef] [PubMed] [Green Version]
  15. Cai, L.; Zheng, Z.; Wang, X.; Tang, L.; Mai, L.; He, G.; Lei, H.; Zhong, S. Simultaneous determination of atorvastatin and its metabolites in human plasma by UPLC-MS/MS. Anal. Methods 2017, 9, 1038–1045. [Google Scholar] [CrossRef]
  16. Yang, Y.; Xu, Q.; Zhou, L.; Zhong, D.; Chen, X. High-throughput salting-out-assisted liquid–liquid extraction for the simultaneous determination of atorvastatin, ortho-hydroxyatorvastatin, and para-hydroxyatorvastatin in human plasma using ultrafast liquid chromatography with tandem mass spectrometry. J. Sep. Sci. 2015, 38, 1026–1034. [Google Scholar] [CrossRef]
  17. Bahrami, G.; Mohammadi, B.; Khatabi, P.M.; Farzaei, M.H.; Majnooni, M.B.; Bahoosh, S.R. Application of one-step liquid chromatography–electrospray tandem MS/MS and collision-induced dissociation to quantification of ezetimibe and identification of its glucuronated metabolite in human serum: A pharmacokinetic study. J. Chromatogr. B 2010, 878, 2789–2795. [Google Scholar] [CrossRef]
  18. Bae, J.-W.; Choi, C.-I.; Park, S.-H.; Jang, C.-G.; Lee, S.-Y. Analytical LC-MS/MS method for ezetimibe and its application for pharmacokinetic study. J. Liq. Chromatogr. Relat. Technol. 2012, 35, 141–152. [Google Scholar] [CrossRef]
  19. Danafar, H.; Hamidi, M. A rapid and sensitive LC–MS method for determination of ezetimibe concentration in human plasma: Application to a bioequivalence study. Chromatographia 2013, 76, 1667–1675. [Google Scholar] [CrossRef]
  20. Guo, L.; Wang, M.-M.; He, M.; Qiu, F.-R.; Jiang, J. Simultaneous determination of ezetimibe and its glucuronide metabolite in human plasma by solid phase extraction and liquid chromatography–tandem mass spectrometry. J. Chromatogr. B 2015, 986, 108–114. [Google Scholar] [CrossRef]
  21. Abdelbary, G.; Nebsen, M. Application of a novel UPLC-MS/MS method for the pharmacokinetic/bioequivalence determination of atorvastatin and ezetimibe in human plasma. J. Pharm. Res. 2013, 7, 24–32. [Google Scholar] [CrossRef]
  22. Gowda, K.V.; Rajan, D.S.; Mandal, U.; Solomon, W.D.S.; Selvan, P.S.; Bose, A.; Sarkar, A.K.; Chattaraj, T.K.; Pal, T.K. Bioequivalence Study of Fixed Dose Combination of Atorvastatin and Ezetimibe Tablet in Healthy Volunteers by LC-MS/MS Method. Asian J. Chem. 2007, 19, 1293–1300. [Google Scholar]
  23. El-Bagary, R.I.; Elkady, E.F.; El-Sherif, Z.A.; Kadry, A.M. LC–MS–MS Simultaneous Determination of Atorvastatin and Ezetimibe in Human Plasma. J. Chromatogr. Sci. 2013, 52, 773–780. [Google Scholar] [CrossRef] [Green Version]
  24. Munaga, S.B.; Valluru, R.K.; Bonga, P.B.R.; Rao, S.; Sharma, H.K. Development and validation of an LC–MS-MS method for the simultaneous determination of simvastatin, simvastatin acid and ezetimibe in human plasma and its application to pharmacokinetic study in the Indian population. J. Chromatogr. Sci. 2016, 54, 985–996. [Google Scholar] [CrossRef] [Green Version]
  25. Elawady, T.; Ibrahim, F.; Khedr, A.; Belal, F. Simultaneous determination of ezetimibe, atorvastatin and simvastatin using quadrupole LC-MS: Application to combined tablets and plasma after SPE. Acta Chromatogr. 2021, 33, 245–252. [Google Scholar] [CrossRef]
  26. Ashfaq, M.; Ahmad, H.; Khan, I.U.; Mustafa, G. LC determination of rosuvastatin and ezetimibe in human plasma. J. Chil. Chem. Soc. 2013, 58, 2177–2181. [Google Scholar] [CrossRef] [Green Version]
  27. Bhadoriya, A.; Sanyal, M.; Shah, P.A.; Shrivastav, P.S. Simultaneous quantitation of rosuvastatin and ezetimibe in human plasma by LC–MS/MS: Pharmacokinetic study of fixed-dose formulation and separate tablets. Biomed. Chromatogr. 2018, 32, e4291. [Google Scholar] [CrossRef] [PubMed]
  28. Varghese, S.J.; Kochupappy, R.T. Development and validation of a liquid chromatography/mass spectrometry method for the simultaneous quantitation of rosuvastatin and ezetimibe in human plasma. J. AOAC Int. 2013, 96, 307–312. [Google Scholar] [CrossRef] [PubMed]
  29. Elkady, E.F.; Jaadan, B.M.; Ramadan, E.; Elmaaty, A.A. Bioanalytical LC–MS/MS method for simultaneous estimation of atorvastatin, its major active metabolites and ezetimibe. Bioanalysis 2022, 14, 1349–1363. [Google Scholar] [CrossRef]
  30. Zhang, J.; Wu, H.; Kim, E.; El-Shourbagy, T. Salting-out assisted liquid/liquid extraction with acetonitrile: A new high throughput sample preparation technique for good laboratory practice bioanalysis using liquid chromatography–mass spectrometry. Biomed. Chromatogr. 2009, 23, 419–425. [Google Scholar] [CrossRef] [PubMed]
  31. Tang, Y.Q.; Weng, N. Salting-out assisted liquid–liquid extraction for bioanalysis. Bioanalysis 2013, 5, 1583–1598. [Google Scholar] [CrossRef] [PubMed]
  32. FDA. Guidance for Industry: Bioanalytical Method Validation; FSA: Silver Spring, ML, USA, 2018.
  33. EMA. Guideline on Bioanalytical Method Validation; EMA: Amsterdam, The Netherlands, 2015.
Figure 1. Extraction procedure.
Separations 10 00409 g001
Figure 2. Proposed fragmentation mechanism for EZM and EZM-G.
Separations 10 00409 g002
Figure 3. Proposed fragmentation mechanism for ATOR (center), o-OH ATOR (right) and p-OH ATOR (left).
Separations 10 00409 g003
Figure 4. Extraction efficiency (RE) and matrix factor (MX) after plasma samples were extracted via PPT (A), LLE (B), and SALLE (C).
Separations 10 00409 g004
Figure 5. Chromatograms of blank plasma sample and Low Limit of Qualification (LLOQ)and Medium Quality Control (MQC) level plasma samples.
Separations 10 00409 g005
Figure 6. Chromatograms of the blank sample (B) after Upper Limit of Qualification (ULOQ) injection (A).
Separations 10 00409 g006
Table 1. Critical tandem mass spectrometer parameters.
AnalytesSourcesParent Ions (m/z)CE
(V)
Daughter Ions (m/z)
Quantitative IonsReference Ions
EZMESI (−) 40817271284, 214, 175
EZM-GESI (−)58431271284, 214, 175
ATORESI (+) 559−23440380, 292, 250
o-OH ATORESI (+) 575−24440380, 292, 250
p-OH ATORESI (+) 575−24440380, 292, 250
Table 2. Linearity for analytes in human plasma.
AnalyteRange
(ng/mL)
Equation y ^ = ax + b, Weighting Factor 1/x2
abR2
EZM0.06–150.06880.00070.9974
EZM-G0.6–1500.0060−0.00010.9941
ATOR0.4–1000.0265−0.00080.9951
o-OH ATOR0.12–300.0147−0.00030.9959
p-OH ATOR0.05–30.0595−0.00010.9932
Table 3. Accuracy, precision, recovery, and matrix effect of all analytes and IS.
AnalyteConc. Added (ng/mL)Accuracy (%)
Mean (CV)
Recovery (n = 6) (%)Matrix Effect (n = 6)
Intraday
(n = 6)
Interday
(3 days, n = 18)
MF (%)IS-Normalized MFs (%)
EZM0.061111.69 (5.86)98.77 (11.79)---
0.184105.77 (4.69)103.09 (6.01)68.57 ± 1.91106.58 ± 9.47113.5 ± 9.46
7.664103.17 (1.66)101.49 (2.20)82.62 ± 3.86--
12.263102.17 (1.89)101.28 (3.61)82.07 ± 3.2890.98 ± 1.82100.56 ± 2.19
EZM-G0.600102.32 (6.65)97.09 (8.84)-
1.80196.13 (3.33)99.91 (5.76)91.50 ± 5.1985.94 ± 1.1375.72 ± 5.99
75.02996.19 (2.41)95.29 (2.33)85.61 ± 4.80 -
120.04696.42 (2.99)94.45 (2.78)87.10 ± 2.6891.30 ± 1.8890.79 ± 2.35
ATOR0.400112.68 (4.05)104.52 (7.73)---
1.20099.00 (3.86)103.06 (5.66)82.09 ± 4.23104.03 ± 1.95110.78 ± 2.95
50.00098.53 (1.62)102.79 (3.33)81.48 ± 4.26--
79.99996.56 (2.81)100.98 (5.39)81.39 ± 3.0998.24 ± 1.74108.59 ± 2.25
o-OH ATOR0.122103.51 (14.18)99.17 (11.50)---
0.366107.71 (4.47)102.80 (7.43)74.37 ± 3.27103.11 ± 3.5893.07 ± 3.08
15.261113.82 (0.38)108.33 (6.83)75.37 ± 4.13--
24.418111.33 (2.31)107.12 (5.75)77.36 ± 3.5599.76 ± 1.7391.87 ± 1.14
p-OH ATOR0.05098.56 (5.22)101.98 (6.18)---
0.14998.80 (4.31)100.76 (7.85)80.69 ± 4.27129.18 ± 5.11137.56 ± 5.67
1.54892.51 (1.81)101.24 (8.19)80.13 ± 4.80--
2.47689.56 (0.75)101.46 (9.99)83.02 ± 2.11129.28 ± 1.32142.9 ± 0.86
IS50.000 80.01 ± 3.35 *92.19 ± 1.93 **-
* n = 18; ** n = 12.
Table 4. Stability of analytes and IS in stock standard, plasma, and wet extraction.
CompoundStock Standard SolutionPlasmaWet Extraction
Conc. (μg/mL)Bench-TopLong-TermConc. (ng/mL)Bench-TopFreeze-ThawLong-Term45 h at 15 °C in an Autosampler
EZM187.5100.52 (0.82)100.80 (0.92)0.184104.07
(4.45)
106.50
(4.92)
103.86
(6.74)
103.78
(3.17)
12.263104.91
(0.75)
104.54
(1.06)
100.52
(0.71)
105.45
(1.34)
EZM-G10094.23 (2.66)106.14 (0.89)1.80193.76
(3.47)
93.96
(5.44)
98.06
(3.58)
97.92
(5.02)
120.04693.64
(1.59)
92.86
(1.49)
100.70
(2.09)
92.30
(2.43)
ATOR500103.16 (2.13)99.88 (0.67)1.200100.87
(2.86)
102.03
(2.98)
98.61
(1.71)
106.52
(3.98)
79.999105.99
(0.62)
106.44
(1.03)
99.80
(4.77)
107.29
(0.85)
o-OH ATOR6098.66 (2.76)100.81 (0.71)0.36694.46
(4.53)
94.54
(3.64)
88.88
(91.61)
92.62
(5.47)
24.41897.09
(0.59)
96.53
(1.11)
103.76
(6.70)
97.36
(1.35)
p-OH ATOR120101.50 (5.34)106.08 (1.36)0.149100.57
(6.75)
92.98
(7.24)
100.39
(2.51)
101.55
(8.08)
2.476100.04
(2.30)
99.54
(1.04)
108.85
(2.27)
99.45
(2.16)
IS100101.88 (2.03)98.97 (1.00)50---97.47
(1.06)
Table 5. Comparison between the proposed SALLE-LC-MS/MS method and some reported methods.
Refs.Run TimeExtraction TechniqueAnalyteLLOQ (ng/mL)Extraction Efficiency (%)Matrix Effect
MFMF/ISCV
[6]7 minPPTATOR0.0588.6–111Not available
o-OH ATOR0.05Not available
p-OH ATOR0.05Not available
[7]3.5 minSPEATOR0.0566.18 97.51–98.7-0.96–4.22
o-OH ATOR0.0545.3698.90–101.12-1.32–4.10
p-OH ATOR0.0554.01 94.42–100.19-1.12–4.48
[8]5 minLLEATOR0.2596.94–100.3797.45–110.42--
o-OH ATOR0.2592.15–97.7196.50–102.93--
p-OH ATOR0.2596.97–99.1796.60–101.84--
[9]20 minSPEATOR0.553–78 Not available
o-OH ATOR1Not available
p-OH ATOR0.5Not available
[10]3 minLLEATOR0.151.0–57.3Not available
o-OH ATOR0.146.8–54.3Not available
p-OH ATOR0.161.6–68.8Not available
[11]6 minSPEATOR0.0576.3–78.092–94101–106<4.9
o-OH ATOR0.0573.1–75.192.9799–1014.9
p-OH ATOR0.0572.6–75.7105–10896–1054.9
[12]6 minLLEATOR0.03577.23–82.6999.34–101.25-1.44–4.77
o-OH ATOR0.0276.39–81.9690.29–97.61-1.58–8.3
p-OH ATOR0.01578.24–80.2995.74–97.61-4.31–5.03
[13]8 minLLEATOR0.0291.5--10.5
o-OH ATOR0.0783.7--12.5
[14]9 minSPEATORNot testedNot testedNot tested--
o-OH ATORNot testedNot testedNot tested--
[15]4 minLLEATOR0.247.9–49.2102.7–105.5--
o-OH ATOR0.249.2–50.5103.4–107.0--
p-OH ATOR0.227.8–31.2101.0–102.9--
[16]2 minSALLEATOR0.0281.1–94.0-93.9–101<7.2
o-OH ATOR0.0285.6–89.0-92.6–101<7.2
p-OH ATOR0.0189.9–102-93.6–97<7.2
[17]5 minPPTEZM10----
EZM-GIdentification----
[18]4.5 minLLEEZM0.07561.6->93.7 -
LLE following deconjugation Total EZM142.0->93.7-
[19]10 minLLEEZM0.0596.21–97.27Not available
[20]5.5 minSPEEZM0.165.3–72.287.0–104.8-<7.0
EZM-G0.558.6–61.291.9–102.1-<7.0
[21]1.2 minLLEATOR0.194.4–95.8Not tested
EZM0.192.6–95.0Not tested
[22]--ATOR-Not testedNot tested
EZM-Not testedNot tested
[23]5 minLLEATOR0.275.07–76.0696.58–97.90--
EZM0.268.89–70.49101.32–103.61--
[29] LLEATOR0.584.94--2.43–6.05
o-OH ATOR0.585.46--0.72–2.42
p-OH ATOR0.2105.46--0.98–6.99
EZM0.285.2--1.63–2.16
This study4.3 minSALLEATOR0.481.39–82.0998.24–104.03108.59–110.782.08–2.66
o-OH ATOR0.1274.37–77.3699.76–103.1191.87–93.071.97–4.12
p-OH ATOR0.0580.13–83.02129.18–129.28137.56–142.90.60–4.12
EZM0.0668.57–82.6290.98–106.58100.56–113.52.18–8.34
EZM-G0.685.61–91.5085.94–91.3075.72–90.791.89–2.27
Disclaimer/Publisher’s Note: The statements, opinions and data contained in all publications are solely those of the individual author(s) and contributor(s) and not of MDPI and/or the editor(s). MDPI and/or the editor(s) disclaim responsibility for any injury to people or property resulting from any ideas, methods, instructions or products referred to in the content.

