
Fractions of Methanol Extracts from the Resurrection Plant Haberlea rhodopensis Have Anti-Breast Cancer Effects in Model Cell Systems
 , , and
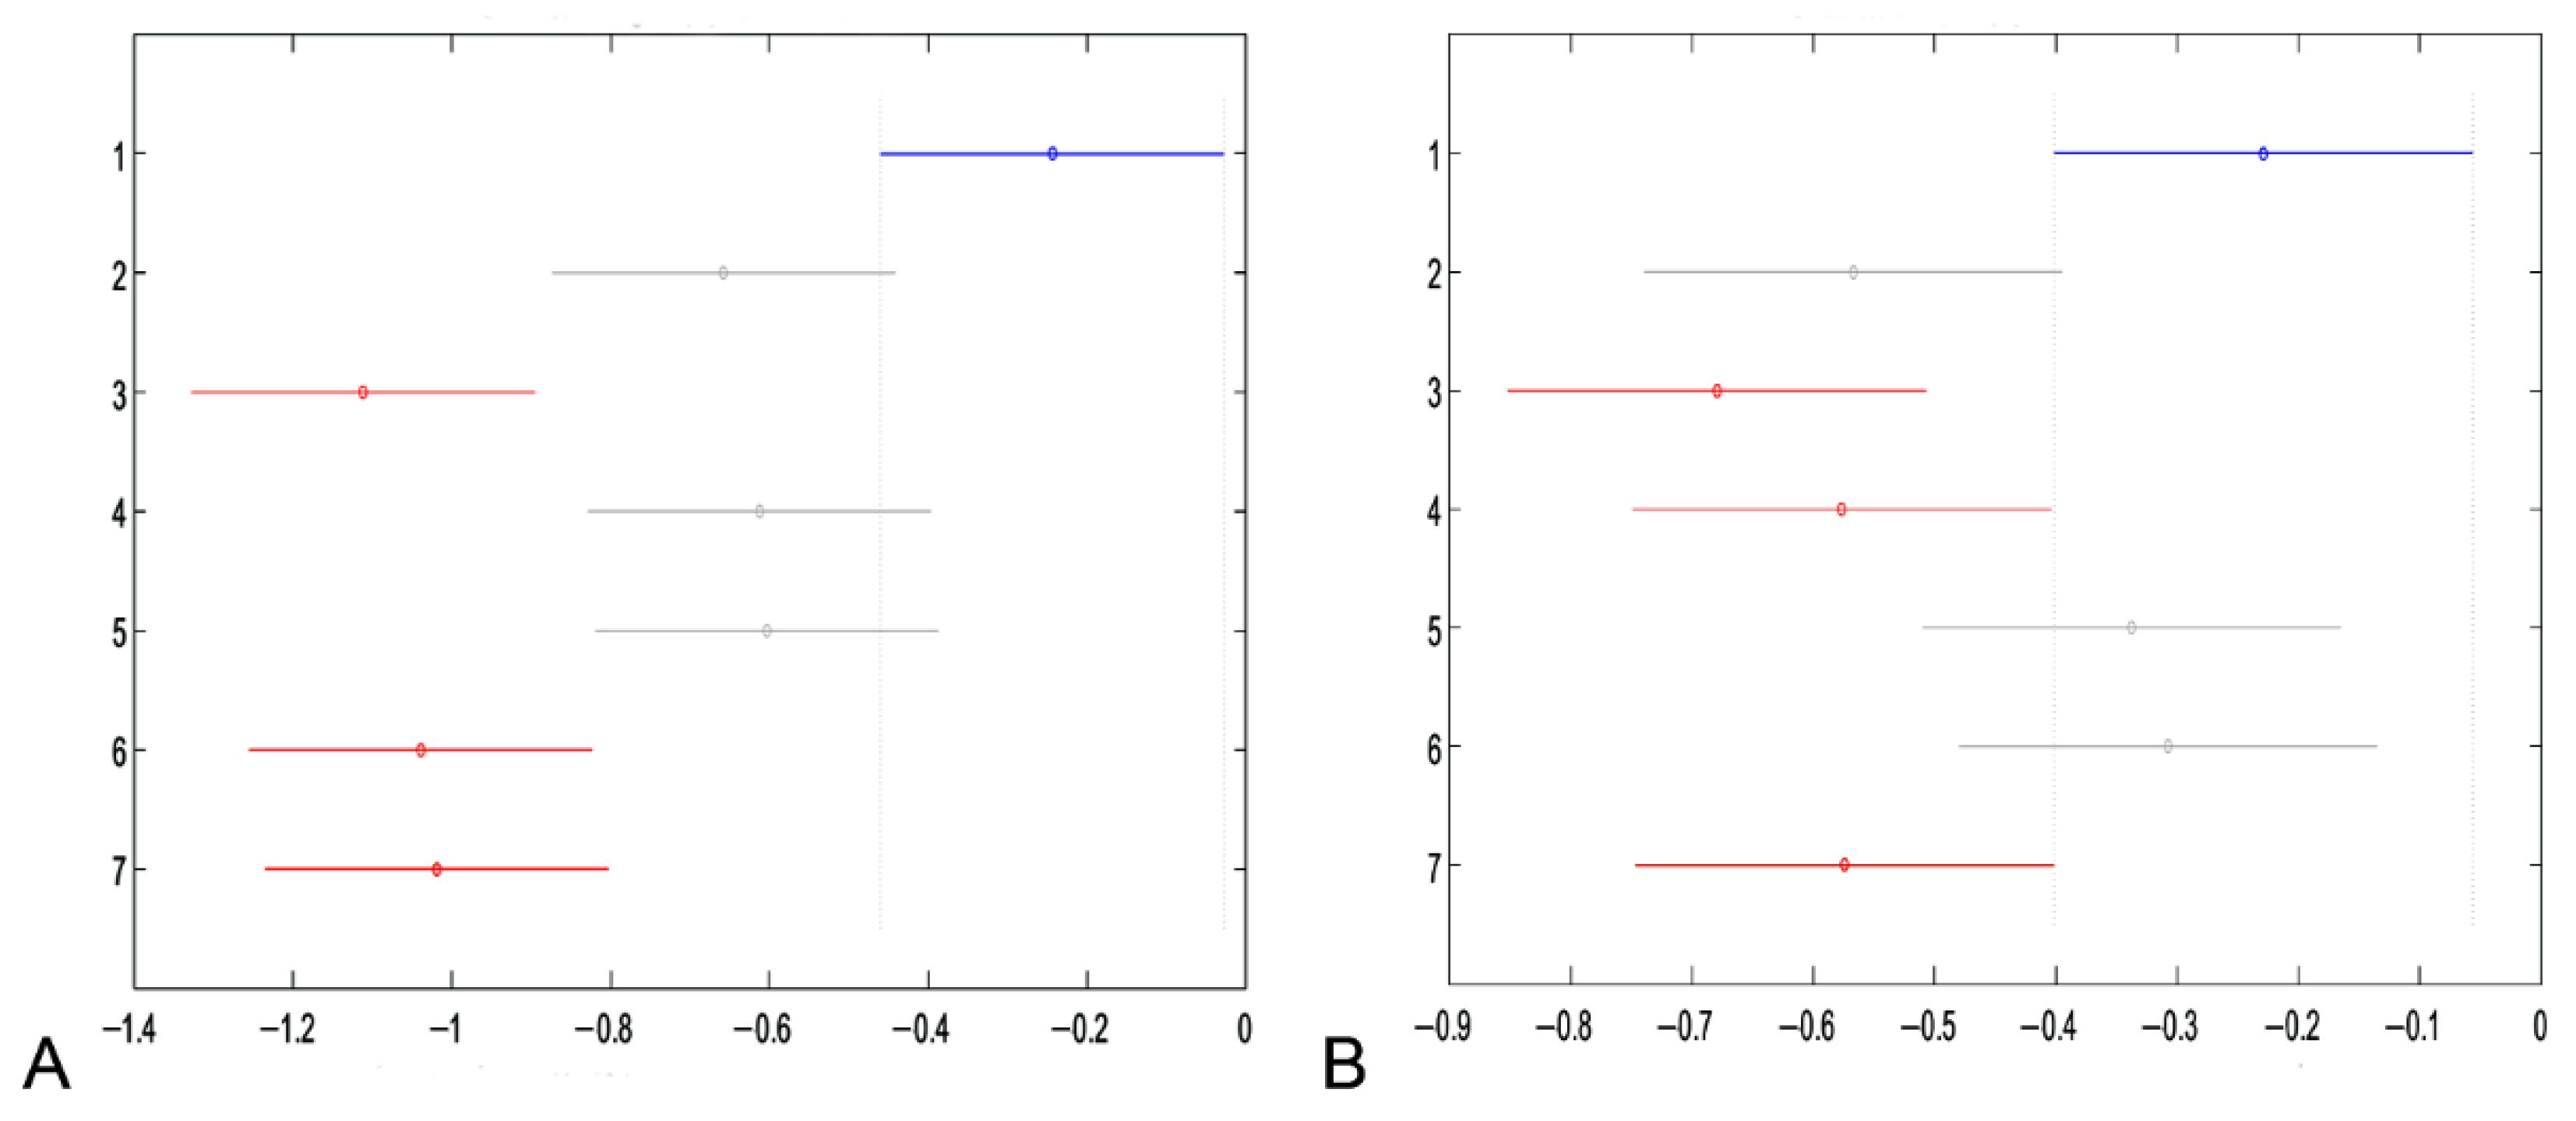
Abstract
:1. Introduction
2. Materials and Methods
2.1. Chemicals and Reagents
2.2. Plant Material and Leaf Extract Preparation and Fractionation by Size Exclusion Chromatography
2.3. Cell Cultures Treatments and Cell Culture Assay Tests
2.3.1. Cell Lines
2.3.2. MTT Cell Viability Assay
2.3.3. Proliferation Assay
2.3.4. Statistical Methods
2.4. Compound Identification
2.4.1. Semi-Preparative HPLC
2.4.2. 1H NMR
2.4.3. LC-MS/MS
2.5. Molecular Docking
3. Results
3.1. Cell Viability and Cell Proliferation
3.1.1. Cell Viability after Treatment with Haberlea rhodopensis Extracts and Fractions
3.1.2. Cell Proliferation Assay after Treatment with Two Selected Fractions
3.2. Identification of Phytoactive Compounds in Plant Extract
3.3. Docking Analysis of Myconoside with Breast Cancer Proteins
4. Discussion
4.1. Potential Role of Myconoside
4.2. Potential Role of Hispidulin 8-C-(6-O-acetyl-2″-O-syringoyl-β-glu-copyranoside)
5. Conclusions
Supplementary Materials
Author Contributions
Funding
Data Availability Statement
Acknowledgments
Conflicts of Interest
References
- Lancet, T. Breast Cancer in Developing Countries. Lancet 2009, 374, 1567. [Google Scholar] [CrossRef]
- Arnold, M.; Morgan, E.; Rumgay, H.; Mafra, A.; Singh, D.; Laversanne, M.; Vignat, J.; Gralow, J.R.; Cardoso, F.; Siesling, S.; et al. Current and Future Burden of Breast Cancer: Global Statistics for 2020 and 2040. Breast 2022, 66, 15–23. [Google Scholar] [CrossRef]
- Breast Cancer Facts & Statistics 2023. Available online: https://www.breastcancer.org/facts-statistics (accessed on 27 March 2023).
- Shrihastini, V.; Muthuramalingam, P.; Adarshan, S.; Sujitha, M.; Chen, J.-T.; Shin, H.; Ramesh, M. Plant Derived Bioactive Compounds, Their Anti-Cancer Effects and In Silico Approaches as an Alternative Target Treatment Strategy for Breast Cancer: An Updated Overview. Cancers 2021, 13, 6222. [Google Scholar] [CrossRef] [PubMed]
- George, B.P.A.; Abrahamse, H. A Review on Novel Breast Cancer Therapies: Photodynamic Therapy and Plant Derived Agent Induced Cell Death Mechanisms. Anticancer Agents Med. Chem. 2016, 16, 793–801. [Google Scholar] [CrossRef]
- Barbosa, A.M.; Martel, F. Targeting Glucose Transporters for Breast Cancer Therapy: The Effect of Natural and Synthetic Compounds. Cancers 2020, 12, 154. [Google Scholar] [CrossRef] [PubMed] [Green Version]
- Yu, L.; Liang, Y.; Cao, X.; Wang, X.; Gao, H.; Lin, S.-Y.; Schiff, R.; Wang, X.-S.; Li, K. Identification of MYST3 as a Novel Epigenetic Activator of ERα Frequently Amplified in Breast Cancer. Oncogene 2017, 36, 2910–2918. [Google Scholar] [CrossRef] [PubMed]
- Ali Abdalla, Y.O.; Subramaniam, B.; Nyamathulla, S.; Shamsuddin, N.; Arshad, N.M.; Mun, K.S.; Awang, K.; Nagoor, N.H. Natural Products for Cancer Therapy: A Review of Their Mechanism of Actions and Toxicity in the Past Decade. J. Trop. Med. 2022, 2022, e5794350. [Google Scholar] [CrossRef] [PubMed]
- Lopes, C.M.; Dourado, A.; Oliveira, R. Phytotherapy and Nutritional Supplements on Breast Cancer. BioMed Res. Int. 2017, 2017, e7207983. [Google Scholar] [CrossRef]
- Mazurakova, A.; Koklesova, L.; Samec, M.; Kudela, E.; Kajo, K.; Skuciova, V.; Csizmár, S.H.; Mestanova, V.; Pec, M.; Adamkov, M.; et al. Anti-Breast Cancer Effects of Phytochemicals: Primary, Secondary, and Tertiary Care. EPMA J. 2022, 13, 315–334. [Google Scholar] [CrossRef]
- Küpeli Akkol, E.; Genç, Y.; Karpuz, B.; Sobarzo-Sánchez, E.; Capasso, R. Coumarins and Coumarin-Related Compounds in Pharmacotherapy of Cancer. Cancers 2020, 12, 1959. [Google Scholar] [CrossRef]
- Li, Z.; Li, J.; Mo, B.; Hu, C.; Liu, H.; Qi, H.; Wang, X.; Xu, J. Genistein Induces Cell Apoptosis in MDA-MB-231 Breast Cancer Cells via the Mitogen-Activated Protein Kinase Pathway. Toxicol. In Vitro 2008, 22, 1749–1753. [Google Scholar] [CrossRef] [PubMed]
- Melo, J.O.; Fachin, A.L.; Rizo, W.F.; Jesus, H.C.R.; Arrigoni-Blank, M.F.; Alves, P.B.; Marins, M.A.; França, S.C.; Blank, A.F. Cytotoxic Effects of Essential Oils from Three Lippia Gracilis Schauer Genotypes on HeLa, B16, and MCF-7 Cells and Normal Human Fibroblasts. Genet. Mol. Res. 2014, 13, 2691–2697. [Google Scholar] [CrossRef]
- Woo, C.C.; Hsu, A.; Kumar, A.P.; Sethi, G.; Tan, K.H.B. Thymoquinone Inhibits Tumor Growth and Induces Apoptosis in a Breast Cancer Xenograft Mouse Model: The Role of P38 MAPK and ROS. PLoS ONE 2013, 8, e75356. [Google Scholar] [CrossRef] [PubMed] [Green Version]
- Borges, R.M.; Resende, J.V.M.; Pinto, A.P.; Garrido, B.C. Exploring Correlations between MS and NMR for Compound Identification Using Essential Oils: A Pilot Study. Phytochem. Anal. 2022, 33, 533–542. [Google Scholar] [CrossRef]
- Leggett, A.; Wang, C.; Li, D.-W.; Somogyi, A.; Bruschweiler-Li, L.; Brüschweiler, R. Identification of Unknown Metabolomics Mixture Compounds by Combining NMR, MS, and Cheminformatics. Methods Enzymol. 2019, 615, 407–422. [Google Scholar] [CrossRef] [PubMed]
- Gaff, D.F.; Oliver, M. The Evolution of Desiccation Tolerance in Angiosperm Plants: A Rare yet Common Phenomenon. Funct Plant Biol. 2013, 40, 315–328. [Google Scholar] [CrossRef]
- Dinakar, C.; Bartels, D. Desiccation Tolerance in Resurrection Plants: New Insights from Transcriptome, Proteome and Metabolome Analysis. Front. Plant Sci. 2013, 4, 482. [Google Scholar] [CrossRef] [Green Version]
- Legardón, A.; García-Plazaola, J.I. Gesneriads, a Source of Resurrection and Double-Tolerant Species: Proposal of New Desiccation- and Freezing-Tolerant Plants and Their Physiological Adaptations. Biology 2023, 12, 107. [Google Scholar] [CrossRef]
- Ivanova, A.; O′Leary, B.; Signorelli, S.; Falconet, D.; Moyankova, D.; Whelan, J.; Djilianov, D.; Murcha, M.W. Mitochondrial Activity and Biogenesis during Resurrection of Haberlea rhodopensis. New Phytol. 2022, 236, 943–957. [Google Scholar] [CrossRef]
- Liu, J.; Moyankova, D.; Lin, C.-T.; Mladenov, P.; Sun, R.-Z.; Djilianov, D.; Deng, X. Transcriptome Reprogramming during Severe Dehydration Contributes to Physiological and Metabolic Changes in the Resurrection Plant Haberlea rhodopensis. BMC Plant Biol. 2018, 18, 351. [Google Scholar] [CrossRef]
- Mladenov, P.; Zasheva, D.; Planchon, S.; Leclercq, C.C.; Falconet, D.; Moyet, L.; Brugière, S.; Moyankova, D.; Tchorbadjieva, M.; Ferro, M.; et al. Proteomics Evidence of a Systemic Response to Desiccation in the Resurrection Plant Haberlea rhodopensis. Int. J. Mol. Sci. 2022, 23, 8520. [Google Scholar] [CrossRef] [PubMed]
- Vassileva, V.; Moyankova, D.; Dimitrova, A.; Mladenov, P.; Djilianov, D. Assessment of Leaf Micromorphology after Full Desiccation of Resurrection Plants. Plant Biosyst. 2019, 153, 108–117. [Google Scholar] [CrossRef]
- Mladenov, P.; Finazzi, G.; Bligny, R.; Moyankova, D.; Zasheva, D.; Boisson, A.-M.; Brugière, S.; Krasteva, V.; Alipieva, K.; Simova, S.; et al. In Vivo Spectroscopy and NMR Metabolite Fingerprinting Approaches to Connect the Dynamics of Photosynthetic and Metabolic Phenotypes in Resurrection Plant Haberlea rhodopensis during Desiccation and Recovery. Front. Plant Sci. 2015, 6, 564. [Google Scholar] [CrossRef] [PubMed] [Green Version]
- Kuroki, S.; Tsenkova, R.; Moyankova, D.; Muncan, J.; Morita, H.; Atanassova, S.; Djilianov, D. Water Molecular Structure Underpins Extreme Desiccation Tolerance of the Resurrection Plant Haberlea rhodopensis. Sci. Rep. 2019, 9, 3049. [Google Scholar] [CrossRef] [PubMed] [Green Version]
- Djilianov, D.; Ivanov, S.; Georgieva, T.; Moyankova, D.; Berkov, S.; Petrova, G.; Mladenov, P.; Christov, N.; Hristozova, N.; Peshev, D.; et al. A Holistic Approach to Resurrection Plants. Haberlea rhodopensis —A Case Study. Biotechnol. Biotechnol. Equip. 2009, 23, 1414–1416. [Google Scholar] [CrossRef] [Green Version]
- Hayrabedyan, S.; Todorova, K.; Zasheva, D.; Moyankova, D.; Georgieva, D.; Todorova, J.; Djilianov, D. Haberlea rhodopensis Has Potential as a New Drug Source Based on Its Broad Biological Modalities. Biotechnol. Biotechnol. Equip. 2013, 27, 3553–3560. [Google Scholar] [CrossRef]
- Kostadinova, A.; Doumanov, J.; Moyankova, D.; Ivanov, S.; Mladenova, K.; Djilianov, D.; Topuzova-Hristova, T. Haberlea rhodopensis Extracts Affect Cell Periphery of Keratinocytes. Comptes Rendus Acad. Bulg. Sci. 2016, 69, 439–448. [Google Scholar]
- Moyankova, D.; Hinkov, A.; Shishkov, S.; Djilianov, D. Inhibitory Effect of Extracts from Haberlea rhodopensis Friv. against Herpes Simplex Virus. Comptes Rendus Acad. Bulg. Sci. 2014, 76, 1369–1376. [Google Scholar]
- Spyridopoulou, K.; Kyriakou, S.; Nomikou, A.; Roupas, A.; Ermogenous, A.; Karamanoli, K.; Moyankova, D.; Djilianov, D.; Galanis, A.; Panayiotidis, M.I.; et al. Chemical Profiling, Antiproliferative and Antimigratory Capacity of Haberlea rhodopensis Extracts in an In Vitro Platform of Various Human Cancer Cell Lines. Antioxidants 2022, 11, 2305. [Google Scholar] [CrossRef]
- Djilianov, D.; Genova, G.; Parvanova, D.; Zapryanova, N.; Konstantinova, T.; Atanassov, A. In Vitro Culture of the Resurrection Plant Haberlea rhodopensis. Plant Cell Tiss. Organ Cult. 2005, 80, 115–118. [Google Scholar] [CrossRef]
- Mosmann, T. Rapid Colorimetric Assay for Cellular Growth and Survival: Application to Proliferation and Cytotoxicity Assays. J. Immunol. Methods 1983, 65, 55–63. [Google Scholar] [CrossRef]
- Soprano, M.; Sorriento, D.; Rusciano, M.R.; Maione, A.S.; Limite, G.; Forestieri, P.; D’Angelo, D.; D’Alessio, M.; Campiglia, P.; Formisano, P.; et al. Oxidative Stress Mediates the Antiproliferative Effects of Nelfinavir in Breast Cancer Cells. PLoS ONE 2016, 11, e0155970. [Google Scholar] [CrossRef] [Green Version]
- Standard Error Calculator (High Precision). Available online: https://miniwebtool.com/standard-error-calculator/ (accessed on 27 March 2023).
- One-Way ANOVA Calculator, Plus Tukey HSD. Available online: https://www.socscistatistics.com/tests/anova/default2.aspx (accessed on 27 March 2023).
- Deng, D.; Xu, C.; Sun, P.; Wu, J.; Yan, C.; Hu, M.; Yan, N. Crystal Structure of the Human Glucose Transporter GLUT1. Nature 2014, 510, 121–125. [Google Scholar] [CrossRef] [PubMed]
- Leaver, D.J.; Cleary, B.; Nguyen, N.; Priebbenow, D.L.; Lagiakos, H.R.; Sanchez, J.; Xue, L.; Huang, F.; Sun, Y.; Mujumdar, P.; et al. Discovery of Benzoylsulfonohydrazides as Potent Inhibitors of the Histone Acetyltransferase KAT6A. J. Med. Chem. 2019, 62, 7146–7159. [Google Scholar] [CrossRef]
- Bruning, J.B.; Parent, A.A.; Gil, G.; Zhao, M.; Nowak, J.; Pace, M.C.; Smith, C.L.; Afonine, P.V.; Adams, P.D.; Katzenellenbogen, J.A.; et al. Coupling of Receptor Conformation and Ligand Orientation Determine Graded Activity. Nat. Chem. Biol. 2010, 6, 837–843. [Google Scholar] [CrossRef] [Green Version]
- Morris, G.M.; Huey, R.; Lindstrom, W.; Sanner, M.F.; Belew, R.K.; Goodsell, D.S.; Olson, A.J. AutoDock4 and AutoDockTools4: Automated Docking with Selective Receptor Flexibility. J. Comput. Chem. 2009, 30, 2785–2791. [Google Scholar] [CrossRef] [PubMed] [Green Version]
- Wu, E.L.; Cheng, X.; Jo, S.; Rui, H.; Song, K.C.; Dávila-Contreras, E.M.; Qi, Y.; Lee, J.; Monje-Galvan, V.; Venable, R.M.; et al. CHARMM-GUI Membrane Builder toward Realistic Biological Membrane Simulations. J. Comput. Chem. 2014, 35, 1997–2004. [Google Scholar] [CrossRef] [PubMed] [Green Version]
- Pettersen, E.F.; Goddard, T.D.; Huang, C.C.; Couch, G.S.; Greenblatt, D.M.; Meng, E.C.; Ferrin, T.E. UCSF Chimera—A Visualization System for Exploratory Research and Analysis. J. Comput. Chem. 2004, 25, 1605–1612. [Google Scholar] [CrossRef] [PubMed] [Green Version]
- Amirova, K.M.; Dimitrova, P.A.; Marchev, A.S.; Krustanova, S.V.; Simova, S.D.; Alipieva, K.I.; Georgiev, M.I. Biotechnologically-Produced Myconoside and Calceolarioside E Induce Nrf2 Expression in Neutrophils. Int. J. Mol. Sci. 2021, 22, 1759. [Google Scholar] [CrossRef]
- Ebrahimi, S.N.; Gafner, F.; Dell’Acqua, G.; Schweikert, K.; Hamburger, M. Flavone 8-C-Glycosides from Haberlea rhodopensis Friv. (Gesneriaceae). Helv. Chim. Acta 2011, 94, 38–45. [Google Scholar] [CrossRef]
- Brenton, J.D.; Carey, L.A.; Ahmed, A.A.; Caldas, C. Molecular Classification and Molecular Forecasting of Breast Cancer: Ready for Clinical Application? J. Clin. Oncol. 2005, 23, 7350–7360. [Google Scholar] [CrossRef] [PubMed] [Green Version]
- Demain, A.L.; Vaishnav, P. Natural Products for Cancer Chemotherapy. Microb. Biotechnol. 2011, 4, 687–699. [Google Scholar] [CrossRef] [Green Version]
- Mazumder, K.; Biswas, B.; Raja, I.M.; Fukase, K. A Review of Cytotoxic Plants of the Indian Subcontinent and a Broad-Spectrum Analysis of Their Bioactive Compounds. Molecules 2020, 25, 1904. [Google Scholar] [CrossRef] [PubMed] [Green Version]
- Moyankova, D.; Mladenov, P.; Berkov, S.; Peshev, D.; Georgieva, D.; Djilianov, D. Metabolic Profiling of the Resurrection Plant Haberlea rhodopensis during Desiccation and Recovery. Physiol. Plant. 2014, 152, 675–687. [Google Scholar] [CrossRef]
- Cañigueral, S.; Salvía, M.J.; Vila, R.; Iglesias, J.; Virgili, A.; Parella, T. New Polyphenol Glycosides from Ramonda myconi. J. Nat. Prod. 1996, 59, 419–422. [Google Scholar] [CrossRef]
- Jensen, S.R. Caffeoyl Phenylethanoid Glycosides in Sanango racemosum and in the Gesneriaceae. Phytochemistry 1996, 43, 777–783. [Google Scholar] [CrossRef]
- Kondeva-Burdina, M.; Zheleva-Dimitrova, D.; Nedialkov, P.; Girreser, U.; Mitcheva, M. Cytoprotective and Antioxidant Effects of Phenolic Compounds from Haberlea rhodopensis Friv. (Gesneriaceae). Pharmacogn. Mag. 2013, 9, 294–301. [Google Scholar] [CrossRef] [Green Version]
- Gođevac, D.; Ivanović, S.; Simić, K.; Anđelković, B.; Jovanović, Ž.; Rakić, T. Metabolomics Study of the Desiccation and Recovery Process in the Resurrection Plants Ramonda serbica and R. nathaliae. Phytochem. Anal. 2022, 33, 961–970. [Google Scholar] [CrossRef]
- Mueckler, M.; Thorens, B. The SLC2 (GLUT) Family of Membrane Transporters. Mol. Asp. Med. 2013, 34, 121–138. [Google Scholar] [CrossRef] [Green Version]
- Szablewski, L. Expression of Glucose Transporters in Cancers. Biochim. Biophys. Acta 2013, 1835, 164–169. [Google Scholar] [CrossRef]
- Medina, R.A.; Owen, G.I. Glucose Transporters: Expression, Regulation and Cancer. Biol. Res. 2002, 35, 9–26. [Google Scholar] [CrossRef]
- Xintaropoulou, C.; Ward, C.; Wise, A.; Marston, H.; Turnbull, A.; Langdon, S.P. A Comparative Analysis of Inhibitors of the Glycolysis Pathway in Breast and Ovarian Cancer Cell Line Models. Oncotarget 2015, 6, 25677–25695. [Google Scholar] [CrossRef] [Green Version]
- Liu, Y.; Zhang, W.; Cao, Y.; Liu, Y.; Bergmeier, S.; Chen, X. Small Compound Inhibitors of Basal Glucose Transport Inhibit Cell Proliferation and Induce Apoptosis in Cancer Cells via Glucose-Deprivation-like Mechanisms. Cancer Lett. 2010, 298, 176–185. [Google Scholar] [CrossRef] [PubMed]
- Jameera Begam, A.; Jubie, S.; Nanjan, M.J. Estrogen Receptor Agonists/Antagonists in Breast Cancer Therapy: A Critical Review. Bioorganic Chem. 2017, 71, 257–274. [Google Scholar] [CrossRef]
- Thomas, M.P.; Potter, B.V.L. Estrogen O-Sulfamates and Their Analogues: Clinical Steroid Sulfatase Inhibitors with Broad Potential. J. Steroid Biochem. Mol. Biol. 2015, 153, 160–169. [Google Scholar] [CrossRef]
- Pang, X.; Fu, W.; Wang, J.; Kang, D.; Xu, L.; Zhao, Y.; Liu, A.-L.; Du, G.-H. Identification of Estrogen Receptor α Antagonists from Natural Products via In Vitro and In Silico Approaches. Oxid. Med. Cell. Longev. 2018, 2018, 6040149. [Google Scholar] [CrossRef] [PubMed] [Green Version]
- Deshpande, S.H.; Muhsinah, A.B.; Bagewadi, Z.K.; Ankad, G.M.; Mahnashi, M.H.; Yaraguppi, D.A.; Shaikh, I.A.; Khan, A.A.; Hegde, H.V.; Roy, S. In Silico Study on the Interactions, Molecular Docking, Dynamics and Simulation of Potential Compounds from Withania somnifera (L.) Dunal Root against Cancer by Targeting KAT6A. Molecules 2023, 28, 1117. [Google Scholar] [CrossRef]
- Kostadinova, A.; Hazarosova, R.; Topouzova-Hristova, T.; Moyankova, D.; Yordanova, V.; Veleva, R.; Nikolova, B.; Momchilova, A.; Djilianov, D.; Staneva, G. Myconoside Interacts with the Plasma Membranes and the Actin Cytoskeleton and Provokes Cytotoxicity in Human Lung Adenocarcinoma A549 Cells. J. Bioenerg. Biomembr. 2022, 54, 31–43. [Google Scholar] [CrossRef]
- Kostadinova, A.; Staneva, G.; Topouzova-Hristova, T.; Moyankova, D.; Yordanova, V.; Veleva, R.; Nikolova, B.; Momchilova, A.; Djilianov, D.; Hazarosova, R. Myconoside Affects the Viability of Polarized Epithelial MDCKII Cell Line by Interacting with the Plasma Membrane and the Apical Junctional Complexes. Separations 2022, 9, 239. [Google Scholar] [CrossRef]
- Zheleva-Dimitrova, D.; Nedialkov, P.; Giresser, U. A Validated HPLC Method for Simultaneous Determination of Caffeoyl Phenylethanoid Glucosides and Flavone 8-C-Glycosides in Haberlea rhodopensis. Nat. Prod. Commun. 2016, 11, 791–792. [Google Scholar] [CrossRef] [PubMed] [Green Version]
- Patel, K.; Patel, D.K. Medicinal Importance, Pharmacological Activities, and Analytical Aspects of Hispidulin: A Concise Report. J. Tradit. Complement. Med. 2016, 7, 360–366. [Google Scholar] [CrossRef] [PubMed]
- Wang, Y.; Guo, S.; Jia, Y.; Yu, X.; Mou, R.; Li, X. Hispidulin Inhibits Proliferation, Migration, and Invasion by Promoting Autophagy via Regulation of PPARγ Activation in Prostate Cancer Cells and Xenograft Models. Biosci. Biotechnol. Biochem. 2021, 85, 786–797. [Google Scholar] [CrossRef]
- Sun, Y.; Duan, X.; Wang, F.; Tan, H.; Hu, J.; Bai, W.; Wang, X.; Wang, B.; Hu, J. Inhibitory Effects of Flavonoids on Glucose Transporter 1 (GLUT1): From Library Screening to Biological Evaluation to Structure-Activity Relationship. Toxicology 2023, 488, 153475. [Google Scholar] [CrossRef] [PubMed]
- Chang, C.-J.; Hung, Y.-L.; Chen, T.-C.; Li, H.-J.; Lo, Y.-H.; Wu, N.-L.; Chang, D.-C.; Hung, C.-F. Anti-Proliferative and Anti-Migratory Activities of Hispidulin on Human Melanoma A2058 Cells. Biomolecules 2021, 11, 1039. [Google Scholar] [CrossRef]
- Kim, H.A.; Lee, J. Hispidulin Modulates Epithelial-Mesenchymal Transition in Breast Cancer Cells. Oncol. Lett. 2021, 21, 155. [Google Scholar] [CrossRef] [PubMed]


Disclaimer/Publisher’s Note: The statements, opinions and data contained in all publications are solely those of the individual author(s) and contributor(s) and not of MDPI and/or the editor(s). MDPI and/or the editor(s) disclaim responsibility for any injury to people or property resulting from any ideas, methods, instructions or products referred to in the content. |
© 2023 by the authors. Licensee MDPI, Basel, Switzerland. This article is an open access article distributed under the terms and conditions of the Creative Commons Attribution (CC BY) license (https://creativecommons.org/licenses/by/4.0/).
Share and Cite
Zasheva, D.; Mladenov, P.; Rusanov, K.; Simova, S.; Zapryanova, S.; Simova-Stoilova, L.; Moyankova, D.; Djilianov, D. Fractions of Methanol Extracts from the Resurrection Plant Haberlea rhodopensis Have Anti-Breast Cancer Effects in Model Cell Systems. Separations 2023, 10, 388. https://doi.org/10.3390/separations10070388
Zasheva D, Mladenov P, Rusanov K, Simova S, Zapryanova S, Simova-Stoilova L, Moyankova D, Djilianov D. Fractions of Methanol Extracts from the Resurrection Plant Haberlea rhodopensis Have Anti-Breast Cancer Effects in Model Cell Systems. Separations. 2023; 10(7):388. https://doi.org/10.3390/separations10070388
Chicago/Turabian StyleZasheva, Diana, Petko Mladenov, Krasimir Rusanov, Svetlana Simova, Silvina Zapryanova, Lyudmila Simova-Stoilova, Daniela Moyankova, and Dimitar Djilianov. 2023. "Fractions of Methanol Extracts from the Resurrection Plant Haberlea rhodopensis Have Anti-Breast Cancer Effects in Model Cell Systems" Separations 10, no. 7: 388. https://doi.org/10.3390/separations10070388