Article

Resin Adsorption of Phenolic Compounds from Olive Leaf and Coffee Residue Extracts: Batch and Packed Column Adsorption Experimental Investigation and Mathematical Modeling

by
Michael P. Kodjapashis
1,2,
Andreas D. Zentelis
1,3,
Dimitris P. Zagklis
2,
Varvara Sygouni
1,2 and
Christakis A. Paraskeva
1,2,*
1
Foundation for Research and Technology, Hellas, Institute of Chemical Engineering Sciences, FORTH/ICE-HT, 26504 Patras, Greece
2
Department of Chemical Engineering, University of Patras, 26504 Patras, Greece
3
Department of Pharmacy, University of Patras, 26504 Patras, Greece
*
Author to whom correspondence should be addressed.
Separations 2023, 10(5), 313; https://doi.org/10.3390/separations10050313
Submission received: 8 April 2023 / Revised: 27 April 2023 / Accepted: 8 May 2023 / Published: 17 May 2023

Abstract

:
Phenolic compounds are important secondary metabolites often found in nature, and most prominently in plants. Plant biomass residues can be a sustainable source of this high-added-value group of compounds that can be used in the food and cosmetics industries due to their antioxidant properties. Olea europaea is a widely studied source of phenolic compounds, with olive leaves being an untapped solid residue with high phenolic content. Coffee residues after coffee extraction is another biomass residue stream rich in phenols. In this work, phenolic extracts of these two substrates, alongside different fractions produced through ultrafiltration and nanofiltration, were examined in resin adsorption experiments. Amberlite XAD16N was used as adsorbent in both batch and packed column experiments, with the experimental results being fitted with mathematical models for batch kinetics, adsorption isotherms, and column adsorption. The tested adsorbent proved capable of separating the target compounds, exhibiting a capacity of 72 mg of olive leaf phenols from nanofiltration retentate per g of resin in batch adsorption experiments, second order kinetics better described the batch adsorption process, while the use of the Thomas model sufficiently described the continuous adsorption process in packed columns (R2 > 0.9).

1. Introduction

Circular economy is an economic system that maximizes the value of goods and materials throughout their entire lifespan in order to reduce waste and encourage the sustainable use of resources. With this strategy, the conventional linear paradigm of “take-make-dispose” has been fundamentally replaced with a more circular one of “reduce-reuse-recycle”. The biorefinery concept, a cornerstone of the circular economy model, focuses on converting biomass and waste streams into a variety of products, such as biofuels, biochemicals, and biomaterials [1,2]. The biorefinery concept aims to create a closed-loop system where waste is minimized, and valuable products are produced from renewable resources. The integration of biorefinery technologies into existing processes has the potential to reduce greenhouse gas emissions, create new economic opportunities, and improve resource efficiency. In this context, the development of sustainable and efficient biorefinery processes is crucial to the success of the circular economy paradigm.
Phenolic compounds are a class of naturally occurring compounds that are widely distributed in the plant kingdom. These compounds have been shown to exhibit a wide range of beneficial properties for human health, including strong antioxidant activity, anti-inflammatory effects, and potential anti-cancer and anti-microbial properties [3,4,5]. The antioxidant activity of phenolic compounds is due to their ability to scavenge free radicals and prevent oxidative damage to cells and tissues [6]. The potential health benefits of phenolic compounds have led to increased interest in their isolation, characterization, and incorporation into functional foods and nutraceuticals.
Olea europaea byproducts and coffee residues are two examples of biomass wastes that contain phenolic compounds, with secoiridoids, flavonoids, and phenolic acids being particularly abundant in olive leaves [7,8,9,10]. Among these compounds, oleuropein is the most abundant and well-studied secoiridoid found in olive leaves. This compound has been shown to exhibit a wide range of biological activities, including antioxidant, anti-inflammatory, and anti-cancer effects [11,12]. Other phenolic compounds found in olive leaves, such as hydroxytyrosol and tyrosol, also have strong antioxidant and anti-inflammatory properties and have been linked to numerous health benefits, including reduced risk of cardiovascular disease, neurodegenerative disorders, and certain types of cancer [13,14]. Olive leaf phenolic content might vary based on the cultivar, harvest period, and extraction technique. To maximize these compounds’ potential health benefits and commercial applications, it is essential to optimize their extraction and purification processes. Olive leaf phenols have considerable health-promoting qualities, and the food and pharmaceutical sectors are becoming more and more interested in using them as functional additives.
Additionally, it is known that large levels of phenolic compounds are present in coffee residues, such as coffee pulp and coffee grounds, which might vary based on the kind of coffee, the degree of roasting, and the extraction technique employed [15,16]. Nevertheless, coffee residues are now recognized to be a promising source of bioactive substances and natural antioxidants that may be utilized in the food and pharmaceutical sectors. Additionally, recent studies have demonstrated that the phenolic compounds in coffee residues may have anti-inflammatory and anti-cancer effects, making them an appealing subject for further study and development [17].
Membrane technology has become one of several potential methods for recovering phenolic fractions from food by-products, using a semi-permeable membrane to selectively separate components according to their size, charge, and/or solubility [18]. Membrane technologies’ capacity to selectively extract phenolic fractions from food by-products while excluding unwanted components is one of their main benefits. Reverse osmosis, ultrafiltration, and nanofiltration are examples of processes that may successfully separate phenolic fractions from these by-products to provide concentrated phenolic extracts [19]. Additionally, membrane technology may be easily modified to meet various phenolic recovery requirements. The phenolic fraction recovery efficiency and quality may be achieved by choosing the right membrane type, pore size, and working conditions [20]. In order to improve the recovery of phenolic fractions, membrane technology can also be coupled with other separation methods such as adsorption and precipitation [21,22,23,24,25]. Adsorption resins have been widely used for the separation of phenolic compounds from complex mixtures. These resins are usually made of porous polymeric materials that contain functional groups with high affinity towards phenolic compounds, such as hydroxyl, carboxyl, and amino groups [26,27]. The adsorption process is usually carried out in a column packed with the resin, where the mixture is passed through the resin bed under controlled conditions of temperature, pH, and flow rate. Phenolic compounds are selectively retained by the resin, while other components of the mixture are eluted out. The bound phenolic compounds can then be eluted from the resin using an appropriate solvent, such as methanol or ethanol, and further purified using techniques such as chromatography or crystallization [24].
Extensive work has been carried out in the literature regarding the use of resins for the separation of phenols from biomass extracts or agroindustrial wastewaters. The commercial resins amberlite XAD4, XAD7HP, and XAD16 were utilized by Zagklis et al. [22,24] to treat a membrane fraction of olive mill wastewater in order to extract small molecular weight phenolics. Olive mill wastewaters have also been treated directly using XAD16, for phenols separation [28], but in that case, the absence of pretreatment led to a product with decreased phenol purity. Other resins that have been used for the same purpose include the ion-exchange IRA958 Cl, Optipore SD-2, FPX66, and XAD761 [29] after a microfiltration pretreatment for the removal of suspended solids. Another study found that XAD16 exhibited better performance when phenolic adsorption was evaluated between neutral (XAD16) and ionic resins (IRA958 Cl, IRA 67) [30]. According to Vavouraki et al. [31], the FPX66 resin performed better than XAD4 and XAD16 in aqueous phenolic solutions as opposed to olive mill wastewater.
The food, pharmaceutical, cosmetic, agricultural, animal, and environmental industries all have a variety of potential uses for phenolic compounds that may be extracted from by-products. Using phenolic-rich extracts as functional food ingredients to boost food products’ nutritional value [32], natural food preservatives to lengthen shelf life [33], nutraceuticals and dietary supplements for their potential health benefits [34,35], cosmetics and personal care items for their antioxidant and anti-inflammatory properties [36,37], and agricultural and livestock feed additives for plant growth regulation [38] and animal health [39] are some of these applications. The type, content, purity in the extracts, and specifications and rules of the target industry will all affect the specific use of phenolic compounds. The aim of this work is to study the separation of phenolic compounds from residual biomass extracts. Olive leaves and coffee residues were examined, using raw phenolic extracts and their fractions produced through membrane filtration. The experimental data were then used to estimate the parameters of established mathematical models. The trained models presented in this work can be used to estimate the performance of phenol adsorption systems and help for the optimization of this kind of processes. While resins such as XAD16 have been extensively examined in the existing literature for the adsorption of phenols, very few studies present modeling results of column adsorption processes (indicatively, out of all the cited works in this study, only two present this kind of data [28,30]), especially for adsorption processes that follow membrane filtration.

2. Materials and Methods

The fractions of aqueous phenolic extracts originating from olive leaves and coffee residues were obtained using in-line membrane filtration. The first step of the membrane filtration process was the use of UF followed by the filtration of UF permeate with an NF membrane. The trans-membrane pressure used during filtration was 1 bar and 20 bar for the UF and NF membranes, respectively. The membrane units used were of pilot scale and the filtration was cross-flow in batch operation. The UF module was ceramic (zirconia) with pore diameter 100 nm, with 19 channels of 1020 mm length and an active area of 0.24 m2. The NF module was spiral wound, polymeric with 2.4 m2 active area and 95% rejection of MgSO4. The MWCO of the NF module was determined experimentally using different molecular weight PEGs, at 470 Da. Both membrane modules were supplied by Hydro Air Research SpA, Milan, Italy.
The fractions used, their phenolic content, and the characteristics of the membranes are displayed in Table 1.
The adsorbent used was the resin Amberlite™ XAD™16N Polymeric Adsorbent (Sigma Aldrich, Burlington, MA, USA). This resin is a non-ionic, hydrophobic, cross-linked polymer with excellent adsorptive properties due to its macroporous structure and high specific surface area. This material can be used to adsorb hydrophobic molecules from polar solvents and volatile organic compounds.
Batch experiments were conducted using a Jar Test (Raypa®) device with programmable stirring rate and time. The experiments were performed under constant stirring rate equal to 250 rpm. Five beakers of 500 mL were used; each contained 200 mL of the extract. One beaker did not contain sorbent, while in the rest of the beakers, 4, 8, 16, and 24 g of resin were added, respectively. Samples were collected from the supernatant liquid for the measurement of phenolics. Column adsorption experiments were carried out using a packed column, 3.2 cm in diameter with a height of 8.1 cm (65 mL volume). The elution rate was 300 mL/h. The bed was completely packed with 60 g of resin. The resin’s density ranged between 1.015 and 1.025 g/mL and the porosity of the bed was estimated experimentally to be ~22%. All experiments were carried out at ambient temperature. The concentration of phenols in the supernatant (batch experiments) and eluent (column adsorption experiments) was measured using the Folin–Ciocalteu reagent [40], using gallic acid as the standard.
The qualitative determination of the composition of olive leaf extract NF retentate was performed using a Waters 2695 Alliance HPLC separation Module (Waters Inc., Milford, CT, USA) equipped with a Waters 2487 Dual wavelength Detector and a Phenomenex Prodigy 5u ODS3, 100 A, 250 × 4.6 mm, column with an Phenomenex ODS, 4 × 3.0 mm guard column. The solvents 0.1% Trifluroacetic acid (Carlo Erba Reagents, Milan, Italy, RS-Pour LC-MS) in water (Honeywell, Charlotte, NC, USA, HPLC grade) as solvent (A) and acetonitrile (Honeywell, HPLC grade) as solvent (B) were used in gradient elution under following conditions: 0–5 min 90% A/10% B, 5–7 min 83% A/17% B, 7–14 min 83% A/17% B, 14–17 min 78% A/22% B, 17–28 min 78% A/22% B, 28–32 min 74% A/26% B, 32–42 min 74% A/26% B, 42–45 min 10% A/90% B, 45–50 min 10% A/90% B, 50–55 min 90% A/10% B, 55–60 min 90% A/10% B. The injection volume of samples and standards solutions was 10 μL, the flow rate 0.8 mL/min, the temperature 25, and the detector were set at 280 nm and 360 nm. Before carrying out the analysis, samples were centrifuged under 4000 rpm and filtered through 0.2 μm pore size syringe filters (Nylon). The standard compounds examined were Gallic acid monohydrate (Sigma-Aldrich, ≥98%, 2-(4-Hydroxyphenyl)ethanol (Aldrich, Burlington, MA, USA, 98%), 2-(3,4-Dihydroxyphenyl)ethanol (Sigma-Aldrich, ≥98%), p-Coumaric acid (Sigma, Burlington, MA, USA, ≥98%), Caffeic acid (Sigma, ≥98%), trans-Ferulic acid (Aldrich, 99%), L-Tryptophan (PanReac AppliChem, Darmstadt, Germany, 98.5–101.0%), Oleuropein (Sigma, ≥98%), 9) (+)-Catechin hydrate (Sigma, ≥98%), and (-)-Epicatechin (Sigma, ≥98%).
Both batch and column adsorption experiments were carried out in duplicate, with the results being expressed as average values and the error bars corresponding to the standard deviation of the measurements.
For the modelling of batch adsorption kinetics, pseudo-first and pseudo-second order kinetics equations were used (Equations (1) and (2)), where q corresponds to the adsorbed amount of phenols on the adsorption resin at time t in mg/g, qe corresponds to the amount of adsorbed phenol at equilibrium (mg/g), and the parameters k1 and k2 are kinetic constants (in min−1 and min−1 mg−1 g, respectively).
d q d t = k 1 ( q e q )
d q d t = k 2 ( q e q ) 2
For the modeling of the adsorption isotherms, the linear, Langmuir, and Freundlich models were used (Equations (3), (4), and (5), respectively), where Ce corresponds to the concentration of phenols at equilibrium in the bulk (mg L−1), qmax corresponds to the maximum adsorption capacity of the adsorption resin (mg g−1), n is a constant that depends on the adsorbent and adsorbate, and Klin, Klang, and Kf are model constants (in L g−1, L g−1, and L1/n g−1 mg1/n−1, respectively).
q e = K l i n C e
q e = q m a x K l a n g C e 1 + K l a n g C e
q e = K f C e 1 / n
Finally, for the modeling of the adsorption experiments carried out in adsorption columns, the Thomas model was used (Equation (6)), where Ct corresponds to the concentration of phenols in the bulk at the effluent of the adsorption column at time t, Cin corresponds to the input concentration of phenols, kTH is the Thomas rate parameter (mL min−1 mg−1), x is the amount of adsorption resin in the column (g), and v is the flow rate (mL min−1).
C t C i n = 1 1 + e x p ( k T h q e x v k T h C i n t )
Optimization of model parameters in all cases was carried out by minimizing the residual error between experimental and-model predicted values, using the solver add-on in Microsoft Excel version 2304.

3. Results and Discussion

3.1. Batch Adsorption of the Olive Leaf Extract NF Retentate

The first set of experiments consisted of the adsorption of the NF retentate fraction of olive leaf extract phenols in batch mode. This fraction was selected due to the removal of suspended solids in the UF step, and the higher concentration of phenols that were separated according to their molecular weight through NF filtration. These experiments were carried out to estimate the adsorption kinetics and in order to construct the adsorption isotherms from equilibrium data.

3.1.1. Batch Adsorption Kinetics

Four batch adsorption experiments were carried out, with different concentrations of resin added, with the concentration of not adsorbed phenols (bulk) being measured every few minutes (Figure 1a). The initial concentration of phenols was identical in all four batch experiments, with the addition of different amounts of adsorbent leading to different equilibrium concentrations in the bulk. As it was expected, higher concentrations of adsorbent led to lower concentrations of free phenols at equilibrium. In order to evaluate the first and second order adsorption kinetic models, the data of Figure 1a were processed in order to linearize the corresponding models (Figure 1b for pseudo-first order kinetics and Figure 1c for pseudo-second order kinetics). Even though both models appear to fit the data quite well, second order kinetics seems to be the most accurate as can be seen by the R2 values in Figure 1c. The optimized kinetic model parameters for both first and second order kinetics are presented in Table 2.
The pseudo-second order kinetics that fit the interaction of the examined phenols with the XAD16 resin is an indication that the process rate, in the range of adsorbate/adsorbent ratio examined, is mostly dependent on the adsorption capacity of the resin and not the concentration of the adsorbate [41]. Moreover, pseudo-second order kinetics indicate a strong interaction between the adsorbate and the adsorption sites. This type of nonionic resins are capable of adsorbing phenols through hydrogen bonding [42], a mechanism that may be involved in the examined process as well.
In the work of Park and Lee [43], the authors examined the adsorption of Ecklovia cava phenols on microporous resins, including XAD16N. Regarding adsorption kinetics, they observed that pseudo-second order model better fitted the experimental results, with k2 equal to 0.119 h−1 mg−1 g, which is equal to 1.90 10−3 min−1 mg−1 g, a value approximately one order of magnitude greater than the one estimated in this study. The differences of the kinetic parameters may be attributed to the different nature of the phenolic compounds being adsorbed. Thi Le et al. [44] examined the adsorption of sunflower phenols on XAD16, once again identifying pseudo-second order kinetics as most suitable to describe the adsorption data, with a k2 of 6.33 × 10⁻⁵. Niknam et al. [45] examined the adsorption of olive mill solid residue phenols on XAD16 resin, estimating the pseudo-first and pseudo-second order kinetic parameters k1 1.57 × 10⁻² min−1 for k1 and 1.19 × 10⁻² for k2. Yang et al. [46] studied the adsorption of adlay bran phenols on XAD16 resin, identifying pseudo-second order kinetics as the most appropriate kinetic model to describe the process, calculating a k2 of 1.307 × 10⁻² min−1 mg−1 g. It is apparent that, even though there is a variation in the estimated parameters for batch adsorption kinetics present in the literature, most of the published studies identify pseudo-second order kinetics as the most appropriate model to describe the process. The variation of parameter values may be partially attributed to the expression of phenols concentration (in this work it is expressed in gallic acid equivalents, but other researchers use different phenolic compounds with significant differences in their molecular weight), as well as the type of phenolic compounds to be adsorbed in each sample. Different phenols may exhibit different extends of affinity with the adsorption resin, higher molecular weight phenols may not be able to access all the available adsorption surface inside the pore structure of the resin, and if one adsorbed molecule occupies one adsorption site, higher molecular weight phenols will result in higher values of adsorbed mass for a fixed number of adsorption sites.

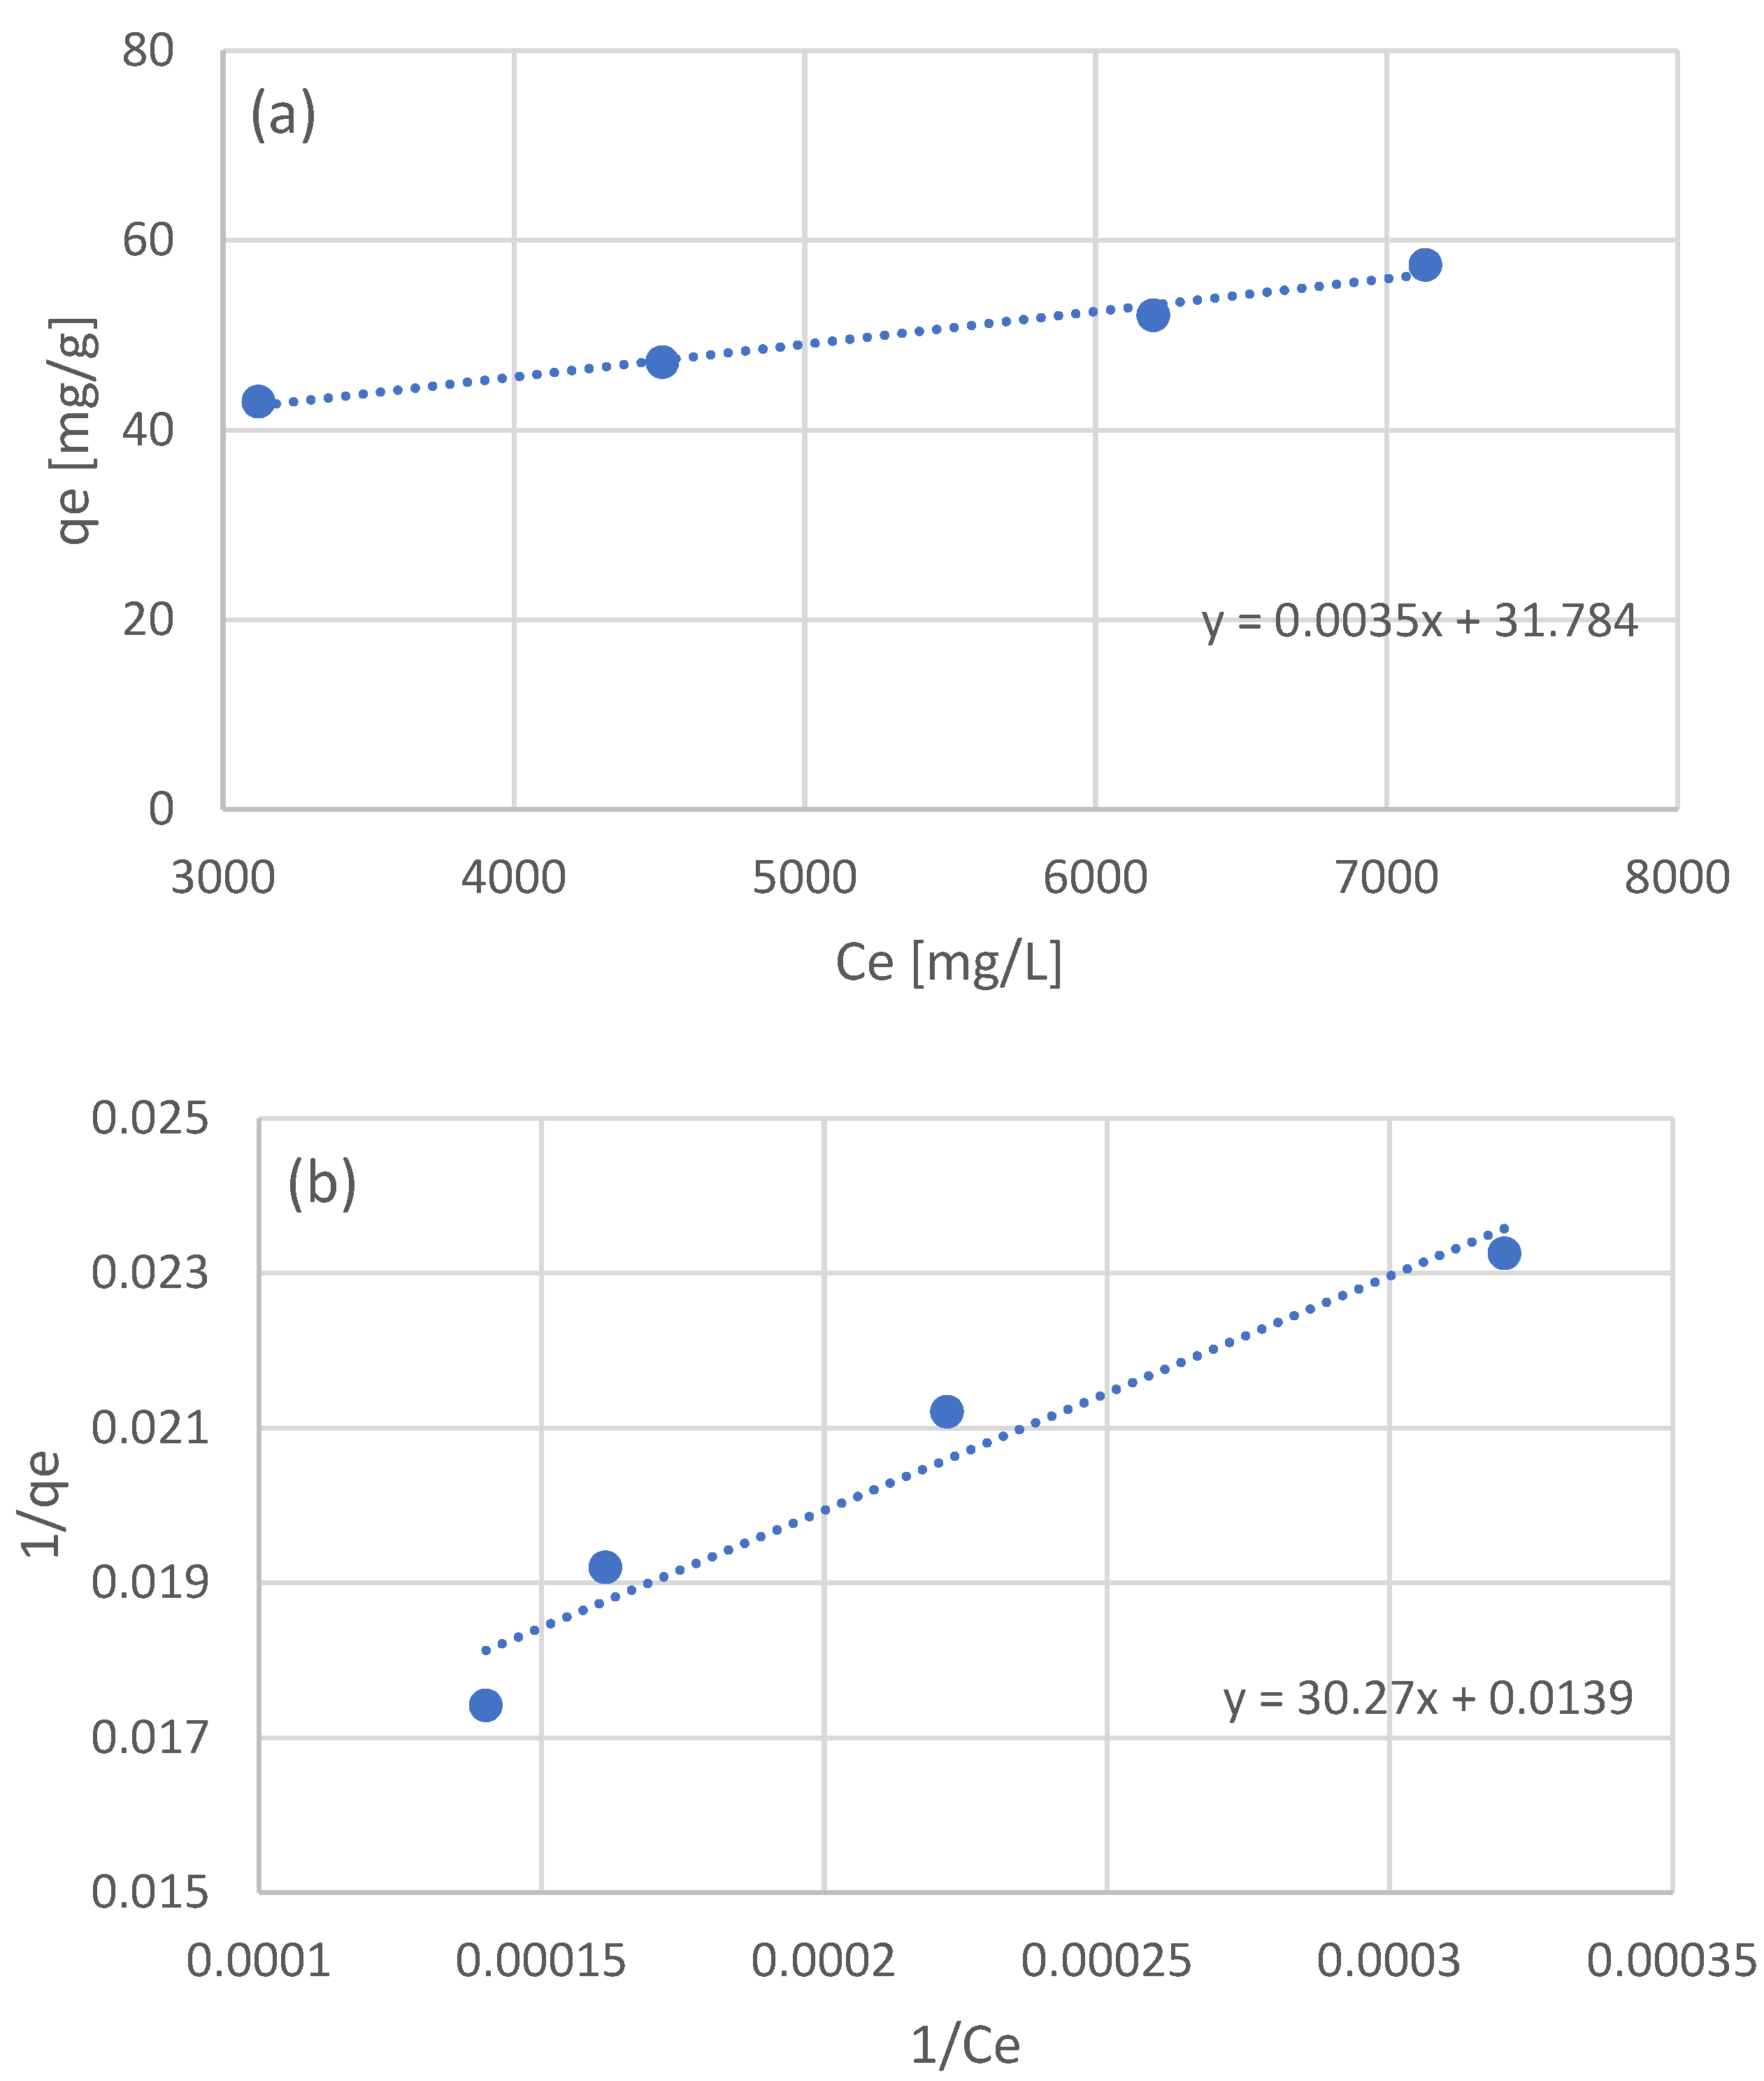
3.1.2. Adsorption Isotherms

The equilibrium data of the four batch experiments were used to examine the adsorption isotherm. Three models were used: the linear, Langmuir, and Freundlich models. The linear model was fitted to the raw equilibrium data (Figure 2a), while for the Langmuir and Freundlich models, the equilibrium data were processed in order to linearize the corresponding models (Figure 2b and Figure 2c, respectively). The optimized parameters for the three isotherm models are presented in Table 3.
In the work of Thi Le et al. [44] examining the adsorption of sunflower phenols, the authors estimated a Kllang equal to 3.21 × 10⁻³ L/g and a qmax of 78 mg/g. Vavouraki et al. [31] examined the adsorption of OMW phenols on XAD16 resin, estimating a qmax of 288 mg/g for the Langmuir model and a Kf of 1.80 × 10⁻² and n equal to 1.7. In the work of Yang et al. [46] testing the adsorption of adlay bran phenols, the authors estimated a Kf of 0.12 and an n equal to 0.97. As in the case of kinetic parameters, the variation in the estimated isotherm model parameters can once again be partially attributed to the expression of phenolic concentration and the nature of the adsorbed phenols. The fact that all three examined model adequately describe the obtained experimental data may be an indication that a wider range of experimental conditions should be examined in order to better evaluate the adsorption process taking place.

3.2. Column Adsorption of Olive Leaf and Coffee Residue Extracts and Their Fractions

Most of the applications involving adsorption processes are operated in continuous mode. After the results and modeling of the batch adsorption experiments, continuous experiments with resin-packed columns were conducted. The samples tested included the raw extracts of olive leaves and coffee residues, as well as fractions that were produced after their in-line membrane filtration. For modeling of the eluent concentration of phenols at the adsorption column outflow, the Thomas model was used. The results and model fitting for olive leaf phenols are presented in Figure 3, while the results and model fitting for coffee residue extracts are presented in Figure 4. The estimated model parameters and model fitting accuracy (in terms of R2) are presented in Table 4.
The Thomas model was proven very sufficient in describing the adsorption of olive leaf and coffee residue extracts and their fractions in columns packed with XAD16 resin. In all cases, the R2 was higher than 0.9, indicating the good fit of the model. Limited literature data are available for packed column adsorption of phenols on this type of adsorbent, with most of the published works focusing on batch experiments, as already discussed in Section 3.1. The estimated kinetic constants for the Thomas model have similar values to the second order kinetics constant calculated using the batch experiments data. In general, XAD16 seems to have a higher affinity towards the phenolic compounds found in coffee residues, as can be observed by the higher values of adsorbed phenols at equilibrium in Table 4.

3.3. Qualitative Determination of the Composition of Olive Leaf Extract NF Retentate

The NF retentate of olive leaf extract is a fraction of increased interest because of the well-known value of olive leaf phenols and their concentration in this membrane fraction. The analysis using HPLC for the phenolic content of the olive leaf extract NF retentate and the effluent of its column adsorption process at 6.55 min (Figure 3c) are presented in Figure 5, alongside the relevant standard compounds.
As can be seen in Figure 5, Tyrosol and oleuropein were amongst the most prominent phenolic compounds identified in the analysis of the sample prior to the adsorption process but were absent in the analysis of the adsorption column effluent, were caffeic and coumaric acid were the only two identified phenolic compounds (out of the ones examined). Moreover, the less polar phenolic compounds (eluted at later times in the HPLC analysis) seem to be better adsorbed by the used resin, indicating that hydrophobic interactions may contribute the adsorption mechanism taking place.

4. Conclusions

The use of adsorption resins for the separation of phenolic compounds from complex mixtures has been extensively studied in the literature. The Amberlite XAD16 resin has been found to be effective in the separation of phenols from biomass extracts and agroindustrial wastewaters and has been compared favorably to other resins. In this study, fractions of aqueous phenolic extracts from olive leaves and coffee residues were used to evaluate the performance of the Amberlite XAD16 resin through batch and column adsorption experiments. From batch experiments, it was found that resin may adsorb up to 72 mg of phenols/g for the case of olive leaf extract NF retentate. In the case of the continuous experiments, the observed capacity for the same sample was at 23 mg of phenols/g. During the continuous flow experiments through packed beds, the resin’s saturation in phenolics took place much later for the case of the coffee residue NF concentrate, a fact that can be attributed to the lower initial concentration of phenols for the sample compared to the olive leaf extract, and to the higher affinity exhibited by the resin for this kind of phenols (higher qe parameter). Pseudo-second order kinetics seem to better describe the examined process, while the Thomas model was capable of accurately predicting the column adsorption experimental values. The trained mathematical models can be used to estimate the performance of phenol adsorption systems and optimize such processes. Overall, the use of adsorption resins such as Amberlite XAD16 provides an effective method for the separation and purification of phenolic compounds from complex mixtures, with potential applications in the food, pharmaceutical, and environmental industries. The next steps of this study will include the investigation of the desorption step using different solvents and their mixtures, followed by HPLC analysis of the occurring extracts. The mathematical modeling of the desorption step will also follow. Finally, the use of different elution rates in column adsorption and desorption processes and their effect on the Thomas model parameters will also be examined.

Author Contributions

Conceptualization, C.A.P. and D.P.Z.; methodology, C.A.P.; validation, M.P.K. and V.S.; investigation, M.P.K. and A.D.Z.; resources, C.A.P.; data curation, M.P.K. and A.D.Z.; writing—original draft preparation, D.P.Z.; writing—review and editing, M.P.K., V.S. and C.A.P.; supervision, C.A.P.; project administration, V.S.; funding acquisition, C.A.P. All authors have read and agreed to the published version of the manuscript.

Funding

We acknowledge the support of this work by the Project “PPP_Phenolics” (code 03828), which is implemented under the Action “2nd Call for H.F.R.I. Research Projects to support Faculty Members and Researchers” funded by Hellenic Foundation for Research and Innovation.

Data Availability Statement

Data is contained within the article, in Section 3 Results and Discussion.

Conflicts of Interest

The authors declare no conflict of interest.

References

  1. Awasthi, M.K.; Sindhu, R.; Sirohi, R.; Kumar, V.; Ahluwalia, V.; Binod, P.; Juneja, A.; Kumar, D.; Yan, B.; Sarsaiya, S.; et al. Agricultural waste biorefinery development towards circular bioeconomy. Renew. Sustain. Energy Rev. 2022, 158, 112122. [Google Scholar] [CrossRef]
  2. Zagklis, D.P.; Paraskeva, C.A. Preliminary design of a phenols purification plant. J. Chem. Technol. Biotechnol. 2020, 95, 373–383. [Google Scholar] [CrossRef]
  3. Cosme, P.; Rodríguez, A.B.; Espino, J.; Garrido, M. Plant Phenolics: Bioavailability as a Key Determinant of Their Potential Health-Promoting Applications. Antioxidants 2020, 9, 1263. [Google Scholar] [CrossRef] [PubMed]
  4. El, S.N.; Karakaya, S. Olive tree (Olea europaea) leaves: Potential beneficial effects on human health. Nutr. Rev. 2009, 67, 632–638. [Google Scholar] [CrossRef]
  5. Hassen, I.; Casabianca, H.; Hosni, K. Biological activities of the natural antioxidant oleuropein: Exceeding the expectation-A mini-review. J. Funct. Foods 2015, 18, 926–940. [Google Scholar] [CrossRef]
  6. Olszowy, M. What is responsible for antioxidant properties of polyphenolic compounds from plants? Plant Physiol. Biochem. 2019, 144, 135–143. [Google Scholar] [CrossRef]
  7. Pereira, A.P.; Ferreira, I.C.F.R.; Marcelino, F.; Valentão, P.; Andrade, P.B.; Seabra, R.; Estevinho, L.; Bento, A.; Pereira, J.A. Phenolic compounds and antimicrobial activity of olive (Olea europaea L. Cv. Cobrançosa) leaves. Molecules 2007, 12, 1153–1162. [Google Scholar] [CrossRef]
  8. Ghomari, O.; Sounni, F.; Massaoudi, Y.; Ghanam, J.; Drissi Kaitouni, L.B.; Merzouki, M.; Benlemlih, M. Phenolic profile (HPLC-UV) of olive leaves according to extraction procedure and assessment of antibacterial activity. Biotechnol. Rep. 2019, 23, e00347. [Google Scholar] [CrossRef]
  9. Martín-García, B.; De Montijo-Prieto, S.; Jiménez-Valera, M.; Carrasco-Pancorbo, A.; Ruiz-Bravo, A.; Verardo, V.; Gómez-Caravaca, A.M. Comparative Extraction of Phenolic Compounds from Olive Leaves Using a Sonotrode and an Ultrasonic Bath and the Evaluation of Both Antioxidant and Antimicrobial Activity. Antioxidants 2022, 11, 558. [Google Scholar] [CrossRef]
  10. Papageorgiou, C.S.; Lyri, P.; Xintaropoulou, I.; Diamantopoulos, I.; Zagklis, D.P.; Paraskeva, C.A. High-Yield Production of a Rich-in-Hydroxytyrosol Extract from Olive (Olea europaea) Leaves. Antioxidants 2022, 11, 1042. [Google Scholar] [CrossRef]
  11. Butt, M.S.; Tariq, U.; Iahtisham-Ul-Haq; Naz, A.; Rizwan, M. Neuroprotective effects of oleuropein: Recent developments and contemporary research. J. Food Biochem. 2021, 45, e13967. [Google Scholar] [CrossRef] [PubMed]
  12. Rishmawi, S.; Haddad, F.; Dokmak, G.; Karaman, R. A Comprehensive Review on the Anti-Cancer Effects of Oleuropein. Life 2022, 12, 1140. [Google Scholar] [CrossRef]
  13. Ercelik, M.; Tekin, C.; Tezcan, G.; Ak Aksoy, S.; Bekar, A.; Kocaeli, H.; Taskapilioglu, M.O.; Eser, P.; Tunca, B. Olea europaea Leaf Phenolics Oleuropein, Hydroxytyrosol, Tyrosol, and Rutin Induce Apoptosis and Additionally Affect Temozolomide against Glioblastoma: In Particular, Oleuropein Inhibits Spheroid Growth by Attenuating Stem-like Cell Phenotype. Life 2023, 13, 470. [Google Scholar] [CrossRef] [PubMed]
  14. Karković Marković, A.; Torić, J.; Barbarić, M.; Jakobušić Brala, C. Hydroxytyrosol, tyrosol and derivatives and their potential effects on human health. Molecules 2019, 24, 2001. [Google Scholar] [CrossRef] [PubMed]
  15. Arauzo, P.J.; Lucian, M.; Du, L.; Olszewski, M.P.; Fiori, L.; Kruse, A. Improving the recovery of phenolic compounds from spent coffee grounds by using hydrothermal delignification coupled with ultrasound assisted extraction. Biomass Bioenergy 2020, 139, 105616. [Google Scholar] [CrossRef]
  16. Bondam, A.F.; Diolinda da Silveira, D.; Pozzada dos Santos, J.; Hoffmann, J.F. Phenolic compounds from coffee by-products: Extraction and application in the food and pharmaceutical industries. Trends Food Sci. Technol. 2022, 123, 172–186. [Google Scholar] [CrossRef]
  17. Salazar-López, N.J.; López-Rodríguez, C.V.; Hernández-Montoya, D.A.; Campos-Vega, R. Health Benefits of Spent Coffee Grounds. In Food Wastes and By-Products; Wiley: New York, NY, USA, 2020; pp. 327–351. ISBN 9781119534167. [Google Scholar]
  18. Castro-Muñoz, R.; Yáñez-Fernández, J.; Fíla, V. Phenolic compounds recovered from agro-food by-products using membrane technologies: An overview. Food Chem. 2016, 213, 753–762. [Google Scholar] [CrossRef]
  19. Cassano, A.; Conidi, C.; Ruby-Figueroa, R.; Castro-Muñoz, R. Nanofiltration and Tight Ultrafiltration Membranes for the Recovery of Polyphenols from Agro-Food By-Products. Int. J. Mol. Sci. 2018, 19, 351. [Google Scholar] [CrossRef]
  20. Castro-Muñoz, R.; Conidi, C.; Cassano, A. Membrane-based technologies for meeting the recovery of biologically active compounds from foods and their by-products. Crit. Rev. Food Sci. Nutr. 2019, 59, 2927–2948. [Google Scholar] [CrossRef]
  21. Valencia-Arredondo, J.A.; Hernández-Bolio, G.I.; Cerón-Montes, G.I.; Castro-Muñoz, R.; Yáñez-Fernández, J. Enhanced process integration for the extraction, concentration and purification of di-acylated cyanidin from red cabbage. Sep. Purif. Technol. 2020, 238, 116492. [Google Scholar] [CrossRef]
  22. Zagklis, D.P.; Vavouraki, A.I.; Kornaros, M.E.; Paraskeva, C.A. Purification of olive mill wastewater phenols through membrane filtration and resin adsorption/desorption. J. Hazard. Mater. 2015, 285. [Google Scholar] [CrossRef] [PubMed]
  23. Zagklis, D.P.; Paraskeva, C.A. Purification of grape marc phenolic compounds through solvent extraction, membrane filtration and resin adsorption/desorption. Sep. Purif. Technol. 2015, 156. [Google Scholar] [CrossRef]
  24. Zagklis, D.P.; Paraskeva, C.A. Isolation of organic compounds with high added values from agro-industrial solid wastes. J. Environ. Manage. 2018, 216, 183–191. [Google Scholar] [CrossRef] [PubMed]
  25. Kontos, S.S.; Katrivesis, F.K.; Constantinou, T.C.; Zoga, C.A.; Ioannou, I.S.; Koutsoukos, P.G.; Paraskeva, C.A. Implementation of membrane filtration and melt crystallization for the effective treatment and valorization of olive mill wastewaters. Sep. Purif. Technol. 2018, 193, 103–111. [Google Scholar] [CrossRef]
  26. Issabayeva, G.; Hang, S.Y.; Wong, M.C.; Aroua, M.K. A review on the adsorption of phenols from wastewater onto diverse groups of adsorbents. Rev. Chem. Eng. 2018, 34, 855–873. [Google Scholar] [CrossRef]
  27. Johnson, R.; Mitchell, A.E. Use of Amberlite Macroporous Resins To Reduce Bitterness in Whole Olives for Improved Processing Sustainability. J. Agric. Food Chem. 2019, 67, 1546–1553. [Google Scholar] [CrossRef]
  28. Frascari, D.; Bacca, A.E.M.; Zama, F.; Bertin, L.; Fava, F.; Pinelli, D. Olive mill wastewater valorisation through phenolic compounds adsorption in a continuous flow column. Chem. Eng. J. 2016, 283, 293–303. [Google Scholar] [CrossRef]
  29. Frascari, D.; Rubertelli, G.; Arous, F.; Ragini, A.; Bresciani, L.; Arzu, A.; Pinelli, D. Valorisation of olive mill wastewater by phenolic compounds adsorption: Development and application of a procedure for adsorbent selection. Chem. Eng. J. 2019, 360, 124–138. [Google Scholar] [CrossRef]
  30. Pinelli, D.; Molina Bacca, A.E.; Kaushik, A.; Basu, S.; Nocentini, M.; Bertin, L.; Frascari, D. Batch and continuous flow adsorption of phenolic compounds from olive mill wastewater: A comparison between nonionic and ion exchange resins. Int. J. Chem. Eng. 2016, 2016. [Google Scholar] [CrossRef]
  31. Vavouraki, A.I.; Dareioti, M.A.; Kornaros, M. Olive Mill Wastewater (OMW) Polyphenols Adsorption onto Polymeric Resins: Part I—Batch Anaerobic Digestion of OMW. Waste Biomass Valorization 2020, 12, 2271–2281. [Google Scholar] [CrossRef]
  32. Velderrain-Rodríguez, G.R.; Quero, J.; Osada, J.; Martín-Belloso, O.; Rodríguez-Yoldi, M.J. Phenolic-Rich Extracts from Avocado Fruit Residues as Functional Food Ingredients with Antioxidant and Antiproliferative Properties. Biomolecules 2021, 11, 977. [Google Scholar] [CrossRef] [PubMed]
  33. Beya, M.M.; Netzel, M.E.; Sultanbawa, Y.; Smyth, H.; Hoffman, L.C. Plant-Based Phenolic Molecules as Natural Preservatives in Comminuted Meats: A Review. Antioxidants 2021, 10, 263. [Google Scholar] [CrossRef] [PubMed]
  34. Arun, K.B.; Thomas, S.; Reshmitha, T.R.; Akhil, G.C.; Nisha, P. Dietary fibre and phenolic-rich extracts from Musa paradisiaca inflorescence ameliorates type 2 diabetes and associated cardiovascular risks. J. Funct. Foods 2017, 31, 198–207. [Google Scholar] [CrossRef]
  35. Gonçalves, A.C.; Costa, A.R.; Flores-Félix, J.D.; Falcão, A.; Alves, G.; Silva, L.R. Anti-Inflammatory and Antiproliferative Properties of Sweet Cherry Phenolic-Rich Extracts. Molecules 2022, 27, 268. [Google Scholar] [CrossRef]
  36. Ribeiro, A.S.; Estanqueiro, M.; Oliveira, M.B.; Sousa Lobo, J.M. Main benefits and applicability of plant extracts in skin care products. Cosmetics 2015, 2, 48–65. [Google Scholar] [CrossRef]
  37. dos Santos Nascimento, L.B.; Gori, A.; Raffaelli, A.; Ferrini, F.; Brunetti, C. Phenolic compounds from leaves and flowers of Hibiscus roseus: Potential skin cosmetic applications of an under-investigated species. Plants 2021, 10, 522. [Google Scholar] [CrossRef]
  38. Mohamed, M.S.M.; Saleh, A.M.; Abdel-Farid, I.B.; El-Naggar, S.A. Growth, hydrolases and ultrastructure of Fusarium oxysporum as affected by phenolic rich extracts from several xerophytic plants. Pestic. Biochem. Physiol. 2017, 141, 57–64. [Google Scholar] [CrossRef] [PubMed]
  39. Mahfuz, S.; Shang, Q.; Piao, X. Phenolic compounds as natural feed additives in poultry and swine diets: A review. J. Anim. Sci. Biotechnol. 2021, 12, 48. [Google Scholar] [CrossRef] [PubMed]
  40. Singleton, V.L.; Orthofer, R.; Lamuela-Raventós, R.M. Analysis of total phenols and other oxidation substrates and antioxidants by means of folin-ciocalteu reagent. Methods Enzymol. 1999, 299, 152–178. [Google Scholar] [CrossRef]
  41. Sahoo, T.R.; Prelot, B. Chapter 7-Adsorption processes for the removal of contaminants from wastewater: The perspective role of nanomaterials and nanotechnology. In Micro and Nano Technologies; Bonelli, B., Freyria, F.S., Rossetti, I., Sethi, R., Eds.; Elsevier: Amsterdam, The Netherlands, 2020; pp. 161–222. ISBN 978-0-12-818489-9. [Google Scholar]
  42. Juang, R.-S.; Shiau, J.-Y. Adsorption isotherms of phenols from water onto macroreticular resins. J. Hazard. Mater. 1999, 70, 171–183. [Google Scholar] [CrossRef]
  43. Park, J.J.; Lee, W.Y. Adsorption and desorption characteristics of a phenolic compound from Ecklonia cava on macroporous resin. Food Chem. 2021, 338, 128150. [Google Scholar] [CrossRef] [PubMed]
  44. Le, T.T.; Aymes, A.; Framboisier, X.; Ioannou, I.; Kapel, R. Adsorption of phenolic compounds from an aqueous by-product of sunflower protein extraction/purification by macroporous resins. J. Chromatogr. Sep. Tech. 2020, 11, 435. [Google Scholar]
  45. Niknam, S.M.; Kashaninejad, M.; Escudero, I.; Sanz, M.T.; Beltrán, S.; Benito, J.M. Valorization of olive mill solid residue through ultrasound-assisted extraction and phenolics recovery by adsorption process. J. Clean. Prod. 2021, 316, 128340. [Google Scholar] [CrossRef]
  46. Yang, Q.; Zhao, M.; Lin, L. Adsorption and desorption characteristics of adlay bran free phenolics on macroporous resins. Food Chem. 2016, 194, 900–907. [Google Scholar] [CrossRef]
Figure 1. Experimental results of batch adsorption of the NF retentate fraction of olive leaf extract using different adsorbent concentrations (C1 = 20 g/L, C2 = 40 g/L, C3 = 80 g/L, and C4 = 120 g/L) (a) and fitting after linearization for pseudo-first (b), and pseudo-second (c) order kinetics.
Separations 10 00313 g001aSeparations 10 00313 g001b
Figure 2. Adsorption isotherms for the adsorption of the NF retentate fraction of olive life extract on XAD16N resin, using the linear model (a), and after linearization the Langmuir (b), and Freundlich (c) models.
Separations 10 00313 g002aSeparations 10 00313 g002b
Figure 3. Experimental results (scattered symbols) and Thomas model fitting (continuous line) of the use of adsorption resin packed columns for the adsorption of phenols from olive leaf extract (a), UF retentate of olive leaf extract (b), NF retentate of olive leaf extract (c), and NF permeate of olive leaf extract (d).
Separations 10 00313 g003
Figure 4. Experimental results (scattered symbols) and Thomas model fitting (continuous line) of the use of adsorption resin packed columns for the adsorption of phenols from coffee residues extract (a), UF retentate of coffee residue extract (b), UF permeate of coffee residue extract (c), NF retentate of coffee residue extract (d), and NF permeate of coffee residue extract (e).
Separations 10 00313 g004aSeparations 10 00313 g004b
Figure 5. HPLC analysis of the phenolic content of olive leaf extract NF retentate prior (a) and after the column adsorption process at elution time 6.55 min (b), and the standards used for the qualitative analysis (c). 1: Gallic acid monohydrate, 2: Hydroxytyrosol, 3: Tyrosol, 4: L-Tryptophan, 5: (+)-Catechin hydrate, 6: (-)-Epicatechin, 7: Caffeic acid, 8: p-Coumaric acid, 9: trans-Ferulic acid, 10: Oleuropein.
Separations 10 00313 g005
Table 1. Fractions of phenolic extracts used in this study and their phenolic content expressed as average value ± standard deviation of the measurement.
SampleDilutionPhenols [mg/L]
Olive leaf extractX5145 ± 4.33
Olive leaf extract, UF retentateX2335 ± 11.7
Olive leaf extract, NF retentate-8282 ± 299
Olive leaf extract, NF permeate-320 ± 9.11
Coffee residue extractX2125 ± 1.55
Coffee residue extract UF retentateX2150 ± 1.14
Coffee residue extract UF permeateX2490 ± 2.92
Coffee residue extract NF retentate-560 ± 16.9
Coffee residue extract NF permeate-44 ± 1.75
UF membrane module: Ceramic, zirconia, tubular, 100 nm pore size, 0.24 m2. NF membrane module: Advanced polyamide, spiral wound, 470 MWCO, 2.4 m2.
Table 2. Estimated parameters for batch adsorption kinetics of olive leaf extract NF retentate.
Experimentk1 [min−1]k2 [min−1 mg−1 g]
C11.07 × 10-27.09 × 10⁻⁴
C21.94 × 10-24.16 × 10⁻⁴
C31.79 × 10-25.02 × 10⁻⁴
C41.69 × 10-23.76 × 10⁻⁴
Table 3. Estimated parameters for the three isothem model for the batch adsorption of olive leaf NF retentate.
ModelParameter 1Parameter 2R2
LinearKlin [L g−1] = 3.46 × 10⁻³-0.98
LangmuirKlang [L g−1] = 4.59 × 10⁻⁴qmax [mg/g] = 72.00.94
FreundlichKf [L1/n g−1 mg1/n−1] = 2.90n = 30.96
Table 4. Estimated Thomas model parameters for the different samples used in packed column adsorption experiments and model fitting R2.
SamplekTh [mL min−1 mg−1]qe [mg g−1]R2
Olive leaf extract2.21 × 10−375.90.992
Olive leaf extract, UF retentate7.07 × 10−42290.996
Olive leaf extract, NF retentate6.22 × 10−5230.938
Olive leaf extract, NF permeate1.26 × 10−41700.999
Coffee residue extract5.83 × 10−42570.974
Coffee residue extract UF retentate6.40 × 10−424.30.972
Coffee residue extract UF permeate1.12 × 10−43170.993
Coffee residue extract NF retentate5.86 × 10−516180.993
Coffee residue extract NF permeate7.65 × 10−41180.966
Disclaimer/Publisher’s Note: The statements, opinions and data contained in all publications are solely those of the individual author(s) and contributor(s) and not of MDPI and/or the editor(s). MDPI and/or the editor(s) disclaim responsibility for any injury to people or property resulting from any ideas, methods, instructions or products referred to in the content.

