Article

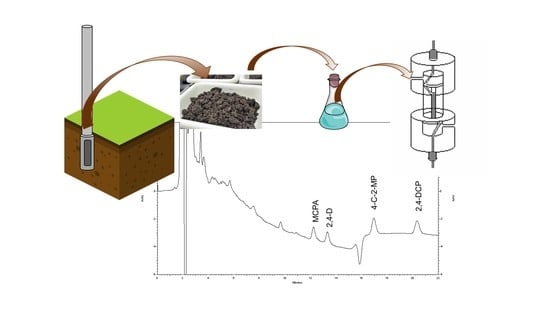
Hollow-Fiber Liquid-Phase Microextraction (HF-LPME) Coupled On-Line to Liquid Chromatography for the Determination of the Herbicides 2,4-Dichlorophenoxyacetic Acid and 2-Methyl-4-chlorophenoxyacetic Acid and Their Main Metabolites in Soil Samples

Department of Chemistry, University of Girona, 17003 Girona, Spain
*
Author to whom correspondence should be addressed.
Separations 2023, 10(5), 273; https://doi.org/10.3390/separations10050273
Submission received: 3 April 2023 / Revised: 18 April 2023 / Accepted: 21 April 2023 / Published: 23 April 2023
(This article belongs to the Special Issue Feature Papers in Separations from Editorial Board Members)

Abstract

:
The use of hollow-fiber liquid-phase microextraction (HF-LPME) is very promising for the clean-up, enrichment, and analysis of chlorophenoxyacetic acid herbicides and their metabolites from environmental and biological samples. An on-line methodology coupling HF-LPME (using a hydrophobic polypropylene hollow fiber of 57 cm length, 0.3 mm i.d., 0.2 μm pore size, and 75% porosity) and HPLC-UV has been developed for the analysis of these compounds in soil samples taken from environments treated with these herbicides. Di-hexyl ether was found to be the best solvent for the enrichment of the target herbicides. The use of supported liquid membranes has shown a high and efficient clean-up of the dissolved organic matter present in soil extracts. The enrichment factors achieved with the on-line methodology have allowed us to reach the detection limits of 0.1–0.3 µg·kg−1 soil, by analyzing 20 mL of alkaline extract as a donor solution and using 1 mL of stripping solution, which has permitted us to detect and follow the presence of these compounds in soil samples until nine days after the application of the herbicide. The on-line method has been applied in a preliminary study to assess the mobility of the chlorophenoxyacetic acid herbicides through soils. It has also been found that degradation of these compounds in soil is relatively fast and some metabolites were detected in soils just one day after the application of the herbicide. The high enrichment factors obtained with the HF-LPME procedure allow for the obtainment of low detection limits, which permits the use of a simple HPLC detector, such as UV, which simplifies and reduces the cost of analyses.

Graphical Abstract

1. Introduction

Chlorophenoxy acid herbicides are a subclass of phenoxy herbicides, which includes, among others, 2,4-dichlorophenoxyacetic acid (2,4-D) and 2-methyl-4-chlorophenoxyacetic acid (MCPA). These compounds are widely used in agriculture, weed control, and forestry, and several hundreds of commercial products contain chlorophenoxy herbicides in various forms and combinations [1]. 2,4-D is one of the most extensively used herbicides [2,3]; in 2012, it was the most commonly used pesticide active ingredient in the home and garden market and the fifth-most-used in the agricultural market sector in the US [4].
Formulations containing mixtures of 2,4-D and MCPA are commonly used for the control of broadleaf weeds in turfs. These compounds are easily degraded by soil microorganisms into phenol derivatives, such as 2,4-dichlorophenol (2,4-DCP), 4-chloro-2-methylphenol (4-C-2-MP), 2-methylphenol (2-MP), 2-chlorophenol (2-CP), and 4-chlorophenol (4-CP) (see the Supplementary Materials for the chemical structures of the analytes and metabolites evaluated), which are more hazardous to human health than the original chlorophenoxy acids [5]. Therefore, it is necessary to study the presence and levels of chlorophenoxy herbicides and their metabolites in soils to predict their impact and the quality of the soil.
The conventional methods to analyze chlorophenoxy acid compounds from soils require an alkaline aqueous extraction in order to hydrolyze any esters and deprotonate the analytes, which allows for their extraction into the aqueous solution. Then, the supernatant is separated. Thereafter, the analytes are re-protonated to obtain them in their non-ionized form and extracted by liquid–liquid extraction (LLE) into an organic solvent [6]. Using this procedure, the analytes can be determined by GC, but phenoxy acid herbicides contains carboxylic functional groups, which results in these compounds being highly polar and having high boiling points, and a derivation step of the analytes is required before GC analysis [6,7]. Another problem of LLE is that it requires large amounts of organic solvents and does not meet the requirements of green analytical chemistry [8]. When dealing with soil extracts, other problems come (i) with the co-extraction of large amounts of dissolved organic matter (DOM), which comes from humic and fulvic substances present in soils, and (ii) the sensitivity required as phenoxy herbicides are usually present at subtrace levels in soil samples. To solve these problems, it is required to perform some treatment steps for the enrichment and clean-up of the soil extracts before performing the subtrace level determination of 2,4-D, MCPA, and their metabolites. Some methodologies combining the extraction, enrichment, and clean-up of these compounds have been proposed, using pressurized fluid extraction (PFE) [6,7], microwave-assisted extraction (MAE) [9], and solid-phase extraction (SPE) [7,10,11,12], which still use significant amounts of organic solvents and cannot be considered green methods. Some green methodologies have been proposed using subcritical water extraction [13] and supported liquid membranes (SLMs) [14]. However, these methodologies are time-consuming and some require aggressive temperature/pressure conditions.
It has been reported that a good strategy for the greening of extraction methods should be based on miniaturization approaches to substantially reduce sample and solvent consumption [8]. Microextraction techniques use very small volumes of solvents, as the volume of the extracting phase is small with respect to the volume of the sample, they yield large enrichment factors, and they can be adapted to a wide variety of samples and analytes [15]. Different microextraction techniques have been applied in the determination of acidic compounds from different complex matrices, such as single-drop liquid-phase microextraction (SDLPME) [7,16], dispersive liquid–liquid microextraction (DLLME) [7,17,18], hollow-fiber liquid-phase microextraction (HF-LPME) [7,19,20,21,22,23], microporous membrane liquid–liquid extraction (MMLLE) [24], and supramolecular solvents (i.e., nanostructured liquids generated from amphiphilic molecules by self-assembly processes) [25]. A combination of membrane-based microextraction with other pretreatment techniques (electromembrane extraction, EME, combined with DLLME [26]) has also been evaluated for the extraction and clean-up of chlorophenols in environmental water samples.
One of the main advantages of the liquid-phase microextraction (LPME) techniques is that the final solution obtained is aqueous and analytes can be determined by HPLC [12,27], which does not require a preliminary derivatization step as in GC [7]. From these techniques, HF-LPME seems to be one of the most adequate [19,20,21,28,29,30], as it uses small amounts of solvents (a few microliters), it is just a miniaturized form of LLE, it is simple to implement and use, and large enrichment factors can be obtained from small volumes of samples. Moreover, it has been found that a single hollow fiber can be used at least 20 times with no loss of efficiency and no carry over between runs [21].
The main drawback of HF-LPME for routine analysis is probably that it requires high operational skills and is hardly automatable, and for these reasons HF-LPME methods are usually considered unfriendly [30]. Therefore, the main objective of this study is to develop a simple on-line sample preparation methodology based on an HF-LPME configuration coupled to HPLC-UV for the determination of 2,4-D, MCPA, and their metabolites from soil extracts, which may allow for their determination at residue levels with HPLC-UV. To assess the efficiency of the proposed method, it has been applied to the analysis of the target compounds in soil samples taken from a golf course, where a commercial herbicide composed of mixtures of chlorophenoxy acid compounds is regularly applied for the control of broadleaf weeds in the turf.

2. Experimental

2.1. Reagents and Solutions

The herbicides 2,4-dichlorophenoxyacetic acid (98.4%) and 2-methyl-4-chlorophenoxyacetic (97.5%) and their metabolites, 2-methylphenol (99.5%), 2-chlorophenol (99.5%), 4-chlorophenol (99.5%), 2,4-dichlorophenol (99.5%), and 4-chloro-2-methylphenol (99.5%), were obtained from Dr. Ehrenstorfer GmbH (Augsburg, Germany). Individual stock standard solutions (c.a. 1000 µg·mL−1) were prepared in methanol and stored at 4 °C. Diluted stocks and working solutions were prepared by diluting and mixing the stocks with Milli-Q water (Millipore Iberica, Barcelona, Spain) and were freshly prepared each day.
Acetonitrile of pesticide-residue-grade was from Carlo Erba (Milan, Italy). Isopropylbenzene, 1-dodecanol, and dodecane (organic solvents used for the impregnation of the membranes) were form Merck (Hohenbrunn, Germany), whereas decaline, decane, and dihexyl ether were form Sigma-Aldrich (Steinheim, Germany). All other reagents were analytical-grade.
The HPLC mobile phase consisted of a mixture of acetonitrile with an aqueous ion-pairing (IP) reagent solution (30:70, v:v) [27]. A 10 mM tetrabutylammonium hydroxide (TBA-OH) solution was used as the IP reagent (Fluka, Buchs, Switzerland). The pH of the aqueous mobile-phase solution was adjusted to 7.2 ± 0.1 with 85% o-phosphoric acid (Panreac, Barcelona, Spain).

2.2. Instrumentation

The chromatographic determinations were performed on a SpectraSYSTEM HPLC (Thermo Finnigan, San Jose, CA, USA) equipped with a UV6000LP diode-array detector. Samples were injected using a 20 µL sample loop. Separations were performed in isocratic mode on a 20 cm × 0.46 cm i.d. column packed with a 5 µm Kromasil 100 C18 silica phase (Teknokroma, Barcelona, Spain). The flow rate was set at 1 mL·min−1 and analyses were conducted at 25 ± 1 °C at 230 nm.

2.3. Membrane Equipment and Procedure

Two different membrane configurations were used (Figure 1). For the preliminary studies of the liquid membrane system, experiments were carried out using a flat membrane in a cell set-up provided with two separated compartments (for the aqueous feed and stripping solutions), with a capacity of 200 cm3 each, connected by a circular window (3.8 cm diameter), where the impregnated flat-sheet membrane is placed (Figure 1a). The microporous support for the liquid membrane was a polydifluoroethylene film (Millipore, Carrigtwohill, Ireland) with a 125 µm thickness, 75% porosity, and an average pore size of 0.2 µm. The support was impregnated with a solution of the organic solvent selected for each experiment. The aqueous feed and the stripping solutions were stirred at 1000 rpm in all flat-sheet experiments. The zero time of these experiments was taken as the moment when the stirring motors started. Changes in the concentrations of analytes were followed by withdrawing 20 μL from the stripping and feed solution at predetermined times and analyzing them by HPLC. All experiments were carried out at 25 ± 1 °C.
A HF-LPME set-up was used for the enrichment and clean-up experiments (Figure 1b). A single hydrophobic polypropylene hollow fiber (Azko Nobel, Wuppertal, Germany) was used as the support for the liquid membrane. The fiber had a 0.3 mm i.d., 0.5 mm o.d., 0.2 µm pore size, 75% porosity, and total length of 57 cm, coiled on a central support. The hollow-fiber-supported liquid membrane was prepared by a slow impregnation of the tubular microporous fiber flowing the selected organic solvent through the lumen side of the hollow-fiber module. Thereafter, a 0.1 M sulfuric acid solution and a 0.01 M NaOH solution were flowed through the exterior and interior sides of the fiber, respectively, for the removal of the excess organic solvent. Once the membrane was impregnated with the solvent, sample and receiving solutions were circulated through the shell and lumen sides of the hollow fiber, respectively, at a flow rate of 0.6 mL·min−1 by using a Minipuls 3 M312 peristaltic pump (Gilson, Villiers Le Bel, France). In total, 20 mL of feed solutions, acidified soil supernatant extracts (at pH = 2), was flowed through the shell side of the fiber, while in the lumen side 1 mL of 0.01 M sodium hydroxide was recirculated.

2.4. Soil Samples and Alkaline Extraction

A plot of 100 m2 in a golf course in Pals (Girona, Spain) was spiked with the target herbicides using ground spray equipment loaded with a solution of 0.2 mL·m−2 of Bi-Hedonal® (Bayer Hispania Industrial S.A., Barcelona, Spain), a commercial formulation of 2,4-D (27.5%, w/v) and MCPA (27.5%, w/v) as esters. The soil is a mud–sand soil composed of calcite and quartz with a small content of clay (6% clay, 38% mud, 52% sand). Soil samples were drawn from the spiked area at three different depths (1: 0–10 cm; 2: 10–30 cm; 3: 30–100 cm) at different time intervals for a period of 30 days after the herbicide application. As the study area is part of a golf course, it was irrigated daily. Core samples taken were air-dried in a clean environment at room temperature, sieved to a particle size ≤2 mm, and stored in glass amber bottles at −4 °C to prevent further degradation of analytes.
A previously optimized extraction procedure was applied for the alkaline extraction of the herbicides and their metabolites from soils [12]. First, 15 g subsamples of sieved soil samples were extracted with 30 mL of 0.01 M sodium hydroxide in a rotatory mixer at 30 rpm (Dinko, Barcelona, Spain) for 30 min at 25 ± 1 °C. Alkaline extracts were centrifuged at 2000 rpm for 20 min to separate the soil supernatants, which were filtered through 0.45 µm cellulose acetate filters (Teknokroma, Barcelona, Spain). The pH of the alkaline extract was adjusted to pH ≤ 2 with sulfuric acid before analysis with the on-line HF-LPME/HPLC-UV methodology.

3. Results and Discussion

3.1. Donor (Feed) and Acceptor (Stripping) Phases

The ionic and polar characteristics of the chlorophenoxy acid herbicides (2,4-D: pKa = 2.98; MCPA: pKa = 3.14) and their metabolites (pKa values ranging from 8.1 to 10.3) suggest that the passive diffusion of the non-ionized forms of the analytes through the membrane (containing only an organic solvent, without using a carrier) followed by a pH gradient in the acceptor solution (at pH ≥ 12) is the most appropriate for the target compounds [31,32]. In these conditions, the concentration gradient of the species is usually unaffected by the total concentration of the solute in the acceptor phase, and large enrichment factors can be obtained, especially using the hollow-fiber configuration [30,32,33]. As was found in previous studies using HF-LPME methodologies [19,20], the best conditions for the microextraction of 2,4-D and other phenoxy acid herbicides were obtained using a 0.1–0.5 M HCl donor phase and a 0.01–0.5 M NaOH acceptor phase. In our study, feed solutions were prepared in 0.1 M sulfuric acid media and a 0.01 M sodium hydroxide was chosen for the acceptor phase.

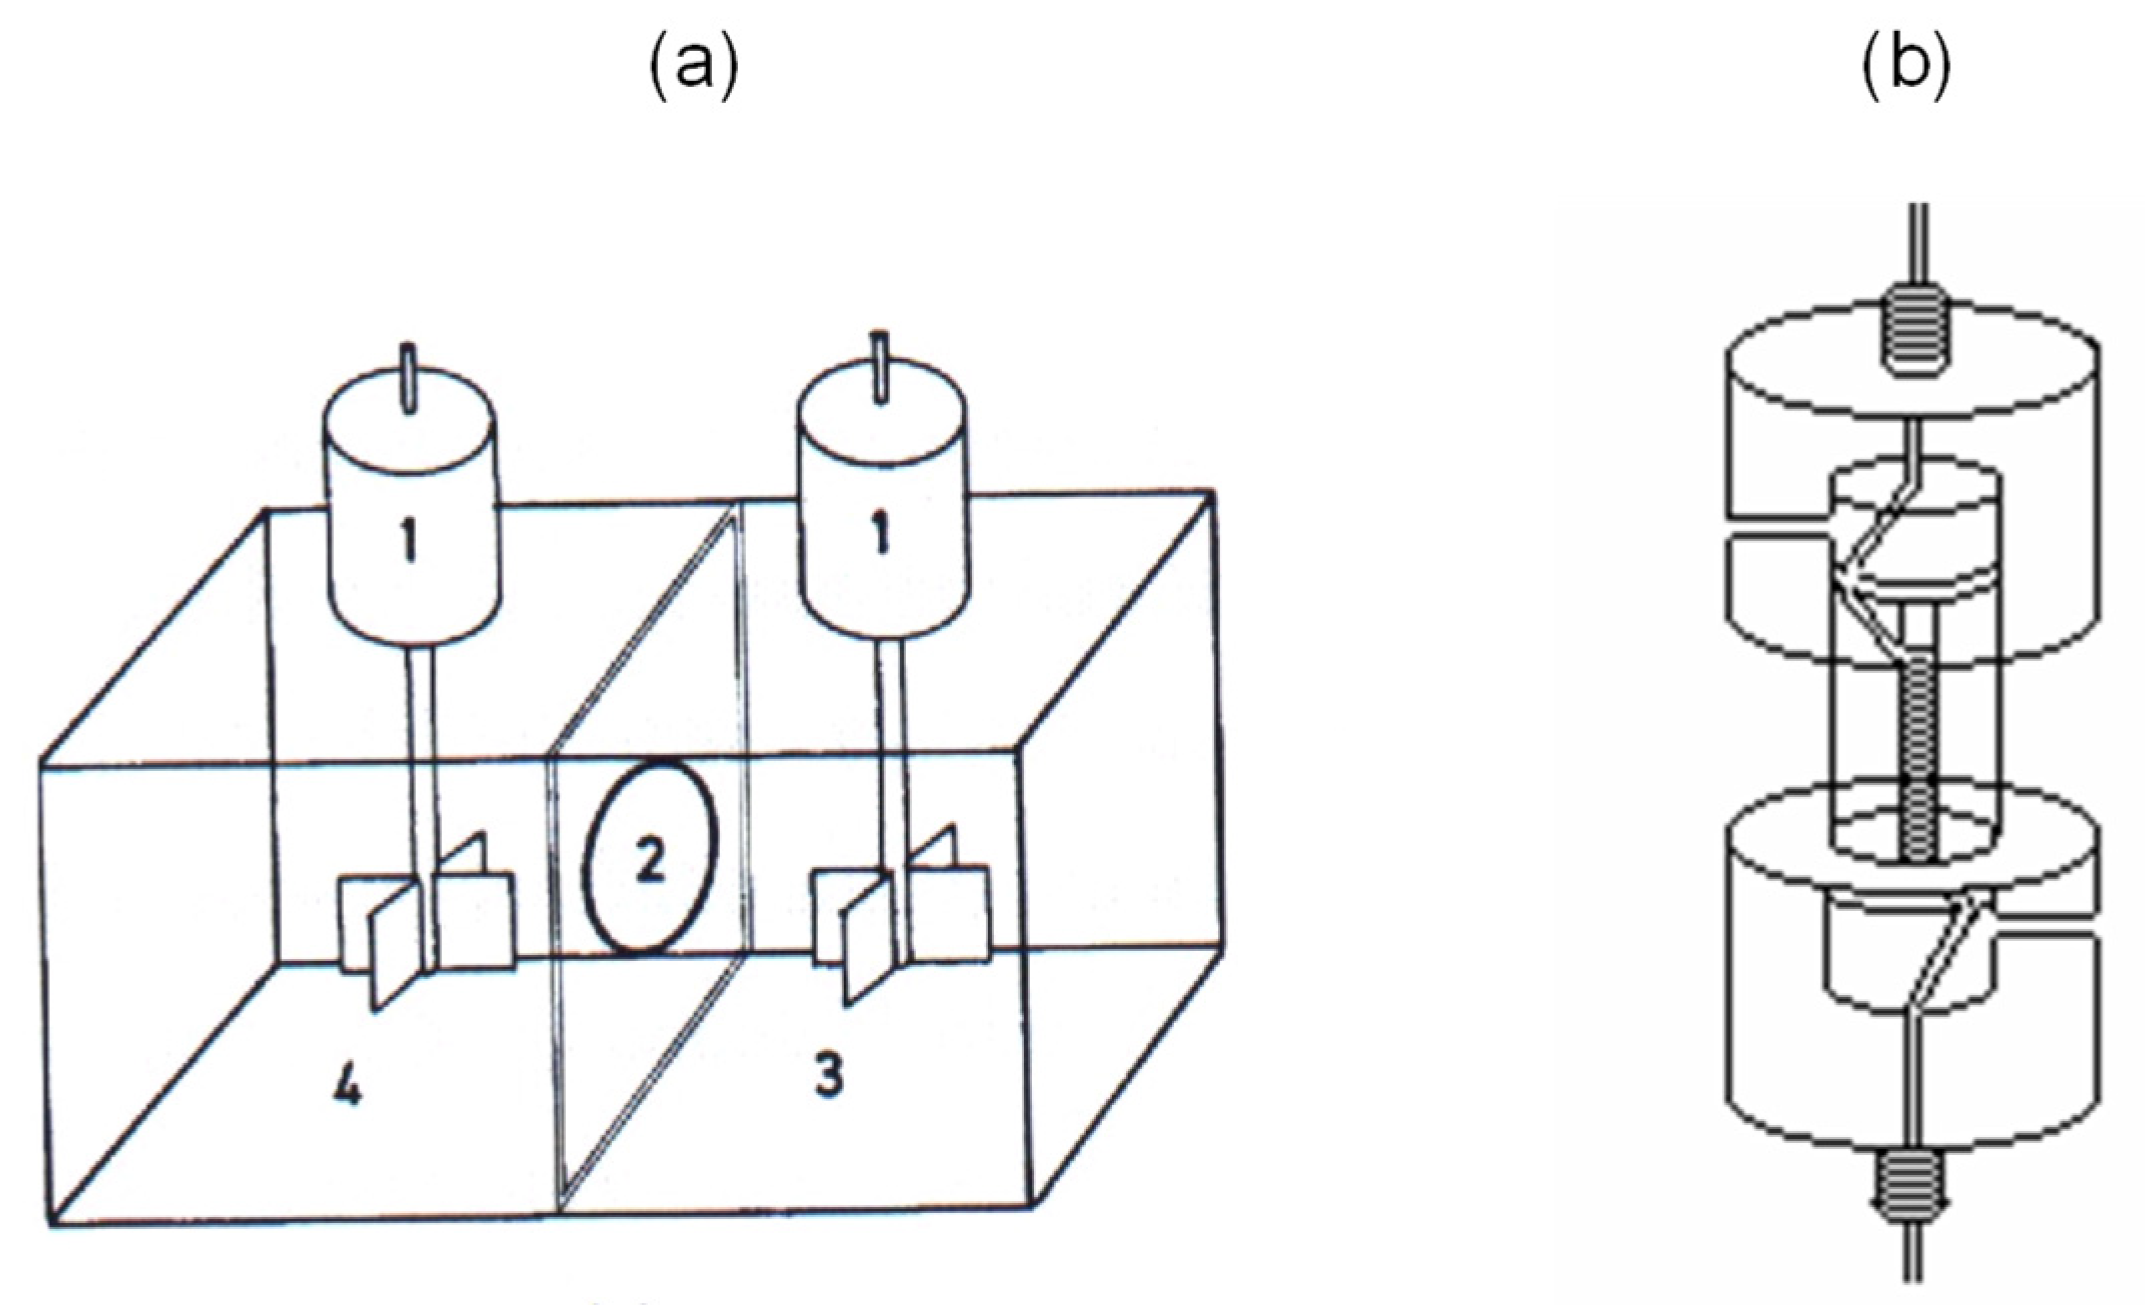
3.2. Preliminary Flat-Sheet Membrane Configuration Studies

The flat-sheet membrane configuration is experimentally simpler than the hollow-fiber configuration for the experimental study of the effect of the organic solvent and extraction kinetics. For this reason, before configuring the HF-LPME on-line methodology, some preliminary studies using a SLM configuration (flat-sheet membrane cell shown in Figure 1a) were performed for the assessment of the transport of 2,4-D, MCPA, and their metabolites through the liquid membrane. The membrane extraction capability was determined by the extraction efficiency, E (i.e., the analyte fraction recovered in the acceptor phase), which is the main parameter to be characterized in SLM systems [34].

3.2.1. Selection of the Organic Solvent

A polar solvent in the membrane is desirable to obtain large distribution coefficients for polar analytes [35], which are the target compounds of this study. However, polar solvents are partially soluble in aqueous solutions and can easily move out of the membrane and contaminate the aqueous feed and stripping solutions. Six solvents and mixtures were evaluated to determine their effect in the transport of the analytes (Table 1). Di-hexyl ether (DHE), the mixture DHE:decane (1:1), and isopropylbenzene were the only solvents that yielded extraction efficiencies >50% for all the compounds in the conditions assessed. The results obtained for isopropylbenzene and the mixture DHE:decane gave no significant differences for the extraction efficiencies for each analyte (p > 0.22). In the case of DHE, this solvent gave significantly higher extraction efficiencies than both the mixture DHE:decane and cumene (p < 0.04, Table 1) for all target compounds, except for 4-chloro-2-methylphenol, which gave equivalent recoveries with the three solvents (p = 0.171). Therefore, DHE was chosen as the most appropriate solvent for subsequent experiments. This solvent is hydrophobic enough (log POW = 4.55 [36]) to ensure that it does not leave the porous part of the membrane to contaminate the aqueous solutions and yields large enough partition coefficients for ionizable organic compounds to be transported across the membrane [36,37].

3.2.2. Extraction Time and Enrichment Factors

Some preliminary kinetic studies (evaluating 1 and 2 h extraction times) showed that the mass transfer of the target compounds through the membrane is slow, and a time longer than two hours is required to reach the equilibrium with the SLM procedure assessed. It has to be taken into account that LPME systems, like solid-phase microextraction, are non-exhaustive extraction processes and they are dependent on the equilibrium [20]. It is also known that one of the main limiting stages with these systems is the mass transfer of the analytes through the organic solvent layer [29,30], and extraction times of >2 h can be required to reach equilibrium [38]. However, with non-exhaustive methods, it is not necessary to reach the equilibrium to obtain reproducible and acceptable results, but it is very important to perform the analysis of both samples and calibration standards applying the same experimental conditions to obtain reproducible extraction values [30]. The limitation when the extraction time applied is below the equilibrium time is that a proportional reduction in the sensitivity is also obtained. In our case, repeatability studies gave acceptable results, with relative standard deviations ≤10%, for all the compounds in the assessment of the extraction efficiency of the SLM in non-equilibrium conditions (n = 6, 1 h extraction), which confirmed that the membrane system yields reproducible results, with acceptable precision, working in non-equilibrium conditions.
The main limitation of the SLM configuration evaluated in the preliminary study is that it is not possible to enrich the sample because the volumes of the feed and stripping solutions are the same; it is only possible to perform a clean-up of the matrix components. For this reason, a HF-LPME configuration was assessed because higher enrichment factors are expected and, therefore, smaller method detection limits.

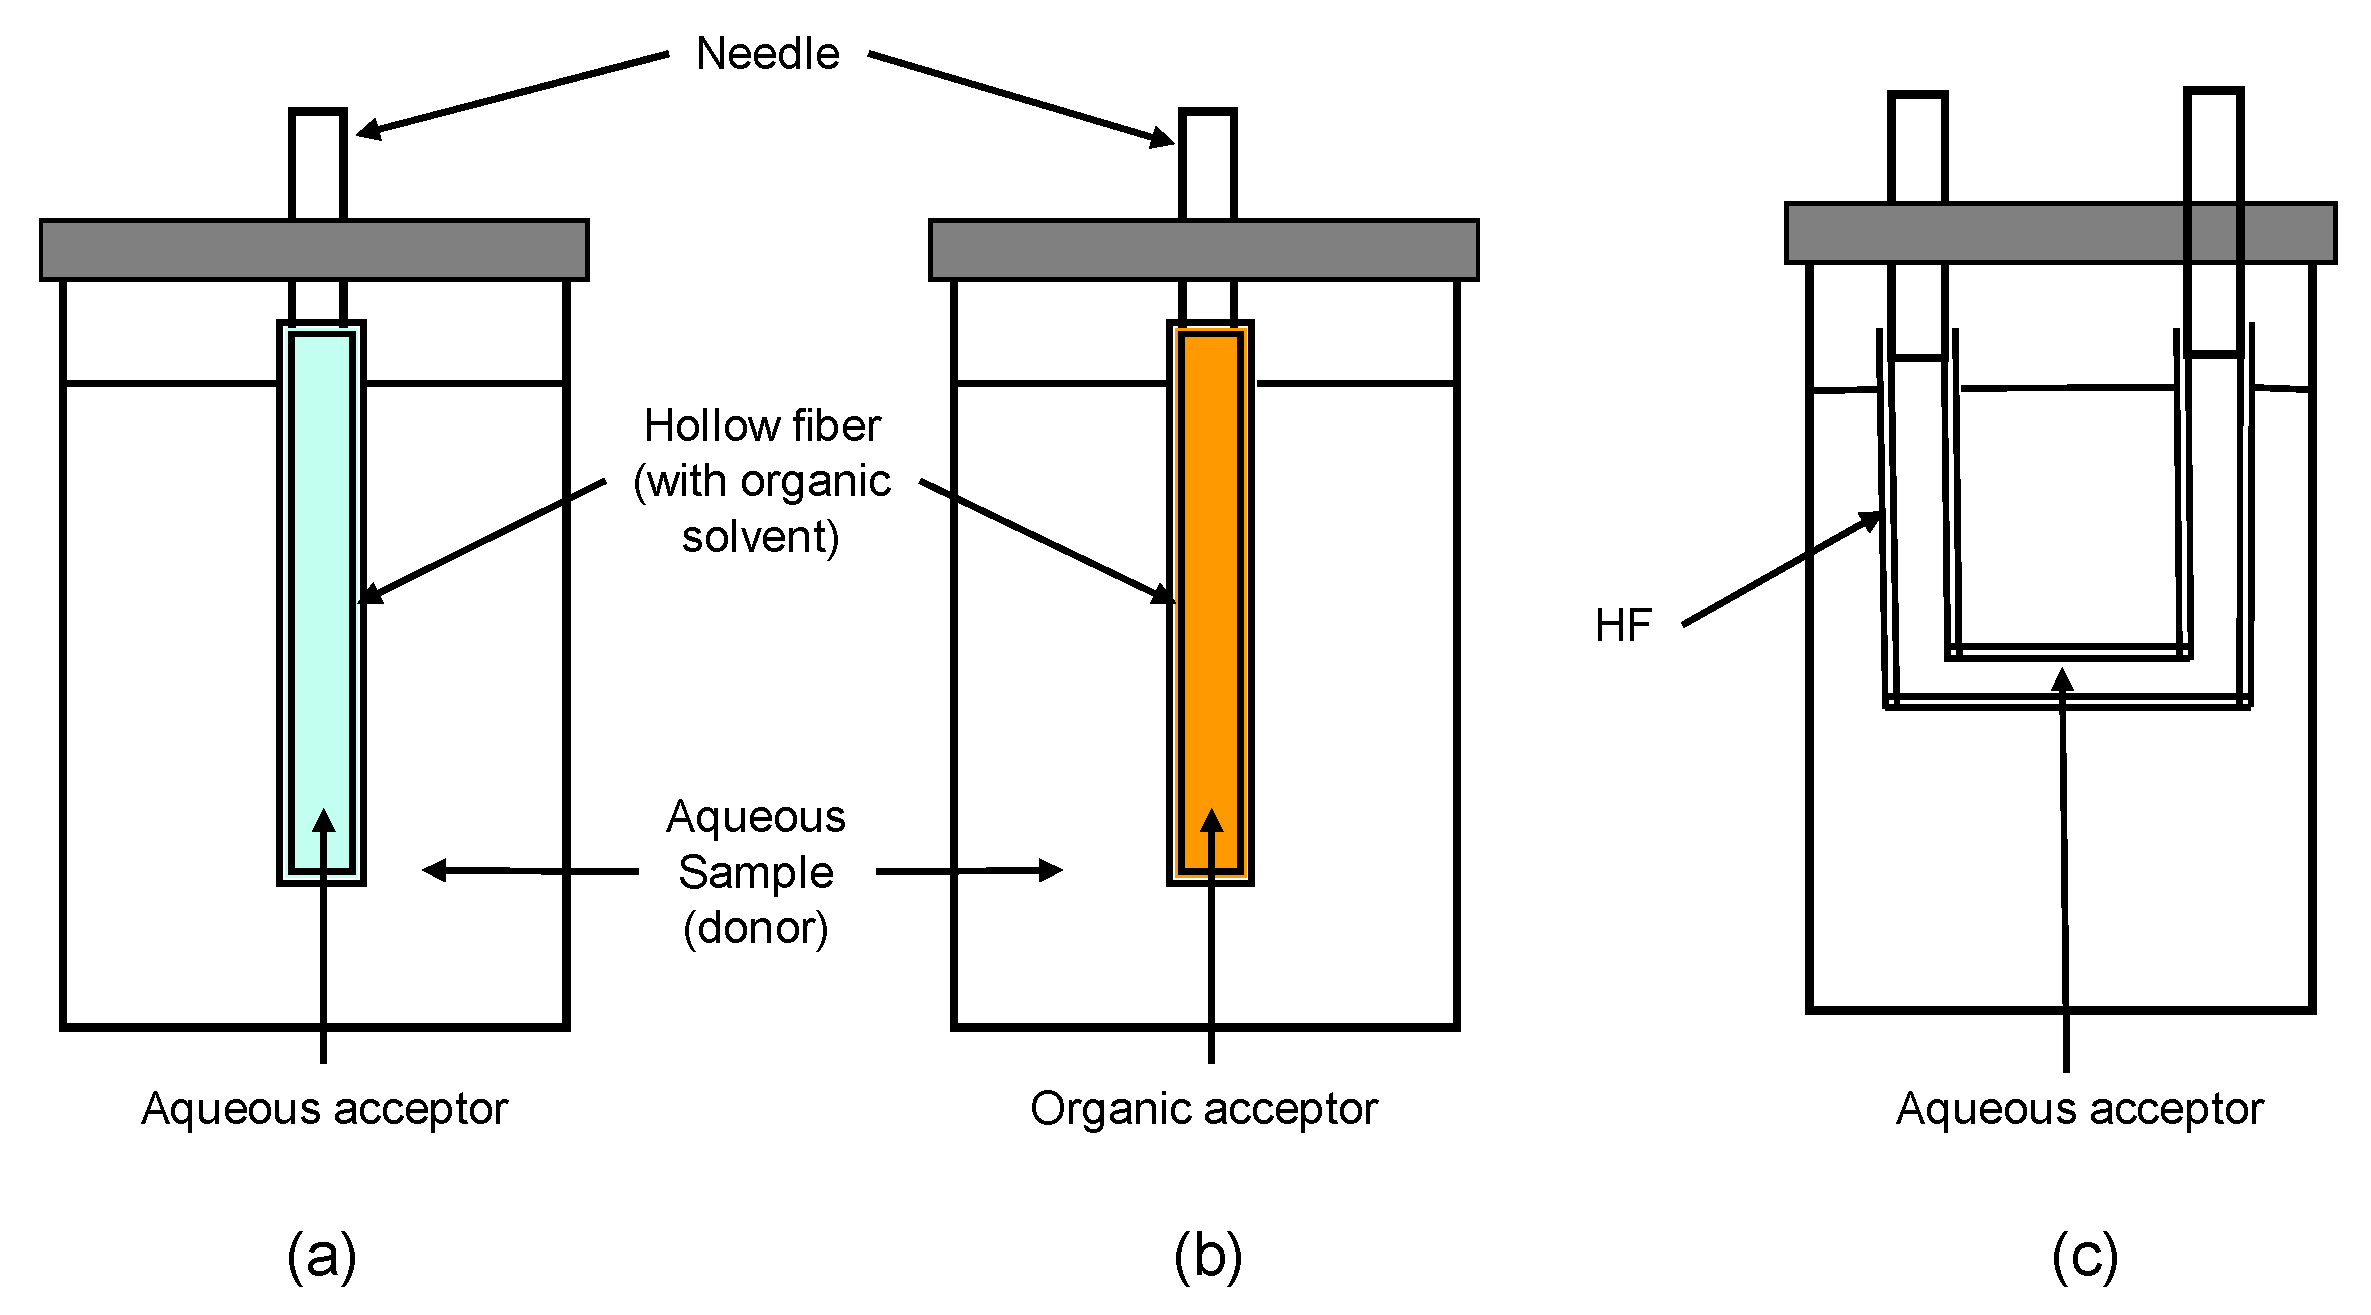
3.3. Hollow-Fiber Configuration: HF-LPME

The use of hollow-fiber geometry has many advantages because (i) it allows high-density modular packing, (ii) the disturbance generated in the hollow-fiber configuration at the membrane surface is lower than with a flat-sheet configuration, which preserves membrane stability (possibly due to the higher shear stress on the membrane surface in the flat-sheet system [39]), and (iii) larger enrichment factors than with a flat-sheet configuration can be easily achieved.
There are two possible set-ups with HF-LPME, two-phase and three-phase HF-LPME configurations (Figure 2); however, the three-phase configuration is the one commonly applied for the enrichment of ionized organic compounds exhibiting acidic or basic properties [19,28,29,30,32]. It has to be taken into account that the performance of an HF-LPME method is usually defined in terms of enrichment factor rather than extraction efficiency [33]. Therefore, the procedure required for the analysis is to locate the acceptor or stripping solution in the lumen side of the fiber (interior of the hollow fiber), because this configuration allows for the use of small volumes of the acceptor phase with respect to the volume of the donor phase (in all configurations: U-shaped, rod-like, and coiled long fiber). In our study, we have used a coiled long fiber configuration (Figure 1b), which allows us to continuously circulate the acceptor solution through the lumen side of the fiber. It was evaluated whether the extraction efficiency with the proposed HF-LPME configuration changes when compared to the flat-sheet membrane configuration and the results obtained for the majority of the target compounds yielded equivalent extraction efficiencies to those obtained with the flat-sheet configuration, for 1 h extraction time. When the enrichment factors were compared, factors of 5–8 were obtained for the combination of volumes assessed in a preliminary assessment using 35 mL of donor solution and 5 mL of acceptor solution. The dimensions of the fiber used (57 cm length and 0.3 mm i.d.) results in a volume of the lumen side of the fiber of 16l μL, which allows us to recirculate small volumes (minimum of ≈200 μL) of the acceptor solution through the lumen side of the fiber, which will increase the number of cycles of the extraction and the enrichment factors.

Sample Clean-Up with HF-LPME

In our study, the matrix of the samples evaluated is very complex as they are alkaline extracts of soil samples. The alkaline extraction of soil samples always leads to the co-extraction of large amounts of DOM, which are problematic with HPLC analysis. The analyses of the soils evaluated in this study yielded a mean organic matter content of 1.9% for the surface layer. DOM interferences cause an unstable baseline in reversed-phase HPLC, with a large hump at the beginning of the chromatograms that significantly reduces the sensitivity for the most polar compounds (Figure 3a). HF-LPME is usually an efficient method for sample clean-up as this methodology can reduce or eliminate potential problems from the matrix [29]. Some experiments were performed to assess the clean-up efficiency for DOM interferences of the HF-LPME procedure. As can be seen in Figure 3a, direct injection in the HPLC-UV of alkaline extracts of a non-contaminated soil, spiked with 2,4-D and 2-MP (this compound was selected as it is the most polar of the target compounds and appears first in the chromatograms [27]), resulted in a considerable hump at the beginning of the chromatogram due to the co-extracted humic and fulvic substances. The analysis of the same spiked alkaline extract after HP-LPME treatment gave clean chromatograms (Figure 3b) without interferences from DOM.

3.4. On-Line HF-LPME Configuration

Once the HF-LPME proved to be useful for the clean-up and enrichment of the phenoxyacetic acid herbicides and their metabolites, a hollow-fiber module coupled on-line to the HPLC-UV system was developed for the continuous and automatic analysis of alkaline soil extracts (Figure 4). A limitation of the on-line configuration developed is that the set-up required us to recirculate a minimum volume of 1 mL for the stripping solution, taking into account the requirements for allowing all the connections with the HPLC system.
Some studies for the enrichment of phenoxy acid herbicides with HF-LPME using a rod-like configuration (Figure 2a) found that an increase in the cycles used with this configuration, up to 20–24 cycles, increased the extraction efficiency because it favors the mass transfer of analytes from the aqueous donor phase to the organic solvent and then to the aqueous acceptor phase [19,20]. It was also found that an excessive number of cycles can lead to a decrease in the extraction efficiency [19], which was associated with a possible loss of the extraction solvent as a result of its dissolution in the aqueous solutions [19,40]. The extraction time required with our on-line HF-LPME (33 min recirculating 1 mL of the stripping solution at 0.6 mL·min−1) can be equated to a maximum of 18 cycles with a rod-like configuration. Therefore, it is not expected to have losses of organic solvents in the conditions applied. To confirm this hypothesis, the same impregnated fiber was evaluated for 20 replicate analyses of a standard solution in different days (four replicates/day for five days). The relative standard deviations obtained were <5% for repeatability (within-day precision) and <8% for inter-day precision, which suggest that there were no losses of the organic solvent used (DHE). Esrafili et al. [21] also evaluated a dynamic HF-LPME system and found that a single hollow fiber can also be used at least 20 times with no loss of efficiency and no carry over between runs. Despite the results obtained, it was decided to change the fiber each day when analyzing alkaline soil extracts taking into account the presence of significant amounts of DOM in the samples analyzed.
For the analysis of standards and alkaline extract samples, 20 mL of an acidified solution at pH = 1 (feed solution) and 1 mL of a 0.01 M sodium hydroxide solution (stripping solution) were applied. A cleaning step for the fiber between runs was performed circulating sulfuric acid at pH = 1 through the shell side of the fiber and 0.01 M sodium hydroxide through the lumen side for 10 min. The flow rate applied for the circulation of the solutions was fixed at 0.6 mL·min−1. Higher fluxes were not effective as the extraction efficiency was decreased, probably due to a decrease in the contact time between the aqueous solutions and the organic solvent, which reduced the mass transfer of the analytes. Smaller flows increased the extraction efficiency but also the time required for the analysis of each sample. Taking into account the enrichment factors obtained and the need to obtain the highest sample throughput possible, a flow rate of 0.6 mL·min−1 was chosen as a compromise.

3.5. Quality Parameters of the On-Line HF-LPME Method

Specific details about the quality parameters of the proposed HF-LPME method are presented in the Supplementary Materials. Briefly, weighted least squares (WLS) were applied as the use of conventional ordinary least squares yields highly biased results at low concentration levels [41,42]. The relative standard error (RSE) [42] determined with the WLS ranged from 7% to 15% (Table S1), which confirmed the goodness-of-fit of the WLS regression parameters determined. The proposed methodology showed linear responses, with accurate and precise determinations being obtained in a working range between 1 and 30 μg·L−1 for each analyte (Tables S1 and S2), which corresponds to a range in soil samples between 2 and 60 μg·kg−1 soil. The method detection limits (MDLs) for the target compounds were between 0.1 and 0.3 µg·kg−1 soil (determined from spiked soils at a content that yielded a signal-to-noise ratio ≥3; Figure S1). The precision of the method yielded relative standard deviations <15%, which were considered acceptable.

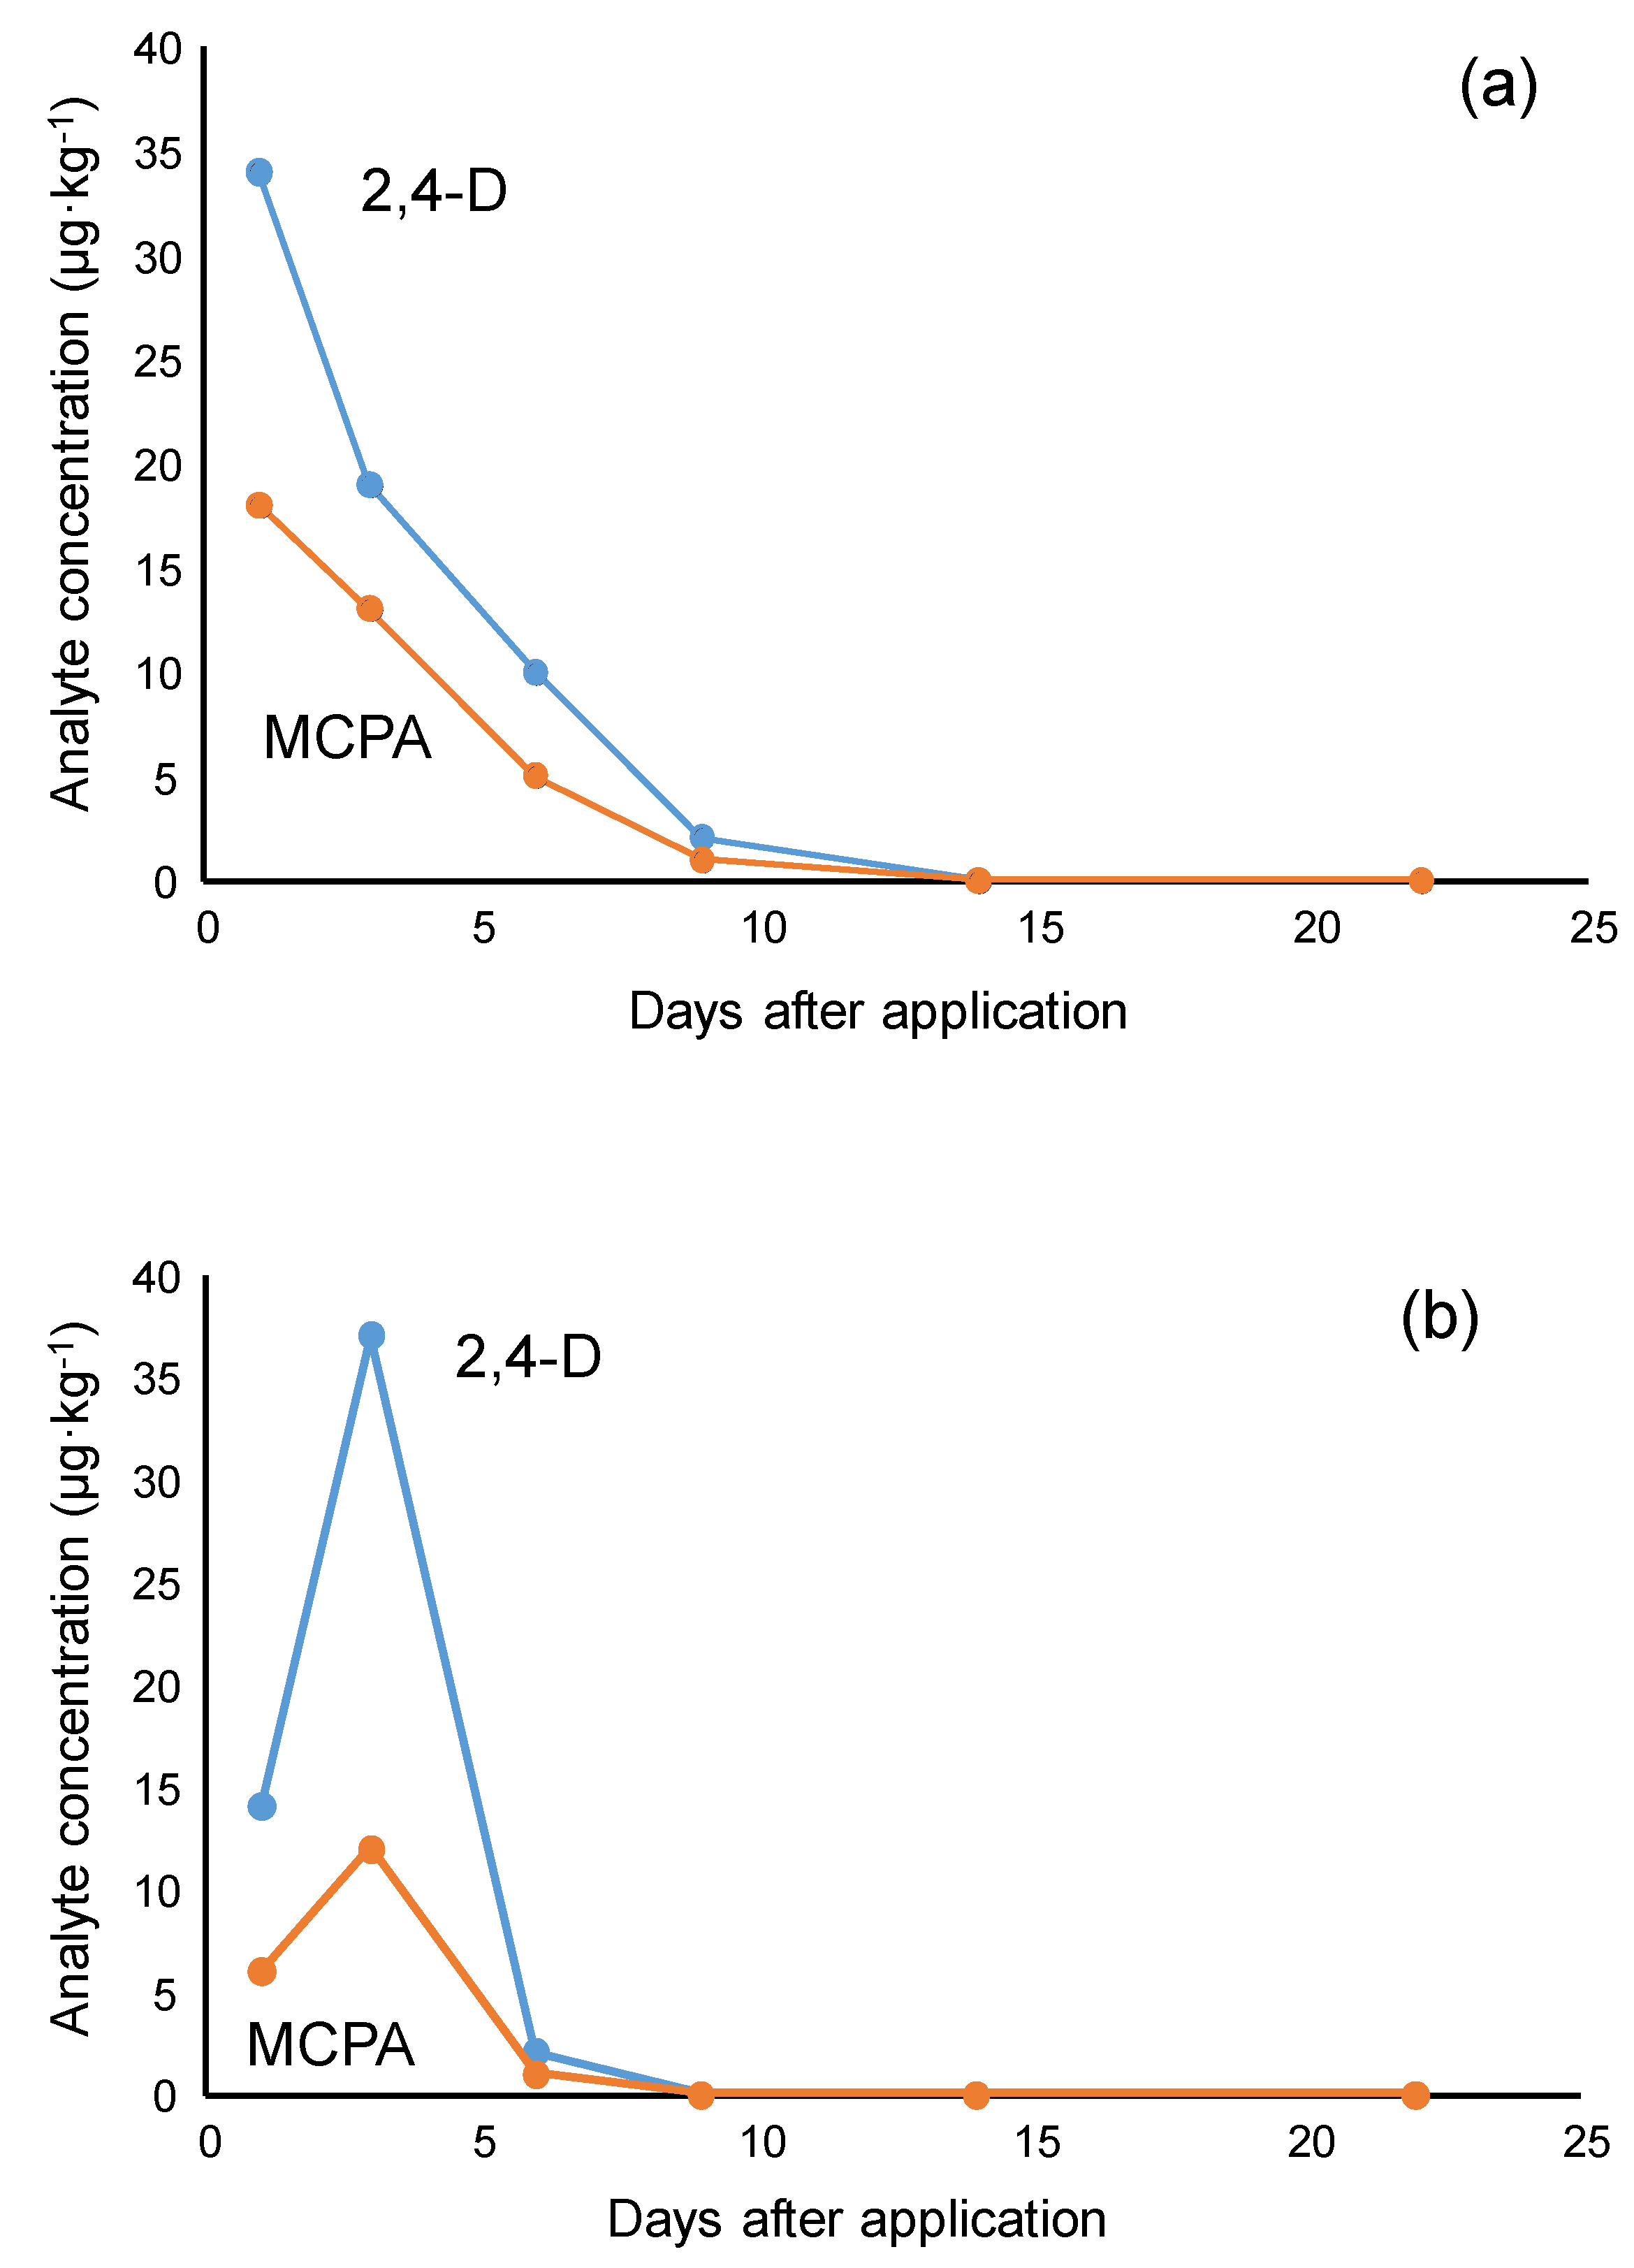
3.6. Analysis of Soil Samples

The developed on-line method was applied to the monitoring of phenoxyacetic acid herbicides and their metabolites in a field experiment. Soil samples from a golf course in Pals (Girona, Spain) were drawn at different depths and times. This soil was first treated with a commercial formulation containing 2,4-D and MCPA, as explained in the experimental section. Table 2 shows the concentrations found in some of the soil samples evaluated in this study with the on-line HF-LPME/HPLC-UV method.
A preliminary assessment of the distribution profiles obtained for 2,4-D and MCPA in the soil evaluated in this study at different depths is shown in Figure 5. The maximum content of the two herbicides in the surface layer of the soil (0–10 cm) was found the first day after application, whereas the highest level was detected the third day after application in the intermediate layer (10–30 cm). In the case of the deepest layer (30–100 cm), it was not possible to detect the presence of the two herbicides, but some of their metabolites were detected in some of these samples, although their content was practically always below the quantification limit (set at 1 µg·kg−1 soil). de Amarante et al. [43] also found that 2,4-D was detected in soils up to 15 days after the application of the herbicide in soils from eucalyptus fields. Another study [5] was unable to detect the presence of these herbicides in inner soil layers until nine days after application. However, it was coincident with the first irrigation of the assessed soils. As explained in the methodology section, the soil evaluated in the present study is from a golf course, which is irrigated daily. Therefore, it can be concluded that the mobility of the phenoxyacetic herbicides through soil layers is highly favored by the irrigation of the soil.
It was also found that the two herbicides degrade relatively fast as different metabolites were observed from the first day after the application of the herbicide. Moreover, the two phenoxyacetic acids were not detected after >9 days of application. These results agree with previous studies that have reported half-life times in soils for these two compounds ranging from 4.3 to 5.1 days) [5,44,45]. Unfortunately, the quantification limit for the on-line method is still excessive for an accurate determination of the metabolites because the maximum content detected for a metabolite was 2.8 μg·kg−1.

4. Conclusions

An on-line microextraction methodology based on HF-LPME coupled to HPLC-UV has been developed in this study. Despite the fact that the requirements needed for the on-line configuration did not allow for the use of the HF-LPME method in optimized conditions, the clean-up and enrichment factors obtained were appropriate to reach small enough detection limits (0.1–0.3 µg·kg−1 soil) to perform an accurate assessment of the transport of the two phenoxyacetic acid herbicides through the soils evaluated (obtained from a golf course treated with the target herbicides). However, the detection limits obtained for the metabolites only allow for the detection of their presence in the majority of the samples evaluated but do not allow an accurate quantification of these metabolites. Therefore, a method with lower detection limits is required for an appropriate quantification of these metabolites. It can be achieved coupling the HF-LPME system to a more sensitive detector, such as HPLC-MS.
It has been demonstrated that the on-line configuration applied allows for a simple automatization of the procedure required to analyze the target compounds at ultra-trace levels, reducing the need for highly operational skills compared to when HF-LPME methodologies are used manually.

Supplementary Materials

The following supporting information can be downloaded at: https://www.mdpi.com/article/10.3390/separations10050273/s1, Figure S1: Chromatogram obtained after the HF-LPME/HPLC-UV analysis of a non contaminated soil sample, spiked at 0.5 μg·kg−1 with four target analytes. Table S1: Results obtained in the validation of the on-line HF-LPME/HPLM-UV methodology proposed. (WLS: weighted least squares; RSE: relative standard error; MDL: Method Detection Limit; SE: Standard Error). Table S2: Concentrations detected (µg·kg soil−1) for three soil samples evaluated with the proposed on-line HF-LPME method and a previously validated method using SPE [6] (n = 3; values in brackets are the sample standard deviation, d: detected: nd: not detected, <MDL).

Author Contributions

Conceptualization, M.H. and J.M.S.; Methodology, S.M., M.H. and J.M.S.; Samples Collection, S.M. and M.H.; Laboratory Analyses, S.M., M.H. and J.M.S.; Resources, M.H. and J.M.S.; Data Interpretation, S.M., M.H. and J.M.S.; Writing—Original Draft Preparation, S.M. and J.M.S.; Writing—Review and Editing, M.H. and J.M.S.; Funding Acquisition, M.H. and J.M.S. All authors have read and agreed to the published version of the manuscript.

Funding

This research was funded by the Ministry of Science, Innovation and Universities (Spain), project PID2019-107033GB-C22.

Institutional Review Board Statement

Not applicable.

Informed Consent Statement

Not applicable.

Data Availability Statement

Data from this study are available on request to the corresponding authors.

Acknowledgments

The authors thanks C. Fontàs (Universitat de Girona) for her permission to use Figure 1.

Conflicts of Interest

The authors declare no conflict of interest.

References

  1. US Environmental Protection Agency. Chlorophenoxy herbicides. In Recognition and Management of Pesticide Poisonings, 6th ed.; Section III, Chapter 10; US-EPA: Washington, DC, USA, 2013; pp. 98–102. Available online: https://www.epa.gov/pesticide-worker-safety/pesticide-poisoning-handbook-complete-document (accessed on 22 March 2023).
  2. Song, Y. Insight into the mode of action of 2,4-dichlorophenoxyacetic acid (2,4-D) as an herbicide. J. Integr. Plant. Biol. 2014, 56, 106–113. [Google Scholar] [CrossRef]
  3. Freisthler, M.S.; Robbins, C.R.; Benbrook, C.M.; Young, H.A.; Haas, D.M.; Winchester, P.D.; Perry, M.J. Association between increasing agricultural use of 2,4-D and population biomarkers of exposure: Findings from the National Health and Nutrition Examination Survey, 2001–2014. Environ. Health 2022, 21, 23. [Google Scholar] [CrossRef]
  4. US Environmental Protection Agency. Pesticides Industry Sales and Usage: 2008–2012 Market Estimates. 2015. Available online: https://www.epa.gov/pesticides/pesticides-industrysales-and-usage-2008-2012-market-estimates (accessed on 1 March 2023).
  5. Crespin, M.A.; Gallego, M.; Valcarcel, M. Study of the degradation of the herbicides 2,4-D and MCPA at different depths in contaminated agricultural soil. Environ. Sci. Technol. 2001, 35, 4265–4270. [Google Scholar] [CrossRef] [PubMed]
  6. David, M.D.; Campbell, S.; Li, Q.X. Pressurized fluid extraction of nonpolar pesticides and polar herbicides using in situ derivatization. Anal. Chem. 2000, 72, 3665–3670. [Google Scholar] [CrossRef]
  7. Mei, X.Y.; Hong, Y.Q.; Chen, G.H. Review on analysis methodology of phenoxy acid herbicide residues. Food Anal. Methods 2016, 9, 1532–1561. [Google Scholar] [CrossRef]
  8. Armenta, S.; Garrigues, S.; Esteve-Turillas, F.A.; de la Guardia, M. Green extraction techniques in green analytical chemistry. TrAC Trends Anal. Chem. 2019, 116, 248–253. [Google Scholar] [CrossRef]
  9. Luque-Garcia, J.L.; Morales-Muñoz, S.; Luque de Castro, M.D. Microwave-assisted water extraction of acidic herbicides from soils coupled to continuous filtration, preconcentration, chromatographic separation and UV detection. Chromatographia 2002, 55, 117–122. [Google Scholar] [CrossRef]
  10. Thorstensen, C.W.; Christiansen, A. Determination of bentazone, dichlorprop, and MCPA in different soils by sodium hydroxide extraction in combination with solid-phase preconcentration. J. Agric. Food Chem. 2001, 49, 4199. [Google Scholar] [CrossRef] [PubMed]
  11. Sutherland, D.J.; Stearman, G.K.; Wells, M.J.M. Development of an analytical scheme for simazine and 2,4-D in soil and water runoff from ornamental plant nursery plots. J. Agric. Food Chem. 2003, 51, 14–20. [Google Scholar] [CrossRef]
  12. Moret, S.; Sanchez, J.M.; Salvadó, V.; Hidalgo, M. The evaluation of different sorbents for the preconcentration of phenoxyacetic acid herbicides and their metabolites from soils. J. Chromatogr. A 2005, 1099, 55–63. [Google Scholar] [CrossRef] [PubMed]
  13. Luque-Garcia, J.L.; Luque de Castro, M.D. Coupling continuous subcritical water extraction, filtration, preconcentration, chromatographic separation and UV detection for the determination of chlorophenoxy acid herbicides in soils. J. Chromatogr. A 2002, 959, 25–35. [Google Scholar] [CrossRef] [PubMed]
  14. Jönsson, J.A.; Mathiasson, L. Liquid membrane extraction in analytical sample preparation: I. Principles. TrAC Trends Anal. Chem. 1999, 18, 318–325. [Google Scholar] [CrossRef]
  15. Lord, H.; Pawliszyn, J. Microextraction of drugs. J. Chromatogr. A 2000, 902, 17–63. [Google Scholar] [CrossRef]
  16. Hassan, J.; Shamsipur, M.; Es’haghi, A.; Fazili, S. Determination of chlorophenoxy acid herbicides in water samples by suspended liquid-phase microextraction-liquid chromatography. Chromatographia 2011, 73, 999–1003. [Google Scholar] [CrossRef]
  17. Tsai, W.C.; Huang, S.D. Dispersive liquid-liquid-liquid microextraction combined with liquid chromatography for the determination of chlorophenoxy acid herbidices in aqueous samples. J. Chromatogr. A 2009, 1216, 7846–7850. [Google Scholar] [CrossRef] [PubMed]
  18. Liu, L.; Xia, L.; Guo, C.; Wu, C.; Chen, G.; Li, G.; Sun, S.; You, J. A sensitive and efficient method for the determination of 8 chlorophenoxy acid herbicides in crops by dispersive liquid-liquid microextraction and HPLC with fluorescence detection and identification by MS. Anal. Methods 2016, 8, 3536–3544. [Google Scholar] [CrossRef]
  19. Wu, J.; Ee, K.H.; Lee, H.K. Automated dynamic liquid-liquid-liquid microextraction followed by high-performance liquid chromatography-ultraviolet detection for the determination of phenoxy acid herbicides in environmental waters. J. Chromatogr. A 2005, 1082, 121–127. [Google Scholar] [CrossRef]
  20. Chen, C.C.; Melwanki, M.B.; Huang, S.D. Liquid-liquid-liquid microextraction with automated movement of the acceptor and the donor phase for the extraction of phenoxyacetic acids prior to liquid chromatography detection. J. Chromatogr. A 2006, 1104, 33–39. [Google Scholar] [CrossRef]
  21. Esrafili, A.; Yamini, Y.; Ghambarian, M.; Moradi, M.; Seidi, S. A novel approach to automation of dynamic hollow fiber liquid-phase microextraction. J. Sep. Sci. 2011, 34, 957–964. [Google Scholar] [CrossRef]
  22. Ghamari, F.; Bahrami, A.; Yamini, Y.; Shahna, F.G.; Moghimbeigi, A. Development of holow-fiber liquid-phase microextraction method for the determination of urinary trans, trans-muconic acid as a biomarker of benzene exposure. Anal. Chem. Insights 2016, 11, 65–71. [Google Scholar] [CrossRef]
  23. Liu, K.; He, Y.; Xu, S.; Hu, L.; Luo, K.; Liu, X.; Liu, M.; Zhou, X.; Bai, L. Mechanism of the effect of pH and biochar on the phytotoxicity of the weak acid herbicides imazethapyr and 2,4-D in soil to rice (Oryza sativa) and estimation by chemical methods. Ecotoxicol. Environ. Saf. 2018, 161, 602–609. [Google Scholar] [CrossRef] [PubMed]
  24. Shen, Y.; Jönsson, J.A.; Mathiasson, L. On-line microporous membrane liquid-liquid extraction for sample pretreament combined with capillary gas chromatography applied to local anaesthesics in blood plasma. Anal. Chem. 1998, 70, 946–953. [Google Scholar] [CrossRef]
  25. Moral, A.; Caballo, C.; Sicilia, M.D.; Rubio, S. Highly efficient microextraction of chlorophenoxy acid herbicides in natural waters using a decanoic acid-based nanostructured solvent prior to their quantitation by liquid chromatography-mass spectromety. Anal. Chim. Acta 2012, 709, 59–65. [Google Scholar] [CrossRef] [PubMed]
  26. Guo, L.; Lee, H.K. Electro membrane extraction followed by low-density solvent based ultrasound-assisted emulsification microextraction combined with derivatization for determining chlorophenols and analysis by gas chromatography-mass spectrometry. J. Chromatogr. A 2012, 1243, 14–22. [Google Scholar] [CrossRef] [PubMed]
  27. Moret, S.; Hidalgo, M.; Sanchez, J.M. Development of an Ion-Pairing liquid chromatography method for the determination of phenoxyacetic herbicides and their main metabolites: Application to the analyisis of soil samples. Chromatographia 2006, 63, 109–115. [Google Scholar] [CrossRef]
  28. Lee, J.; Lee, H.K.; Rasmussen, K.E.; Pedersen-Bjergaad, S. Environmental and bioanalytical applications of hollow fiber membrane liquid-phase microextraction: A review. Anal. Chim. Acta 2008, 624, 253–268. [Google Scholar] [CrossRef] [PubMed]
  29. Dimitrienko, S.G.; Apyari, V.V.; Tolmacheva, V.V.; Gourbunova, M.V. Liquid-liquid extraction of organic compounds into a single drop of the extractant: Overview of reviews. J. Anal. Chem. 2021, 76, 907–919. [Google Scholar] [CrossRef]
  30. Gjelstad, A. Three-phase hollow fiber liquid-phase microextraction and parallel artificial liquid membrane extraction. TrAC Trends Anal. Chem. 2019, 113, 25–31. [Google Scholar] [CrossRef]
  31. Jönsson, J.A.; Mathiasson, L. Liquid membrane extraction in analytical sample preparation: II: Applications. TrAC Trends Anal. Chem. 1999, 18, 325–334. [Google Scholar] [CrossRef]
  32. Ghambarian, M.; Yamini, Y.; Esrafili, A. Developments in hollow fiber based liquid-phase microextraction: Principles and applications. Microchim. Acta 2012, 177, 271–294. [Google Scholar] [CrossRef]
  33. Madikizela, L.M.; Pakade, V.E.; Ncube, S.; Tutu, H.; Chimuka, L. Application of hollow fibre-liquid phase microextraction technique for isolation and pre-concentration of pharmaceuticals in water. Molecules 2020, 10, 311. [Google Scholar] [CrossRef] [PubMed]
  34. Jönsson, J.A.; Mathiasson, L. Membrane-based techniques for sample enrichment. J. Chromatogr. A 2000, 902, 205–225. [Google Scholar] [CrossRef] [PubMed]
  35. Sandahl, M.; Mathiasson, L.; Jönsson, J.A. Determination of thiophanate-methyl and its metabolites at trace level in spiked natural water using the supported liquid membrane extraction and the microporous membrane liquid-liquid extraction techniques combined on-line with high-performance liquid chromatography. J. Chromatogr. A 2000, 893, 123–131. [Google Scholar]
  36. Santigosa, E.; Pedersen-Bjergaard, S.; Gimenez-Gomez, P.; Muñoz, M.; Ramos-Payan, M. A rapid and versatile microfluidic method for the simultaneous extraction of polar and non-polar basic pharmaceuticals from human urine. Anal. Chim. Acta 2022, 1208, 338929. [Google Scholar] [CrossRef] [PubMed]
  37. Chimuka, L.; Mathiasson, L.; Jönsson, J.A. Role of octanol-water partition coefficients in extraction of ionisable organic compounds in a supported liquid membrane with a stagnant acceptor. Anal. Chim. Acta 2000, 416, 77–86. [Google Scholar] [CrossRef]
  38. Ho, T.S.; Vasskog, T.; Anderssen, T.; Jensen, E.; Rasmussen, K.E.; Pedersen-Bjergaard, E. 25,000-fold pre-concentration in a single step with liquid-phase microextraction. Anal. Chim. Acta 2007, 592, 1–8. [Google Scholar] [CrossRef]
  39. Di Luccio, M.; Smith, B.D.; Kida, T.; Borges, C.P.; Alves, T.L.M. Separation of fructose from a mixture of sugars using supported liquid membranes. J. Membr. Sci. 2000, 174, 217–224. [Google Scholar] [CrossRef]
  40. Hou, L.; Lee, H.K. Application of static and dynamic liquid-phase microextraction in the determinatino of polycyclic aromatic hydrocarbons. J. Chromatogr. A 2002, 976, 377–385. [Google Scholar] [CrossRef]
  41. Sanchez, J.M. Linear calibrations in chromatography: The incorrect use of ordinary least squares for determinations at low levels, and the need to redefine the limit of quantification with this regression model. J. Sep. Sci. 2020, 43, 2708–2717. [Google Scholar] [CrossRef]
  42. Sanchez, J.M. The inadequate use of the determination coefficient in analytical calibrations: How other parameters can assess the goodness-of-fit more adequately. J. Sep. Sci. 2021, 44, 431–444. [Google Scholar] [CrossRef]
  43. de Amarante, O.P.; Brito, N.M.; dos Santos, T.C.R.; Nunes, G.S.; Ribeiro, M.L. Determination of 2,4.dichlorophenoxyacetic acid and its major transformation product in soil samples by liquid chormatographic analysis. Talanta 2003, 60, 115–121. [Google Scholar] [CrossRef] [PubMed]
  44. Smith, A.E.; Lafond, G.P. Effects of long-term phenoxyalkanoic acid herbicide field applications on the rate of microbial degradation. In Enhanced Biodegradation of Pesticides in the Environment; Rakc, K.D., Coats, J.R., Eds.; ACS Symposium Series: Washington, DC, USA, 1990; Volume 426, pp. 14–22. [Google Scholar]
  45. US Food and Drug Administration. Bioanalytical Method Validation: Guidance for Industry; FDA: Silver Spring, MD, USA, 2018. Available online: https://www.fda.gov/regulatory-information/search-fda-guidance-documents/bioanalytical-method-validation-guidance-industry (accessed on 18 April 2023).
Figure 1. Schematic diagram of the cell and hollow-fiber modules used in the experiments: (a) cell used for the evaluation of the liquid-membrane system ((1) stirring motors; (2) membranes; (3) stripping compartment; (4) feed compartment); (b) long coiled hollow-fiber module.
Separations 10 00273 g001
Figure 2. Schematic principles of the (a) three-phase HF-LPME (rod-like configuration), (b) two-phase HF-LPME (rod-like configuration), and (c) three-phase HF-LPME (U-shaped configuration).
Separations 10 00273 g002
Figure 3. Chromatograms obtained in the analysis of an alkaline extract of a non-contaminated soil, spiked at 100 µg·L−1 with 2-MP and 2,4-D (MDL of the HPLC-UV method, without sample treatment, is 25 µg·L−1 [27]). Analyses made (a) without membrane treatment and (b) after HF-LPME clean-up and enrichment.
Separations 10 00273 g003
Figure 4. Schematic diagram of the on-line flow system used for the analysis of acidic herbicides from alkaline soil extracts: (1) HF-LPME module; (2) HPLC injection valve; (a) position of the injection valve during enrichment and clean-up of the sample; (b) position of the injection valve during the transport of the enriched sample to the chromatographic column.
Separations 10 00273 g004
Figure 5. Distribution profiles obtained for 2,4-D and MCPA in soils at different depths: (a) 0–10 cm; (b) 10–30 cm.
Separations 10 00273 g005
Table 1. Extraction efficiencies (%) obtained in the extraction of the phenoxyacetic acid herbicides (2,4-D and MCPA) and their metabolites using the flat-sheet membrane cell (Figure 1a). Experimental conditions: 200 mL of 0.1 M H2SO4 donor solution spiked at 1 mg·L−1 with each of the analytes (feed); 200 mL of 0.01 M NaOH (stripping); 2 h extraction time. The p-value column shows the statistical results obtained for the t-test when assessing the means obtained between DHE and DHE: Decane. Values in brackets indicate the standard deviation values obtained (n = 3).
Solvent
p-ValueDHEDHE:Decane (1:1)IsopropylbenzeneDecaneDecalineDodecane (with 4% Dodecanol)Dodecanol (n = 1)
2-MP0.01573 (8)53 (3)50 (2)013 (1)19 (1)13
2-CP0.01480 (6)64 (3)62 (4)48 (4)36 (1)43 (1)16
4-CP0.00476 (1)55 (6)56 (5)0025 (3)3
MCPA0.01572 (1)60 (5)58 (6)0044 (4)13
2,4-D<0.00167 (1)50 (3)49 (4)0035 (3)11
4-C-2-MP0.17186 (2)79 (7)77 (5)36 (4)28 (1)57 (6)6
2,4-DCP0.04278 (1)71 (4)70 (3)62 (6)56 (1)65 (1)0
Table 2. Concentrations detected for the target analytes in some soils (n = 3) evaluated in this study. Experimental conditions: 15 g soil, alkaline extraction with 30 mL of 0.01 M NaOH, on-line HF-LPME/HPLC-UV method (d: detected, >MDL; nd: not detected, <MDL). Soil code: letters correspond to the days elapsed since application of the herbicide (B: 1 day; D: 3 days; F: 6 days; J: 9 days; L; 14 days; N; 22 days; P: 30 days; T: 40 days); numbers refer to the surface layers evaluated (#1: surface layer; #2: intermediate layer; #3: deepest layer).
Soil
Code
Analyte Concentration (µg kg soil−1)
2-MP2-CP4-CPMCPA2,4-D4-C-2-MP2,4-DCP
B1dnd1.43.56.81.41.2
B2nd1.0nd1.22.9ndnd
D1nddnd2.43.7ndnd
D2nddnd2.37.2ndnd
F1nddd1.02.0ndnd
F2nd1.0dndndndnd
J11.61.1ndddndnd
J22.71.4ndndndndnd
J31.3dndndndndnd
L11.8dndddndnd
L2ddndndndndnd
L3ddndndndndnd
N11.4dndndndndnd
N21.3ndndndndndnd
P11.4ndndndndndnd
P21.1ndndndndndnd
T1ndndndnddndnd
T2nd1.8ndnd2.8nd1.3
Disclaimer/Publisher’s Note: The statements, opinions and data contained in all publications are solely those of the individual author(s) and contributor(s) and not of MDPI and/or the editor(s). MDPI and/or the editor(s) disclaim responsibility for any injury to people or property resulting from any ideas, methods, instructions or products referred to in the content.

