Article

UPLC-MS/MS Method for Simultaneous Estimation of Neratinib and Naringenin in Rat Plasma: Greenness Assessment and Application to Therapeutic Drug Monitoring

by
Ali Altharawi
1,*,
Safar M. Alqahtani
1,
Sagar Suman Panda
2,
Majed Alrobaian
3,
Alhumaidi B. Alabbas
1,
Waleed Hassan Almalki
4,
Manal A. Alossaimi
1,
Md. Abul Barkat
5,
Rehan Abdur Rub
6,
Shehla Nasar Mir Najib Ullah
7,
Mahfoozur Rahman
8 and
Sarwar Beg
6
1
Department of Pharmaceutical Chemistry, College of Pharmacy, Prince Sattam Bin Abdulaziz University, Al-Kharj 11942, Saudi Arabia
2
Department of Pharmaceutical Analysis and Quality Assurance, Roland Institute of Pharmaceutical Sciences, Berhampur 760010, India
3
Department of Pharmaceutics and Industrial Pharmacy, College of Pharmacy, Taif University, Taif 21944, Saudi Arabia
4
Department of Pharmacology and Toxicology, College of Pharmacy, Umm Al-Qura University, Makkah 24381, Saudi Arabia
5
Department of Pharmaceutics, College of Pharmacy, University of Hafr Al Batin, Hafar Al Batin 39524, Saudi Arabia
6
Department of Pharmaceutics, School of Pharmaceutical education and Research, Jamia-Hamdard, Hamdard University, New Delhi 110062, India
7
Department of Pharmacognosy, Faculty of Pharmacy, King Khalid University, Abha 62529, Saudi Arabia
8
Department of Pharmaceutical Sciences, Shalom Institute of Health & Allied Sciences, Sam Higginbottom University of Agriculture, Technology & Sciences, Allahabad 211007, India
*
Author to whom correspondence should be addressed.
Separations 2023, 10(3), 167; https://doi.org/10.3390/separations10030167
Submission received: 4 January 2023 / Revised: 15 February 2023 / Accepted: 20 February 2023 / Published: 1 March 2023

Abstract

:
Tyrosine kinase inhibitors have often been reported to treat early-stage hormone-receptor-positive breast cancers. In particular, neratinib has shown positive responses in stage I and II cases in women with HER2-positive breast cancers with trastuzumab. In order to augment the biopharmaceutical attributes of the drug, the work designed endeavors to explore the therapeutic benefits of neratinib in combination with naringenin, a phytoconstituent with reported uses in breast cancer. A UPLC-MS/MS method was developed for the simultaneous estimation of neratinib and naringenin in rat plasma, while imatinib was selected as the internal standard (IS). Acetonitrile was used as the liquid extractant. The reversed-phase separation was achieved on a C18 column (100 mm × 2.1 mm, 1.7 µm) with the isocratic flow of mobile phase-containing acetonitrile (0.1% formic acid) and 0.002 M ammonium acetate (50:50, % v/v) at flow rate 0.5 mL·min−1. The mass spectra were recorded by multiple reaction monitoring of the precursor-to-product ion transitions for neratinib (m/z 557.138→111.927), naringenin (m/z 273.115→152.954), and the IS (m/z 494.24→394.11). The method was validated for selectivity, trueness, precision, matrix effect, recovery, and stability over a concentration range of 10–1280 ng·mL−1 for both targets and was acceptable. The method was also assessed for greenness profile by an integrative qualitative and quantitative approach; the results corroborated the eco-friendly nature of the method. Therefore, the developed method has implications for its applicability in clinical sample analysis from pharmacokinetic studies in human studies to support the therapeutic drug monitoring (TDM) of combination drugs.

1. Introduction

Breast cancer is considered one of the leading causes of mortality in the female population and the second most commonly reported cancer globally [1]. Over recent years, there has been continuous drug approval for the treatment and management of breast cancer. As per the WHO statistics of 2020, around 2.5 million deaths are estimated between 2020 and 2040. The early diagnosis of breast cancer, with confirmation of its genetic basis and heterogeneity, helps in selecting the right chemotherapeutic drugs for breast cancer treatment. In the past few years, the United States Food Drug Administration (USFDA) has approved several tyrosine kinase inhibitors for breast cancer treatment, which are very effective in HER2-overexpressed/amplified breast cancers [2,3]. Tyrosine kinase inhibitors specifically block the abnormal signal transduction, which is necessary for the proliferation of the cancer cells, and also show anti-epithelial growth factor receptor (EGFR) activity.
Neratinib (NER), a tyrosine kinase inhibitor, was approved by the USFDA in July 2017 as an extended adjuvant therapy for adult patients prescribed with trastuzumab for early-stage breast cancers [4,5]. Moreover, it is available in the form of tablets for oral administration at a dose of 40 mg. In contrast, the oral pharmacokinetics of neratinib exhibit a nonlinear absorption profile along with a food effect [6]. To understand the pharmacokinetic and biodistribution profile of the drug, a fast, sensitive, and efficient analytical method is always very useful for preclinical and clinical sample analysis. Very few bioanalytical methods of neratinib alone have been reported in the literature for estimation in rat and human plasma using high-performance liquid chromatography (HPLC) with ultraviolet (UV) and diode/photodiode array detectors (DAD/PDA) [7] and ultra-performance liquid chromatography (UPLC) with mass spectrometer (MS/MS) detectors [8,9,10]. In contrast to these existing methods, the present work aimed to establish a rapid and sensitive bioanalytical method for the quantification of multiple compounds in human plasma samples. This new method also endeavors to support the therapeutic drug monitoring (TDM) program. LC-MS/MS methods have been quite frequently used in TDM owing to their high sensitivity and specificity compared to other analytical techniques, as they quantify drugs irrespective of their natural chromophores or fluorophores [11,12]. Upon the optimization of sample preparation and mass spectrometry conditions, column and internal standard selection, LC-MS/MS methods greatly help in avoiding interference due to the matrix effect and the presence of other analytes and metabolites [13,14].
For better pharmacotherapeutic action, chemotherapeutic drug combinations with phytopharmaceuticals, especially antioxidants, have been extensively explored in the past few decades [15,16]. In this regard, we found naringenin (NRN) to be one of the potential phytopharmaceutical agents for various cancers, including breast cancer [17,18]. NRN potentially exhibits a dose-dependent increase in caspase-3 and caspase-9 activity-mediated apoptosis in breast cancer cells [17]. Additionally, it reduces cell proliferation and inhibits the migration of breast cancer cells via inflammatory and apoptosis cell signaling pathways. For the quantification of NRN in preclinical and clinical samples, a suitable bioanalytical method is required to understand the pharmacokinetic and pharmacodynamic behaviors of the drug. A score of research studies have documented the analytical estimation of NRN in biological matrices employing HPLC [19,20,21], LC-MS/MS [22], and related techniques. However, the sensitivity or lower limit of quantification (LLOQ) reported in the HPLC methods was in the range of 0.1–15 µg·mL−1 [19,20,21], while the LC-MS/MS method by Ma et al. (2006) reported double peaks for NRN in rat plasma despite a good LLOQ of 5 ng·mL−1 [22]. On the contrary, the current method showed a single peak for NRN with high resolution, although LLOQ was found to be 10 ng·mL−1, which is still good for the routine analysis of the drugs in preclinical and clinical samples.
Green analytical chemistry (GAC) is a recent approach growing in popularity amongst analysts. However, any analytical procedure’s green or eco-friendly nature dramatically affects environmental sustainability and the overall economy of the method development. With many screening and identification processes, chemists have recommended solvents and reagents that promise to fulfill the above intent. With scientists presenting newer approaches now and then, it has been a critical task for the analyst to choose between the various greenness assessment tools available. The National Environmental Methods Index (NEMI), Green Analytical Procedure Index (GAPI), and eco-scale (etcetera) are some of the most widely utilized tools for assessing a method’s greenness. Several scientists have reported the benefits and justifications of using such approaches for examining the eco-friendly nature of different analytical procedures [23,24]. A detailed discussion of their goals and rationale for assessment can be found elsewhere. In the current study, two assessment approaches, namely NEMI and AES, were adopted to qualitatively and semi-quantitatively determine the method greenness score.
In analytical science, method development for simultaneous estimation of two or more compounds provides cost and time economy in the analysis and colossal resource savings. However, method development for the simultaneous estimation of compounds is quite tedious, as many factors tend to influence the retention capacity of the drugs due to variations in their physicochemical characteristics. Therefore, in the present work, the researchers focused on developing a UPLC-MS/MS method to estimate NER and NRN in rat plasma simultaneously. Furthermore, the developed analytical method was validated according to current regulatory guidelines and employed to assess the stability of both analytes [25]. Additionally, the bioanalytical method’s greenness was assessed considering some of the latest approaches discussed by various analysts [23,24].

2. Materials and Methods

2.1. Chemicals and Reagents

NER was purchased from Weihua Pharma (Hangzhou, China), and NRN (Purity > 99%) was purchased from TCI Chemicals (India) Pvt. Ltd. (Chennai, India), while the internal standard (IS), imatinib (Purity > 98%), was generously provided by Dr. Reddy’s Laboratories Ltd. (Hyderabad, India). The LC-MS grade acetonitrile (ACN) and distilled water were purchased from J.T. Baker Chemicals (Mumbai, India), and ammonium acetate, ethyl acetate, formic acid, and ammonium formate were obtained from Fluka Analytical (Seelze, Germany). The other chemicals and reagents obtained were of analytical reagent grade.

2.2. UPLC-MS/MS Instrument and Conditions

The instrumental analysis was performed on the ACQUITY® UPLC-MS/MS system (Waters Corp., Milford, MA, USA) fitted with a binary pump system, autosampler unit, and column compartment. A ZsprayTM Xevo TQD (Waters Corp., Milford, MA, USA) mass spectrometer working with positive mode electrospray ionization (ESI) detected and quantified the analytes of NER and NRN. The detailed instrumental setting preferences for different test parameters are displayed in the Supplementary Information, Table S1.

2.3. Animal Ethical Approval

The animal study protocol was approved by the Institutional Animal Ethic Committee (IAEC) of Roland Institute of Pharmaceutical Sciences (RIPS) (Berhampur, Odisha 760010, India), with the protocol number 146/Chairman IAEC, RIPS, Berhampur (Approval Date: 13 November 2021). The animal care and maintenance were carried out as per the guidelines of the Committee for the Purpose of Control and Supervision of Experiments on Animals (CPCSEA). Healthy male Wistar rats (weighing between 180 and 220 g) were housed in polypropylene cages with free access to a standard diet and water ad libitum. Moreover, the animals were exposed to regular day and night cycles to maintain their circadian rhythms.

2.4. Preparation of Standards and Sample

Separate stock solutions (1 mg·mL−1) of NER, NRN, and IS were prepared using ACN as a diluent. Precisely measured, 0.05 mL and 0.1 mL of analytes and IS were pipetted from the stocks and spiked into rat plasma samples (0.5 mL). After liquid-liquid extraction (LLE), the final dilution of eight concentrations of 10, 20, 40, 80, 160, 320, 640, and 1280 ng·mL−1 of NER and NRN and 10 ng·mL−1 of IS were obtained. Then, three specified concentrations viz. 100, 500, and 1000 ng·mL−1 were defined as QC solutions for the analytes, while 10 ng·mL−1 was taken as the IS for the validation results. The solutions were stored at −20 °C until the final analysis.

2.5. Bioanalytical Extraction from the Rat Plasma

Blood was collected from the retro-orbital plexus of anesthetized Wistar rats. The heparinized blood produced plasma when centrifuged at 10,000 rpm for 10 min. The recovered plasma was kept at −20 °C after the plasma harvesting operation. Aliquots of 0.05 mL of the analytes and 0.1 mL of 200 ng·mL−1 IS were accurately measured and spiked in Eppendorf tubes, which were well mixed for 5 min. The extraction medium, ACN (1 mL), was added to all samples, followed by 2 min of vortex mixing and 5 min centrifugation at 3000 rpm (4 ± 2 °C). Precisely measured 0.5 mL of the organic fraction was pipetted and dried. The final dilution was prepared to 1 mL using mobile the phase, and the syringe was filtered before injection into the instrument. The prepared samples were always stored at −20 °C until analysis.

2.6. Validation Protocol

Multiple bioanalytical method validation guidelines, such as the USFDA, China Food and Drug Administration (CFDA), etc., were referred to and employed to establish the validity of the current UPLC-MS/MS method.

2.6.1. Selectivity

Selectivity plays a critical role in establishing the uninterefered simultaneous quantification of analytes in a biological matrix, such as plasma. The absence of interference at analyte retention was used to establish method selectivity by comparing the chromatograms of the blank plasma from six animals with spiked samples.

2.6.2. Linearity and Sensitivity

Over the course of three days, eight-point analyte linearity curves were created utilizing the spiked plasma samples with concentrations ranging from 10 to 1280 ng·mL−1. The linearity plots were created using the drug-to-IS peak area ratio (y-axis) versus the spiked NER and NRN concentrations (x-axis). Further, the lower limit of quantification (LLOQ) was determined using six replicate samples that qualify for a minimum level of trueness and precision. For establishing trueness and precision at LLOQ, a maximum allowable deviation of 20% was permitted.

2.6.3. Trueness and Precision

We conducted hexaplicate analysis at LLOQ (10 ng·mL−1) and low, mid, and high QC samples with 100, 500, and 1000 ng·mL−1 of NER and NRN, respectively, over three days to examine the trueness and precision of the method. The authors used percent relative standard deviation (% RSD) to define the method’s trueness and precision, in addition to the amount of analyte recovered. The maximum variance allowed was 15% of the specified nominal level.

2.6.4. Carryover and Dilution Integrity

A blank sample was injected after the immediate analysis of the highest calibration standard to test carry-over. The absence of a significant carry-over can be confirmed by obtaining a peak area not more (<20%) than that of the LLOQ.
Subsequently, the dilution integrity was tested by spiking the blank rat plasma with analytes and diluting it ten times in blank plasma within the studied range, with a maximum allowed deviation of ±15% for trueness and precision.

2.6.5. Matrix Effect and Extraction

The extracted peak regions of NER, NRN, and IS were directly compared to the spiked plasmatic blanks, revealing the extraction recovery at three QC levels. Additionally, a comparison of the peak areas of the analytes and IS in the plasma of rats to that of the equi-concentration standard solutions leads to inferring the extent of the influence of the matrix.

2.6.6. Stability Study

NRB and NRN were studied for their stability in bench top and short-term (room temperature) for 6 h and 24 h, respectively. At a temperature of −20 °C, long-term (14 days) and freeze–thaw (3 cycles) stability was assessed. The post-preparative stability study of the analytes was performed at 8 °C. All of the above stability studies were performed using analytes at their LQC and HQC concentration levels (n = 6).

2.7. Integrative Application of Multiple Green Metrics Tools

The integrated approach of combining the National Environmental Methods Index (NEMI) procedure and the Analytical Eco-scale (AES) method was followed to ensure the greenness of the developed bioanalytical method [24,25]. NEMI deals with the identification of chemicals and reagents that are harmful to the environment and assigns green shades to eco-friendly ones in a typical pictogram highlighting each of them. Such reagents and chemicals are broadly classified as PBT (persistent, bioaccumulative, and toxic), H (hazardous), C (corrosive), and W (waste generation capability). Contrary to NEMI, a purely semi-quantitative approach of AES allocates penalty points (PPs) to an analytical method according to a corresponding amount of reagent depleted and subsequent possible hazards per single analysis. Additionally, it considers overall power demand, waste produced, and any operational risks for assigning PPs. Final greenness scores of 75 and above identify a method as being eco-friendly [26,27,28].

3. Results

3.1. Preparation of the Plasma Samples

A single-step extraction procedure was used to extract NER, NRN, and the IS from the rat plasma. The procedure employed acetonitrile as the most suitable extraction medium with higher recoveries. The addition of acetonitrile helped in protein precipitation and the partition of the analytes and IS during the liquid–liquid extraction process. The extraction recovery was observed to be quite satisfactory for the investigated analytes and the IS. There were no other peaks observed for the plasma components except for the analytes and IS, which ratified a lack of interference with the analytes.

3.2. Mobile Phase Selection and Optimization: A Greenness Perspective

The mobile phase of selection for a UPLC-MS/MS relies solely on the volatility properties and compatibility with the MS/MS system. Only a few restricted options befit these criteria and are used accordingly for vivid applications. However, if a green UPLC-MS/MS method is intended for development, one must adhere to the principles of green analytical chemistry (GAC) and prioritize the use of ethanol as an organic proportion. However, the greenest solvent, ethanol, is less preferred in reversed-phase chromatography because of higher viscosity and UV cutoff than methanol or acetonitrile. With lower viscosity and UV cutoff values than methanol, acetonitrile is the most preferred organic phase for UPLC-MS/MS. Additionally, it has better volatility properties than methanol, which support its use as a mobile phase component. Adding 0.1% formic acid into the mobile phase supports investigations under the positive ionization mode. Ammonium acetate in LC-MS grade water with a pH adjusted to 3.5 using acetic acid served as the aqueous phase. Finally, the method’s greenness was ensured by executing the NEMI and AES work strategies, which are described below in detail.

3.3. Investigation of Method Greenness

For a preliminary qualitative method greenness evaluation, the NEMI pictogram procedure was executed. In this procedure, the persistent, bioaccumulative, toxic, hazardous, and corrosive chemicals and reagents and their probable waste production capabilities were assumed to be alarming if they crossed 50 g. In the present evaluation, three quadrants indicated greenness, except for the quadrant denoted for hazard (H). Figure 1 portrays the NEMI multi-quadrant plot with notions for associated hazards. This helped us to be cautious for minimal possible hazards and to proceed with the penalty scoring system of AES. An overall score of 90 (Table 1) categorized the present method as green. This integrated approach ensured method greenness. From the above investigations, we inferred the exceptionally green nature of the method and its suitability for routine use, as it supports the current thinking to establish an AES framework.

3.4. Optimized LC and MS Conditions

ACQUITY UPLC® ethylene bridged hybrid (BEH) columns (Waters Corp., Milford, MA, USA) made of 1.7 μm particles of C8 and C18 were tested. Upon testing with the isocratic mode of separation, desired chromatographic results were obtained within 4 min. The flow of the mobile phase was 0.5 mL·min−1 (Supporting Information, Table S1). In-built Intellistart functionality automated the MS scanning and ESI optimization for NER, NRN, and the IS. This function selected the ion transitions (Figure 2A–C) for NER (m/z of 557.138→111.927), NRN (m/z of 273.115→152.954), and the IS (m/z 494.5→394) out of the three available peaks. The Intellistart supported automated optimized MS/MS conditions for the valid quantification of the analytes, which are listed in the Supporting Information, Table S2. The typical MS/MS fragmentation products for NER, NRN, and the IS have also been provided in Figure 2.

3.5. Validation of Results

The results for the method validation parameters and their acceptance criteria are described in the below sections.

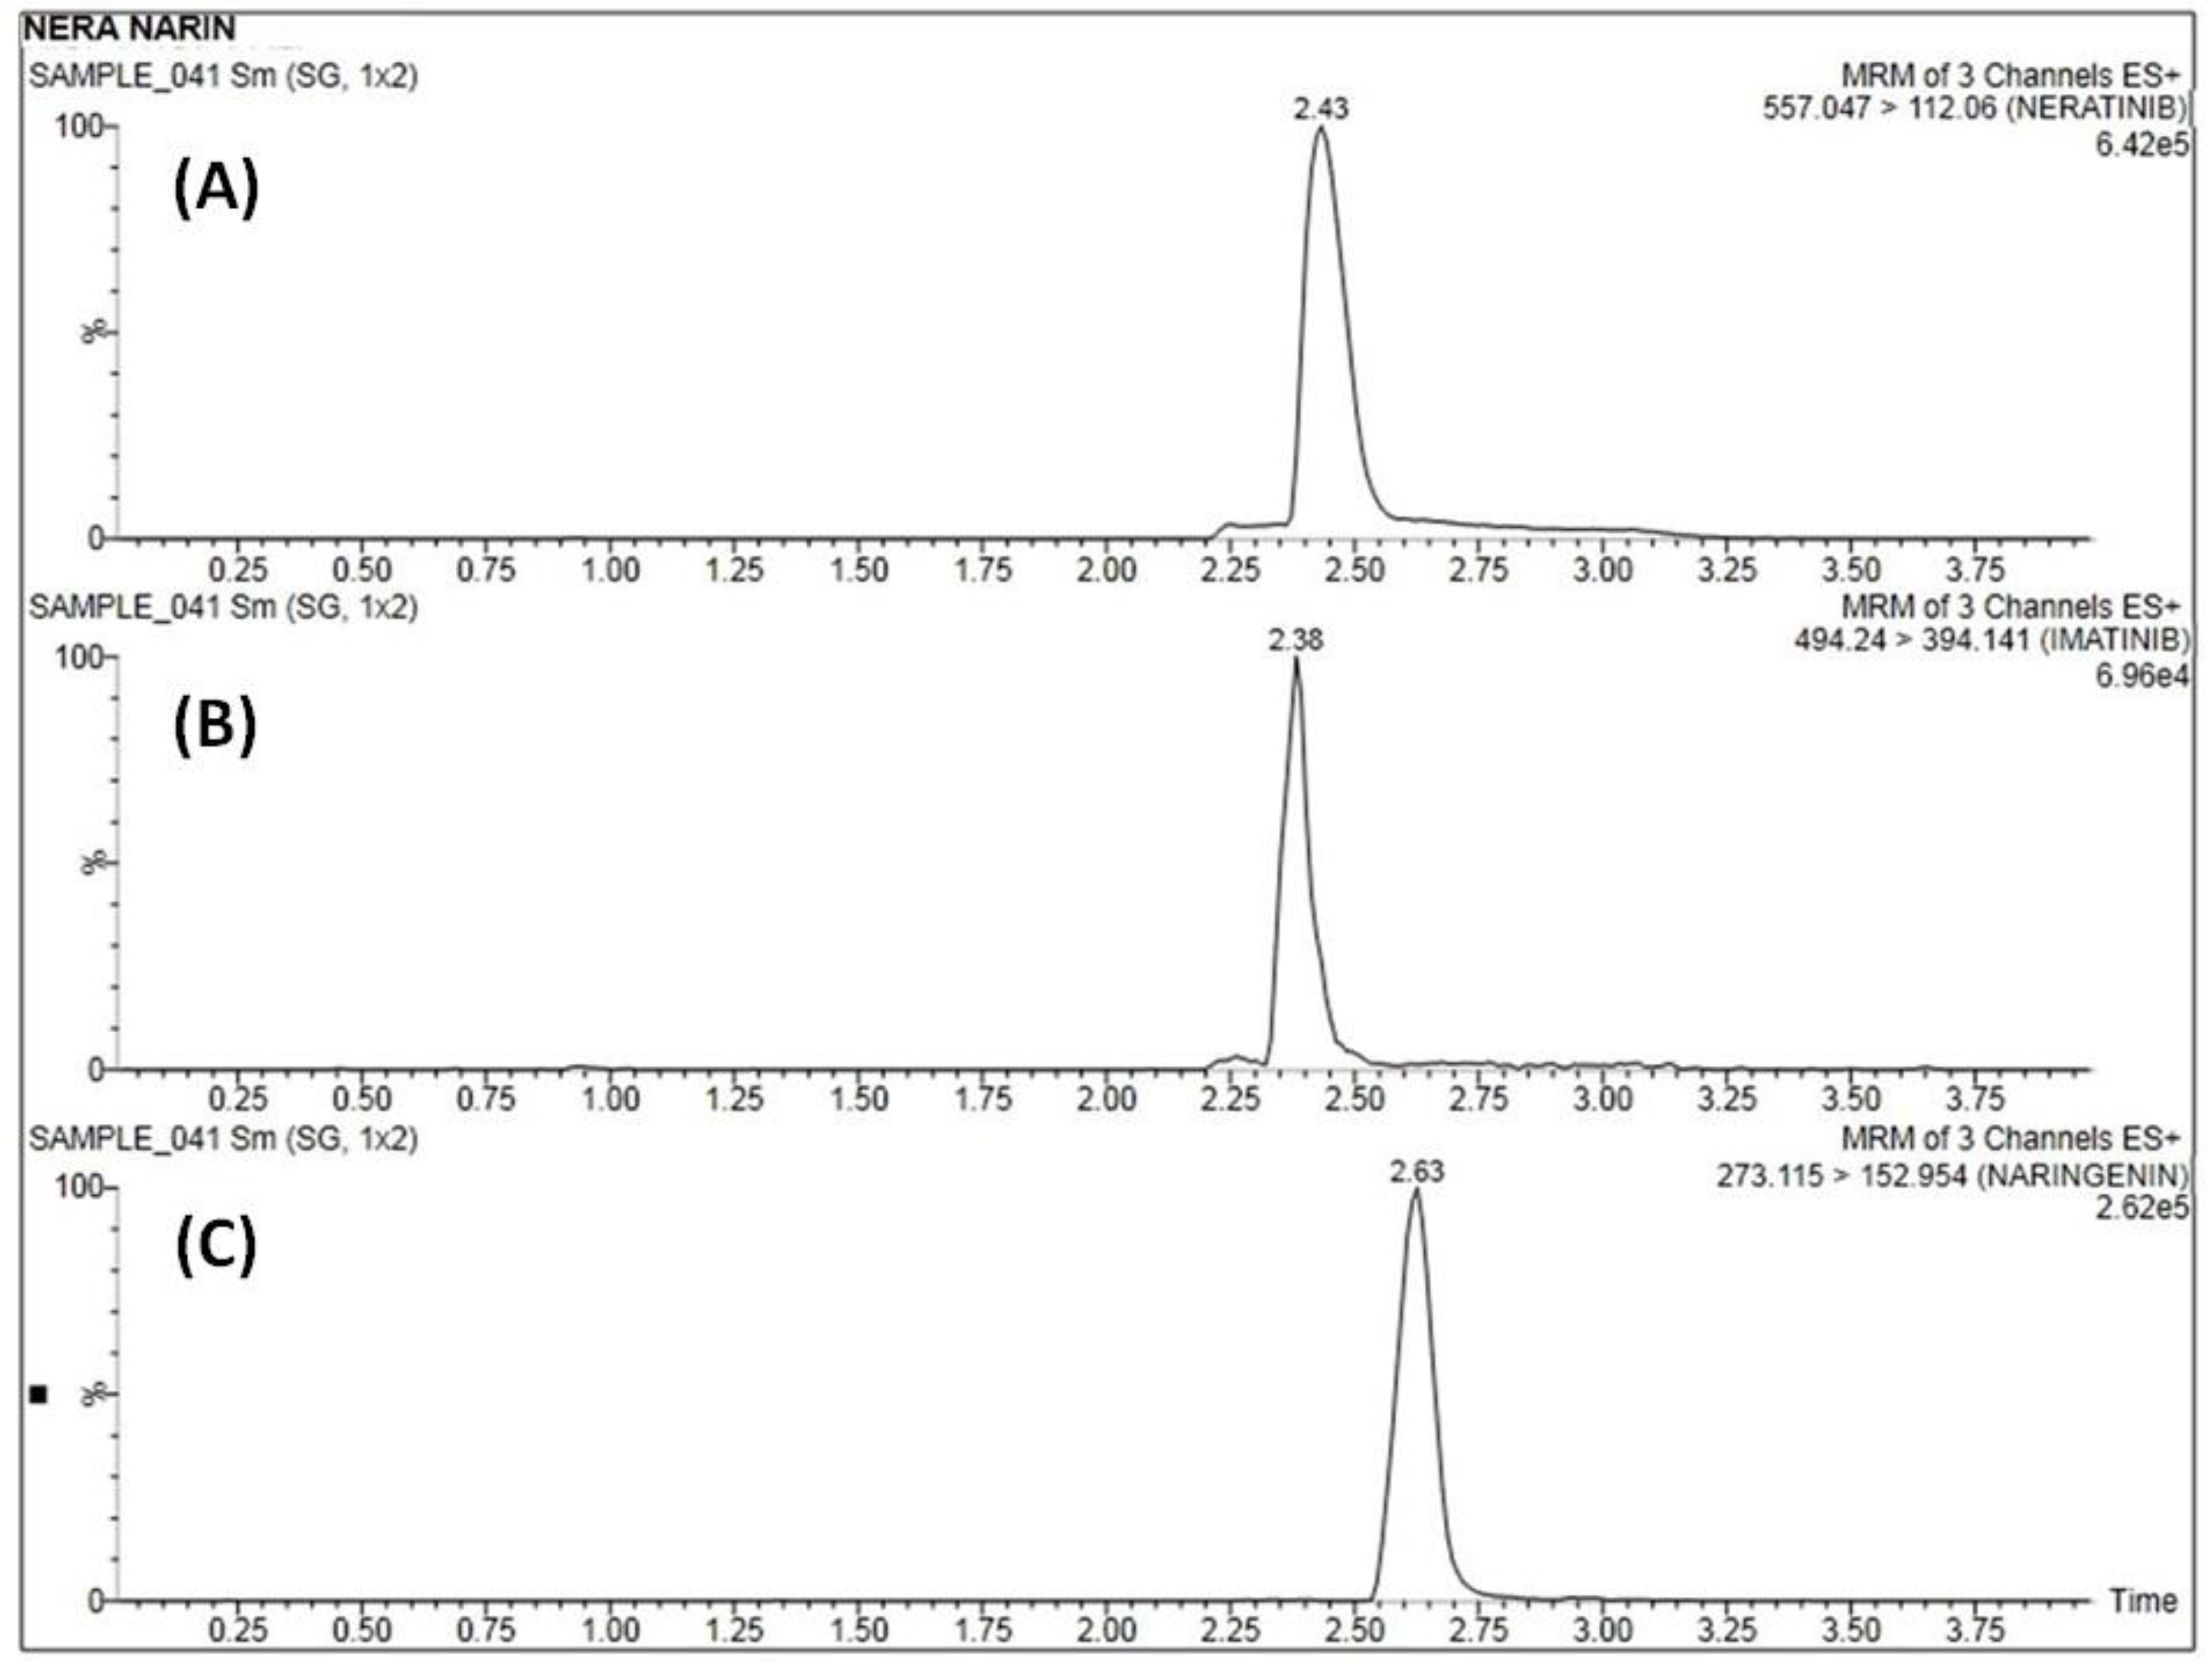
3.5.1. Method Selectivity

The analyzed MRM chromatograms recorded for the blank plasma of six separate animals (Supporting Information, Figure S1A–C) showed an absence of any interference at the identified retention times for NER and NRN (Supporting Information, Figure S2A–C). This ensured adequate method selectivity to support the quantification of the analytes.

3.5.2. Method Linearity and Quantitation Limits

A concentration range over 10–1280 ng·mL−1 of both NER (y = 0.082x + 0.071) and NRN (y = 0.060x + 0.058) was found to be linear (R2 = 0.998). Figure 3 depicts the linear calibration plot for NER and NRN between concentrations (ng·mL−1) versus the analyte/IS peak area ratio. At the lowest concentration of 10 ng·mL−1, both the analytes (Table 2)were adequately quantified (Figure 4A–C)and established as the method’s LLOQ values.

3.5.3. Trueness and Precision

The results obtained for trueness (% recovery) and precision (% RSD) at LLOQ, LQC, MQC, and HQC levels are listed in Table 2. In addition, the intraday and interday recoveries for NER were found to be between −8.7 and −10.5% (% RE), while for NRN, the values were found to be between −8.76 and −10.6% (% RE), respectively. Moreover, the method’s preciseness was found to be between 1.1 and 2.8% (% RSD) for both the analytes, indicating its acceptability for bioanalytical applications.

3.5.4. Carryover and Dilution Integrity

Carryover was not observed by analyzing the blank plasma samples instantly after analyzing the highest calibration concentration of the analytes. In the dilution integrity studies for NER and NRN, the actual samples’ concentrations were above the upper limit of the calibration range. The mean diluted concentrations were acceptable within ±6.8 and 7.5% of the nominal concentration for NER and NRN, respectively.

3.5.5. Extraction Recovery and Matrix Effect

Analyte recovery was found to range between 85.81 and 88.21% for NER and 87.09 to 89.44% for NRN, respectively (supporting information, Table S3), at different studied concentrations. The matrix effect was found to be 10.12–14.13% and 9.61–13.07% for NER and NRN, respectively. In addition, the %RSD values of NER, NRN, and IS were found to be within 2%. These results implied the good extraction of NER and NRN in the plasma of rats and negligible influence of the studied matrix.

3.5.6. Stability of the Analytes

The stability test conditions such as bench-top, short-term, long-term, freeze–thaw, and post-processing were tested for NER, NRN, and IS in the rat plasma. The data in Table 3 indicate the stable nature of the analytes in the plasma of rats under the investigated stress conditions, where good extraction recovery and a lack of interference of any plasma components with analytes were observed.

4. Discussion

NER and NRN are a promising combination of modern and natural constituents for the effective management of breast cancer. The former controls breast cancer by its irreversible binding to epidermal growth factor receptors. In contrast, the latter is a derivative aglycone of hydrogenated flavanone origin that inhibits the migration of cancer cells to other body regions, alongside other health benefits that control disease progression. However, to efficiently monitor the therapeutic output of such a combination of drugs, sound bioanalytical LC-MS/MS methods are necessary. The qualitative identification and accurate quantitative determination of analytes in complex biological samples are key benefits of using such techniques. The current UPLC-MS/MS method was newly developed and validated per the regulatory guidelines governing the bioanalysis of drugs in biological fluids. The uncomplicated recovery of analytes from the rat plasma signifies the aptness of the current hyphenated method for the proposed purpose. Combined greenness assessment using contemporary techniques and a high greenness score (score = 90) for the optimized chromatographic condition aptly separated and quantified the analytes and promised environmental sustainability for future use. The method’s validation results were satisfactory, with a sensitive linear range of analyte concentrations that engulfed the trueness, precision, selectivity, and good LLOQ values. The final results of all such studies were beneficial to the guidance and reference values that the USFDA and other regulatory bodies have established. No carryover was observed, and the dilution integrity was acceptable. The recovery of analyte greater than 85%, supported with the least matrix effect, vouches for the method’s suitability. Finally, the results of the stability study under different stress conditions suggest the acceptable nature of the analytes in the studied matrix.

5. Conclusions

A UPLC-MS/MS method was developed to simultaneously quantify NER and NRN from rat plasma. During the pre-development and optimization phase, the investigations constituted the use of greenness assessment tools such as NEMI and AES, which construed the greenness of the present method. In addition, sensitive LLOQ values were found to befit the method linearity. Further, the validation results from trueness and precision, selectivity, carryover, dilution integrity, recovery and matrix effect, and stability studies matched method intent and were satisfactory. Hence, after assessing the overall study results, the present method conforms to the requirement of simultaneous bioanalytical quantification of the cited analytes for therapeutic drug monitoring in plasmatic samples. The excellent outcome of this work can potentially be linked to evaluating the pharmacokinetic parameters of the drugs in animals and humans.

Supplementary Materials

The following supporting information can be downloaded at: https://www.mdpi.com/article/10.3390/separations10030167/s1, Table S1: Current UPLC-MS/MS method parameter details, Table S2: Details of MS/MS parameters for studied analytes, Table S3: Data showing extraction recovery and matrix effect; Figure S1: Representative MRM chromatograms of blank plasma samples of (A) NER, (B) I.S. and (C) NRN at 80 ng·mL−1 concentration; Figure S2: Representative MRM chromatograms of plasma samples spiked with (A) NER, (B) IS, and (C) NRN at 80 ng·mL−1 concentration

Author Contributions

A.A. and S.M.A.—study design and funding support; S.S.P.—method validation, data analysis, manuscript writing; M.A., A.B.A. and W.H.A.—data analysis, funding support; M.A.B., R.A.R. and S.N.M.N.U.—experimental support; M.A.A. and M.R.—manuscript writing; S.B.—software support, data analysis, manuscript writing, and language corrections. All authors have read and agreed to the published version of the manuscript.

Funding

The authors extend their appreciation to the Deanship for Research & Innovation and the Ministry of Education in Saudi Arabia for funding this research work through project number: IFP22UQU4310387DSR180.

Institutional Review Board Statement

The animal study protocol was approved by the Institutional Animal Ethic Committee (IAEC) of Roland Institute of Pharmaceutical Sciences (RIPS) (Berhampur, Odisha 760010, India), with the protocol number 146/Chairman IAEC, RIPS, Berhampur (Approval Date: 13 November 2021).

Data Availability Statement

The data are contained within the article or Supplementary Material. The data presented in this study are available in its tables, figures, and Supplementary Materials.

Conflicts of Interest

The authors declare no conflict of interest.

References

  1. Łukasiewicz, S.; Czeczelewski, M.; Forma, A.; Baj, J.; Sitarz, R.; StanisÅ‚awek, A. Breast Cancer-Epidemiology, Risk Factors, Classification, Prognostic Markers, and Current Treatment Strategies-An Updated Review. Cancers 2021, 13, 4287. [Google Scholar] [CrossRef] [PubMed]
  2. Iancu, G.; Serban, D.; Badiu, C.D.; Tanasescu, C.; Tudosie, M.S.; Tudor, C.; Costea, D.O.; Zgura, A.; Iancu, R.; Vasile, D. Tyrosine kinase inhibitors in breast cancer (Review). Exp. Ther. Med. 2022, 23, 114. [Google Scholar] [CrossRef]
  3. Schlam, I.; Swain, S.M. HER2-positive breast cancer and tyrosine kinase inhibitors: The time is now. NPJ Breast Cancer 2021, 7, 56. [Google Scholar] [CrossRef] [PubMed]
  4. Burstein, H.J.; Sun, Y.; Dirix, L.Y.; Jiang, Z.; Paridaens, R.; Tan, A.R.; Awada, A.; Ranade, A.; Jiao, S.; Schwartz, G.; et al. Neratinib, an Irreversible ErbB Receptor Tyrosine Kinase Inhibitor, in Patients With Advanced ErbB2-Positive Breast Cancer. J. Clin. Oncol. 2010, 28, 1301–1307. [Google Scholar] [CrossRef]
  5. Dhillon, S. Neratinib in Early-Stage Breast Cancer: A Profile of Its Use in the EU. Clin. Drug Investig. 2019, 39, 221–229. [Google Scholar] [CrossRef] [Green Version]
  6. Kourie, H.R.; Chaix, M.; Gombos, A.; Aftimos, P.; Awada, A. Pharmacodynamics, pharmacokinetics and clinical efficacy of neratinib in HER2-positive breast cancer and breast cancer with HER2 mutations. Expert Opin. Drug Metabol. Toxicol. 2016, 12, 947–957. [Google Scholar] [CrossRef]
  7. Kanth, M.L.; Kamal, B.R. Development and validation of rp-hplc for estimation of neratinib in bulk and tablet dosage form. Int. J. Pharm. Sci. Drug Res. 2019, 11, 610–614. [Google Scholar] [CrossRef] [Green Version]
  8. Wani, T.A.; Zargar, S.; Ahmad, A. Ultra Performance Liquid Chromatography Tandem Mass Spectrometric Method Development and Validation for Determination of Neratinib in Human Plasma. S. Afr. J. Chem. 2015, 68, 93–98. [Google Scholar] [CrossRef] [Green Version]
  9. Alrobaian, M.; Panda, S.S.; Afzal, O.; Kazmi, I.; Alossaimi, M.A.; Al-Abbasi, F.A.; Almalki, W.H.; Soni, K.; Alam, O.; Alam, M.N.; et al. Development of a Validated Bioanalytical UPLC-MS/MS Method for Quantification of Neratinib: A Recent Application to Pharmacokinetic Studies in Rat Plasma. J. Chromatogr. Sci. 2021, 60, 551–558. [Google Scholar] [CrossRef]
  10. Kiesel, B.F.; Parise, R.A.; Wong, A.; Keyvanjah, K.; Jacobs, S.; Beumer, J.H. LC-MS/MS assay for the quantitation of the tyrosine kinase inhibitor neratinib in human plasma. J. Pharm. Biome. Anal. 2017, 134, 130–136. [Google Scholar] [CrossRef] [Green Version]
  11. Adaway, J.E.; Keevil, B.G. Therapeutic drug monitoring and LC-MS/MS. J. Chromatogr. B 2011, 883, 33–49. [Google Scholar] [CrossRef]
  12. Saint-Marcoux, F.; Sauvage, F.o.-L.; Marquet, P. Current role of LC-MS in therapeutic drug monitoring. Anal. Bioanal. Chem. 2007, 388, 1327–1349. [Google Scholar] [CrossRef] [PubMed]
  13. Shipkova, M.; Svinarov, D. LC-MS/MS as a tool for TDM services: Where are we? Clin. Biochem. 2016, 49, 1009–1023. [Google Scholar] [CrossRef]
  14. Avataneo, V.; D’Avolio, A.; Cusato, J.; Cant, M.; De Nicolo, A. LC-MS application for therapeutic drug monitoring in alternative matrices. J. Pharm. Biomed. Anal. 2016, 166, 40–51. [Google Scholar] [CrossRef]
  15. Singh, K.; Bhori, M.; Kasu, Y.A.; Bhat, G.; Marar, T. Antioxidants as precision weapons in war against cancer chemotherapy induced toxicity: Exploring the armoury of obscurity. Saudi Pharm. J. 2018, 26, 177–190. [Google Scholar] [CrossRef] [PubMed]
  16. Ilghami, R.; Barzegari, A.; Mashayekhi, M.R.; Letourneur, D.; Crepin, M.; Pavon-Djavid, G. The conundrum of dietary antioxidants in cancer chemotherapy. Nut. Rev. 2020, 78, 65–76. [Google Scholar] [CrossRef]
  17. Wang, R.; Wang, J.; Dong, T.; Shen, J.; Gao, X.; Zhou, J. Naringenin has a chemoprotective effect in MDA-MB231 breast cancer cells via inhibition of caspase-3 and 9 activities. Oncol. Lett. 2019, 17, 1217–1222. [Google Scholar] [PubMed] [Green Version]
  18. Camargo, C.A.; Gomes-Marcondes, M.C.C.; Wutzki, N.C.; Aoyama, H. Naringin Inhibits Tumor Growth and Reduces Interleukin-6 and Tumor Necrosis Factor α Levels in Rats with Walker 256 Carcinosarcoma. Anticancer Res. 2012, 32, 129. [Google Scholar] [PubMed]
  19. Jha, D.K.; Shah, D.S.; Talele, S.R.; Amin, P.D. Correlation of two validated methods for the quantification of naringenin in its solid dispersion: HPLC and UV spectrophotometric methods. SN Appl. Sci. 2020, 2, 698. [Google Scholar] [CrossRef] [Green Version]
  20. Musmade, K.P.; Trilok, M.; Dengale, S.J.; Bhat, K.; Reddy, M.S.; Musmade, P.B.; Udupa, N. Development and validation of liquid chromatographic method for estimation of naringin in nanoformulation. J. Pharm. 2014, 2014, 864901. [Google Scholar] [CrossRef] [Green Version]
  21. Bhandari, R.; Kuhad, A.; Paliwal, J.K.; Kuhad, A. Development of a new, sensitive, and robust analytical and bio-analytical RP-HPLC method for in-vitro and in-vivo quantification of naringenin in polymeric nanocarriers. J. Anal. Sci. Technol. 2019, 10, 11. [Google Scholar] [CrossRef] [Green Version]
  22. Ma, Y.; Li, P.; Chen, D.; Fang, T.; Li, H.; Su, W. LC/MS/MS quantitation assay for pharmacokinetics of naringenin and double peaks phenomenon in rats plasma. Int. J. Pharm. 2006, 307, 292–299. [Google Scholar] [CrossRef] [PubMed]
  23. Magdy, M.A.; Farid, N.F.; Anwar, B.H.; Abdelhamid, N.S. Four Greenness evaluations of two chromatographic methods: Application to fluphenazine HCl and nortriptyline HCl pharmaceutical combination in presence of their potential impurities perphenazine and dibenzosuberone. Chromatographia 2002, 85, 1075–1086. [Google Scholar] [CrossRef]
  24. Gamal, M.; Naguib, I.A.; Panda, D.S.; Abdallah, F.F. Comparative study of four greenness assessment tools for selection of greenest analytical method for assay of hyoscine N-butyl bromide. Anal. Methods 2021, 13, 369–380. [Google Scholar] [CrossRef] [PubMed]
  25. United States Food and Drug Administration (USFDA) Bioanalytical Method Validation—Guidance for Industry; USFDA: Silver Spring, MD, USA, 2018.
  26. Chanduluru, H.K.; Sugumaran, A. Assessment of greenness for the determination of voriconazole in reported analytical methods. RSC Adv. 2022, 12, 6683–6703. [Google Scholar] [CrossRef]
  27. Mohamed, D.; Fouad, M.M. Application of NEMI, Analytical Eco-Scale and GAPI tools for greenness assessment of three developed chromatographic methods for quantification of sulfadiazine and trimethoprim in bovine meat and chicken muscles: Comparison to greenness profile of reported HPLC methods. Microchem. J. 2020, 157, 104873. [Google Scholar]
  28. Alabbas, A.B.; Alqahtani, S.M.; Panda, S.S.; Alrobaian, M.; Altharawi, A.; Almalki, W.H.; Barkat, M.A.; Rub, R.A.; Rahman, M.; Mir Najib Ullah, S.N.; et al. Development of a validated UPLC-MS/MS method for simultaneous estimation of neratinib and curcumin in human plasma: Application to greenness assessment and routine quantification. J. Chromatogr. Sci. 2022, bmac067. [Google Scholar] [CrossRef]
Figure 1. NEMI-oriented method greenness assessment pictogram.
Separations 10 00167 g001
Figure 2. Representative parent to daughter ion MRM transitions and the fragmentation products formed for (A) NER, (B) IS, and (C) NRN at LLOQ.
Separations 10 00167 g002
Figure 3. Calibration curve of NER and NRN.
Separations 10 00167 g003
Figure 4. Representative MRM chromatogram of blank plasma samples of (A) NER, (B) IS, and (C) NRN at LLOQ.
Separations 10 00167 g004
Table 1. Overall penalty points and greenness score of the current bioanalytical method.
ReagentsAmountAmount
PP (a)
HazardHazard
PP
Total PP (b)
(1) ACN<10 mL1Yes44
(2) Acetate buffer<10 mL1None00
InstrumentEnergy
(1) UPLC-MS/MS1.5 kWh per sample2
(2) Ultrasonicator bath<0.1 kWh per sample0
(3) Filtration pump<0.1 kWh per sample0
(4) Centrifuge Unit≤1.5 kWh per sample1
(5) Occupational hazardsProcess Hermetization0
(6) Waste<10 mL3
Overall PPs:10
AES total score:100 – 10 = 90
Remark:Excellent greenness
(a) Penalty points. (b) Total PP = Amount PP × Hazard PP.
Table 2. Method trueness and precision data.
AnalyteNominal
Concentration
(ng·mL−1)
Intraday (n = 6)Interday(n = 18)
Trueness (RE, %)Precision
(RSD, %)
Trueness (RE, %)Precision
(RSD, %)
NER10 (LLOQ)−10.52.4−10.12.2
100 (LQC)−9.22.1−10.22.5
500 (MQC)−8.71.4−9.11.2
1000 (HQC)−10.231.5−10.51.3
NRN10 (LLOQ)−10.51.8−9.31.8
100 (LQC)−8.762.8−10.61.6
500 (MQC)−10.361.4−9.911.26
1000 (HQC)−10.021.3−10.011.1
RE: Relative error; RSD: Relative standard deviation.
Table 3. Stability data of the method.
Stability TypeCompoundConcentration (ng·mL−1)RE, %RSD, %
Bench-top at room temperature
(up to 6 h)
NER100 (LQC)−11.752.74
1000 (HQC)−13.741.44
NRN100 (LQC)−11.372.42
1000 (HQC)−14.431.22
Short term at room temperature
(up to 24 h)
NER100 (LQC)−11.271.47
1000 (HQC)−14.450.99
NRN100 (LQC)−12.41.38
1000 (HQC)−14.330.57
Long-term at −20 °C
(14 days)
NER100 (LQC)−11.751.64
1000 (HQC)−13.312.34
NRN100 (LQC)−13.651.62
1000 (HQC)−14.351.04
Freeze–thaw at
−20 °C (up to 3rd
cycle)
NER100 (LQC)−12.71.75
1000 (HQC)−11.781.23
NRN100 (LQC)−12.21.85
1000 (HQC)−13.50.91
Post-preparation
at 8 °C
NER100 (LQC)−14.73.14
1000 (HQC)−14.081.86
NRN100 (LQC)−11.62.77
1000 (HQC)−12.871.13
RE: Relative error, RSD: Relative standard deviation.
Disclaimer/Publisher’s Note: The statements, opinions and data contained in all publications are solely those of the individual author(s) and contributor(s) and not of MDPI and/or the editor(s). MDPI and/or the editor(s) disclaim responsibility for any injury to people or property resulting from any ideas, methods, instructions or products referred to in the content.

