Article

Dimethyl Carbonate as a Mobile-Phase Modifier for Normal-Phase and Hydrophilic Interaction Liquid Chromatography

Department of Chemistry and Biochemistry, 651 E. High Street, Miami University, Oxford, OH 45056, USA
*
Author to whom correspondence should be addressed.
Separations 2023, 10(2), 70; https://doi.org/10.3390/separations10020070
Submission received: 6 November 2022 / Revised: 5 January 2023 / Accepted: 12 January 2023 / Published: 18 January 2023
(This article belongs to the Special Issue Novel Applications of Separation Technology)

Abstract

:
We studied the use of dimethyl carbonate (DMC) as a non-toxic, aprotic modifier for hydrophilic liquid interaction chromatography (HILIC) and as a modifier for normal-phase liquid chromatography (LC). A comparison of ethyl acetate (EA) and DMC as organic mobile-phase modifiers in hexane for normal-phase LC of phthalates was conducted with a silica column and showed that retention factors (k) at the same modifier percentage were about a factor of two greater for DMC. Detection at 215 nm, possible with DMC, allowed for the better detection of the phthalates by a factor of 10, compared with EA detection, best at a 254 nm wavelength. Using a core-shell silica column, HILIC separations of trans-ferulic acid, syringic acid, and vanillic acid were compared between acetonitrile (MeCN) and DMC as the organic portion of the mobile phase, from 80–95%. The analyte retention for DMC, when compared to MeCN, was about 1.5 times greater, with only a moderate increase in back pressure. Plate count and peak asymmetry were somewhat better for the DMC chromatograms, compared to those with MeCN. Seven mono- and di-hydroxybenzoic acid positional isomers could be resolved effectively with DMC. Sorbate and benzoate preservatives in commercial drinks were also determined.

1. Introduction

There are 12 principles of green chemistry; principle number 5 is to reduce and/or replace solvents with less toxic ones [1]. In analytical chemistry, where the volumes of solvents used are already quite small, this will often take the form of a replacement with a less toxic chemical. The greening of chromatography by using alternative, mobile-phase modifiers as opposed to standard, organic solvents continues to receive considerable interest, based on the number of review articles in recent years [2,3,4,5,6,7]. A wide variety of solvent applications to create a greening of sample pretreatment steps, as well as chromatography, are being made [8]. Acetonitrile (MeCN) is the dominant HPLC solvent that acts as the organic modifier for the mobile phase because of its low UV cut-off and low viscosity [9,10]. However, MeCN is known to be toxic to humans via inhalation and dermal absorption and often makes up the bulk (>50%) of the mobile phase in LC [11]. Emphasis on green solvents, particularly alternatives to MeCN, such as ethanol, was emphasized for the RPLC of pharmaceuticals [12]. Although the following solvents have relatively high UV cut-off wavelengths, acetone, due to its biodegradability, and ethyl lactate, produced from ethanol and lactic acid, have also been tested as green alternative solvents to MeCN. Sixteen poly-aromatic hydrocarbons (PAHs) have been separated by RPLC using ethyl lactate as the organic mobile-phase modifier [13]. A mixture of 75% ethanol and 25% methyl acetate was effective for RPLC of a wide variety of organic compounds, including food additives and dyes [14]. Glycerol has been proposed as a mobile-phase modifier to improve peak symmetry, particularly when mixed with ethanol and used at a controlled column temperature [15]. Recently, we have shown the non-ionic surfactant, Tween, to be effective for totally aqueous RPLC profiling of impurities in terephthalic acid [16] and for the separation of hydroxyl aromatic acids [17]. Separations using ionic liquids as mobile-phase modifiers, or immobilized in the stationary phase, continue to be promoted [18], as does the application of deep eutectic solvents [19].
Propylene carbonate (PC) as a replacement for MeCN in RPLC has generally been applied to specific pharmaceutical separations. Reversed-phase (RP) LC of a variety of pharmaceuticals using the mobile-phase modifier combination of 60% PC–40% methanol mixed with an aqueous ammonium acetate buffer was shown [20,21,22,23]. Recently, a 60% PC and 40% ethanol solution was used as the mobile-phase modifier for the first-dimension gradient RPLC x RPLC separation of a pharmaceutical mixture of sulfa drugs and analgesics [24] or phenolic compounds [25]. A more fundamental chromatographic comparison of PC to MeCN as a RPLC mobile-phase modifier was made by Tache and co-workers [26]. One HILIC chromatogram with a mixture of nicotinamide, pyridoxine, and thiamine was shown using both MeCN and PC mobile-phase modifiers, but no other such work was pursued.
Dimethyl carbonate (DMC) has been classified as one of the greenest solvents, in the same class as water, short chain alcohols, and ethyl acetate [27]. DMC also biodegrades rapidly in the atmosphere (over 90% in 28 days); therefore, it can be considered non-toxic [27]. However, analytical chemistry applications involving DMC appear to be very limited. DMC has been introduced as a mobile-phase modifier for RPLC, with ICP-MS detection for the sulfur detection of aromatic sulfonamides, hexane sulfonic acid, and dithiobenzoic acid [28]. DMC, being a more non-polar solvent than MeCN or MeOH, can be used at a lower percentage (10% or less), permitting better stability of the ICP plasma.
Chiral chromatography of marinoaziridines using 90% DMC−10% methanol or ethanol [29] and hydantoins using 100% DMC on polysaccharide-based stationary phases [30] has been compared to supercritical fluid chiral separations.
A comparison of the solvent properties of MeCN, DMC, and PC, obtained from various sources [31], is shown in Table S1. The Hildebrand solubility parameters and the Hanson solubility parameters are quite comparable between the three solvents. However, the polarity of DMC, as indicated by the one relevant Hanson parameter, as well as the dipole moment and dielectric constant, is considerably lower than the other two solvents. The surface tension of DMC is similar to that of MeCN, while the surface tension for PC is considerably higher. Although MeCN has the lowest viscosity of the three solvents at 0.38 cP, the viscosity of DMC at 0.66 is fairly comparable, much lower than that for PC at 2.4. The solubilities of the carbonate solvents in water are comparable in the 14–18 g/100 mL range, indicating that a co-solvent of ethanol would likely be required for HPLC modes other than the normal phase. Table S1 also summarizes the solvent properties of ethyl acetate (EA), a common mobile-phase modifier for normal-phase LC. Several values, such as surface tension, dielectric constant, and Hildebrand solubility parameter, are similar between DMC and EA.
We have concluded that DMC should be an effective organic solvent mobile-phase modifier for both normal-phase LC and hydrophilic interaction liquid chromatography (HILIC). DMC has excellent miscibility with hexane when applied as a mobile-phase modifier for normal-phase LC. EA is considered a non-toxic solvent for normal-phase LC; however, its UV cut-off is high. High percentages, in the 90% range, of the aprotic solvent MeCN are often required for most HILIC applications [32,33,34]. A substitution of the aprotic DMC will provide a low-toxicity advantage, with a mass transfer capability that is still good, due to its reasonable viscosity.
Herein we present the application of DMC as a mobile-phase modifier for normal-phase LC and HILIC. To the best of our knowledge, the application of a carbonate organic solvent for normal-phase LC has not been performed. As a test case, normal-phase LC of phthalates with a low percentage of DMC in hexane showed excellent peak resolution and detection at 215 nm. Such a low wavelength, important for detectability, was not possible when using an EA in a hexane mobile phase. A detailed chromatographic comparison of DMC and MeCN as mobile-phase modifiers for HILIC is of major emphasis in this study. Retention factors (k) were generally about a factor of two greater for DMC than MeCN at the same mobile-phase composition, and van Deemter plots were quite favorable for DMC. A second mixture containing seven mono- and di-hydroxy benzoic acids, including positional isomers, was more effectively separated using DMC as the mobile-phase modifier. Complete peak reversals for the preservatives sodium benzoate and potassium sorbate were noted in the chromatograms when comparing MeCN and DMC.

2. Materials and Methods

2.1. HILIC Instrumentation

Separations took place with a Dionex P680A HPG binary pump equipped with an online Shimadzu degasser (DGU-14A), a Dionex ASI-100 autosampler, an Alltech 330 column heater, and a Dionex UVD 170U variable wavelength detector. Chromeleon 6.8 software (Thermo Scientific, Waltham, MA, USA) was used for instrument control and data acquisition. HILIC was conducted on a bare silica Halo HILIC column (Advanced Material Technology, Wilmington, DE, USA), with dimensions of 4.6 mm ID × 50 mm and 2.7µm particles. A HILIC peak symmetry comparison was performed using a Merck KGaA (Darmstadt, DE, USA) SeQuant ZIC-HILIC zwitterionic column (150 × 2.1mm, 5 µm, 200 °A). The injection volume was 20 µL, and the flow rate was generally 0.5 mL/min. The column was kept at 25 °C unless otherwise noted. UV detection was monitored at 260, 240, 220, and 215 nm.

2.2. HILIC Chemicals and Procedures

Acetonitrile (Fisher Scientific, Pittsburgh, PA, USA) and dimethyl carbonate (Sigma-Aldrich, St. Louis, MO, USA) were the bulk organic portions of the mobile phase. Ethanol (Decon Labs, King of Prussia, PA, USA) was added to ensure mobile-phase solubility. The low solubility of DMC (~14% v/v) in water required the aqueous part of the mobile phase to have two parts ethanol mixed with one part ammonium acetate buffer. A 10 mM ammonium acetate buffer (Sigma-Aldrich) was created in the water portion of the mobile phase and adjusted to a pH of 5.9 with glacial acetic acid (Fisher Scientific) before the final dilution with ethanol. Solutions were prepared with 18.2 MΩ water, which was distilled and deionized before passing through a Milli-Q water purification system (Millipore).
A test mixture of toluene (Fisher Scientific), trans-ferulic acid (Sigma-Aldrich), vanillic acid (Sigma-Aldrich), and syringic acid (Sigma-Aldrich) was analyzed, with each component being between 10 and 20 µg/g. Chromatograms based on this test mixture were used for calculations related to the retention factor (k) and plate count (N). Toluene was used as the unretained marker (t0) involving retention factor, calculated as k = (tR − t0)/t0, and the plate count (N), calculated using the Foley-Dorsey equation [35]. One modification made to this equation was to add a correction for t0, as seen in Equation (1)
N = 41.7 t r t 0 W 0.1 2 B A + 1.25
where t0 is the retention time of toluene, tR is the retention time of the peak, W0.1 is the peak width at 10% above baseline, B is the right baseline width, and A is the left baseline width, both measured from the peak apex.
Another test mixture of positional isomers containing mono- and di-hydroxy benzoic acids (Sigma-Aldrich) with the same analyte concentration range was prepared by dilution in a 2:1 (v/v) ethanol/water mixture before a final dilution to 10 µg/g with organic solvent. The preservatives sodium benzoate (Fisher Scientific) and potassium sorbate (TCI Chemicals, Portland, OR) were examined in a set of drinks: Jose Cuervo Classic Lime Margarita, Daily’s Cocktails Margarita Mix, and Sunny D Orange Strawberry (all purchased from a local grocery store). The drink samples were filtered with a 0.2 μm nylon filter. External calibration curves from 5–125 ppm, using both peak height and peak area taken in quadruplicate, were constructed for both the sorbate and benzoate analytes, determined at the previously indicated detection wavelengths.

2.3. Normal-Phase LC Instrumentation

Separations took place with a Dionex UltiMate 3000 LPG Pump, equipped with an inline degasser, a Dionex ASI-100 autosampler, a Jones Chromatography model 7950 column chiller, and a Dionex UVD 170U variable wavelength detector. Chromeleon 6.8 software (Thermo Scientific) was used for instrument control and data acquisition. The separations were performed using an Agilent (Santa Clara, CA, USA) Zorbax RX-SIL 5 μm particle column, with dimensions of 4.6 mm ID × 150 mm. UV detection was monitored at 254, 275, 220, and 215 nm.

2.4. Normal-Phase LC Chemicals and Procedures

Ethyl acetate and hexane were reagent-grade and obtained from Fisher Scientific. Dimethyl carbonate was from the same source (Sigma Aldrich). Dimethyl-, diethyl-, dibutyl-, dioctyl-, and benzyl butyl-phthalate (Sigma-Aldrich) solutions were prepared at 50 μg/g with 0.3% 2-propanol (Fisher Scientific) in hexanes and either ethyl acetate or DMC as the remainder. Hexanes-0.3% 2-propanol solution portions ranged from 90 to 98%, with the balance to 100% being either ethyl acetate or DMC. Flow rate was 1 mL/min, with the column kept at 25 °C.

2.5. DMC Purity Analysis by GC

An Agilent 8860 GC coupled to a 5977B MSD running Agilent Mass Hunter 10.0 was utilized for the DMC purity experiments. The GC was equipped with an Agilent HP-5MS column, with 30m × 0.25 mm ID × 0.25 µm film thickness and a 4mm ID × 78.5 mm L Ultra Inert liner. The distillation of DMC, obtained from a different company, was performed on a 100 mL solvent volume, in a 500 mL round-bottom flask, with a 12-inch fractional distillation column and a condenser tube emptying into a clean, 150 mL beaker. Distillation occurred over approximately 45 min of reflux, with two fractions of 25 mL apiece collected. The UV-Vis spectra were obtained neat on an Agilent 8453 photo diode array spectrophotometer, G1103A.

3. Results and Discussion

It was discovered that the purity of DMC, based on the UV absorbance spectra, was variable between two different companies. The purity of the Sigma-Aldrich DMC was fine and could be used without purification. The DMC purchased from a different company showed a substantial absorbance in the 250 nm range (Figure S1). Previously, impurities such as cyclohexanol and propylene glycol in DMC, synthesized using the methanol oxidative carbonylation method, were determined using gas chromatography equipped with a polar Carbowax capillary column [36]. A GC-MS assay of the before-distilled DMC solvent from the second company indicated that only a very small impurity of methanol could be noted. A distillation was performed, and the UV-Vis spectra of the purified and remaining DMC solutions in the flask were obtained (Figure S1). The remaining DMC in the flask showed a similar spectrum to the starting material. However, the spectrum of the distilled, collected fraction and that of DMC purchased originally from Sigma-Aldrich were very similar, both with low UV cut-offs. There was only one lot of DMC tested from this second company, and the purity issue may be an anomaly. If needed, simple distillation should be effective for the purification of DMC.

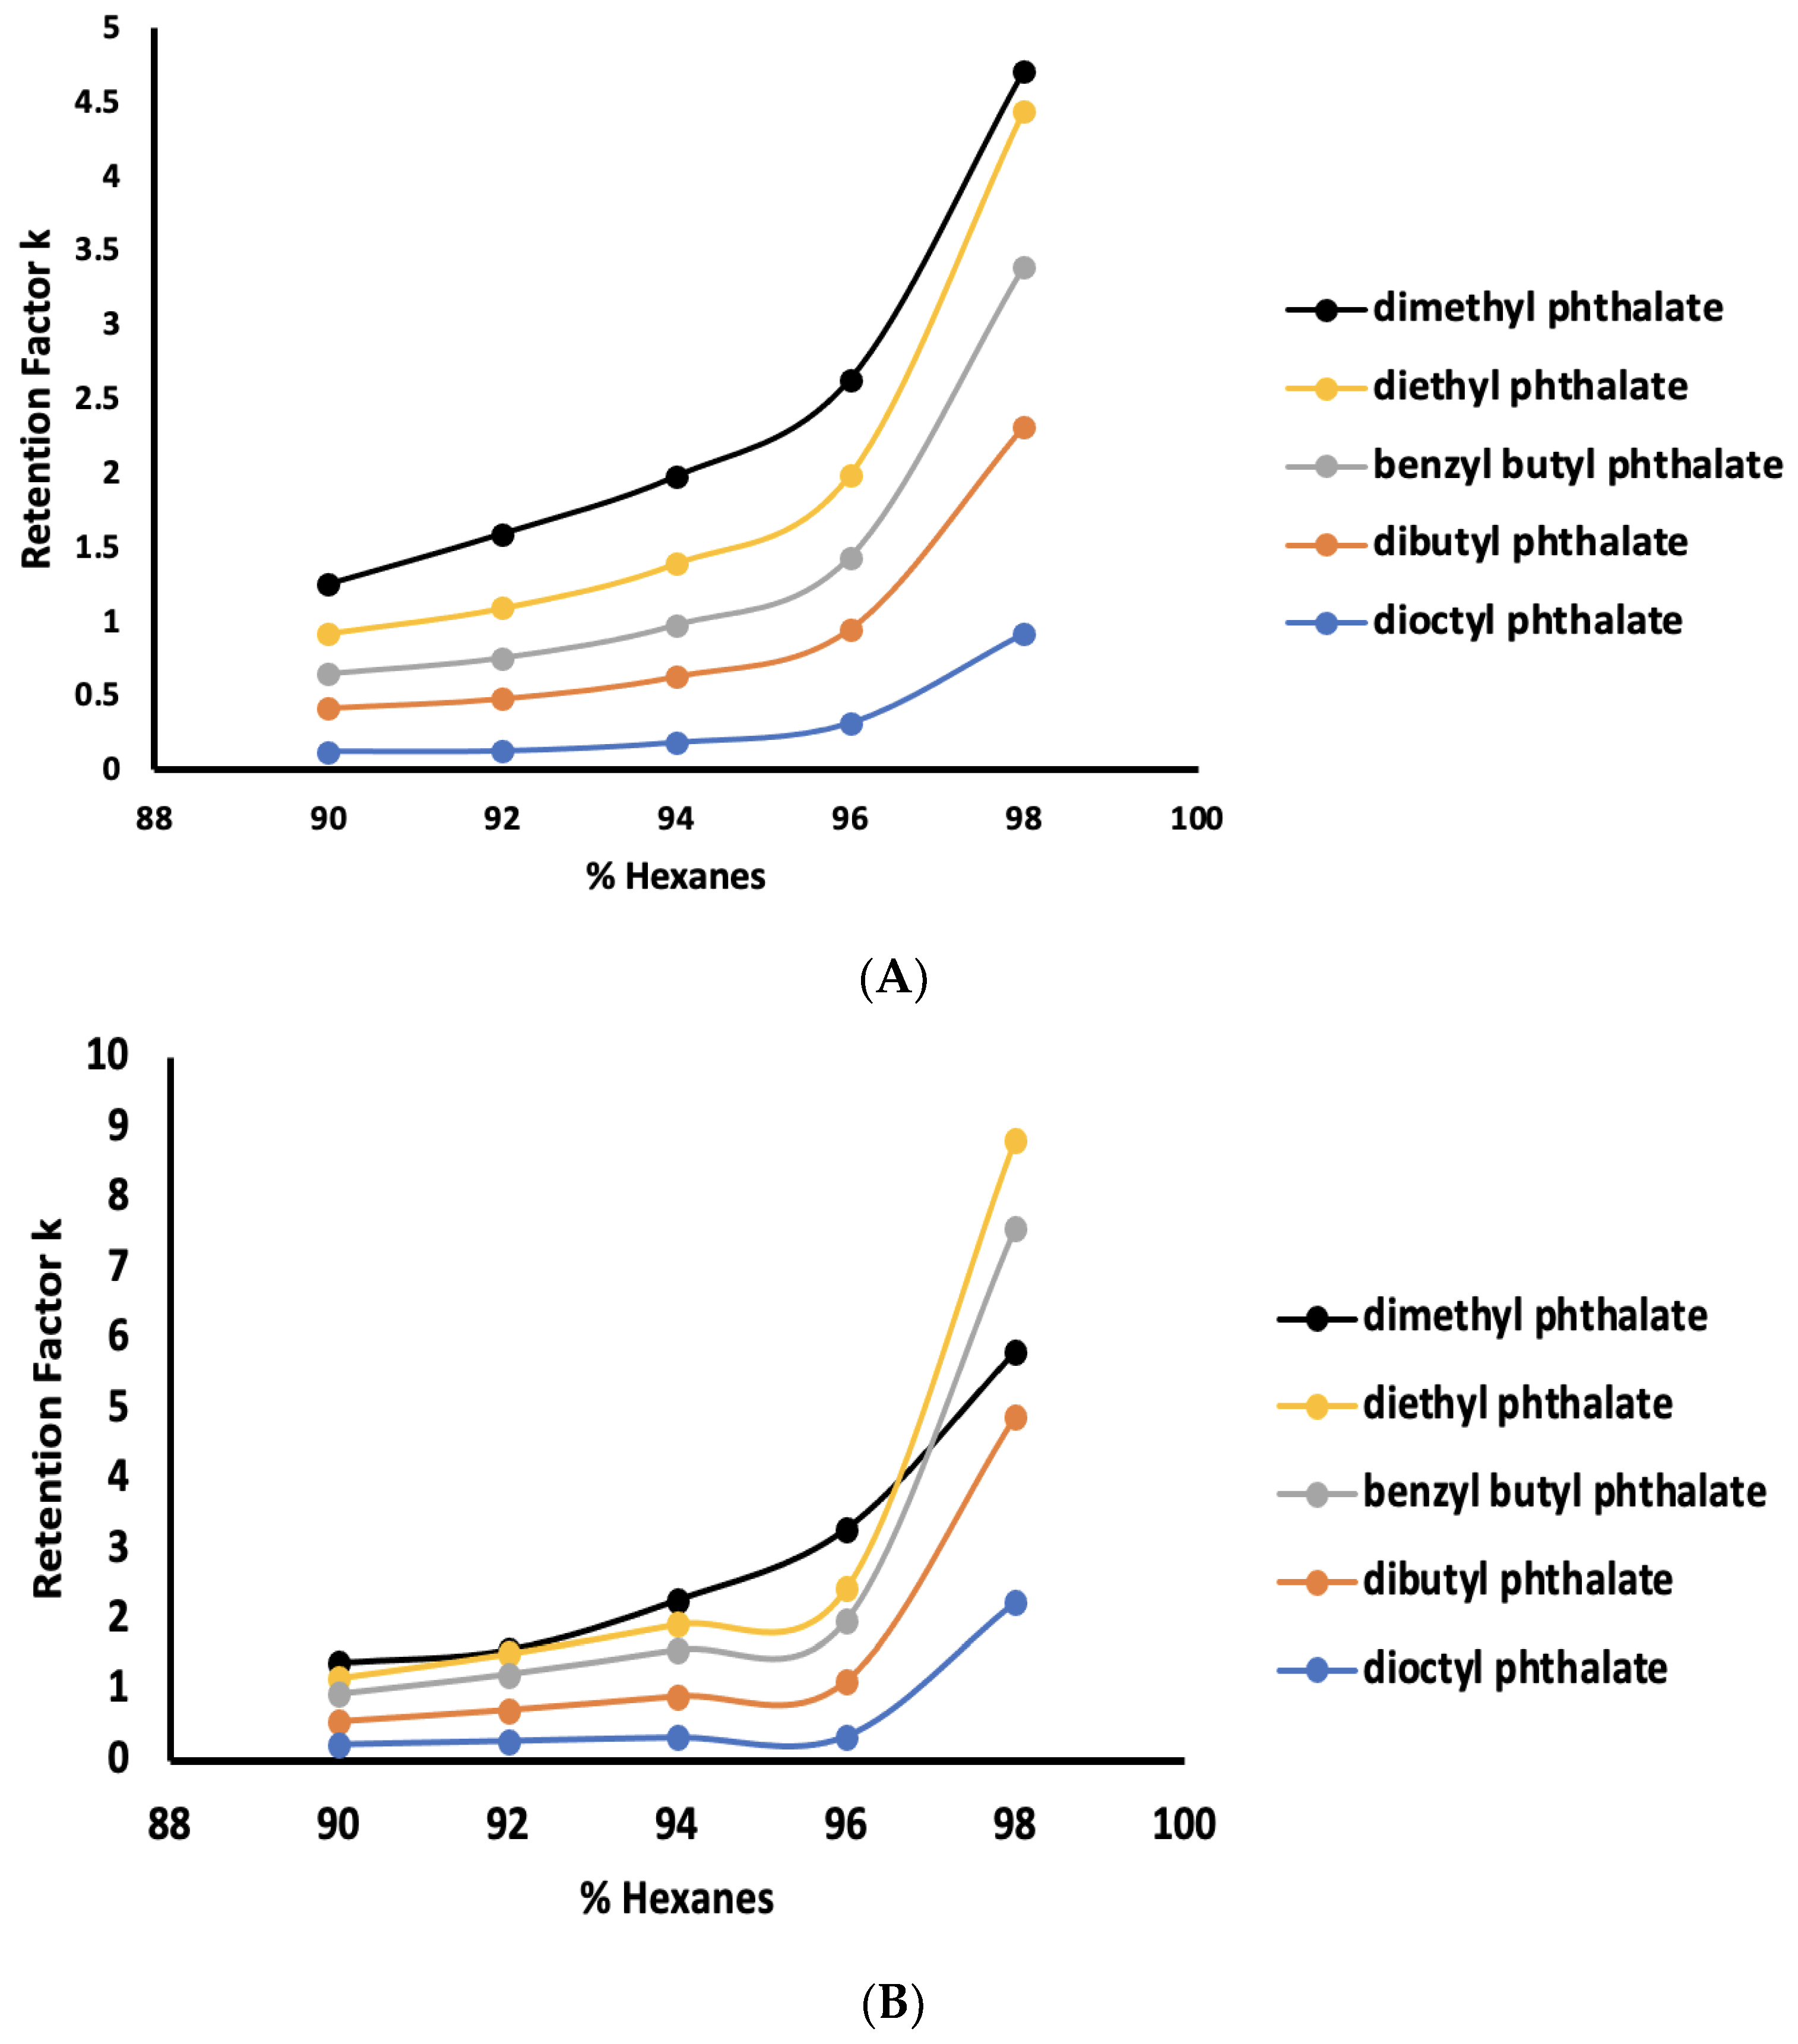
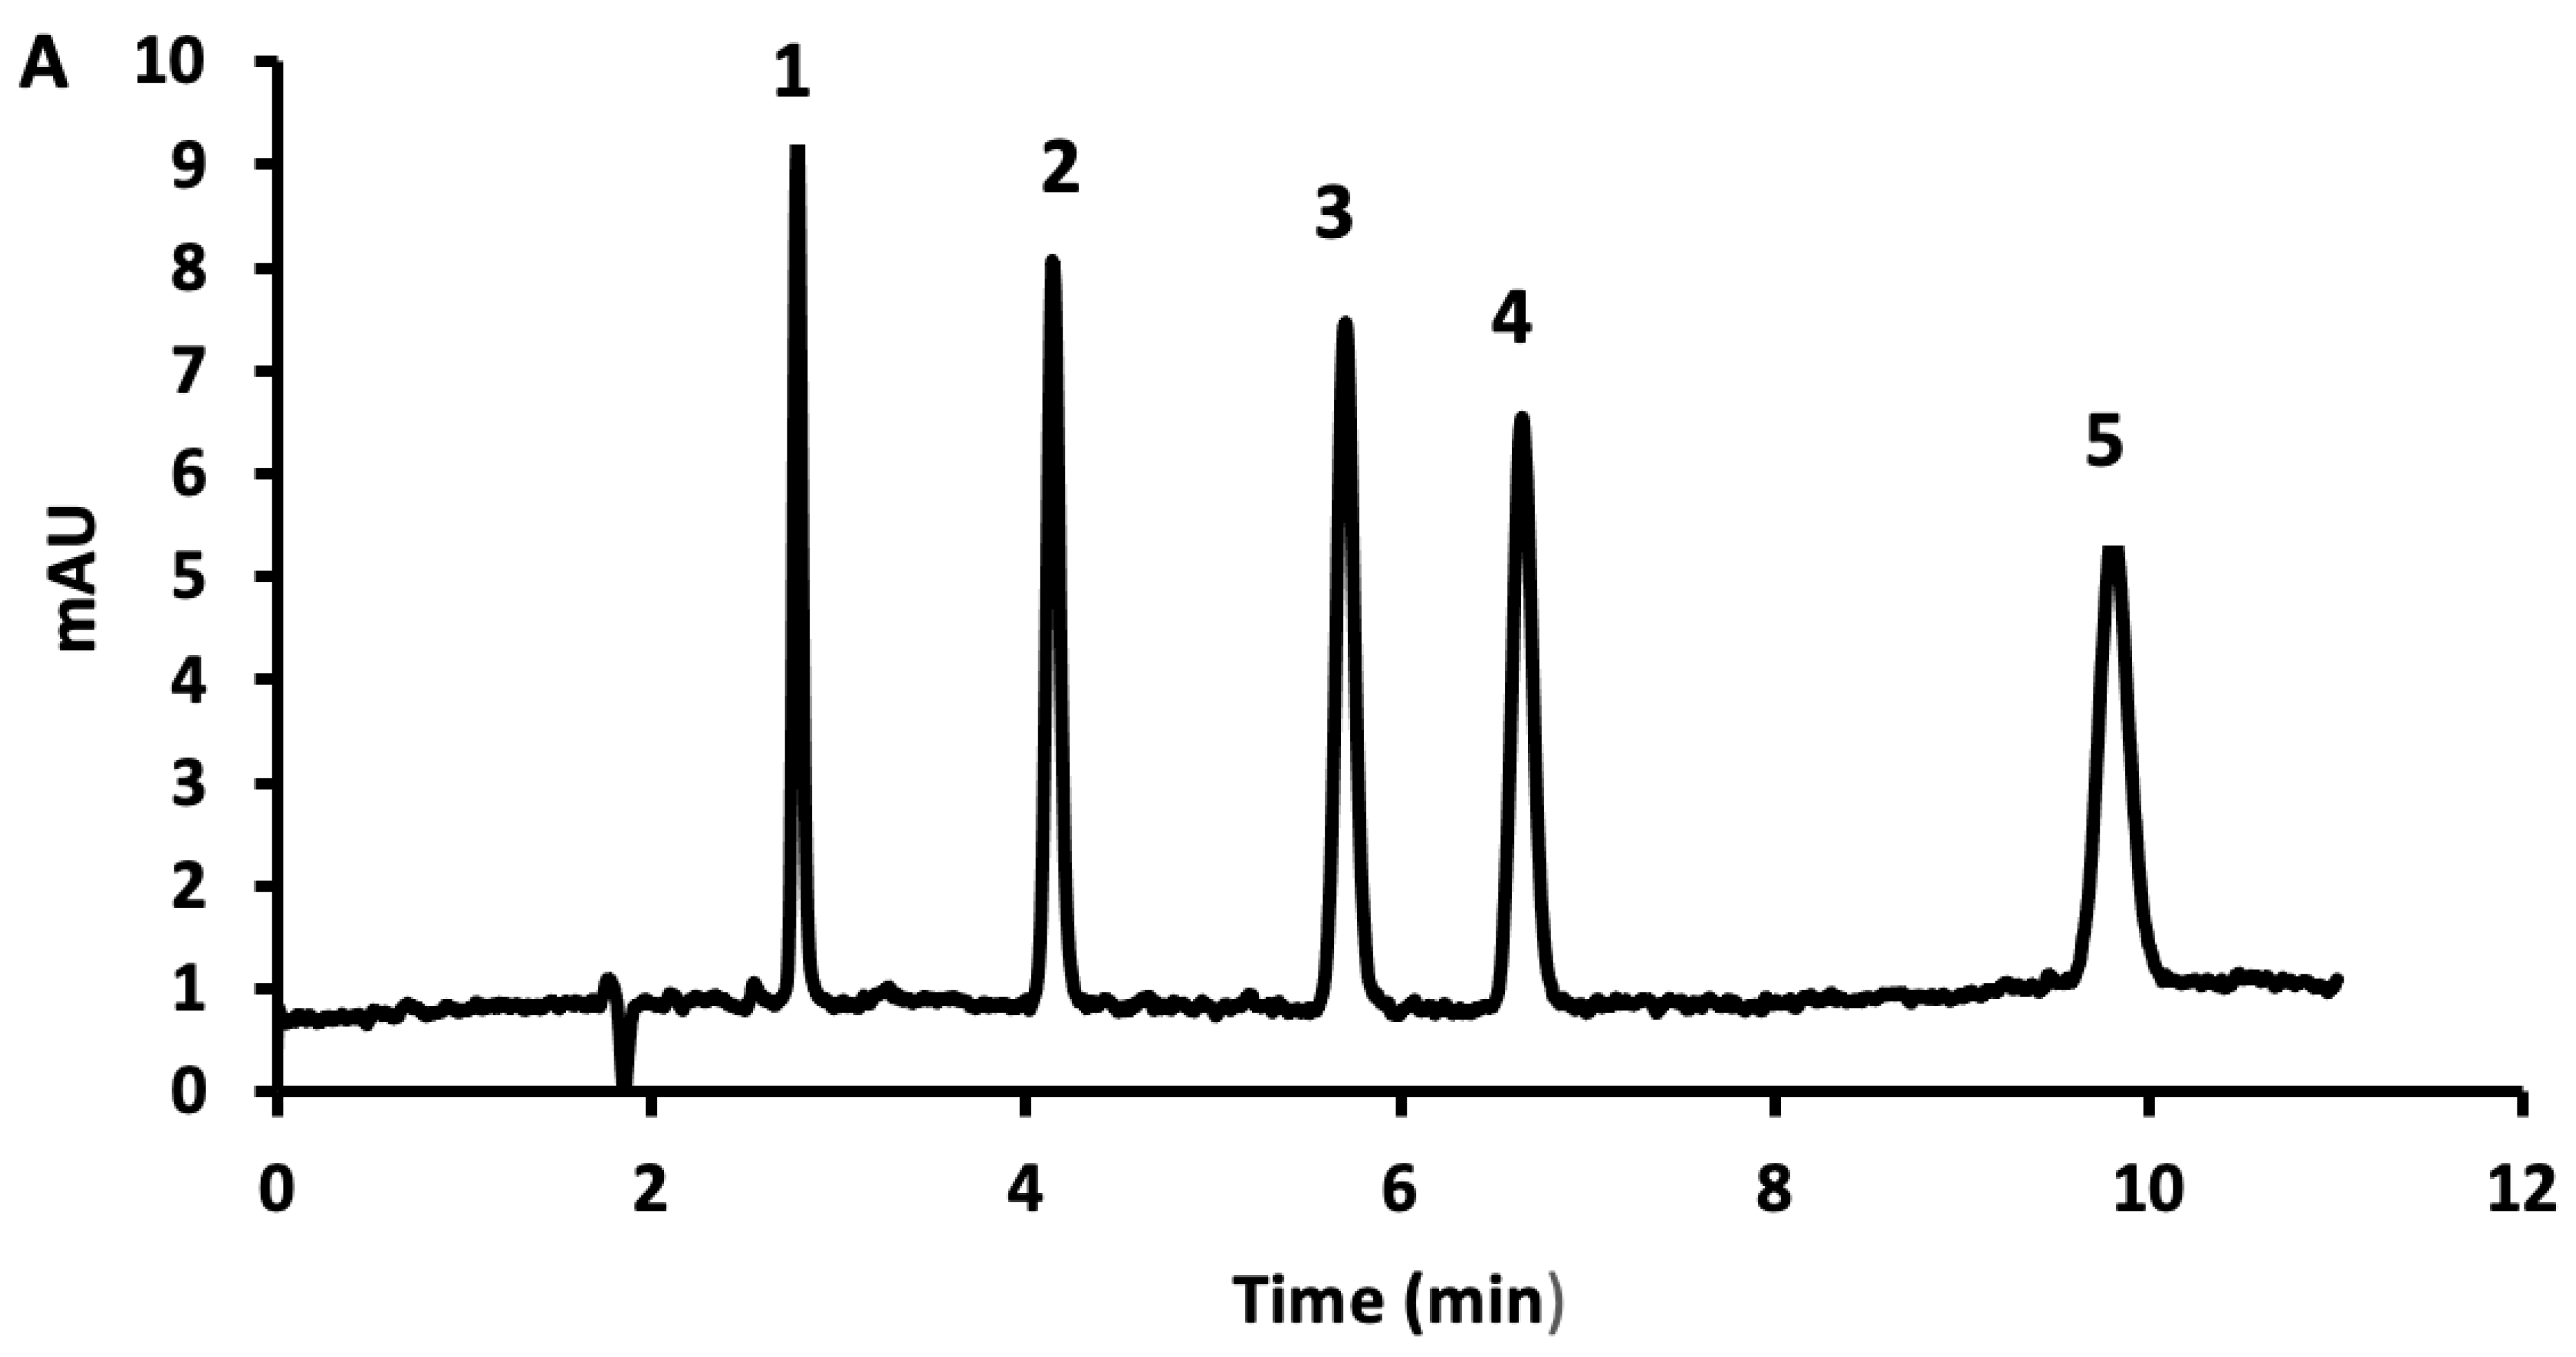
3.1. Normal-Phase LC

The retention factor (k) plots for dimethyl-, diethyl-, benzylbutyl-, dibutyl-, and dioctyl-phthalates using both EA and DMC as mobile-phase modifiers in hexane are shown in Figure 1. The retention order of the phthalates for EA is as expected, with the least non-polar organic compound (dimethylphthalate) retained the most throughout the 2–10% EA in the hexane mobile phase. At 10% EA or DMC, retention factors were slight, all under 1.5. Retention was doubled at 4% modifier solvent; however, at 2%, the retention factors dramatically increased to the ranges of 1–5 for EA and 2–9 for DMC. In addition, the retention order at 2% DMC changed with the k values of benzylbutyl- and diethyl-phthalate, crossing over the k values of dimethyl-phthalate. The lower dipole moment and dielectric constant values for DMC, as compared to EA in Table S1, may partially explain the weaker normal-phase eluting strength of the former solvent. Snyder eluent strength parameters for hexane (0.01), EA (0.58), and ethanol (0.88) were used to calculate the polarities of various binary mobile phases of hexane–EA and hexane–ethanol. It was found that a percentage range of ethanol from 1.3–2.6% was predicted to offer the same phthalate peak resolution as 2–6% EA. The reproducibility of such low % values of ethanol in the mobile phase could be problematic.
The UV spectra of solutions with low percentages of EA and DMC in hexane are compared in Figure S2. The EA solution showed a broad peak, with a wavelength absorbance maximum near 220 nm, while the peak for DMC was narrower, with a wavelength absorbance maximum closer to 200 nm. Minimal UV absorbance was indicated for EA at 250 nm and for DMC at 220 nm. A comparison of the chromatograms for the phthalates taken with a 4% DMC modifier with detections at 254 and 215 nm is shown in Figure 2. Plate count values averaged about 4000. The analysis time was about 10 min, and peak intensities were about 10 times higher at the lower wavelengths, still with a very stable baseline. This was as expected, considering the general UV spectra of phthalates show the absorbance increasing as the wavelength deceases to a maximum of about 204 nm. A comparison of the chromatograms for the phthalates taken with a 4% EA modifier with detections at 254 and 220 nm is shown in Figure 3. Plate count values averaged about 3000. The analysis time was a bit faster at 8 min, with similar peak intensities to those of DMC at 254 nm. However, the UV absorbance of EA at 215 nm was significant, and only a very noisy baseline was noted. Figure S3 shows the comparable chromatograms for phthalates with the detection at 275 nm, as expected. Figure S4 shows the chromatographic peak detection of phthalates at 220 nm using DMC as the modifier was clearly possible but only baseline noise was observed using EA.
Plots of log k versus log ΦEA and ΦDMC are shown in Figure 4. This was based on the normal-phase solvent strength equation: Log k = log kB − nlog (B), where n = number of strong solvent molecules (B) displaced by the solute adsorption to an active site, and kB is k for the 100% B mobile phase. The linear regression equations and correlation coefficients for the plots are given in Table S2. For EA, the linearity of the plots was good, with correlation coefficients between 0.97–0.99. The slope values ranged between 0.80 and 1.30, indicating that the effective number of phthalate polar groups displaced by EA is about 1. For DMC, the linearity of the plots was not quite as good with correlation coefficients between 0.93–0.99, except for dioctyl-phthalate at 0.84. The slope values ranged between 0.92 and 1.35, indicating, again, that the effective number of phthalate polar groups displaced by DMC is about 1. For both solvents, the slope and intercept values decreased in order, and the correlation coefficients increased in the order of the increasing retention factor.

3.2. Hydrophilic Interaction Liquid Chromatography

The water solubility of DMC, similar to that for PC [26], required the use of a ternary solvent. Ethanol was chosen for its character in green chemistry, low UV absorptivity, and good miscibility with aqueous and organic solvents. We found that a 2:1 (v/v) proportion of ethanol to water allowed for a complete miscibility with DMC at all concentrations. This aqueous mixture of ethanol and water was used as the aqueous portion of all mobile phases. The UV absorbance spectra (200 to 230 nm) for various DMC mobile-phase fractions, from 90–60%, are shown in Figure S5. The lowest possible usable wavelength for 90% DMC was 215, considering the UV cut-off definition of 1 AU. For 80% DMC, the UV cut-off was about 212 nm. A very similar UV cut-off of 216 nm was determined previously with PC [26].
Figure S6 shows that the column pressure-drop using the DMC–buffer–ethanol mobile phase was about 1.5–1.8 times that of the MeCN–buffer–ethanol mobile phase, as expected due to the viscosities, which are different by about a factor of two. However, even with a 20% aqueous component in the DMC mobile phase, the column back pressure was reasonable, at about 550 psi. The pressure-drop for a 10 cm × 2.1 mm ID 3.5-micron particle column using 80% PC at 0.25 mL/min was about 50 bar, or 750 psi [26].

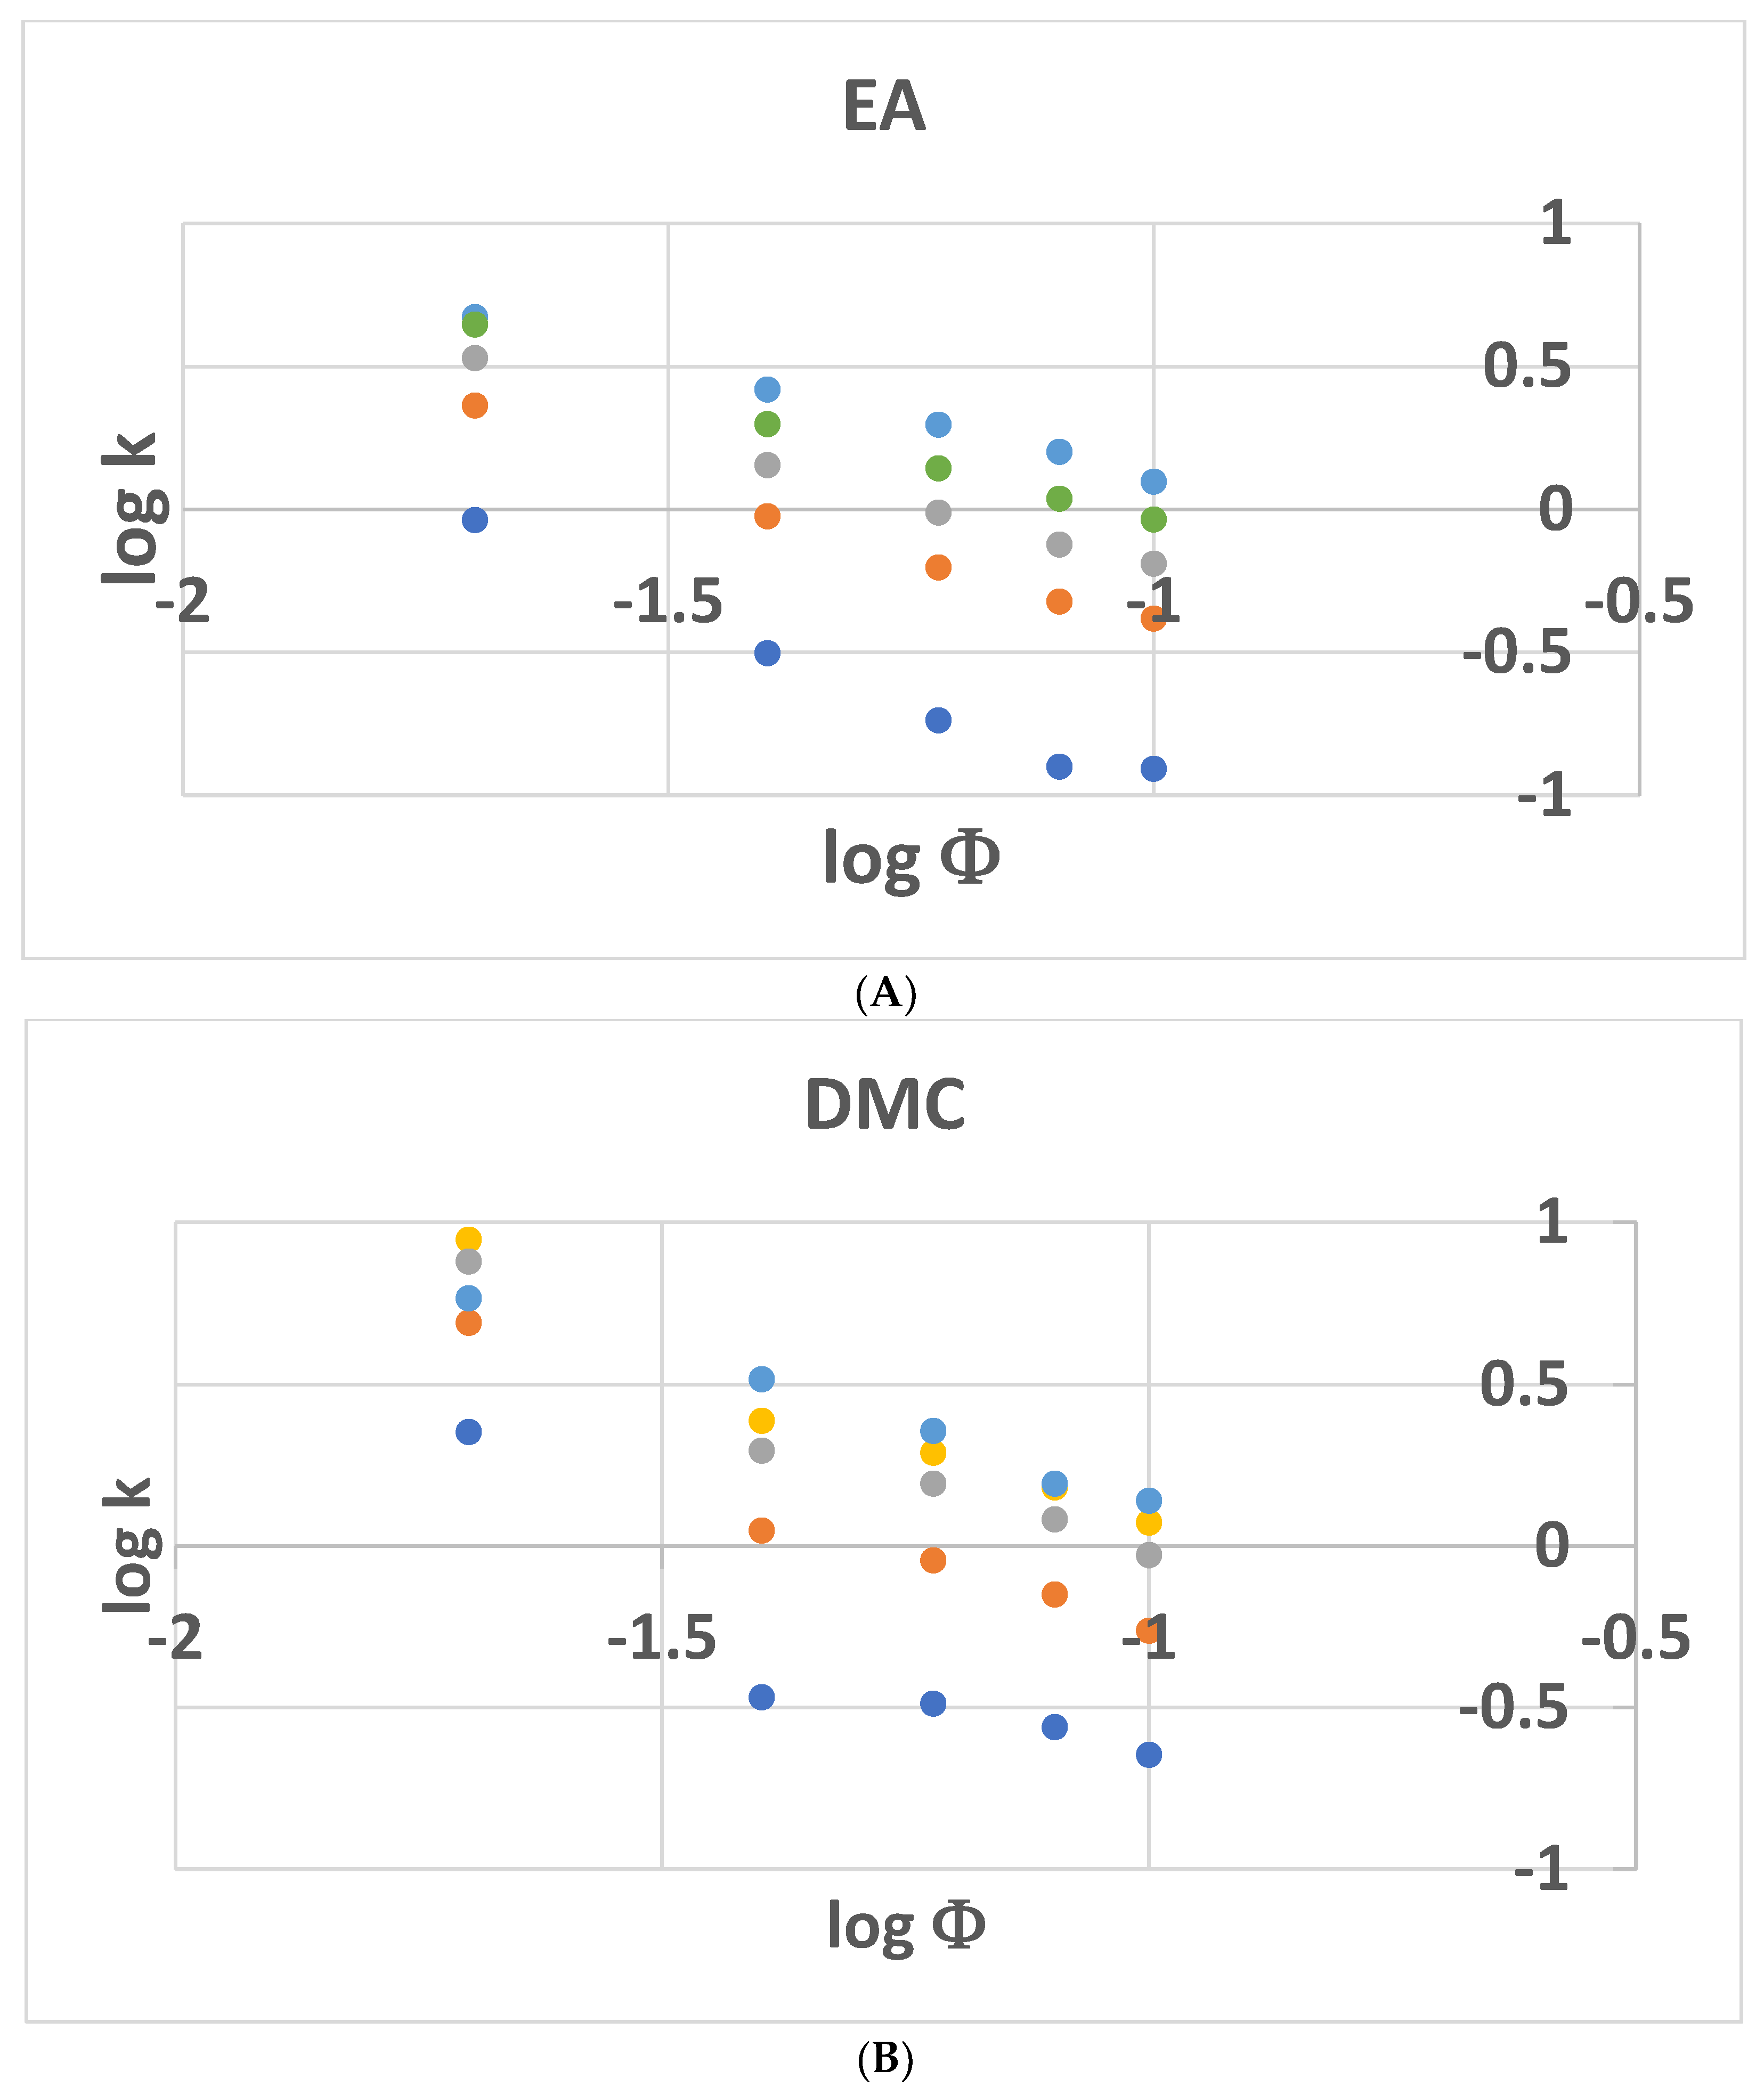
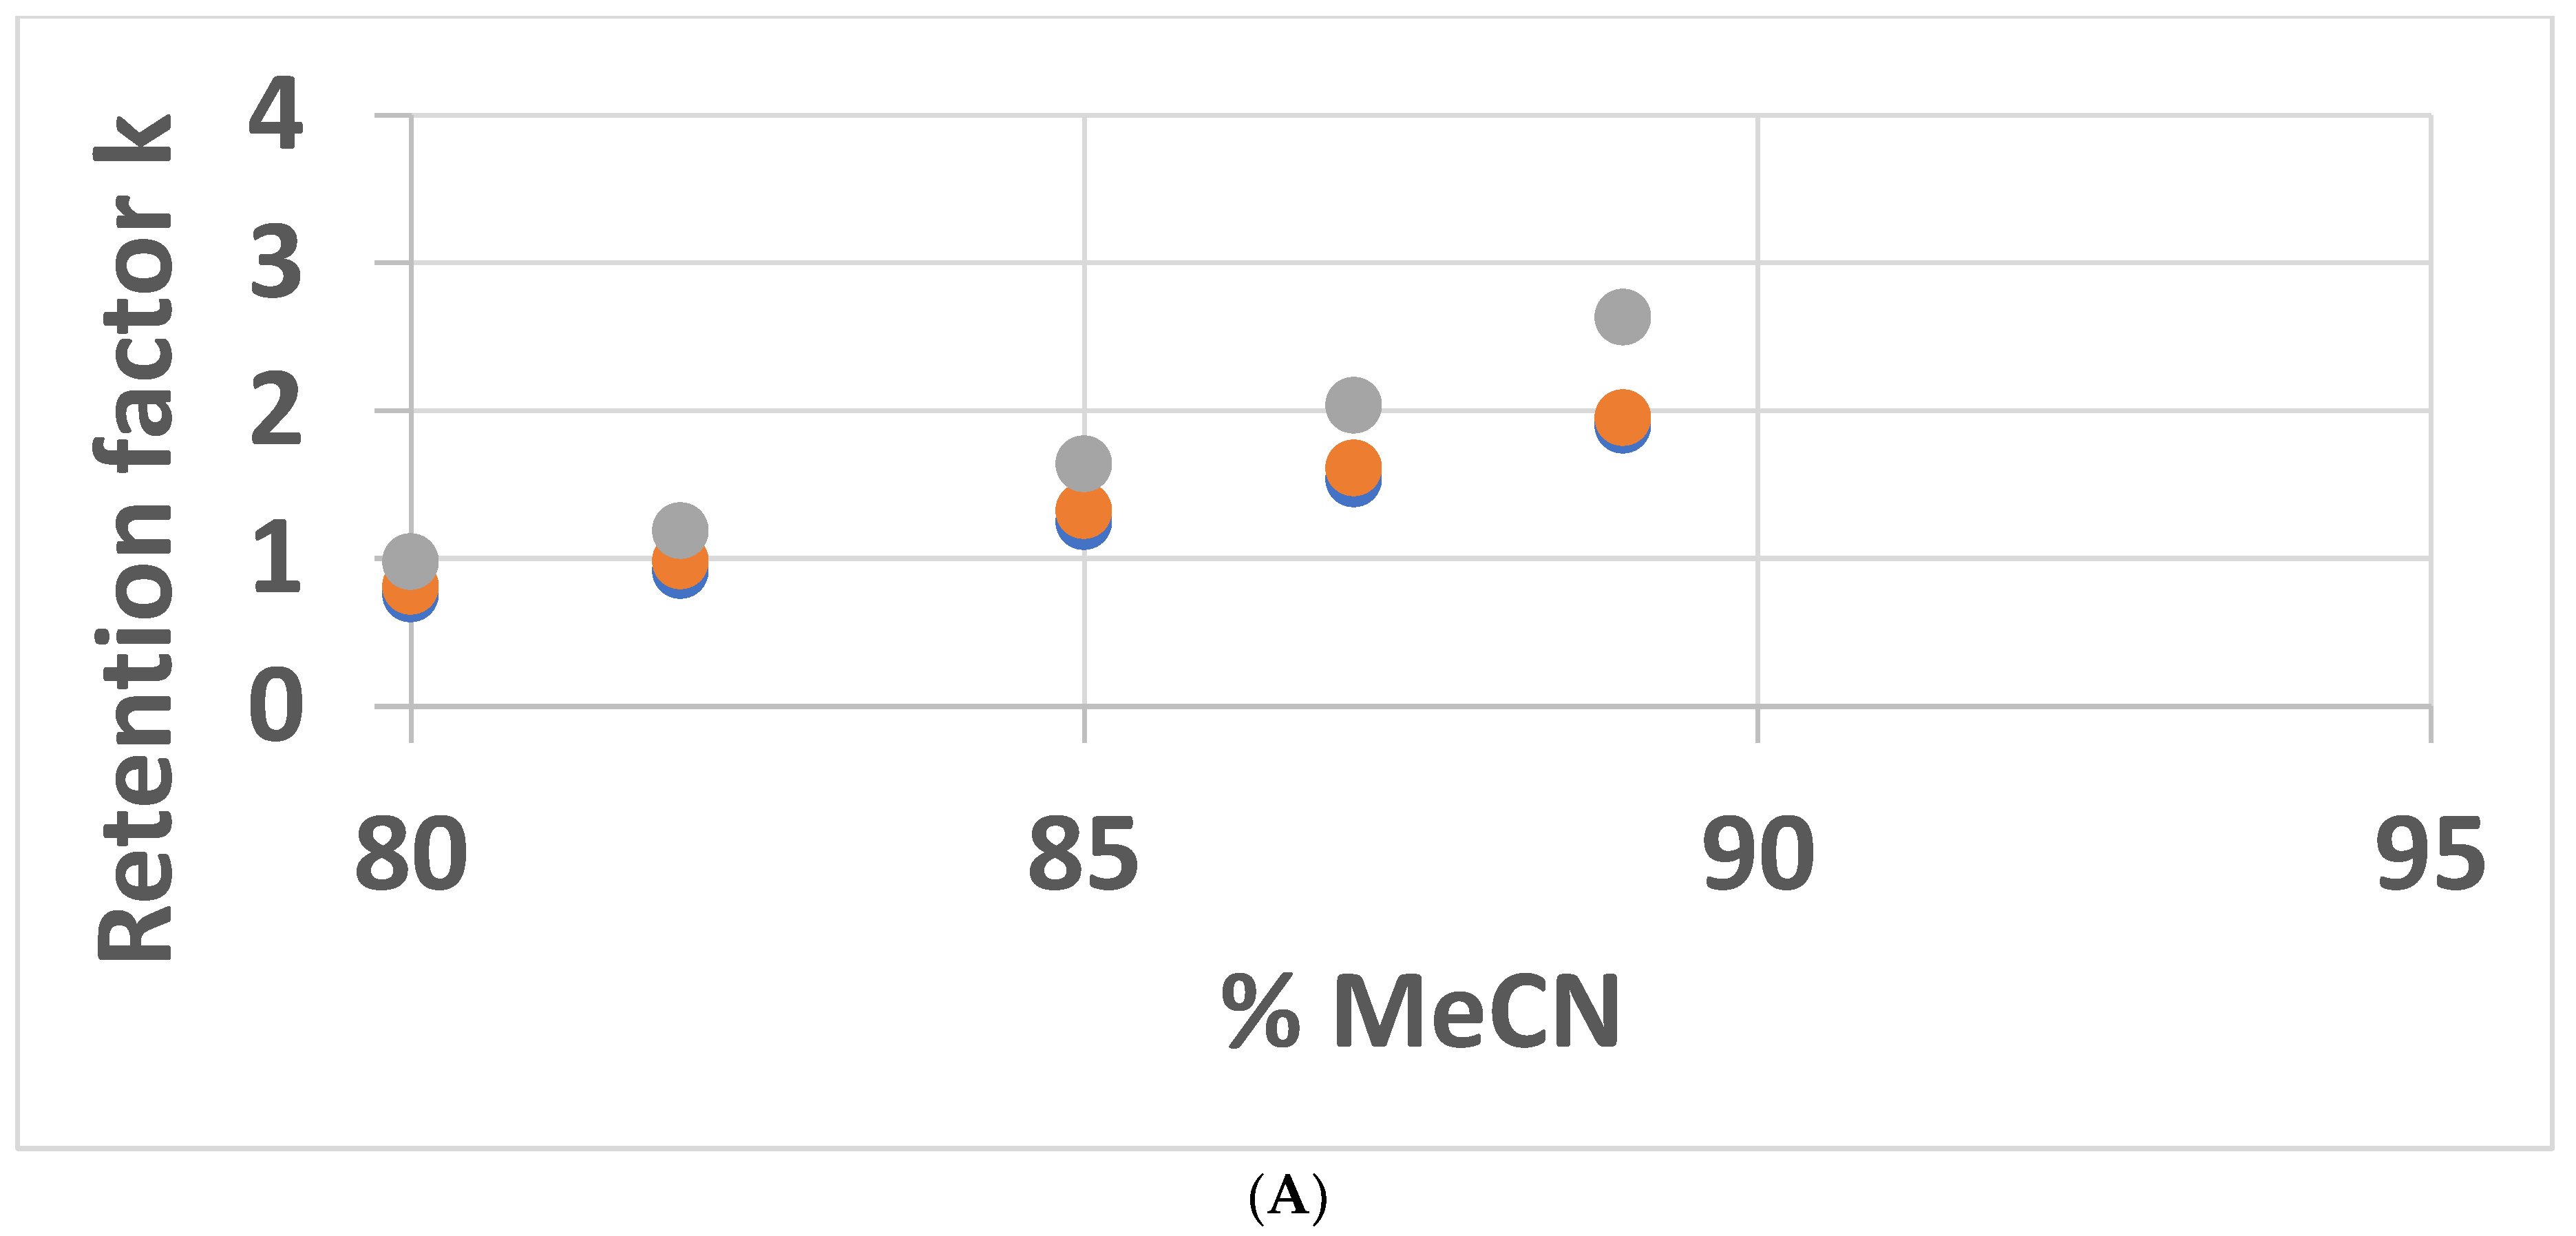
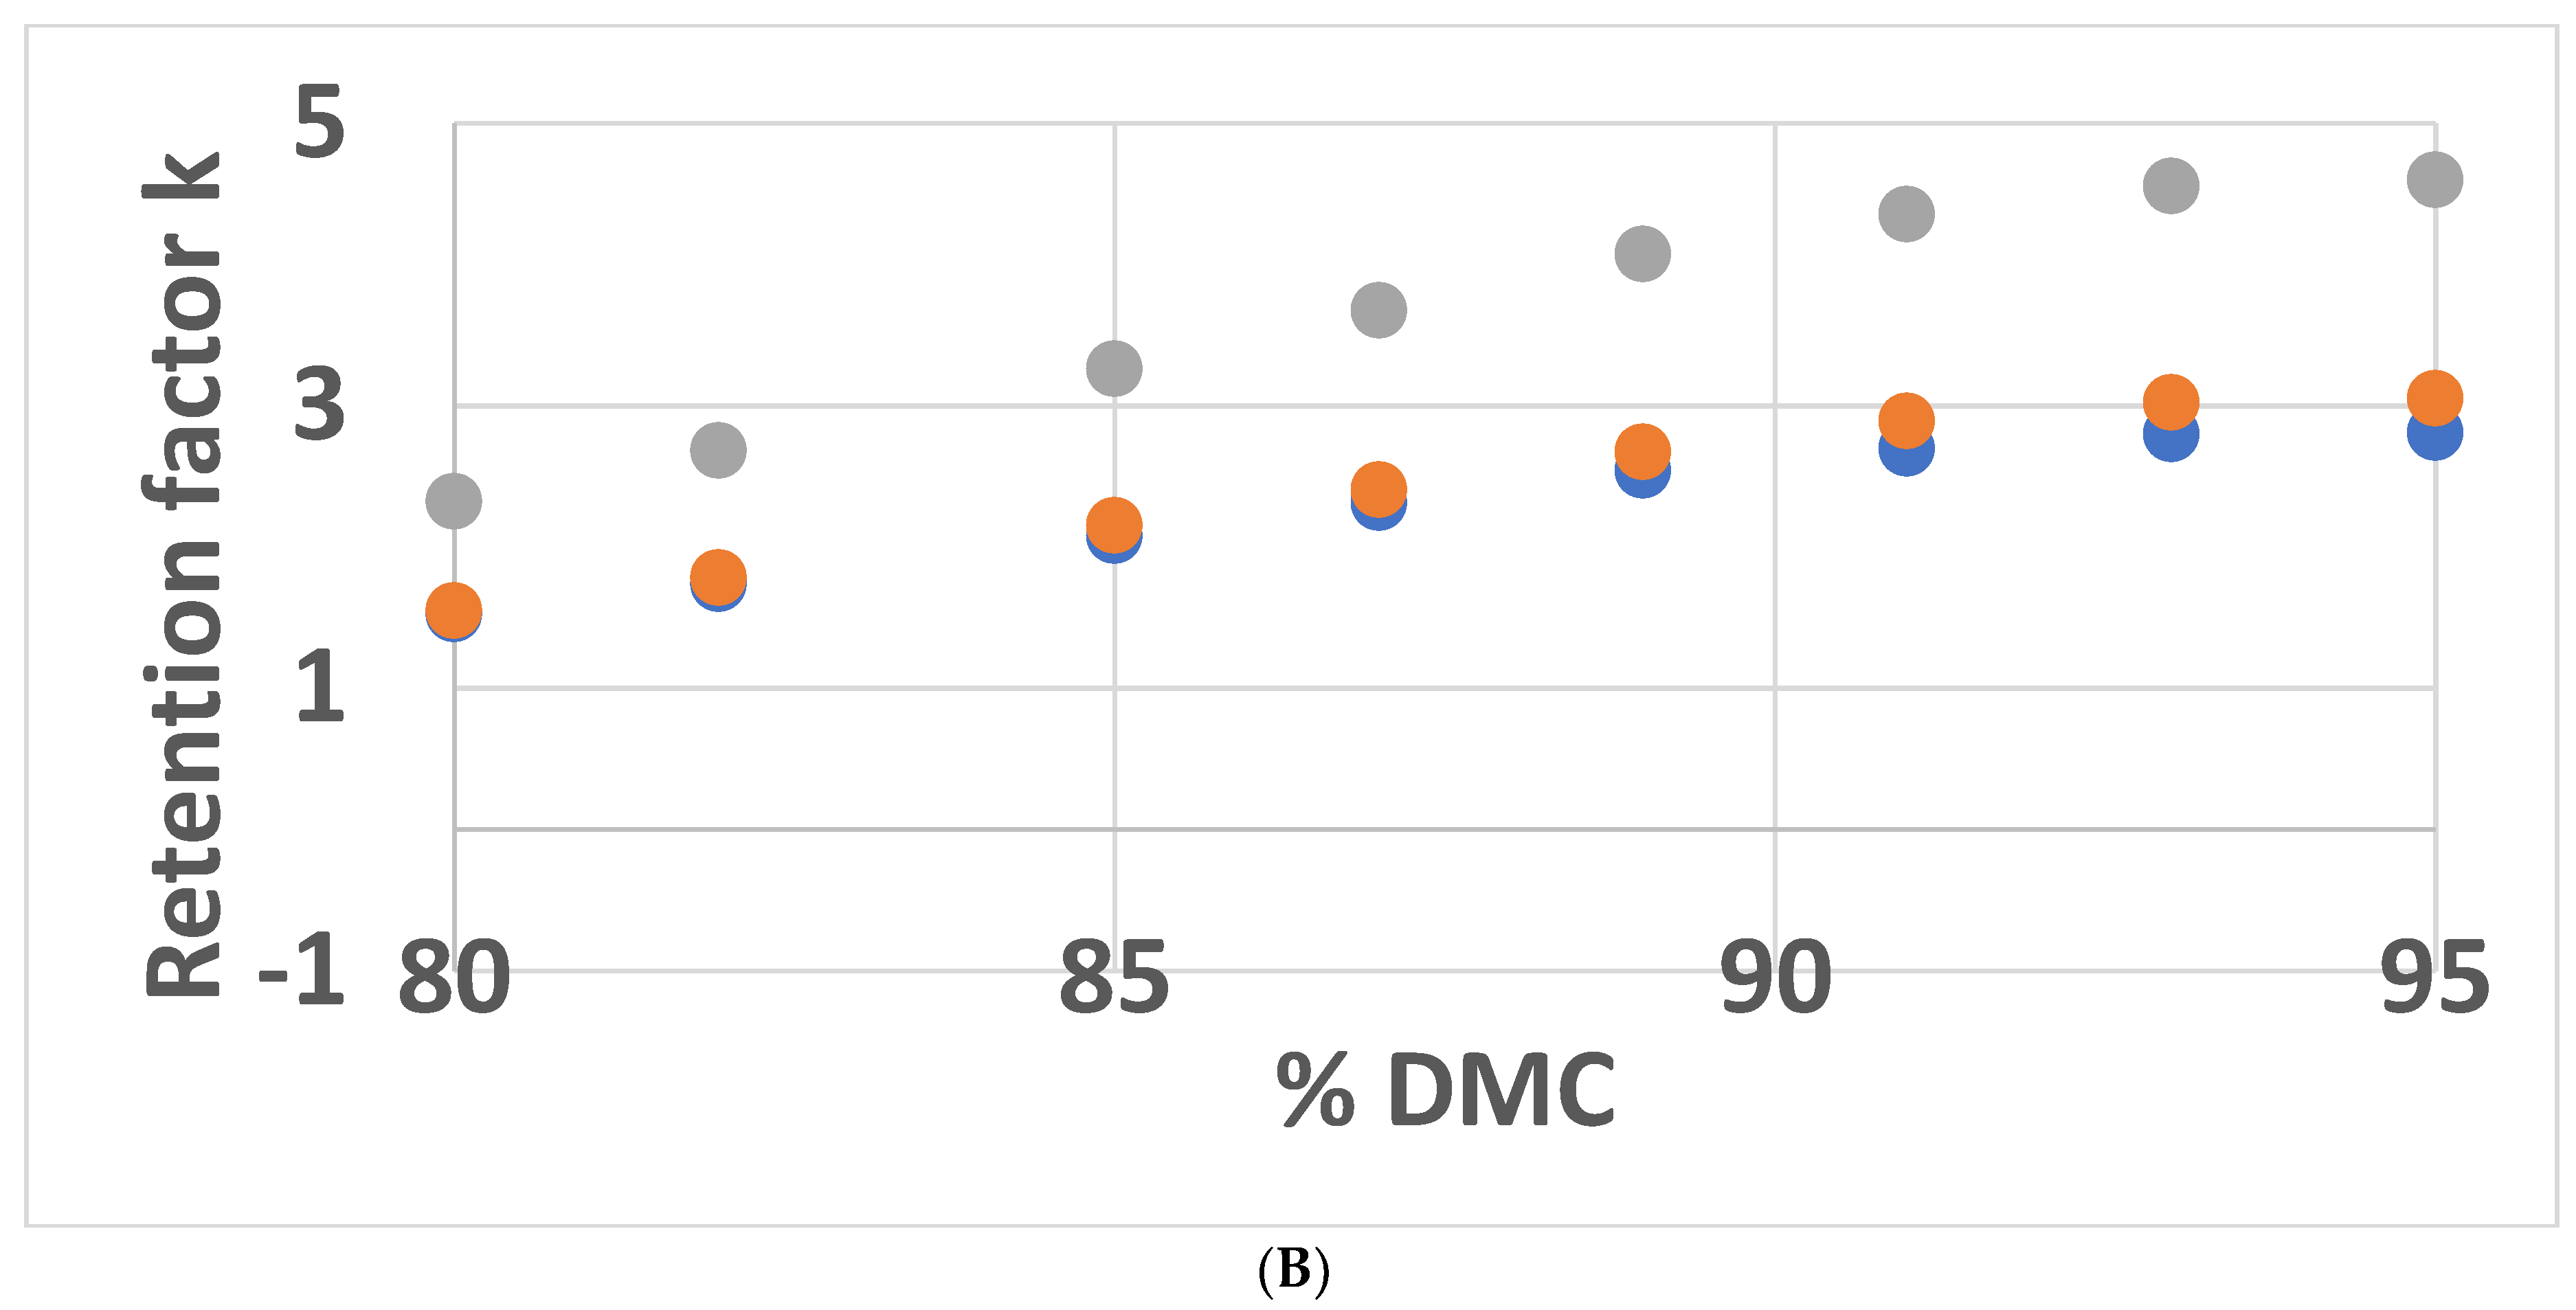
3.2.1. Retention Factor Comparison between DMC and MeCN

The plot of retention factors (k) for trans-ferulic acid, vanillic acid, and syringic acid showed increased retention with the increasing organic content of the mobile phase for both MeCN and DMC, as expected (Figure 5). Plate count values were not very high; they were in the 500 range for EA and averaging about 1200 for DMC. The resolution of trans-ferulic acid and vanillic acid was incomplete from 80% to 90% of the organic modifier. We found that above 89% MeCN, the peak shape and overlap made any analysis difficult (Figure S7); thus, this retention factor plot did not go above 90%. However, peak shape remained good as high as 95% DMC, and retention factors could be measured with an improved resolution of the first two peaks, which were trans-ferulic and cinnamic acids. In general, the retention factors using DMC were about 1.5 times that of MeCN, similar to that found for PC [26]. Log k versus log % organic modifier plots were very linear (near a correlation coefficient of 0.995) for vanillic and syringic acids using either MeCN or DMC (Figure S8). Slope value ratios for DMC/MeCN for the two acids were also similar, at about 1.1. van’t Hoff plots were constructed, as shown in Figure S9, over a temperature range of 25–40 °C for the two resolved components (trans-ferulic and syringic acids) using MeCN and all three components using DMC. The slope and intercept values were, respectively, about 1.6 and 1.7 times greater for DMC than MeCN. The linear regression for each data set was R2 > 0.99, leading us to conclude that only a single retention mechanism was present with either the mobile phase or a silica column [37].

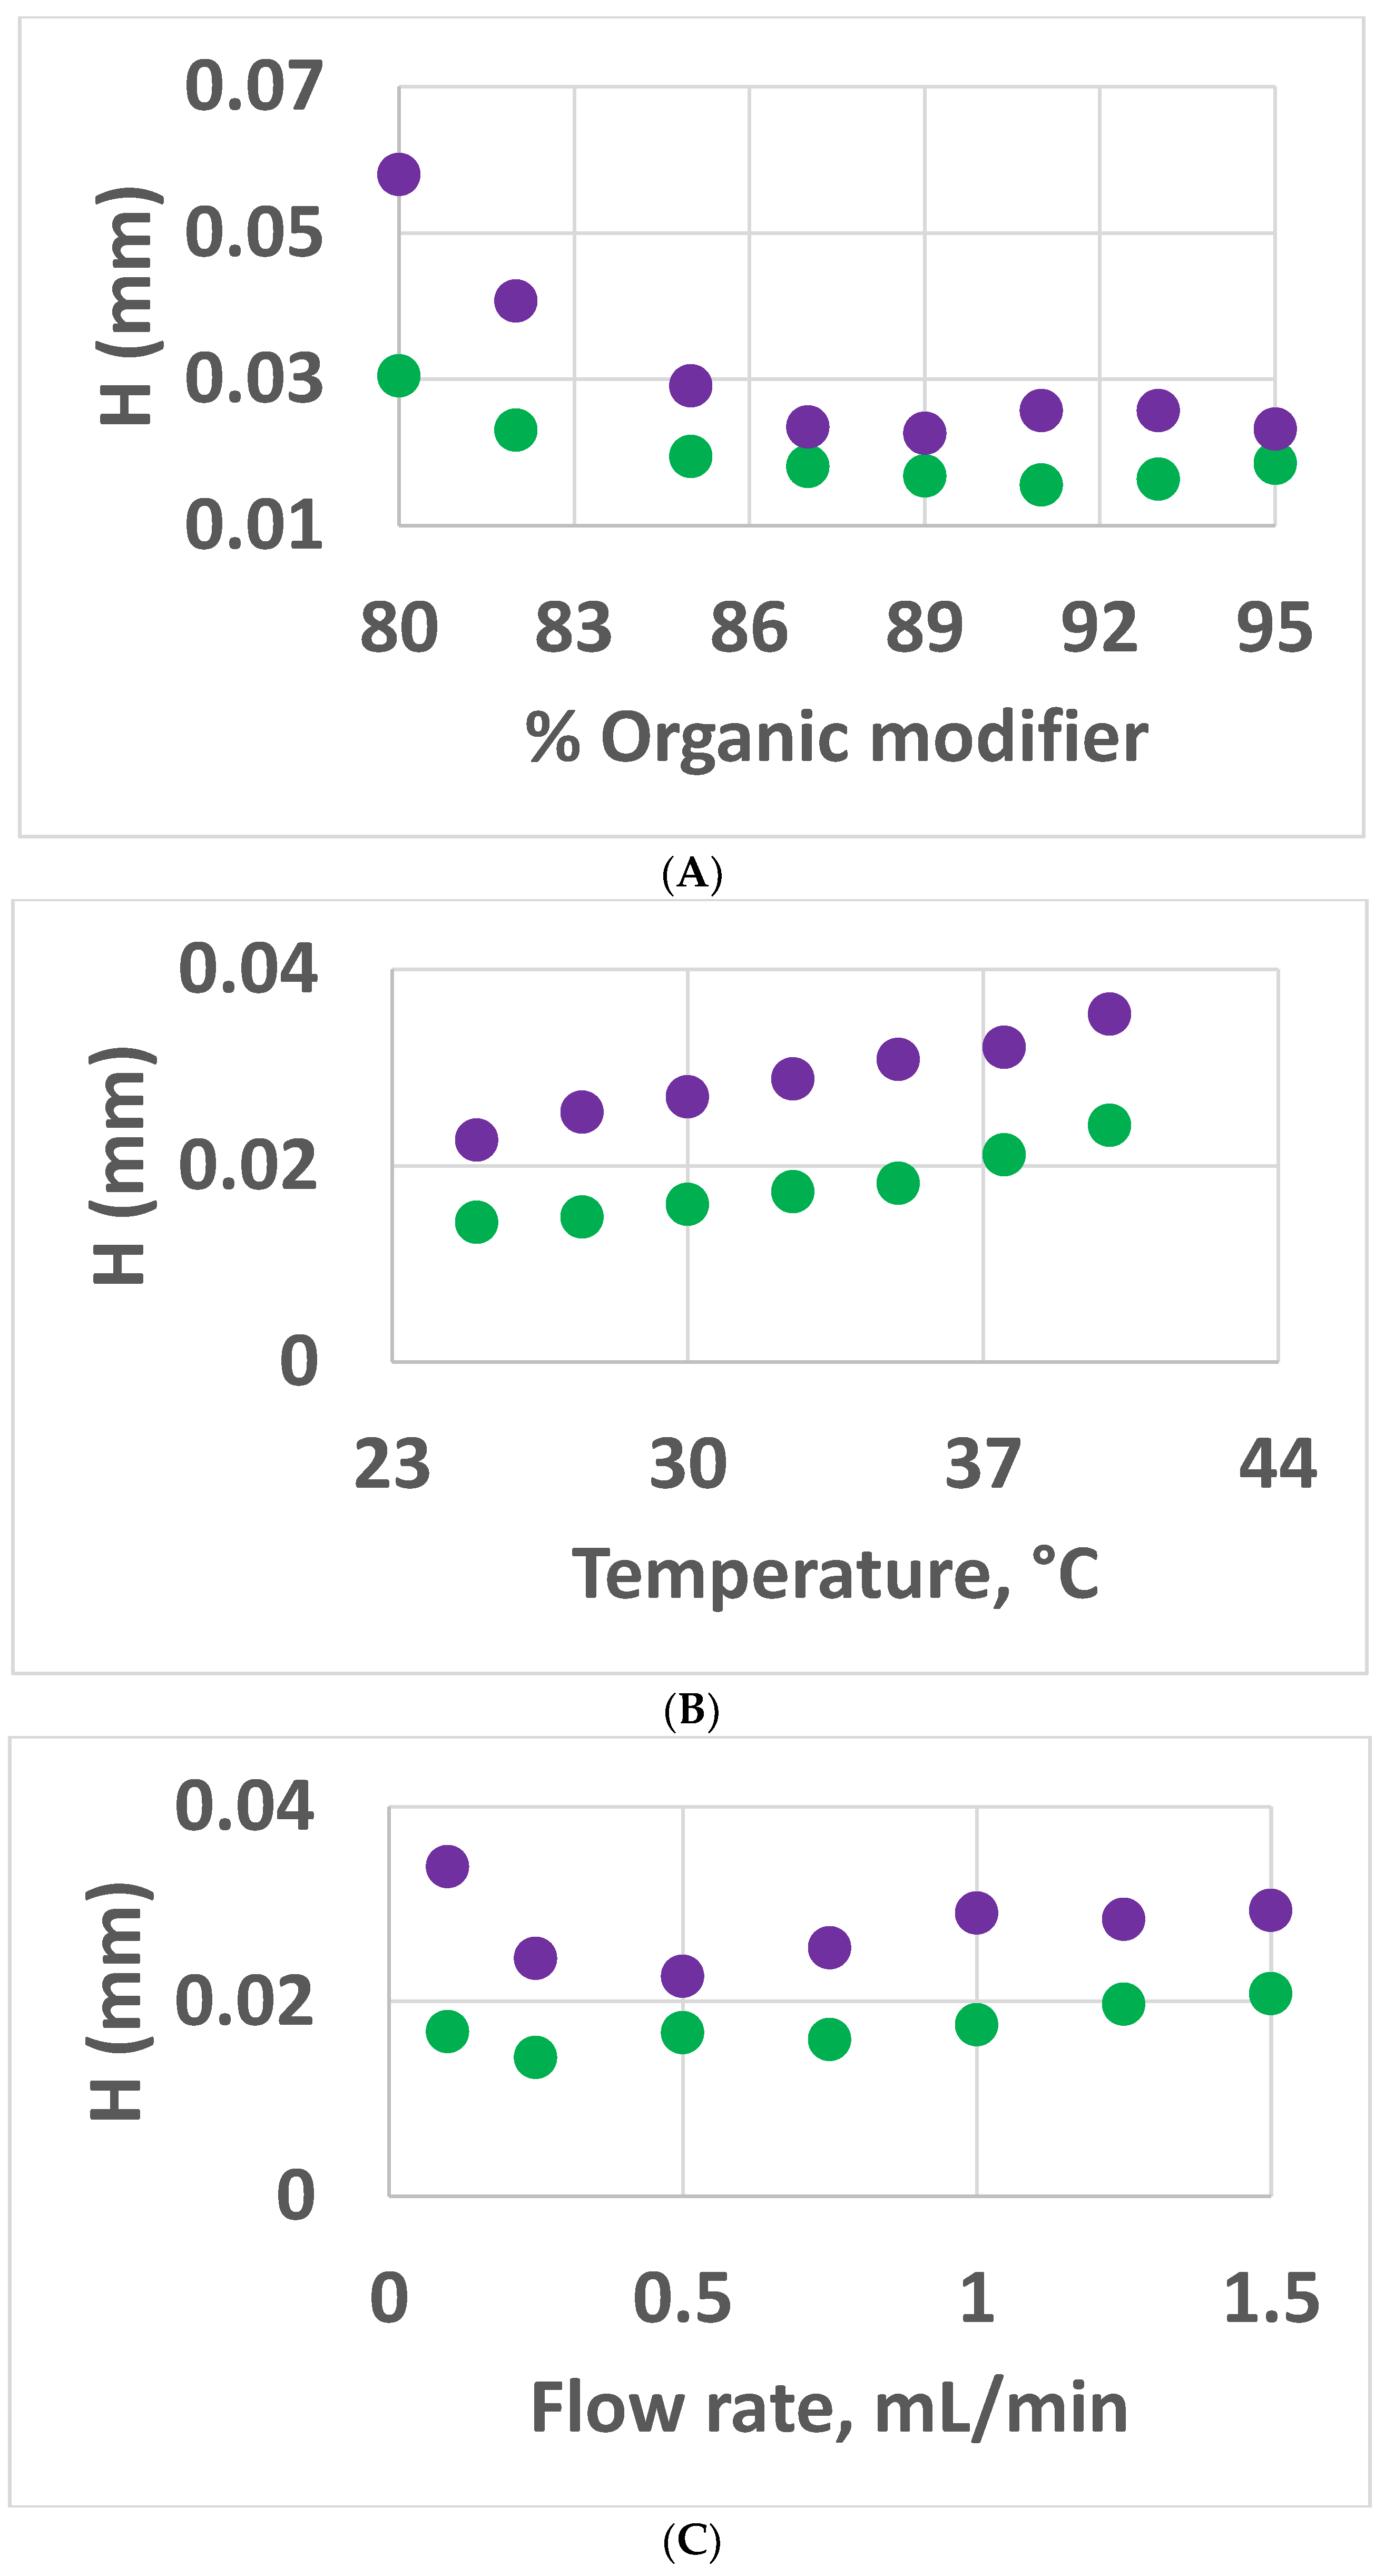
3.2.2. Van Deemter and Peak Asymmetry Comparison of DMC and MeCN

Height equivalent of theoretical plates (HETP) plots were constructed vs. temperature, flow rate, and organic mobile-phase modifier composition (Figure 6). Peak asymmetry was taken into account for the calculation of N, using the Foley–Dorsey equation. It was observed that the DMC HETP profile was slightly lower than that of MeCN over the x axis range for all the points. Percent RSD values derived from the plate count, as indicated in the figure legend, confirmed that the separation difference for the point profiles was real. The difference in HETP between DMC and MeCN was greater at low flow rates. This was expected because the B term of the van Deemter equation, which is dependent on the diffusion coefficient of the analyte in the mobile phase (Dm), is dominant. The higher viscosity of DMC corresponded to a lower Dm value, as compared to the lower viscosity and higher Dm for MeCN. The HETP points for MeCN and DMC became closer together at higher low rates because the stationary phase mass transfer term became significant. Previously, seven different HILIC columns were compared for the separation of six nucleosides, with the zwitterionic column showing the best performance [38]. It was thought that the HETP profile trends of DMC and MeCN might switch in magnitude with a zwitterionic HILIC column, but this was found to not be the case (Figure S10). Peak symmetry was generally slightly better for this syringic acid test compound when using a DMC mobile phase rather than a MeCN mobile phase on either a silica or zwitterionic column (Figure S11). Peak asymmetry for both DMC and MeCN converged at faster flow rates. Less peak broadening, along with longer peak retention, was considered the likely reason for lower HETP profiles for DMC.

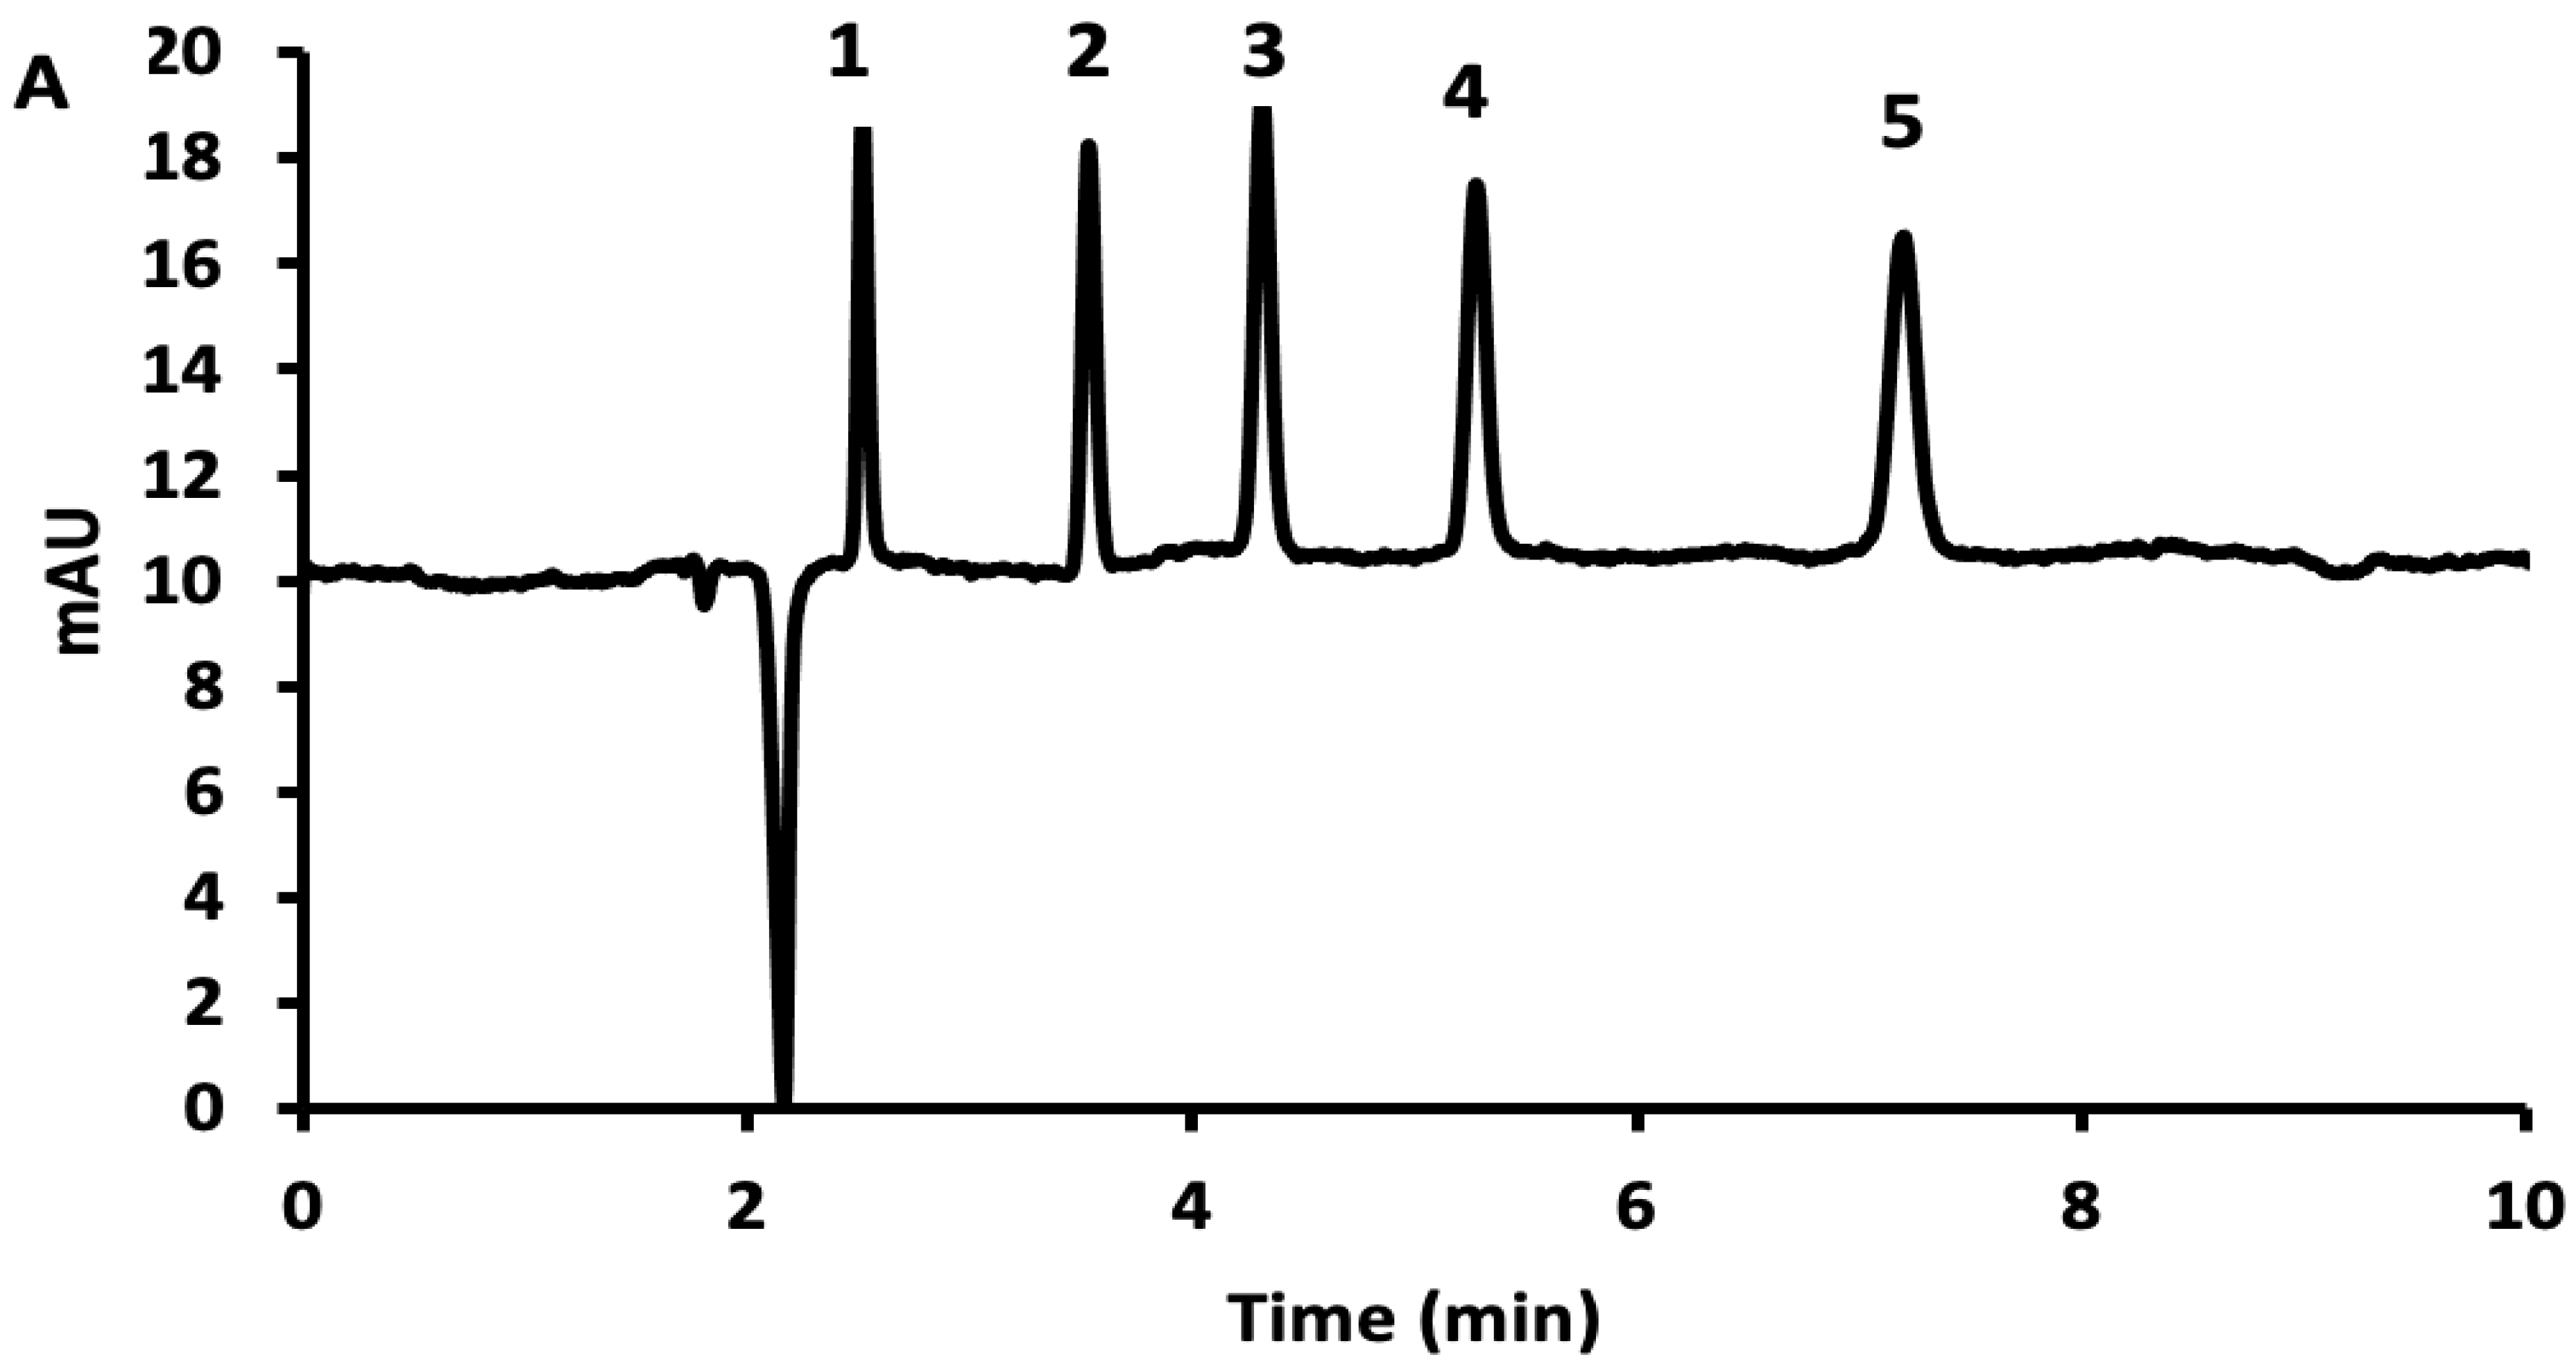
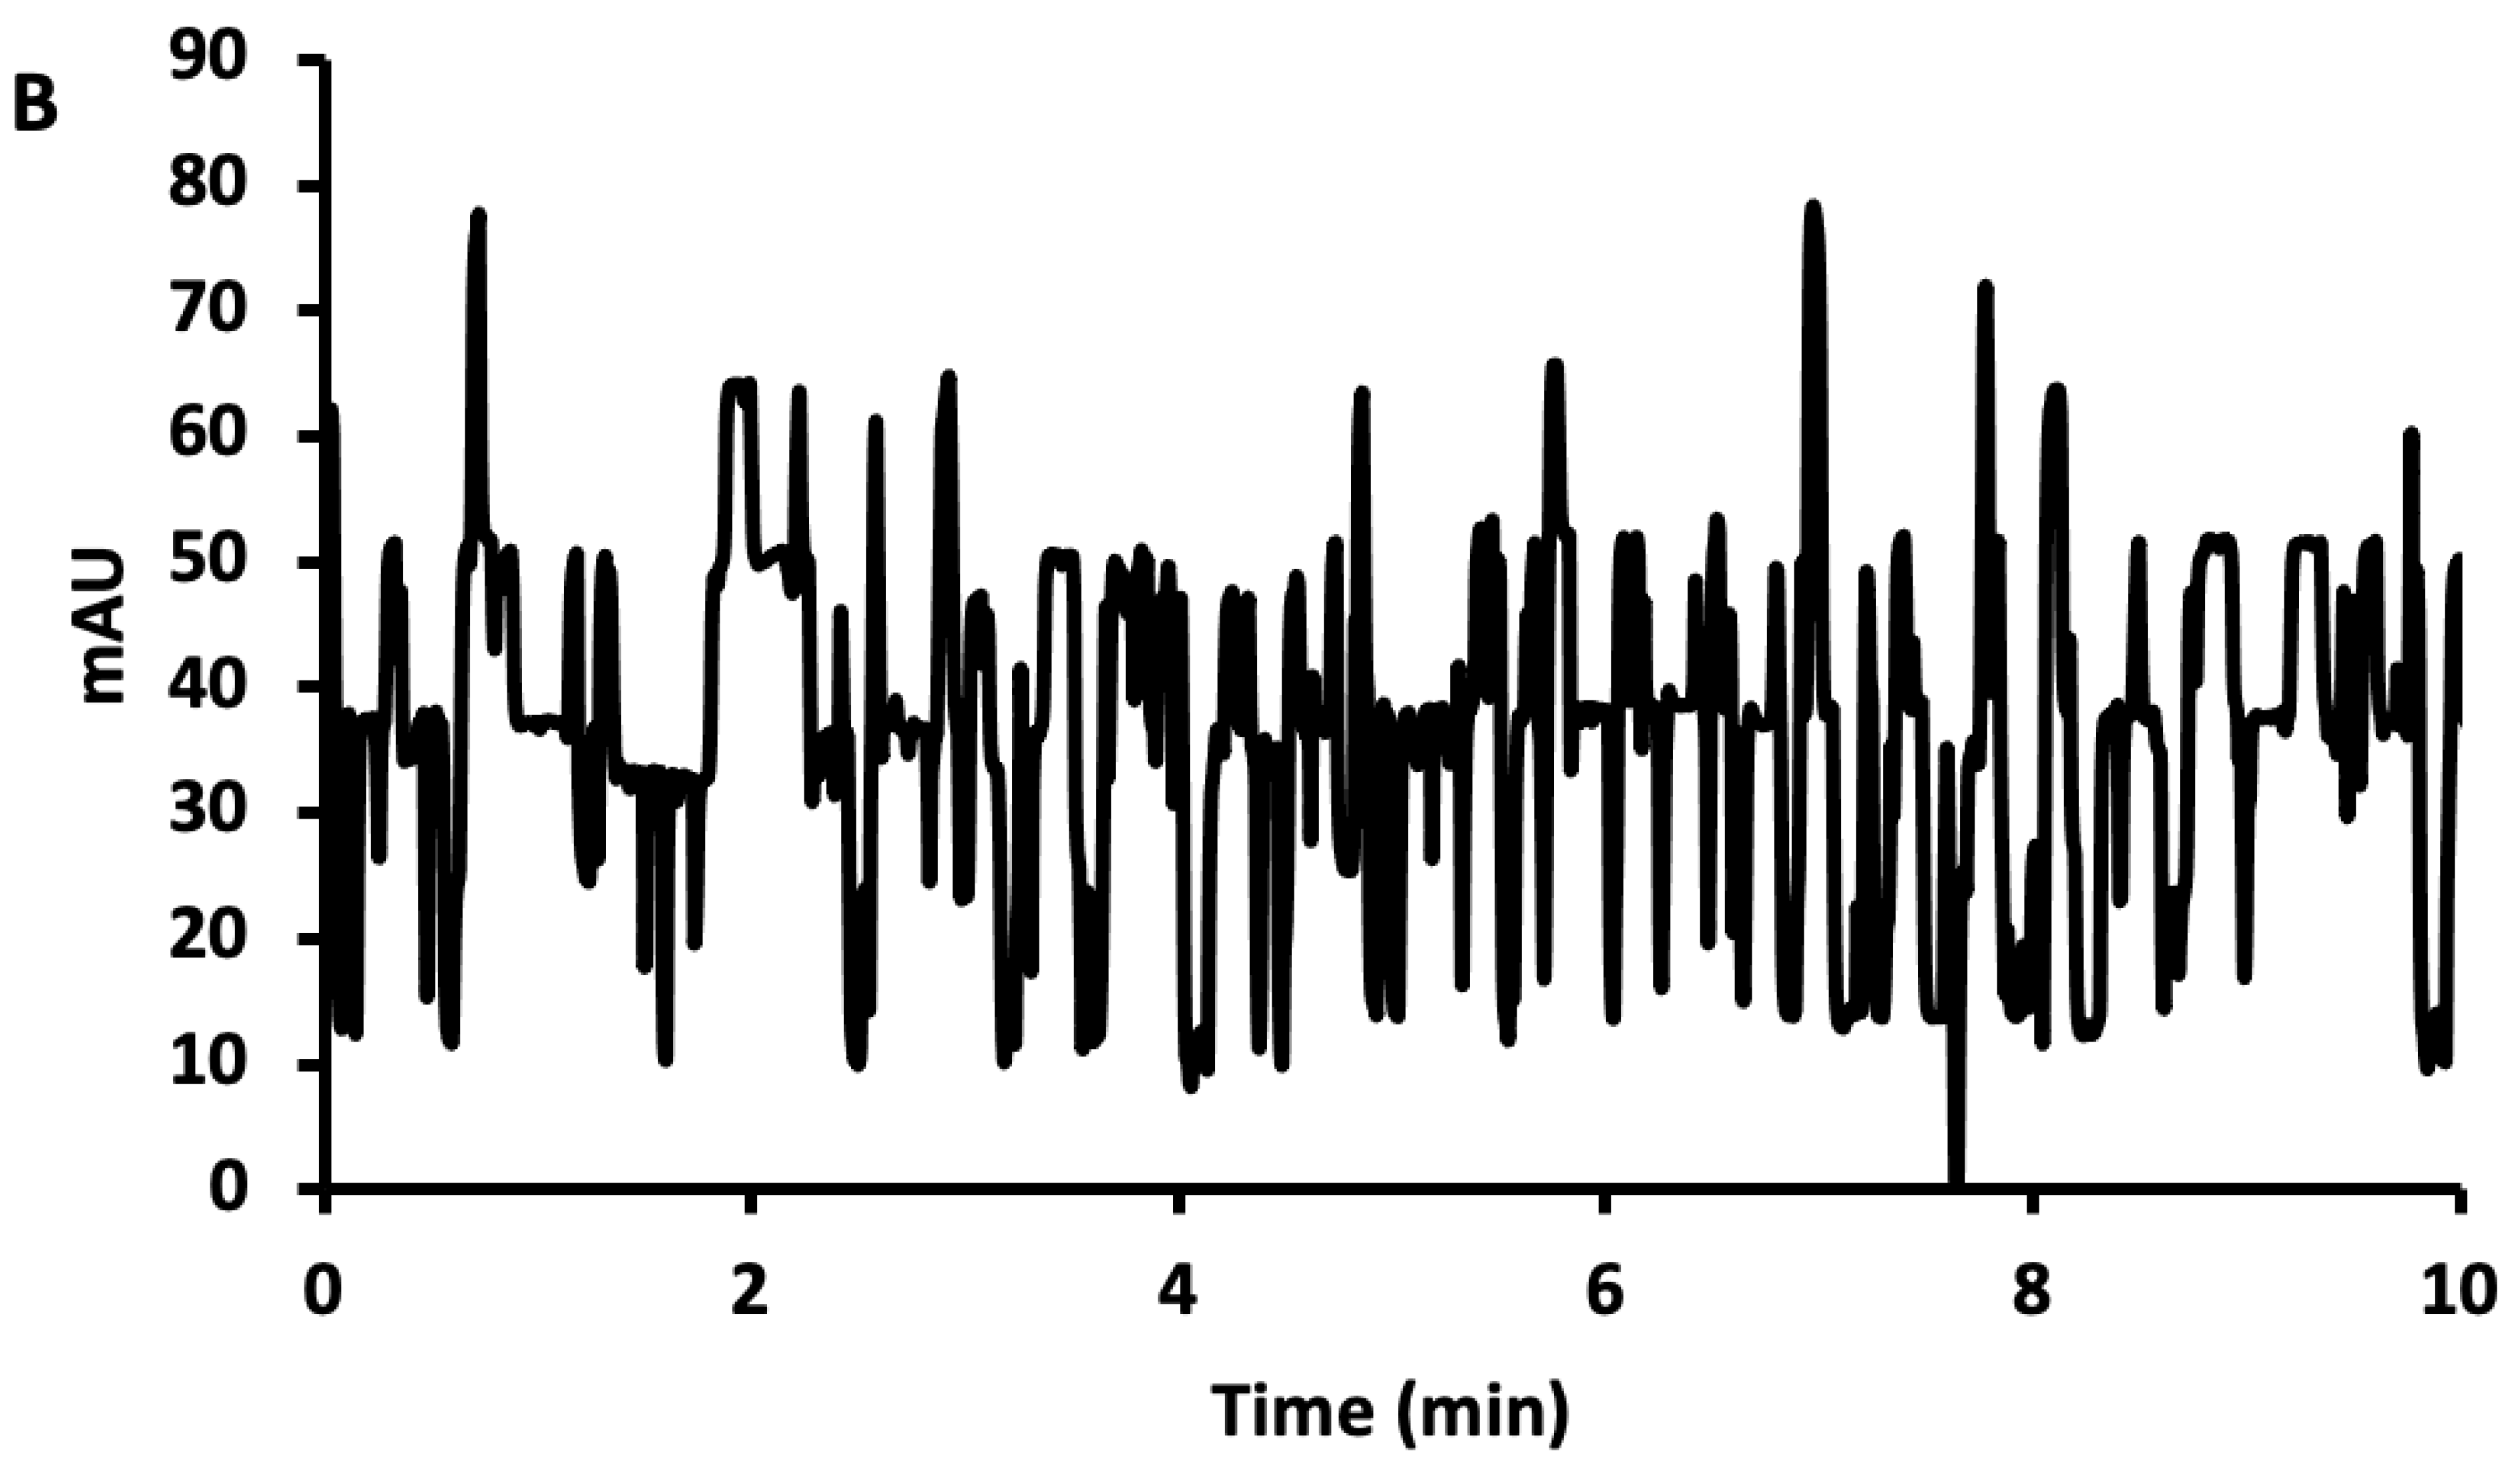
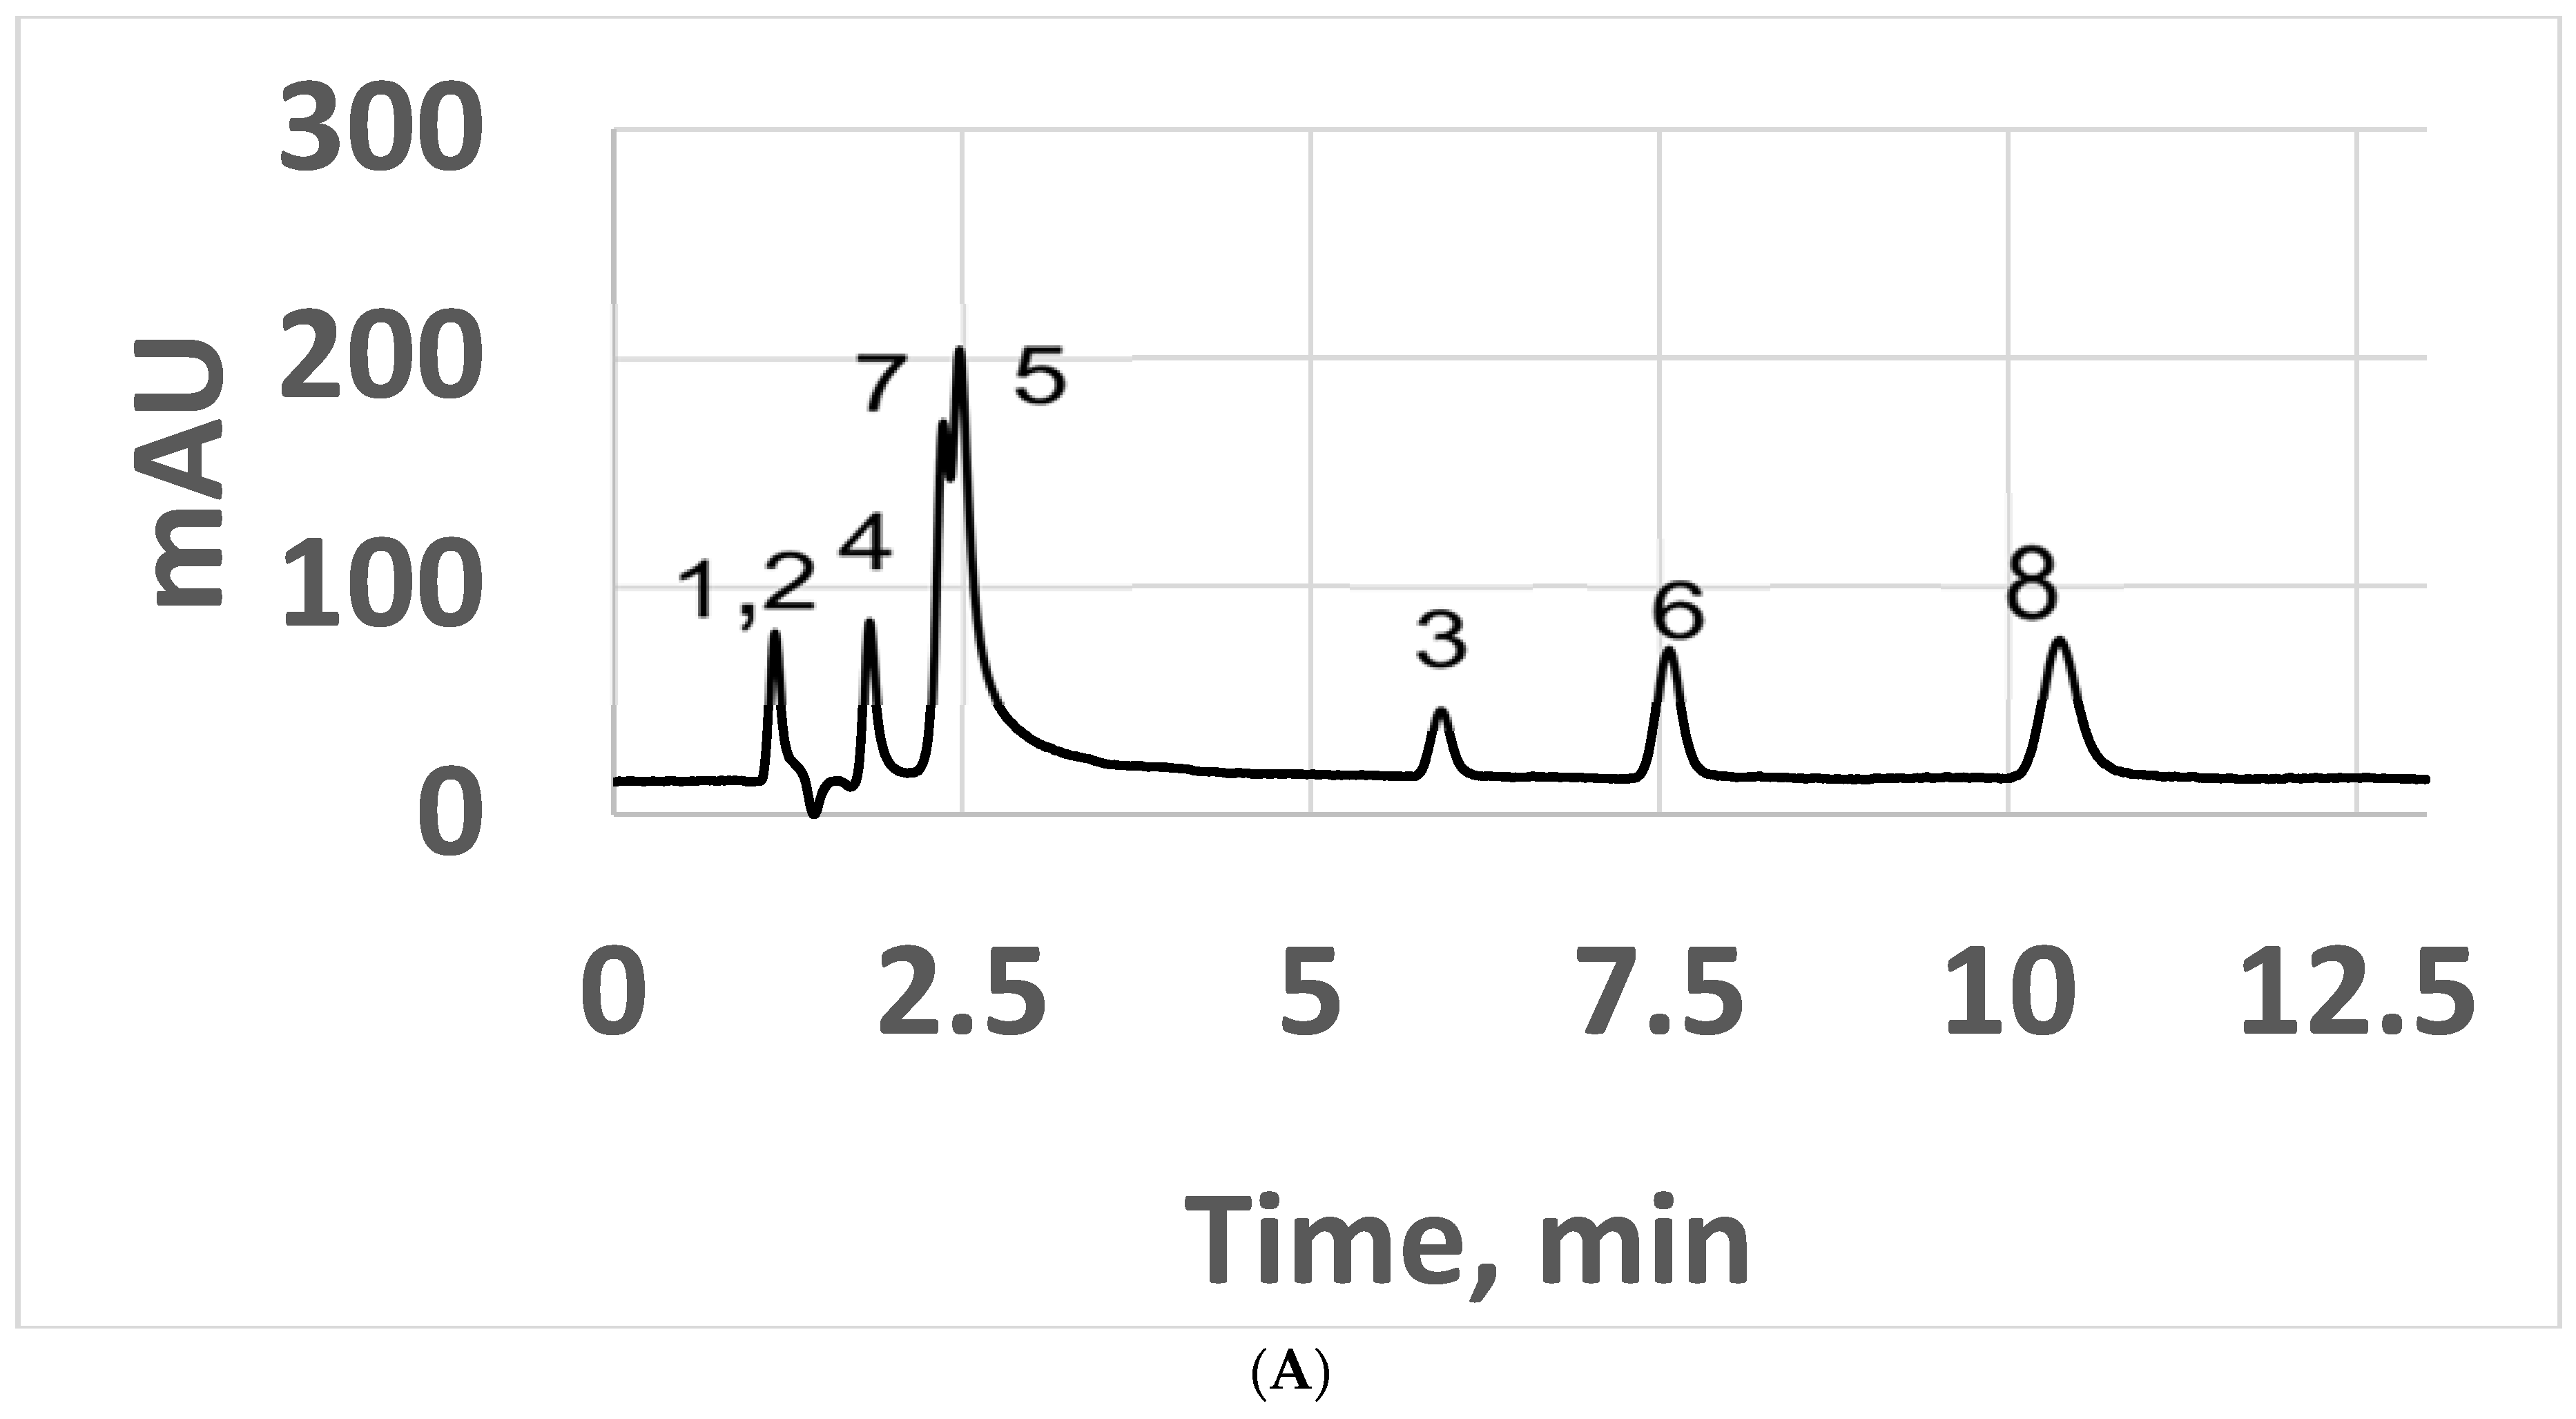
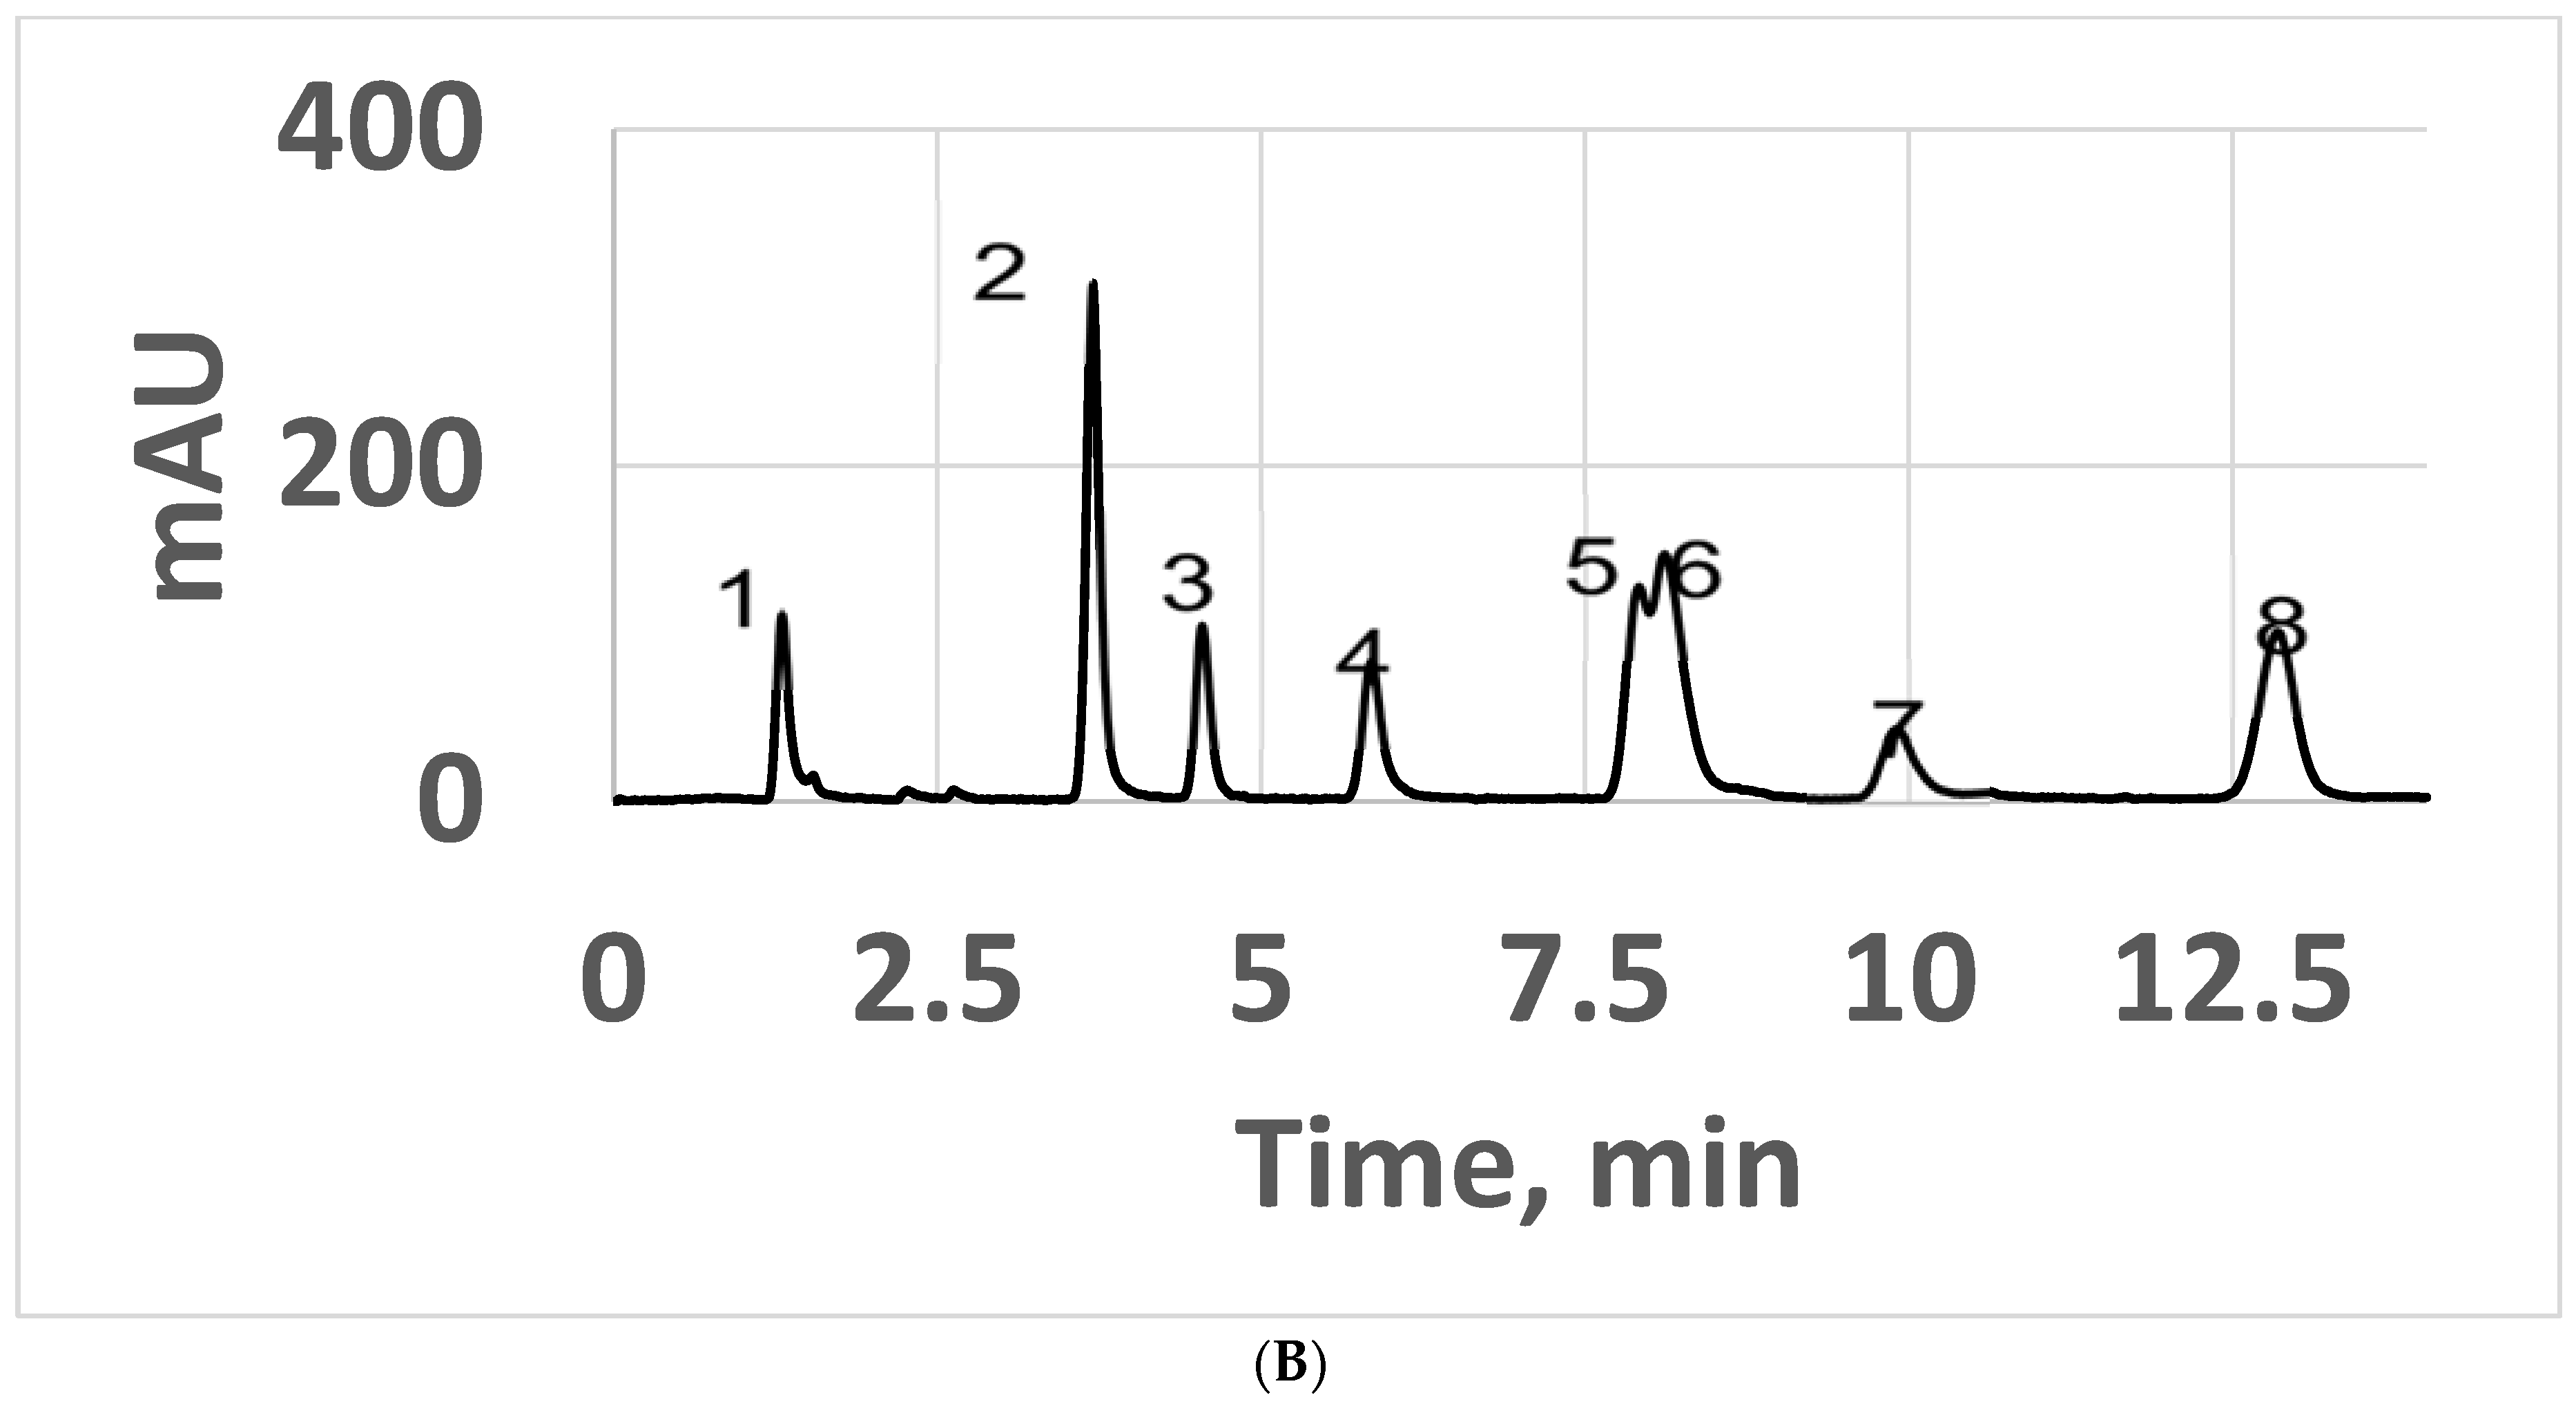
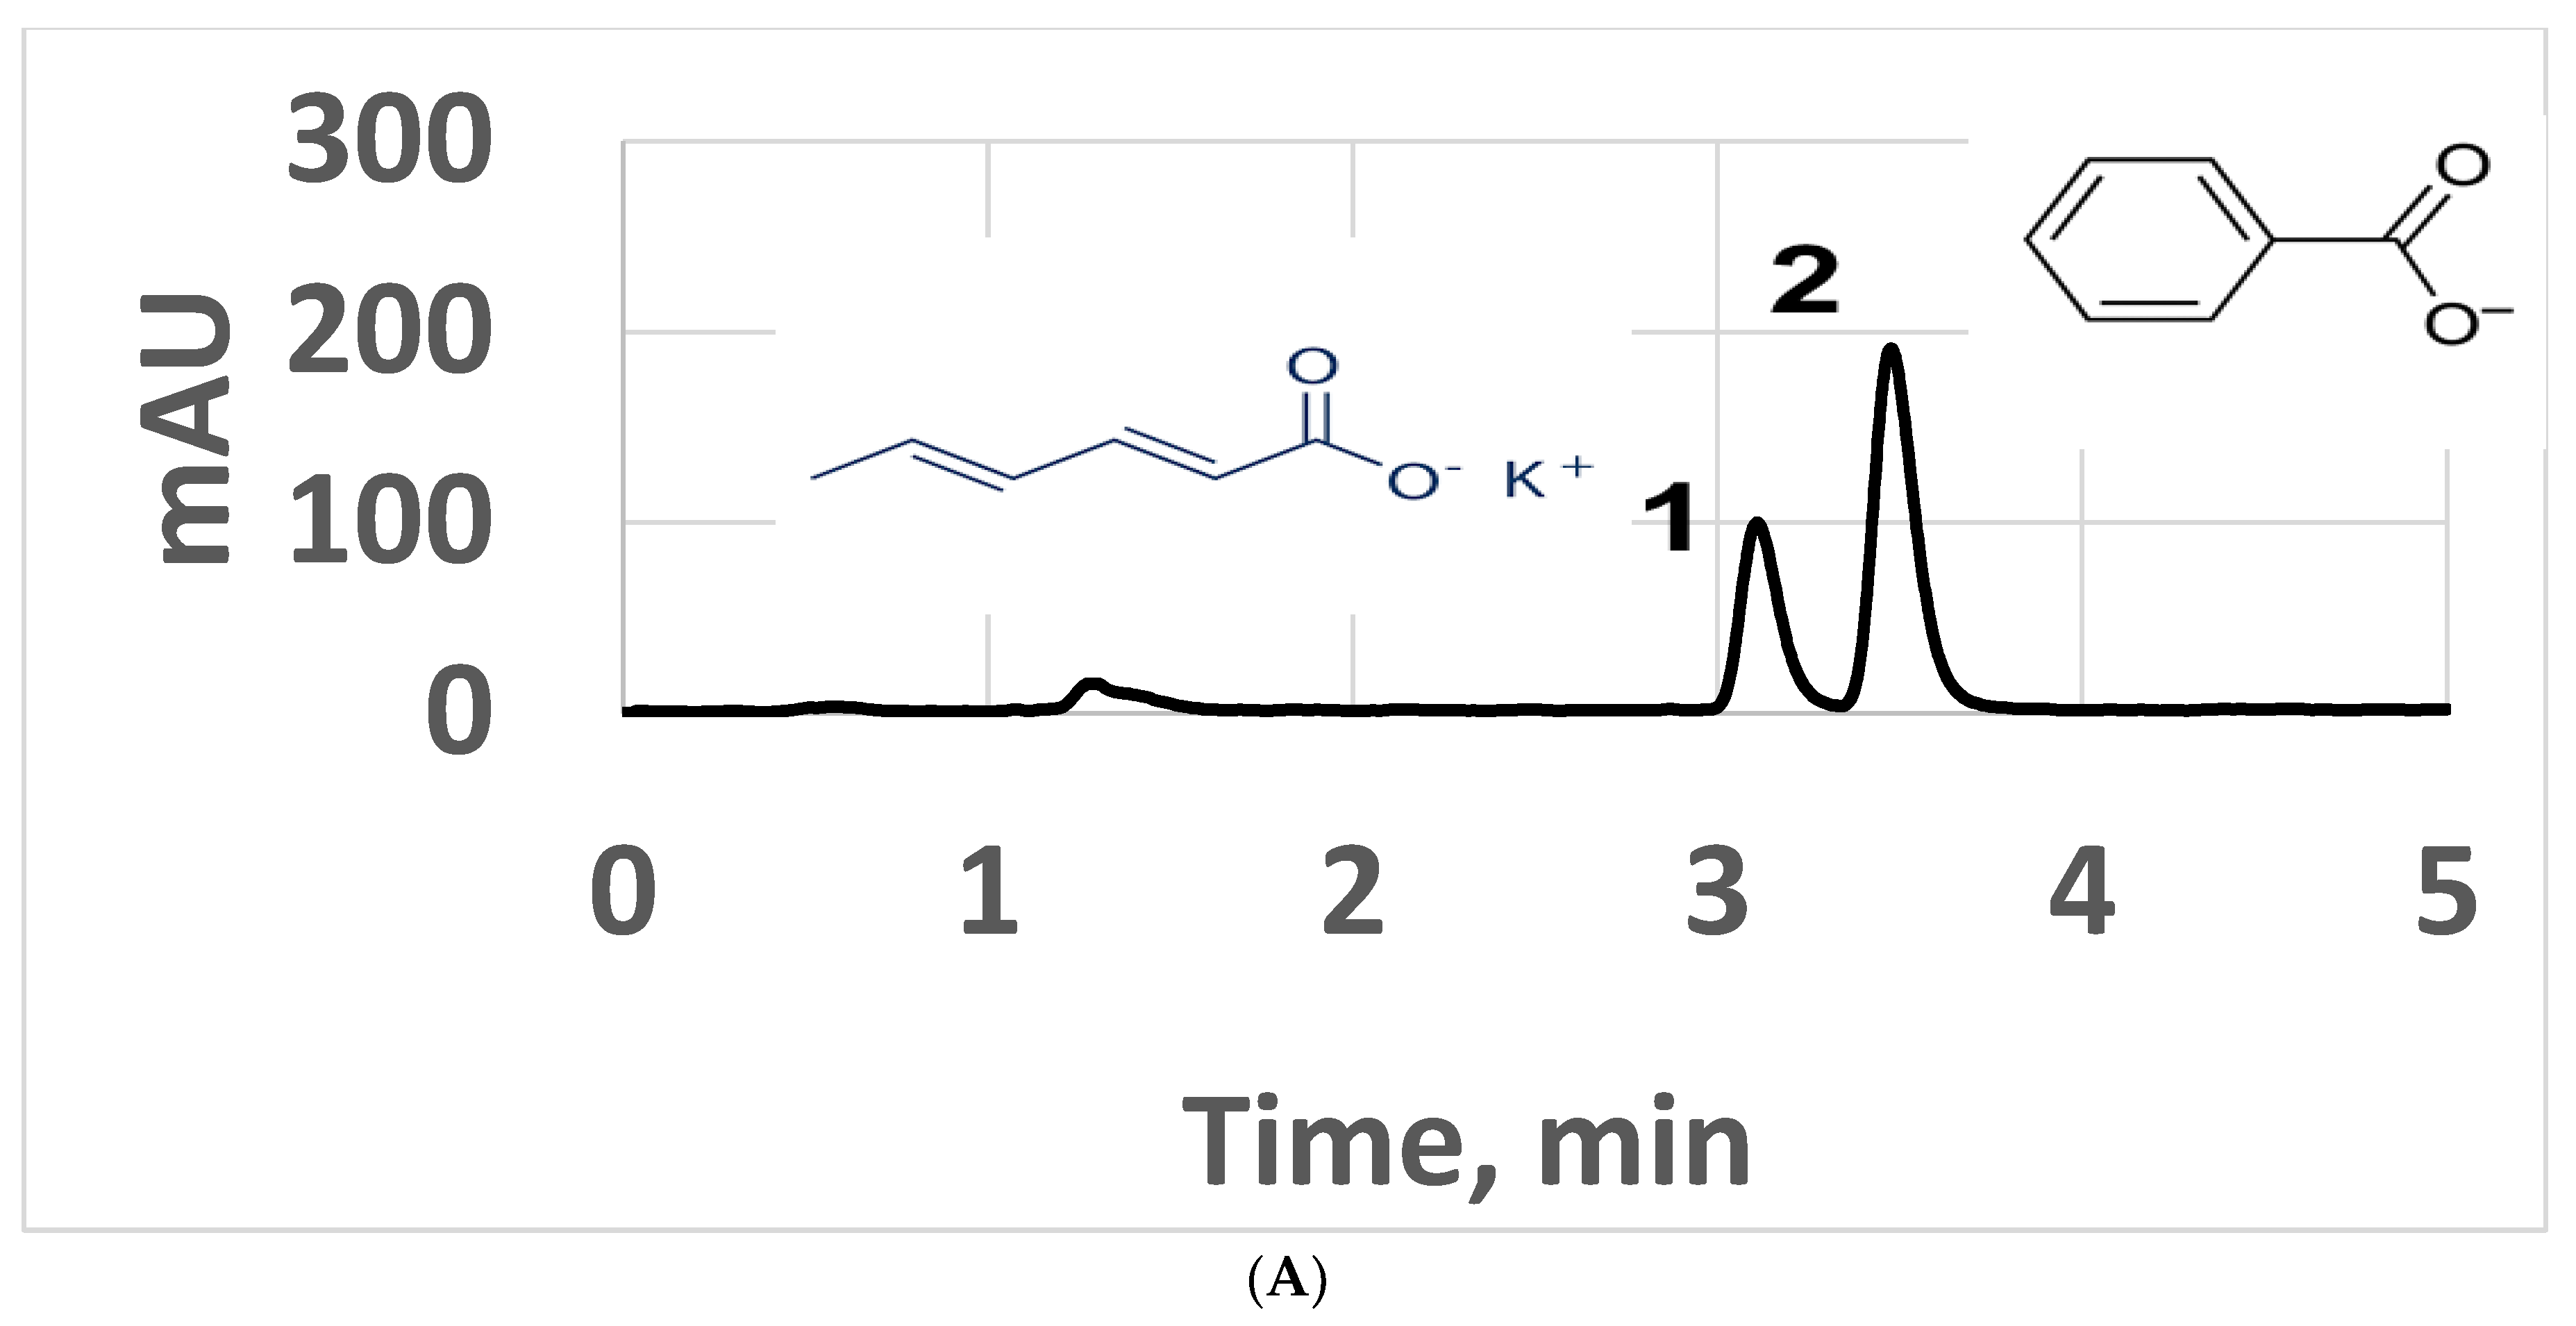
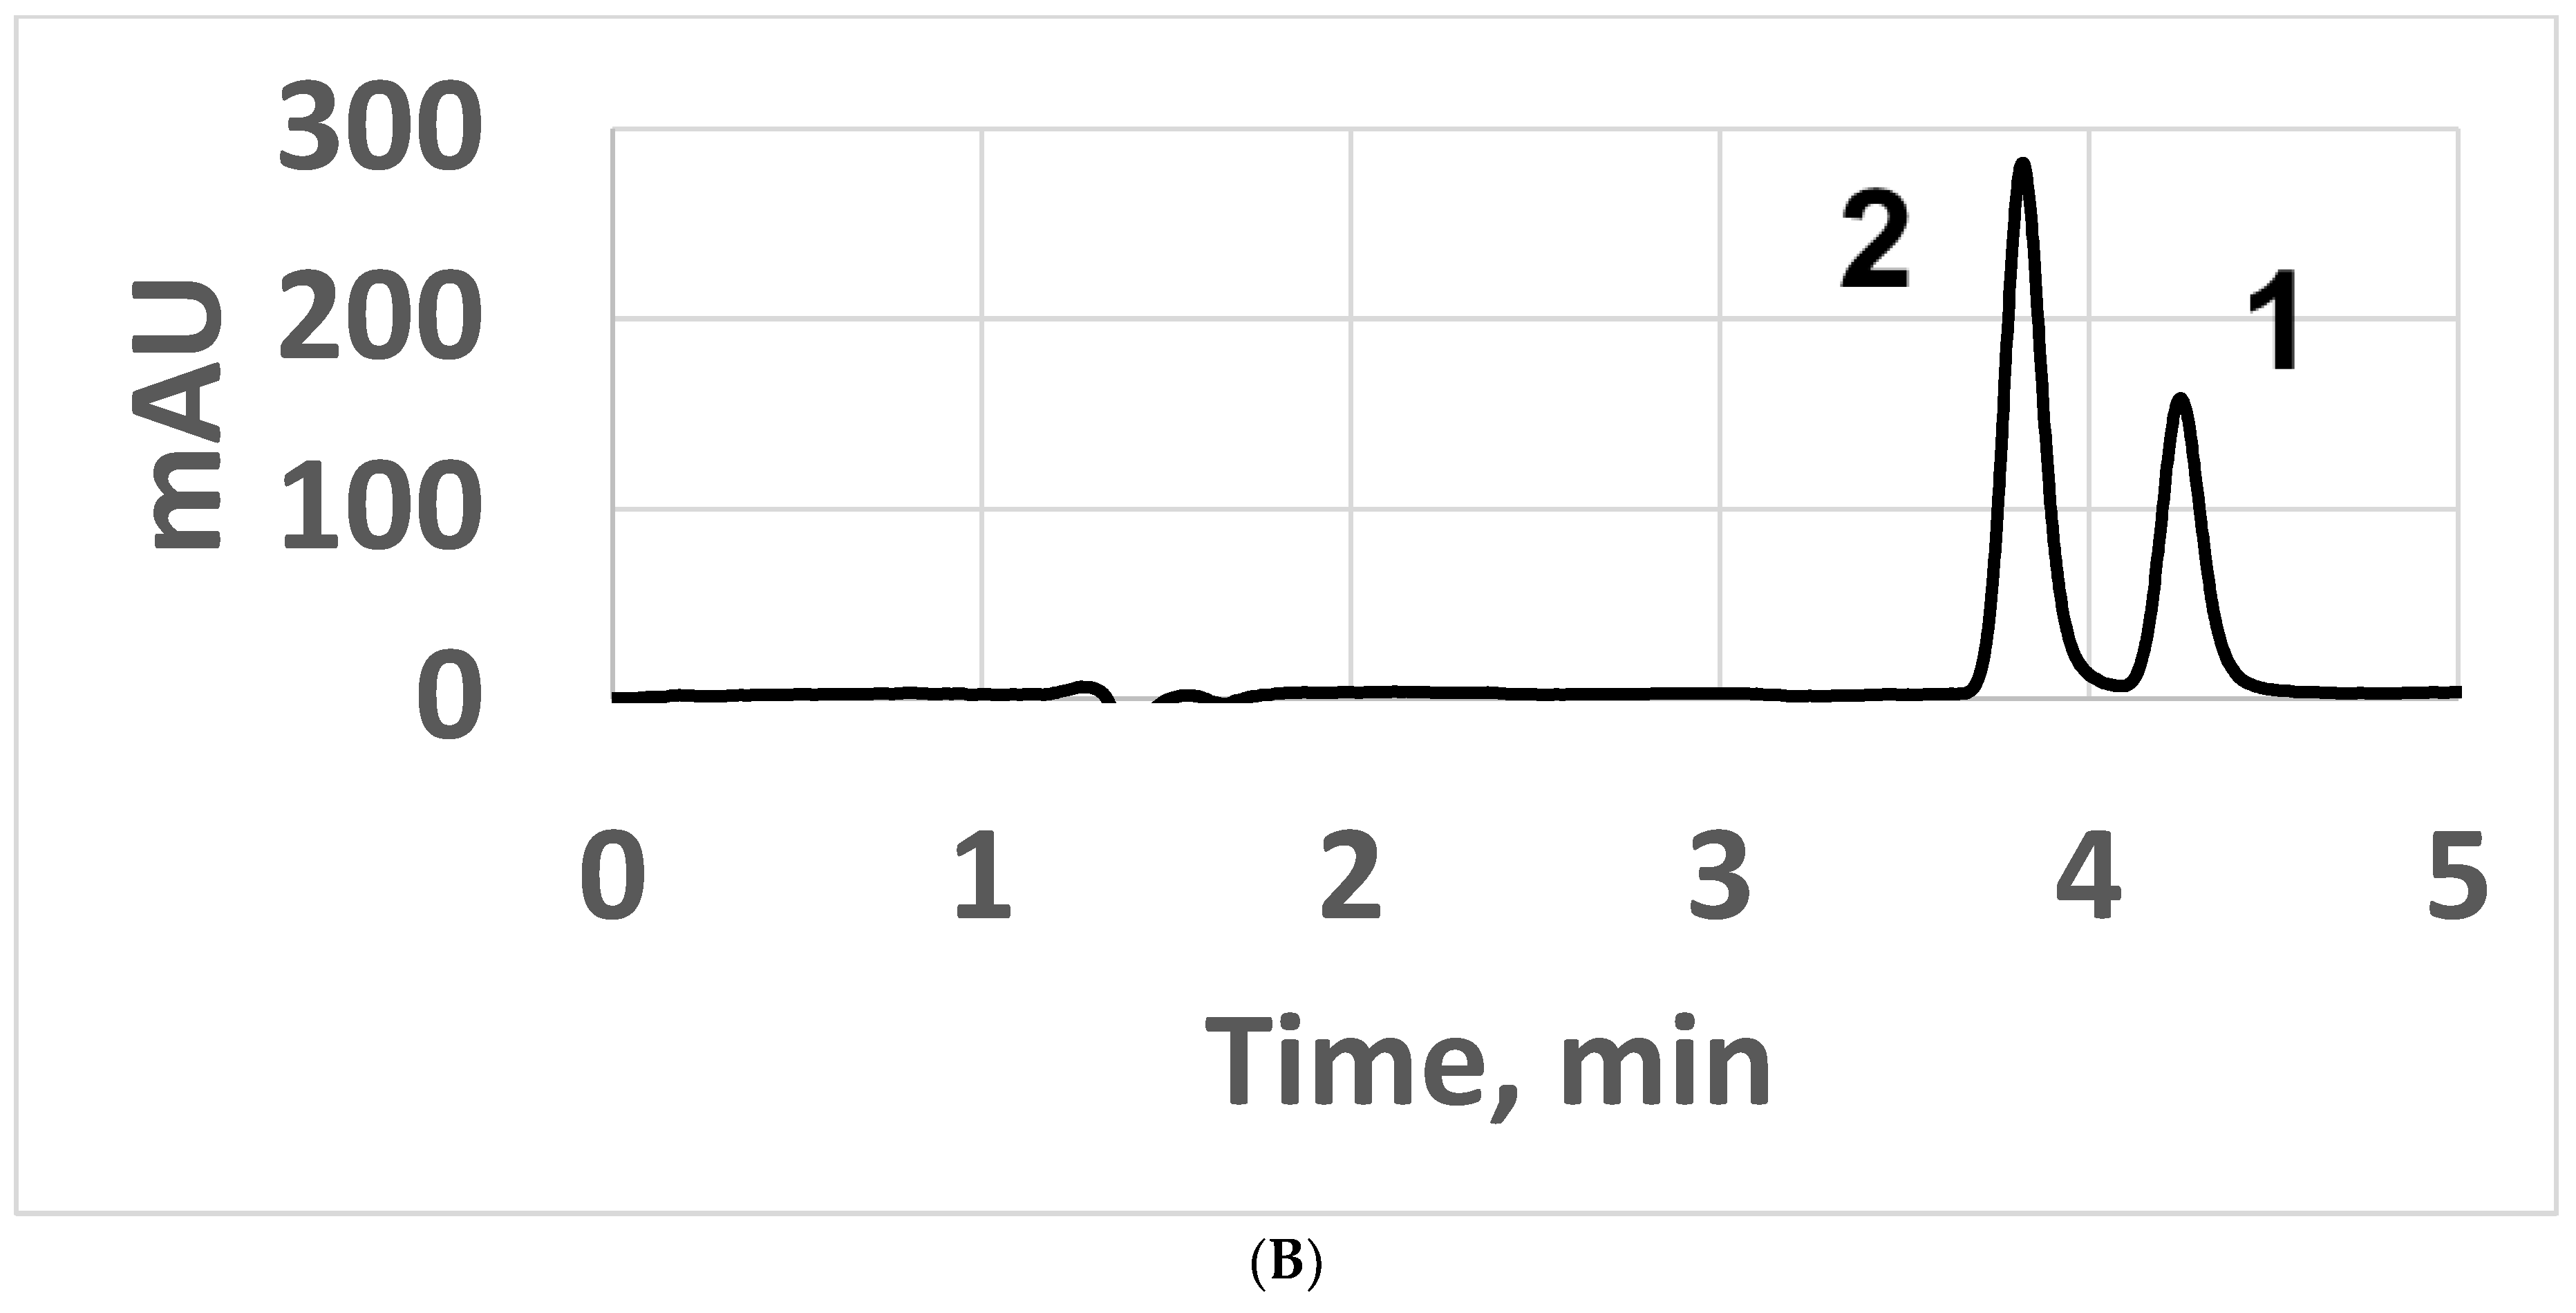
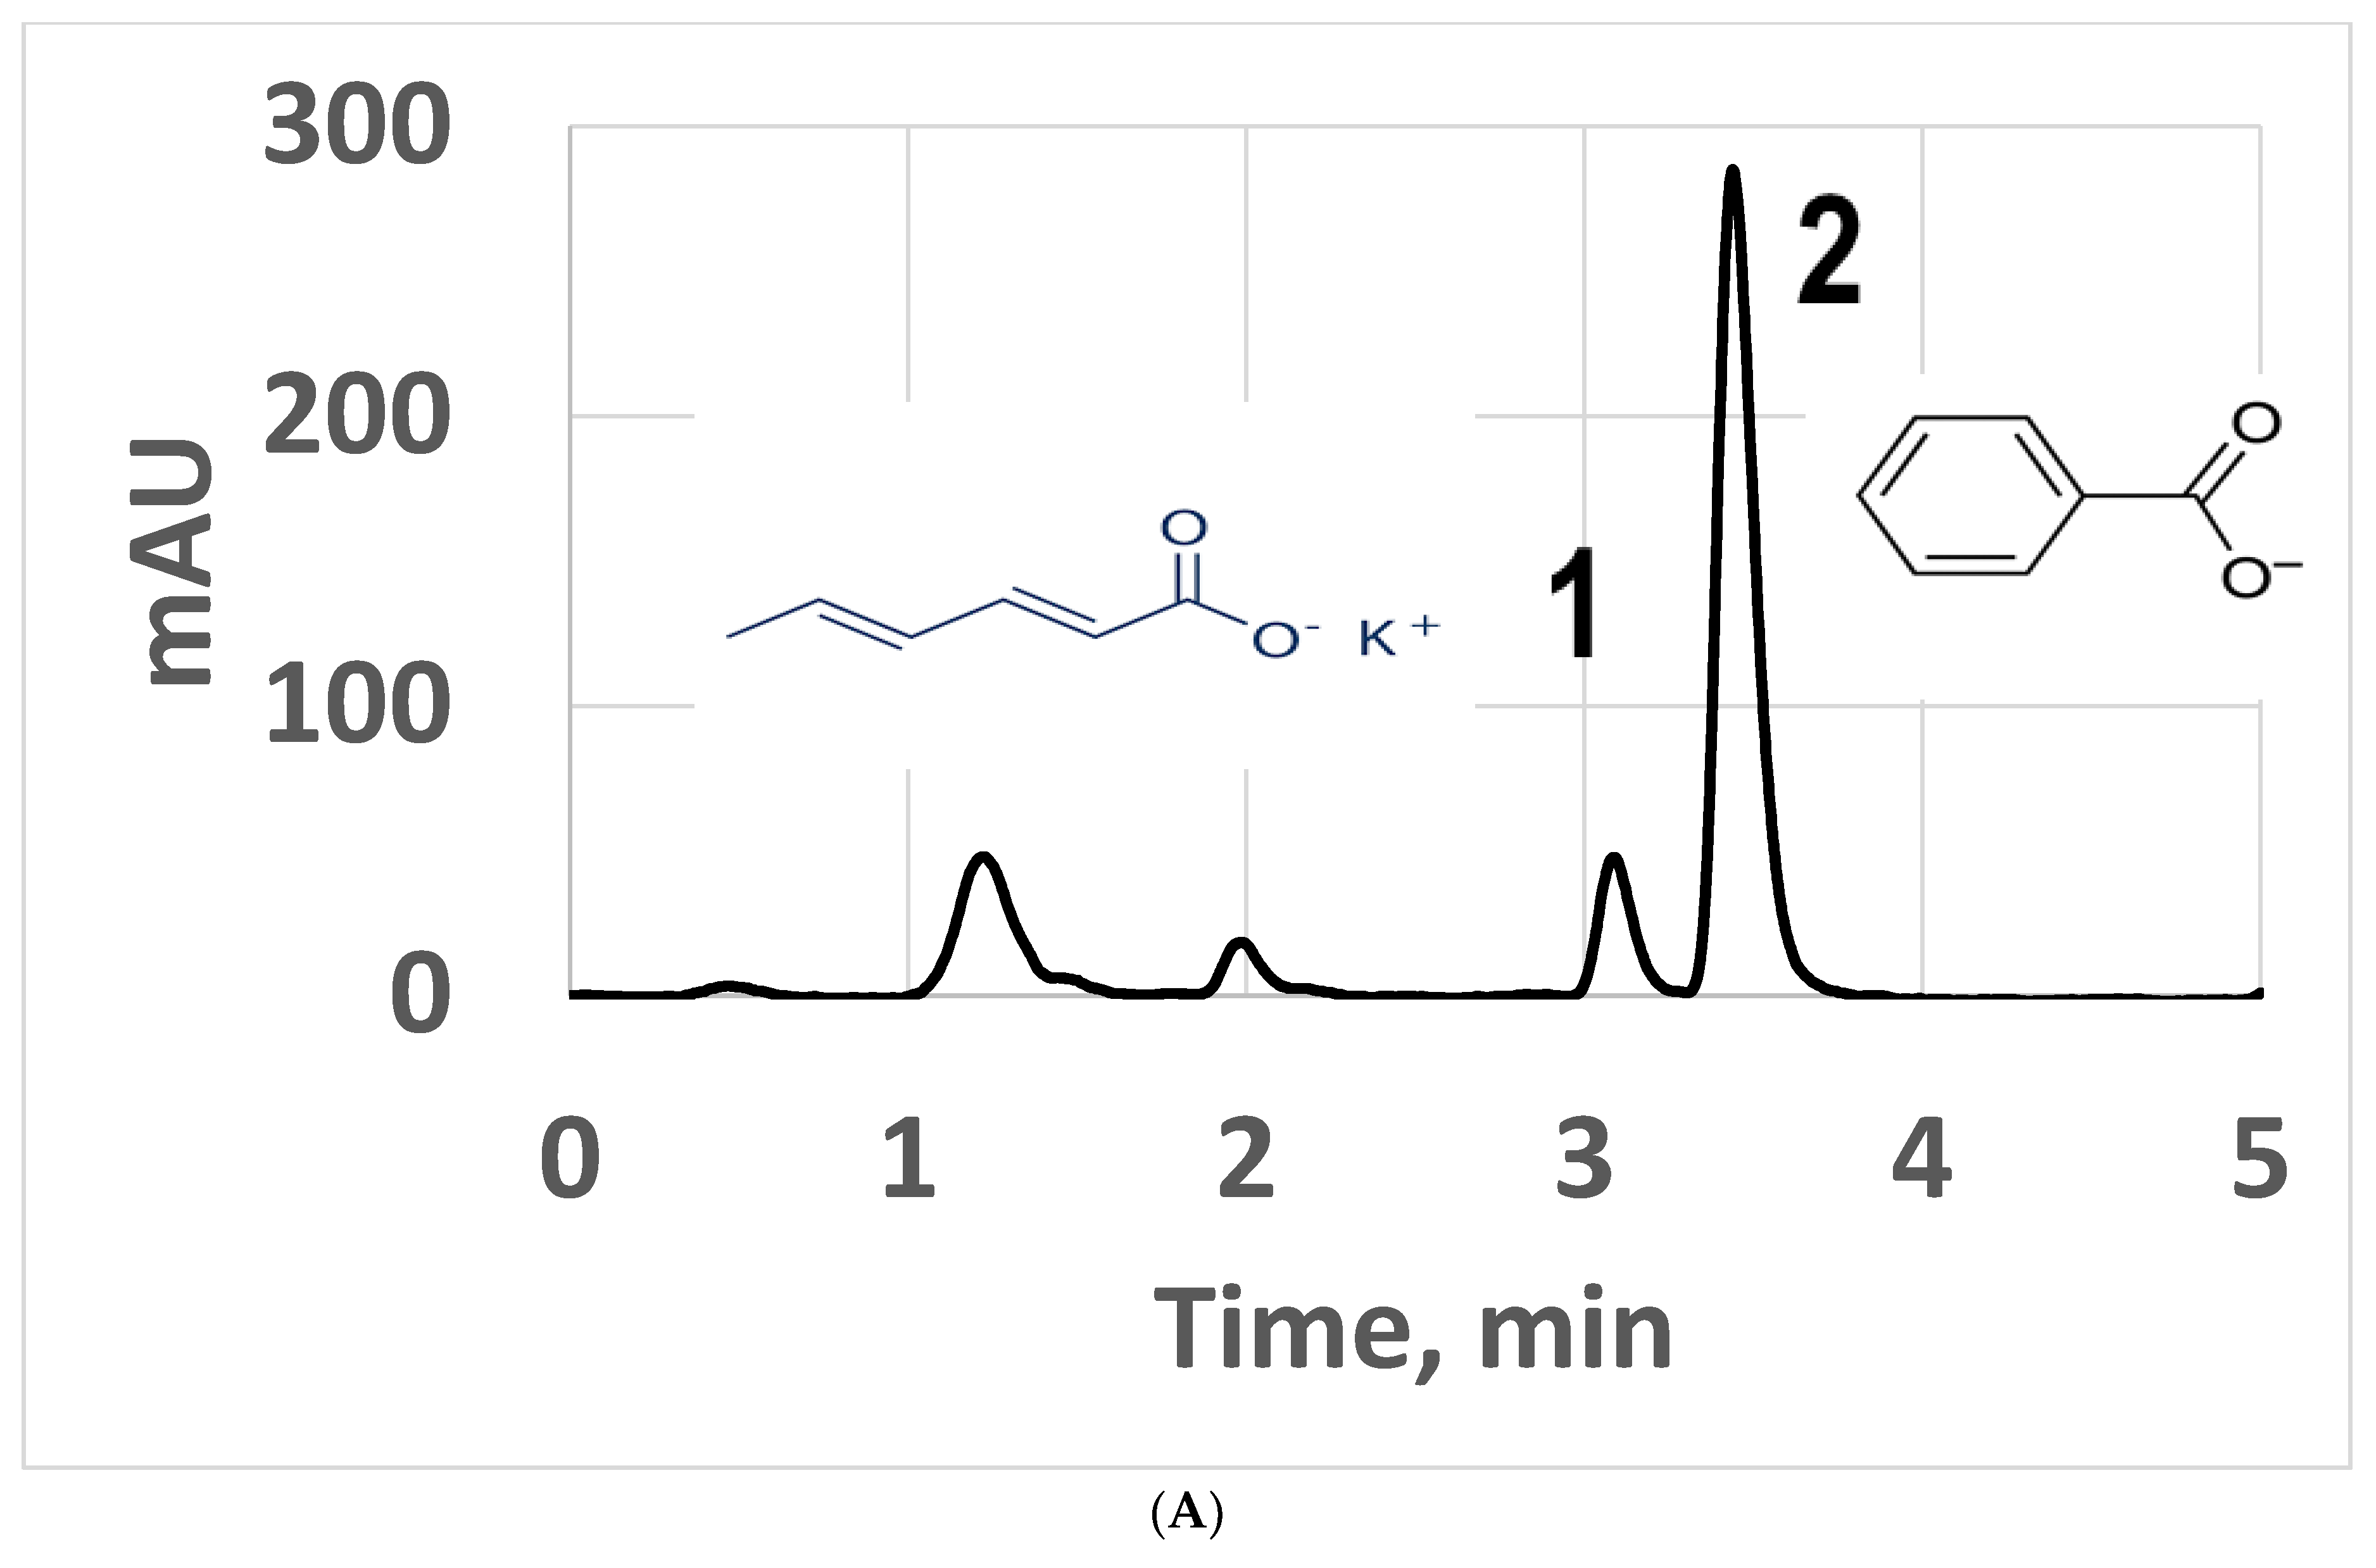
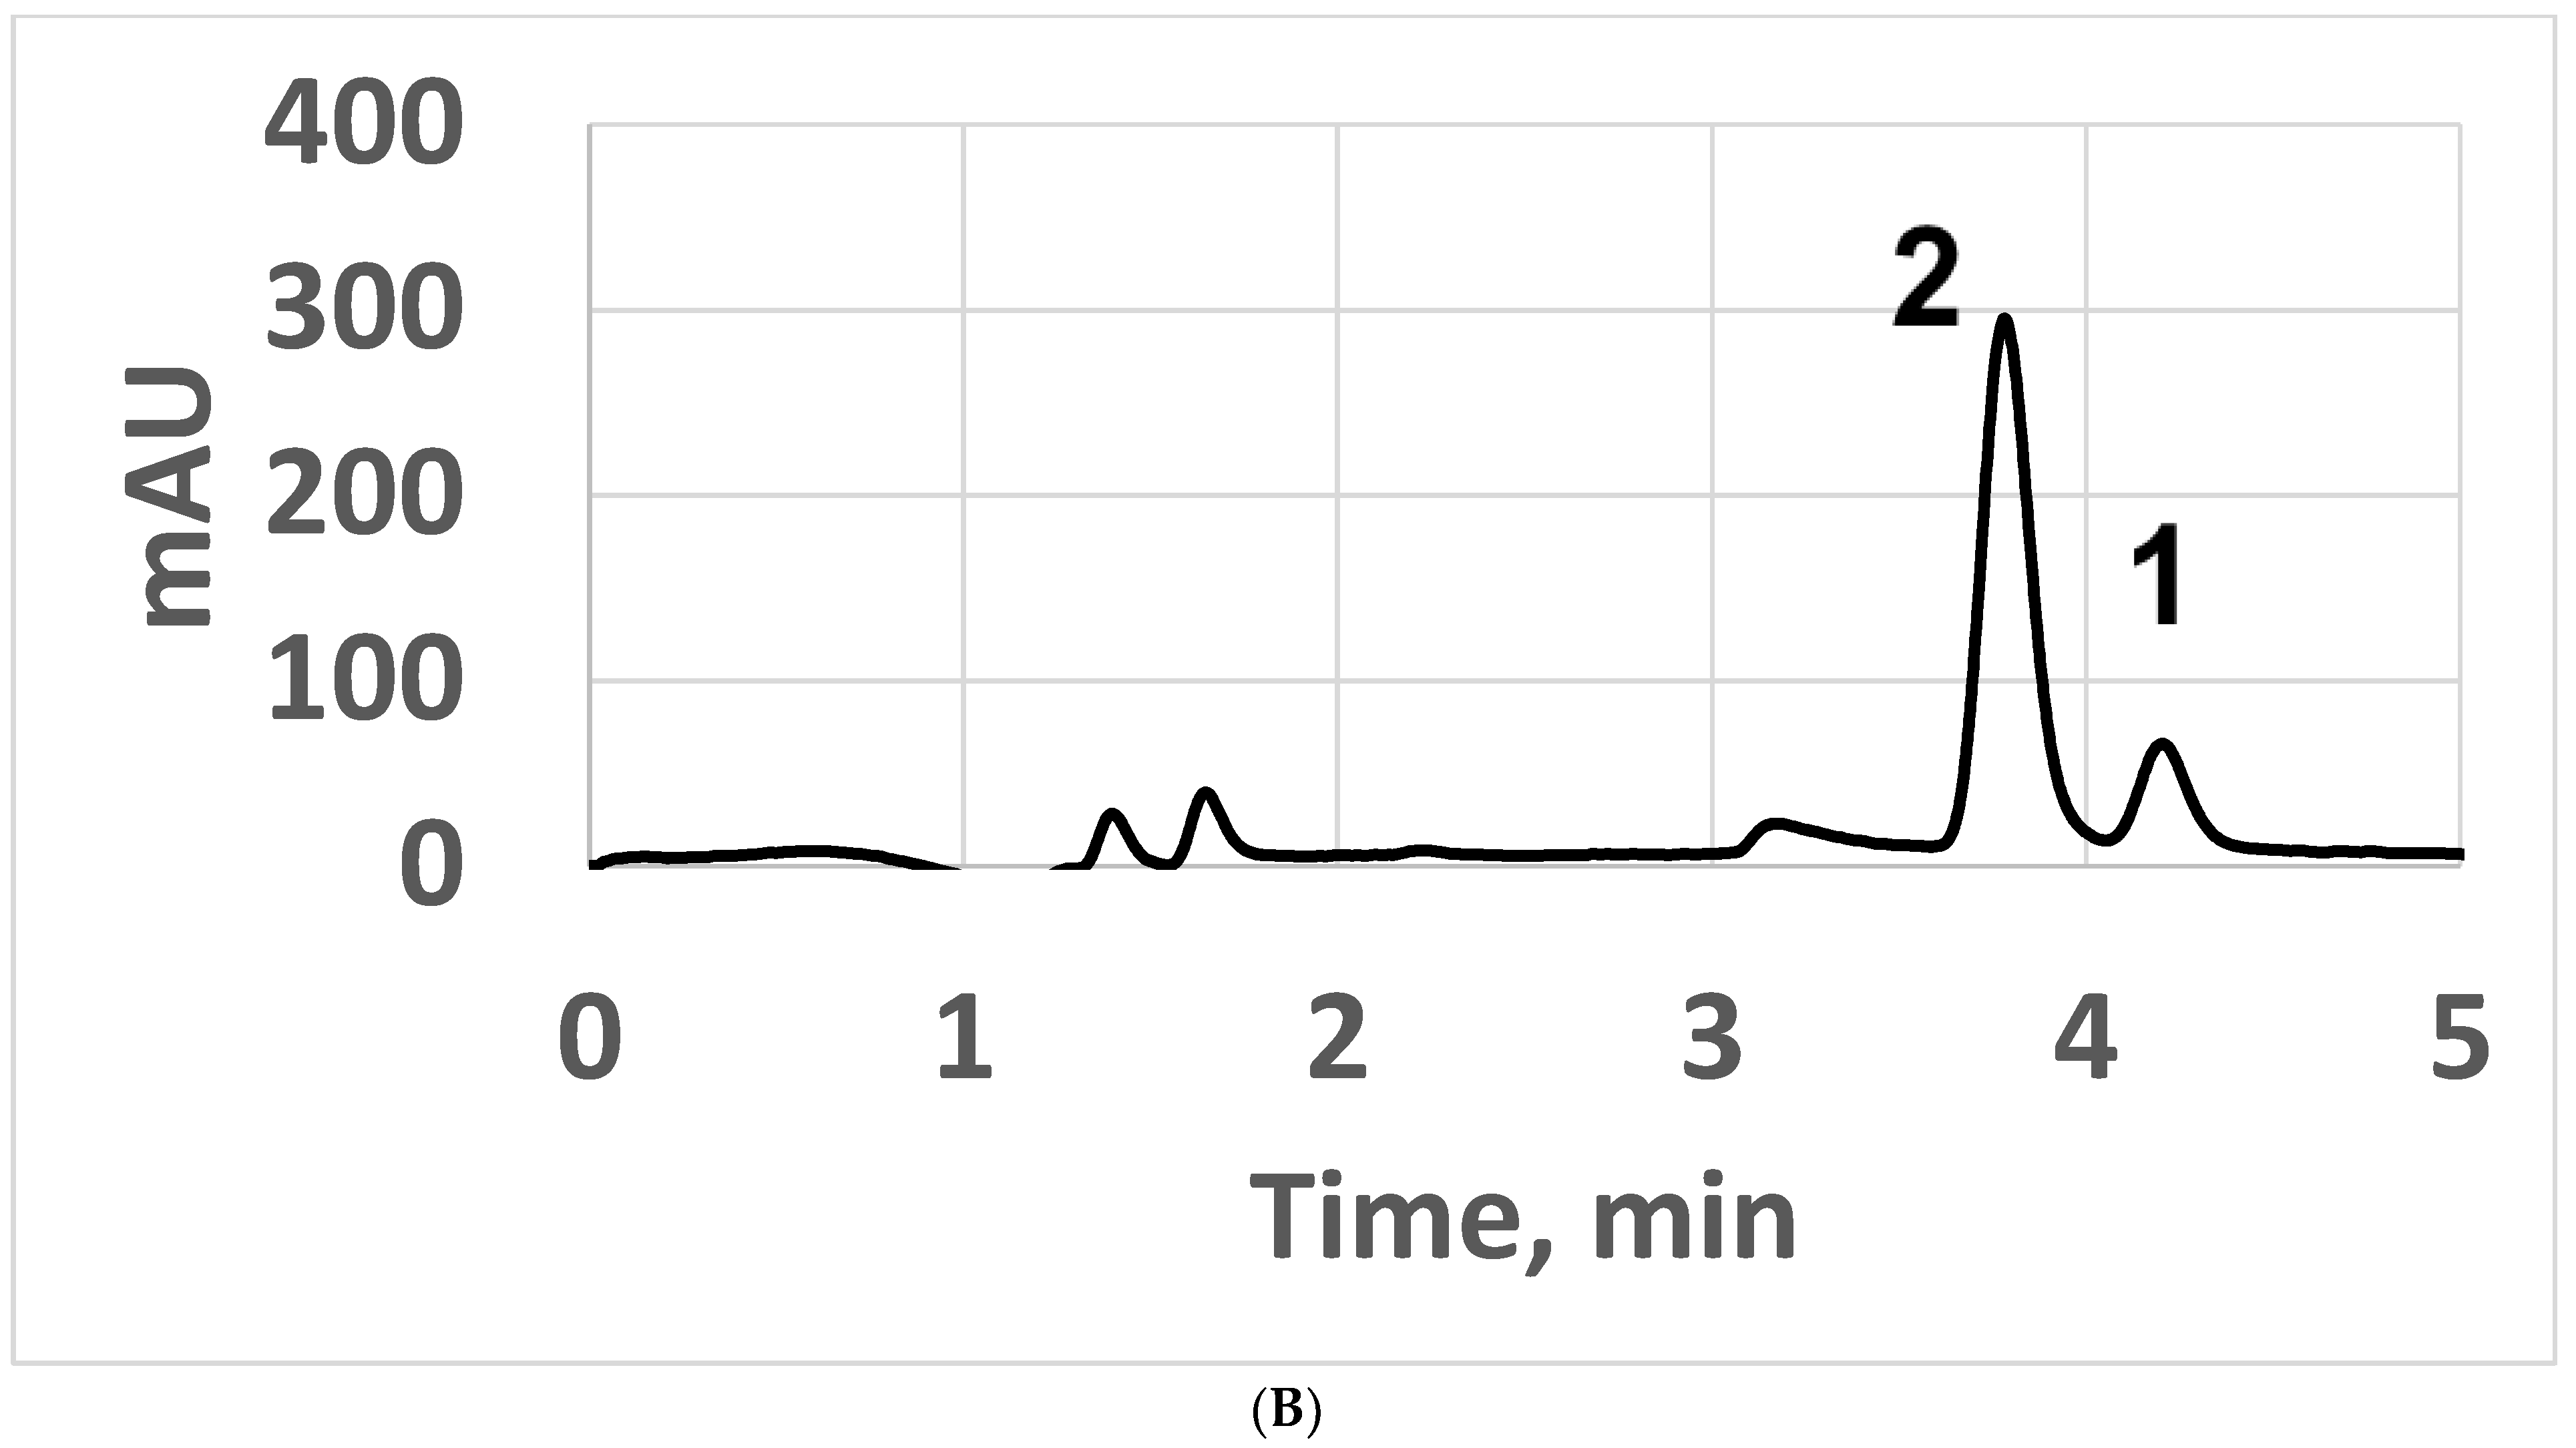
3.2.3. Applications Involving Positional Isomers and Drink Preservatives

A more complex sample of mono- and di-hydroxy benzoic acids, including positional isomers, was separated using the same organic modifier composition of 89% for MeCN and DMC (Figure 7). Peak shapes when using MeCN could be improved using a 100 mM buffer instead of a 10 mM buffer, the latter chosen as being more potentially MS-compatible. Retention of 2,6-dihydroxy benzoic acid (2,6-DHBA) was fine when using DMC, but it overlapped with the unretained toluene peak when using MeCN. Resolution of 2,4- and 2,5-DHBA was difficult using MeCN. However, the resolution of 2,4-DHBA and m-HBA was unexpectedly difficult when using DMC. Table S3 summarizes the retention factors for the hydroxy benzoic acid derivatives using MeCN and DMC. Para- and meta-hydroxy benzoic acids (HBA) were the only compounds tested that decreased in retention with the use of DMC, compared to MeCN. Three of the four DHBA positional isomers, as well as o-HBA, were retained in the 2–7 k range when using DMC, as compared to those same compounds which were only in the 0–1.2 k range using MeCN. The HETP values for 3,5-DHBA, p-HBA, and o-HBA were 0.0104, 0.0112, and 0.575 mm, respectively, using MeCN; HETP values for DMC were 0.0067, 0.0171, and 0.0185 mm, respectively. Column efficiency seemed to trend better for the longer retained peaks in the chromatograms.
A real-life sample analysis involved the determination of the preservatives, potassium sorbate and sodium benzoate, in three different drinks. A representative chromatogram of the standards and one of the margarita drinks using both MeCN and DMC mobile-phase modifiers are shown, respectively, in Figure 8 and Figure 9. Interestingly, the peak order was reversed, with benzoate being the first peak of the pair when using MeCN and then the second peak when using DMC. A previous HILIC report showed that the retention factors for these two preservatives are very close [39]. An MeCN and a DMC chromatogram comparison is shown for the other margarita mix sample in Figure S12. The Sunny D drink chromatograms showed several additional peaks, as well as the expected peak for sorbate (Figure S13). The UV spectra of benzoate and sorbate showed absorbance wavelength maxima near 225 and 254 nm, respectively. Calibration curves for both compounds at these absorbance wavelengths are shown in Figures S14 and S15. Using the MeCN chromatogram calibration curves, the μg/g concentrations (RSD), taken in quadruplicate of benzoate and sorbate, respectively, in Jose Cuervo Classic Lime Margarita, were 125 (0.41) and 109 (0.27), and the concentrations in Daily’s Cocktails Margarita Mix were 983 (0.32) and 305 (0.31). The μg/g of sorbate in Sunny D was 265 (0.70) from the MeCN chromatogram. Using the DMC calibration curves, the μg/g concentrations of benzoate and sorbate, respectively, in the Jose Cuervo Classic Lime Margarita were 168 (5.2) and 174 (5.0), and the concentrations in Daily’s Cocktails Margarita Mix were 1067 (0.64) and 372 (0.50). The μg/g of sorbate in Sunny D was 329 (0.15) from the DMC chromatogram. Although the precision was good, we are uncertain why the drink values differed between the DMC and the MeCN methods; the values determined by DMC averaged about 1.3 times higher.

3.2.4. Greenness Evaluation of DMC as a Mobile Phase for LC

The various approaches to evaluate the greenness of analytical chemistry methods has been reviewed [40]. The Analytical GREEnness (AGREE) Metric Approach was chosen to evaluate the application of DMC as a mobile phase for HILIC [41]. Using the AGREE calculator and the example table in reference [41], a score of 0.72, based on a perfect score of 1, was found (Figure S16). Most of the twelve greenness characteristics in Figure S16 were favorable (green). Segment characteristics in the yellow were due to the HPLC method not being on-line but potentially at-line and the fact that HPLC methods do generate solvent waste. The overall score was comparable to 0.74 for an RPLC method using 85% water (0.1% formic acid)—15 % ethanol for the separation of sulfonamides, xanthine alkaloids, and steroids [42].

4. Conclusions

Our main research aim, which was to show the ability of DMC to be used as an effective mobile-phase modifier for both normal-phase LC and HILIC, has been met. A comparison of EA and DMC as mobile-phase modifiers in hexane using a silica column showed that DMC was a weaker solvent by about a factor of two, but both solvents provided excellent peak resolutions of phthalates. Detection at 215 nm, only possible with DMC, allowed for the better detection of the phthalates by a factor of 10, compared with EA detection, which was the best at 254 nm. A comparison of MeCN and DMC in a buffer–ethanol mixture, using a silica column, showed DMC to be the weaker HILIC solvent by a factor of two, a similar magnitude to that found for the normal phase method. Van Deemter plots with DMC showed slightly lower HETP profiles than those with MeCN. This trend was repeated using a column with a zwitterionic stationary phase, possibly indicating that the exposed silanol surface of silica is not the explanation for the lower DMC HETP profiles. van’t Hoff plots were linear for both DMC and MeCN, indicating that only a single retention mechanism on the silica column was likely. A seven-component hydroxylated benzoic acid mixture containing positional isomers could be effectively separated by HILIC, using DMC as the mobile-phase modifier solvent. Sorbate and benzoate preservatives could be easily resolved and determined in commercial drink samples. The compatibility of DMC with MS detection still needs to be established, but it is expected to be fine. The compatibility of DMC for the corona-charged aerosol detection of carbohydrates has been shown by us, and this work is ongoing. Preliminary work has shown that DMC, in conjunction with ethanol, is an effective mobile-phase modifier to shorten the elution of high molar mass PAHs, such as coronene. Enhanced fluidity HILIC methods using methanol/buffer/CO2 mobile phases [43] also avoid using MeCN and are considered green. We feel that DMC, with conventional HPLC instrumentation, can also make HILIC comparable in greenness.

Supplementary Materials

The following supporting information can be downloaded at: https://www.mdpi.com/article/10.3390/separations10020070/s1. Table S1. Solvent properties for ethyl acetate (EA), acetonitrile (MeCN), dimethyl carbonate (DMC), and propylene carbonate (PC). Table S2. Fit of the log k (y) versus log Φ (x) plots in Figure 4 for EA and DMC modifiers in hexane. Table S3. Comparison of benzoic acid derivative retention factors using MeCN and DMC on the silica column. Figure S1: UV-Vis spectra on neat DMC, before and after distillation. Figure S2. UV spectra for 2% ethyl acetate with 98% hexane (black trace) and 5% dimethyl carbonate (DMC) with 95% hexane (gray trace). Figure S3. Chromatograms of phthalates comparing 4% DMC (top) and 4% ethyl acetate (bottom) as the modifier solvent with 96% hexane at 275 nm. Figure S4. Chromatograms of phthalates comparing 4% DMC (top) and 4% ethyl acetate (bottom) as the modifier solvent with 96% hexane at 220 nm. Figure S5. Absorbance spectra of HILIC mobile phases with different % DMC in 2:1 ethanol/water. Top to bottom: (90, 80, 70, 60% DMC). Figure S6. Plot of column pressure compared with % organic solvent. Top (green)—dimethyl carbonate. Bottom (purple)—acetonitrile. Flow rate—0.5 mL/min. Figure S7: Sample chromatograms comparing MeCN and DMC as mobile phase modifier solvents. Mixture of toluene (1), t-ferulic acid (2), vanillic acid (3), and syringic acid (4) in order of retention time. Peaks 2 and 3 overlap. Figure S8. Log retention factor of syringic acid (more retained) and vanillic acid (less retained) versus log % modifier solvent for acetonitrile (C, D—blue triangles) and dimethyl carbonate (A, B—gray squares). Figure S9: van’t Hoff plots for MeCN and DMC mobile phases. Figure S10: Height equivalent of theoretical plates for syringic acid with a mobile phase of 89% organic modifier in 11% buffer-ethanol. Figure S11: Peak asymmetry between the Halo silica column (A) and the ZIC zwitterion column (B). MeCN –purple (darker) points; DMC—green (lighter) points. Figure S12. Chromatograms of Jose Cuervo Classic Lime Margarita. A) 85% DMC—15% 10 mM buffer/ethanol and B) 85 % MeCN—15% 100 mM buffer/ethanol. Peak 1 sorbate and peak 2 benzoate. Wavelength: 215 nm. Figure S13. Chromatograms of Sunny D Orange Strawberry. (A) 85% DMC—15% 10 mM buffer/ethanol and (B) 85 % MeCN—15% 100 mM buffer/ethanol. Peak 1 sorbate. Wavelength: 215 nm. Figure S14. Peak area calibration curves (n = 4) for benzoate and sorbate at 225 nm (top plot, spectral absorbance max for benzoate) and sorbate at 254 nm (top plot, spectral absorbance max for sorbate) using dimethyl carbonate mobile phase. Figure S15. Peak area calibration curves (n = 4) for benzoate and sorbate at 225 nm (top plot, spectral absorbance max for benzoate) and sorbate at 254 nm (top plot, spectral absorbance max for sorbate) using acetonitrile mobile phase. Figure S16. AGREE Greenness assessment circle for HILIC using DMC.

Author Contributions

Conceptualization, N.D.D.; methodology, N.D.D. and P.D.B.; validation, P.D.B.; formal analysis, P.D.B.; investigation, P.D.B. and S.R.E.; resources, N.D.D.; writing—original draft preparation, P.D.B.; writing—review and editing, N.D.D.; visualization, P.D.B. and S.R.E.; supervision, N.D.D.; project administration, N.D.D.; funding acquisition, N.D.D. All authors have read and agreed to the published version of the manuscript.

Funding

This research received no external funding.

Data Availability Statement

Not applicable.

Conflicts of Interest

The authors declare no conflict of interest.

References

  1. Anastas, P.T.; Warner, J.C. Green Chemistry: Theory and Practice; Oxford University Press: New York, NY, USA, 1998. [Google Scholar]
  2. Waterlot, C.; Ghinet, A.; Lipka, E. Core-shell particles: A way to greening liquid chromatography in environmental applications. Curr. Chromatogr. 2018, 5, 78–90. [Google Scholar] [CrossRef]
  3. Aly, A.A.; Gorecki, T. Green chromatography and related techniques. In Green Analytical Chemistry. Green Chemistry and Sustainable Technology; Plotka-Wasylka, J., Namiesnik, J., Eds.; Springer: Singapore, 2019. [Google Scholar]
  4. Dogan, A.; Eylem, C.; Nursabah, N.E.B. An overview of green chromatographic analysis from pharmaceutical preparations. Curr. Anal. Chem. 2021, 17, 1260–1277. [Google Scholar] [CrossRef]
  5. Zotou, A. An overview of recent advances in HPLC instrumentation. Cent. Eur. J. Chem. 2012, 10, 554–569. [Google Scholar] [CrossRef]
  6. Napolitano-Tabares, P.I.; Negrin-Santmaria, I.; Gutierrez-Serpa, A.; Pino, V. Recent efforts to increase greenness in chromatography. Curr. Opin. Green Sustain. Chem. 2021, 32, 100536. [Google Scholar] [CrossRef]
  7. Dembek, M.; Bocian, S. Pure water as a mobile phase in liquid chromatography techniques. Trends Anal. Chem. 2020, 123, 115793. [Google Scholar] [CrossRef]
  8. El-Maghrabey, M.H.; Sivasankar, V.; El-Shaheny, R.N. (Eds.) Green Chemical Analysis and Sample Preparations; Springer Nature: London, UK, 2022. [Google Scholar]
  9. van der Wal, S.J. Low viscosity organic modifiers in reversed-phase HPLC. Chromatographia 1985, 20, 274–278. [Google Scholar] [CrossRef]
  10. Sangle, M.; Shirsath, A.; Gondkar, S.; Kulkarni, A. Fundamentals and recent progress on green high performance liquid chromatography. Int. J. Res. Anal. Rev. 2022, 9, 69. [Google Scholar]
  11. Gilomen, K.; Stauffer, H.P.; Meyer, V.R. Detoxification of acetonitrile—water wastes from liquid chromatography. Chromatographia 1995, 41, 488–491. [Google Scholar]
  12. Yabr´e, M.; Ferey, L.; Som´e, I.T.; Gaudin, K. Greening reversed-phase liquid chromatography methods using alternative solvents for pharmaceutical analysis. Molecules 2018, 23, 1065. [Google Scholar] [CrossRef] [Green Version]
  13. Micale, F.; Albu, F.; Lorgulescu, E.-E.; Medvedovici, A.; Tache, F. Ethyl lactate as a greener alternative to acetonitrile in RPLC: A realistic approach. J. Chrom. Sci. 2015, 53, 1701–1707. [Google Scholar] [CrossRef] [Green Version]
  14. Nallar, M.; Tenaglia, N.; Morose, G.; Wong, H.-W. Safer solvent blends for food, dye, and environmental analyses using reversed-phase high performance liquid chromatography. Chromatographia 2021, 21, 769–780. [Google Scholar] [CrossRef]
  15. Habib, A.; Mabrouk, M.M.; Fekry, M.; Mansour, F.R. Glycerol as a new mobile phase modifier for green liquid chromatographic determination of ascorbic acid and glutathione in pharmaceutical tablets. J. Pharm. Biomed. Anal. 2014, 95, 184–192. [Google Scholar] [CrossRef] [PubMed]
  16. Ali, A.F.; Danielson, N.D. Ultra-high performance micellar liquid chromatography comparing Tween 20 and Tween 40 for the determination of hydroxycinnamic acids. Separations 2022, 9, 61. [Google Scholar] [CrossRef]
  17. Ali, A.F.; Danielson, N.D. Micellar and sub-micellar liquid chromatography of terephthalic acid contaminants using a C18 column coated with Tween 20. Anal. Chim. Acta 2020, 1105, 214–223. [Google Scholar] [CrossRef] [PubMed]
  18. Ruiz-Angel, M.J.; Carda-Broch, S.; Garcia-Alvarez-Coque, M.C. Ionic liquids as mobile phase additives and immobilized on stationary phases in liquid chromatography. In Ionic Liquids in Analytical Chemistry; Ruiz-Angel, M.J., Carda-Broch, S., Eds.; Elsevier: Amsterdam, The Netherlands, 2022; pp. 203–234. [Google Scholar]
  19. Sutton, A.T.; Fraige, K.; Leme, G.M.; da Silva Bolzani, V.; Hilder, E.F.; Cavalheiro, A.J.; Arrua, R.D.; Funari, C.S. Natural deep eutectic solvents as the major mobile phase components in high-performance liquid chromatography—Searching for alternatives to organic solvents. Anal. Bioanal. Chem. 2018, 419, 3705–3713. [Google Scholar] [CrossRef] [Green Version]
  20. Varsha, N.; Suvarna, B.; Pratibha, V.; Soni, M.; Ashok, B. Replacement of acetonitrile by mixtures of propylene carbonate and methanol as organic modifier in mobile phases for RPLC separation mechanism: Application to the assay of alprazolam and sertraline in combined pharmaceutical formulations. J. Liq. Chrom. Rel. Technol. 2012, 35, 2643–2654. [Google Scholar] [CrossRef]
  21. Varsha, N.; Pratibha, V.; Soni, M.; Ashok, B.; Suvarna, B. Estimation of paracetamol and lornoxicam by isocratic, gradient, and elevated temperature HPLC using propylene carbonate. J. Liq. Chrom. Rel. Technol. 2014, 37, 1094–1103. [Google Scholar] [CrossRef]
  22. Dogan, A.; Basci, N.E. Green bioanalytical and pharmaceutical analysis of voriconazole and tadalafil by HPLC. Curr. Pharm. Anal. 2017, 13, 495–504. [Google Scholar] [CrossRef]
  23. Cheragi, M.; Albu, F.; Udrescu, S.; Raducanu, N.; Medvedovici, A. Greener bioanalytical approach for LC/MS-MS assay of enalapril and enalaprilat in human plasma with total replacement of acetonitrile throughout all analytical stages. J. Chromatogr. B. 2013, 927, 124–132. [Google Scholar] [CrossRef]
  24. Aly, A.A.; Gorecki, T.; Omar, M.A. Green approaches to comprehensive two-dimensional liquid chromatography (LC × LC). J. Chromatogr. Open 2022, 2, 100046. [Google Scholar] [CrossRef]
  25. Aly, A.A.; Gorecki, T. Green comprehensive two-dimensional liquid chromatography (LC × LC) for the analysis of phenolic compounds in grape juices and wine. Anal. Bioanal. Chem. 2022. [Google Scholar] [CrossRef]
  26. Tache, F.; Udrescu, S.; Albu, F.; Micăle, F.; Medvedovici, A. Greening pharmaceutical applications of liquid chromatography through using propylene carbonate-ethanol mixtures instead of acetonitrile as organic modifier in the mobile phases. J. Pharm. Biomed. Anal. 2013, 75, 230–238. [Google Scholar] [CrossRef] [PubMed]
  27. Pyo, S.H.; Park, J.H.; Chang, T.S.; Hatti-Kaul, R. Dimethyl carbonate as a green chemical. Curr. Opin. Green Sustain. Chem. 2017, 5, 61–66. [Google Scholar] [CrossRef]
  28. Lajin, B.; Goessler, W. Introducing dimethyl carbonate as a new eluent in HPLC-ICP-MS: Stronger elution with less carbon. J. Anal. At. Spectrom. 2021, 36, 1272–1279. [Google Scholar] [CrossRef]
  29. Buljan, A.; Roje, M. Application of green chiral chromatography in enantioseparation of newly syntehsized racemic marinoepoxides. Mar. Drugs 2022, 20, 530. [Google Scholar] [CrossRef] [PubMed]
  30. Jurin, M.; Kontrec, D.; Drazic, T.; Roje, M. Enantioseparation of syn- and anti-4,5-disubstituted hydantoins by HPLC and SFC on immobilized polysaccharides-based chiral stationary phases. Separations 2022, 9, 157. [Google Scholar] [CrossRef]
  31. Propylene Carbonate Technical Data. Available online: https://www.lyondellbasell.com/globalassets/documents/chemicals-technical-literature/lyondellbasell-chemicals-technicalliterature-propylene-carbonate-2417.pdf (accessed on 11 January 2023).
  32. Alpert, J. Hydrophilic interaction chromatography for the separation of peptides, nucleic acids and other polar compounds. J. Chrom. 1990, 499, 177–196. [Google Scholar] [CrossRef]
  33. Grumbach, E.S.; Wagrowski-Diehl, D.M.; Mazzeo, J.R.; Alden, B.; Iraneta, P.C. Hydrophilic interaction chromatography using silica columns for the retention of polar analytes and enhanced ESI-MS sensitivity. LC GC N. Am. 2004, 22, 1010–1023. [Google Scholar]
  34. Buszewski, B.L.; Noga, S. Hydrophilic interaction liquid chromatography (HILIC)-a powerful separation technique. Anal. Bioanal. Chem. 2012, 402, 231–247. [Google Scholar] [CrossRef] [Green Version]
  35. Foley, J.P.; Dorsey, J.G. Equations for Calculation of Chromatographic Figures of Merit for Ideal and Skewed Peaks. Anal. Chem. 1983, 35, 730–737. [Google Scholar] [CrossRef]
  36. Ma, J.; Zhang, W.; Lu, S.; Yu, R. Determination of purity and components in dimethyl carbonate by gas chromatography. Anal. Lett. 2004, 37, 2557–2563. [Google Scholar] [CrossRef]
  37. Hao, Z.; Xiao, B.; Weng, N. Impact of column temperature and mobile phase components on selectivity of hydrophilic interaction liquid chromatography (HILIC). J. Sep. Sci. 2008, 31, 1449–1464. [Google Scholar] [CrossRef] [PubMed]
  38. Burgos-Gil, R.; Peris-Garcia, E.; Ruiz-Angel, M.J.; Baeza-Baeza, J.J.; Garcia-Alvarez-Coque, M.C. Protocol to compare column performance applied to hydrophilic interaction liquid chromatography. Microchem. J. 2019, 149, 103973. [Google Scholar] [CrossRef]
  39. Chen, T.; Zhu, L.; Lu, H.; Song, G.; Li, Y.; Zhou, H.; Li, P.; Zhu, W.; Xu, H.; Shao, L. Preparation and application of covalently bonded polysaccharide modified stationary phase for per aqueous liquid chromatography. Anal. Chim. Acta 2017, 964, 195–202. [Google Scholar] [CrossRef]
  40. Kannaiah, K.P.; Sugumaran, A.; Chanduluru, H.K.; Rathinam, S. Environmental impact of greenness assessment tools in liquid chromatography—A review. Microchem. J. 2021, 170, 106685. [Google Scholar] [CrossRef]
  41. Pena-Pereira, F.; Wojnowski, W.; Tobiszewski, M. AGREE Analytical GREEnness Metric Approach and Software. Anal. Chem. 2020, 92, 10076–10082. [Google Scholar] [CrossRef]
  42. Chen, K.; Lynen, F.; De Beer, M.; Hitzel, L.; Ferguson, P.; Hanna-Brown, M.; Sandra, P. Selectivity optimization in green chromatography by gradient stationary phase optimized selectivity liquid chromatography, J. Chromatogr. A. 2010, 1217, 7222–7230. [Google Scholar] [CrossRef] [PubMed]
  43. Treadway, J.W.; Philibert, G.S.; Olesik, S.V. Enhanced fluidity liquid chromatography for hydrophilic interaction separation of nucleosides. J. Chromatogr. A. 2011, 1218, 5897–5902. [Google Scholar] [CrossRef] [PubMed]
Figure 1. Retention factor plots of phthalates as a function of organic modifiers (increases to the left): (A) ethyl acetate and (B) dimethyl carbonate in hexane. Top to bottom at 4% organic modifier: dimethyl phthalate, diethyl phthalate, benzyl butyl phthalate, dibutyl phthalate, and dioctyl phthalate.
Separations 10 00070 g001
Figure 2. Chromatograms using 96% hexanes and 4% DMC. Peak assignments are as follows: 1, dioctyl phthalate; 2, dibutyl phthalate; 3, benzyl butyl phthalate; 4, diethyl phthalate; and 5, dimethyl phthalate. UV detection: (A) 254 nm, (B) 215 nm.
Separations 10 00070 g002aSeparations 10 00070 g002b
Figure 3. Chromatogram using 96% hexane and 4% ethyl acetate. Peak assignments are as follows: 1, dioctyl phthalate; 2, dibutyl phthalate; 3, benzyl butyl phthalate; 4, diethyl phthalate; and 5, dimethyl phthalate. UV detection: (A) 254 nm, (B) 215 nm.
Separations 10 00070 g003aSeparations 10 00070 g003b
Figure 4. Log retention factor (k) versus log fraction (Φ) organic modifier. (A) Ethyl acetate (EA). (B) Dimethyl carbonate (DMC). Top to bottom between −1 and −1.5 for log Φ: dimethyl phthalate, diethyl phthalate, benzyl butyl phthalate, dibutyl phthalate, and dioctyl phthalate.
Separations 10 00070 g004
Figure 5. Retention factor vs. % organic modifier: (A) MeCN; (B) DMC. Top (gray)—syringic acid; middle (orange)—trans-ferulic acid; bottom (blue)—vanillic acid.
Separations 10 00070 g005aSeparations 10 00070 g005b
Figure 6. Height equivalent of theoretical plates compared to the composition (A), temperature (B), and flow rate (C). Composition for (B,C) was 89% organic modifier, temperature for (A,C) was 25 °C, and flow rate for (A,B) was 0.5 mL/min. Top profile (purple): acetonitrile; bottom profile (green): dimethyl carbonate. Error bars (standard deviation) within the points. Average % RSD for points (n = 3): Composition (A) MeCN: 2.9%, DMC: 6.4%; temperature (B) MeCN: 4.2%, DMC: 4.7%; flow rate (C) MeCN: 8.9%, DMC: 8.8%.
Separations 10 00070 g006
Figure 7. Separation of a mixture of mono- and di-hydroxybenzoic acids. (A) The 89% acetonitrile—11% 100 mM buffer/ethanol; (B) 89% dimethyl carbonate—11% 10 mM buffer/ethanol. Peak ID: 1—toluene; 2—2,6-DHBA; 3—p-HBA; 4—o-HBA; 5—2,4-DHBA; 6—m-HBA; 7—2,5-DHBA; and 8—3,5-DHBA.
Separations 10 00070 g007aSeparations 10 00070 g007b
Figure 8. Chromatograms of benzoic acid and sorbitol standards (1 mM). The (A) 85% DMC—15% 10 mM buffer/ethanol and the (B) 85% MeCN—15% 100 mM buffer/ethanol. Peak 1: Sorbate, and peak 2: Benzoate. Wavelength: 215 nm.
Separations 10 00070 g008aSeparations 10 00070 g008b
Figure 9. Chromatograms of Daily’s Cocktails Margarita Mix. The (A) 85% DMC—15% 10 mM buffer/ethanol and the (B) 85% MeCN—15% 100 mM buffer/ethanol. Peak 1: Sorbate, and peak 2: Benzoate. Wavelength: 215 nm.
Separations 10 00070 g009aSeparations 10 00070 g009b
Disclaimer/Publisher’s Note: The statements, opinions and data contained in all publications are solely those of the individual author(s) and contributor(s) and not of MDPI and/or the editor(s). MDPI and/or the editor(s) disclaim responsibility for any injury to people or property resulting from any ideas, methods, instructions or products referred to in the content.

