
A Selective and Accurate LC-MS/MS Method for Simultaneous Quantification of Valsartan and Hydrochlorothiazide in Human Plasma


Abstract
:1. Introduction
2. Materials and Methods
2.1. Chemicals and Reagents
2.2. Instrumentation and Chromatographic Condition
2.3. Stock and Working Solutions Preparation
2.4. Preparation of Calibration Standard (CSs) and Quality Control (QCs) Samples
2.5. Sample Preparation
2.6. Method Validation
2.6.1. System Suitability
2.6.2. Selectivity
2.6.3. Sensitivity
2.6.4. The Calibration Curves (CCs) and Linearity
2.6.5. Precision and Accuracy
2.6.6. Stability Studies
2.6.7. Anticoagulant Effect
2.6.8. Dilution Integrity
2.6.9. Recovery and Matrix Effect
2.6.10. Ruggedness
2.7. Application of the Developed Method in Bioequivalence Study
3. Results and Discussion
3.1. Method Development
3.2. System Suitability
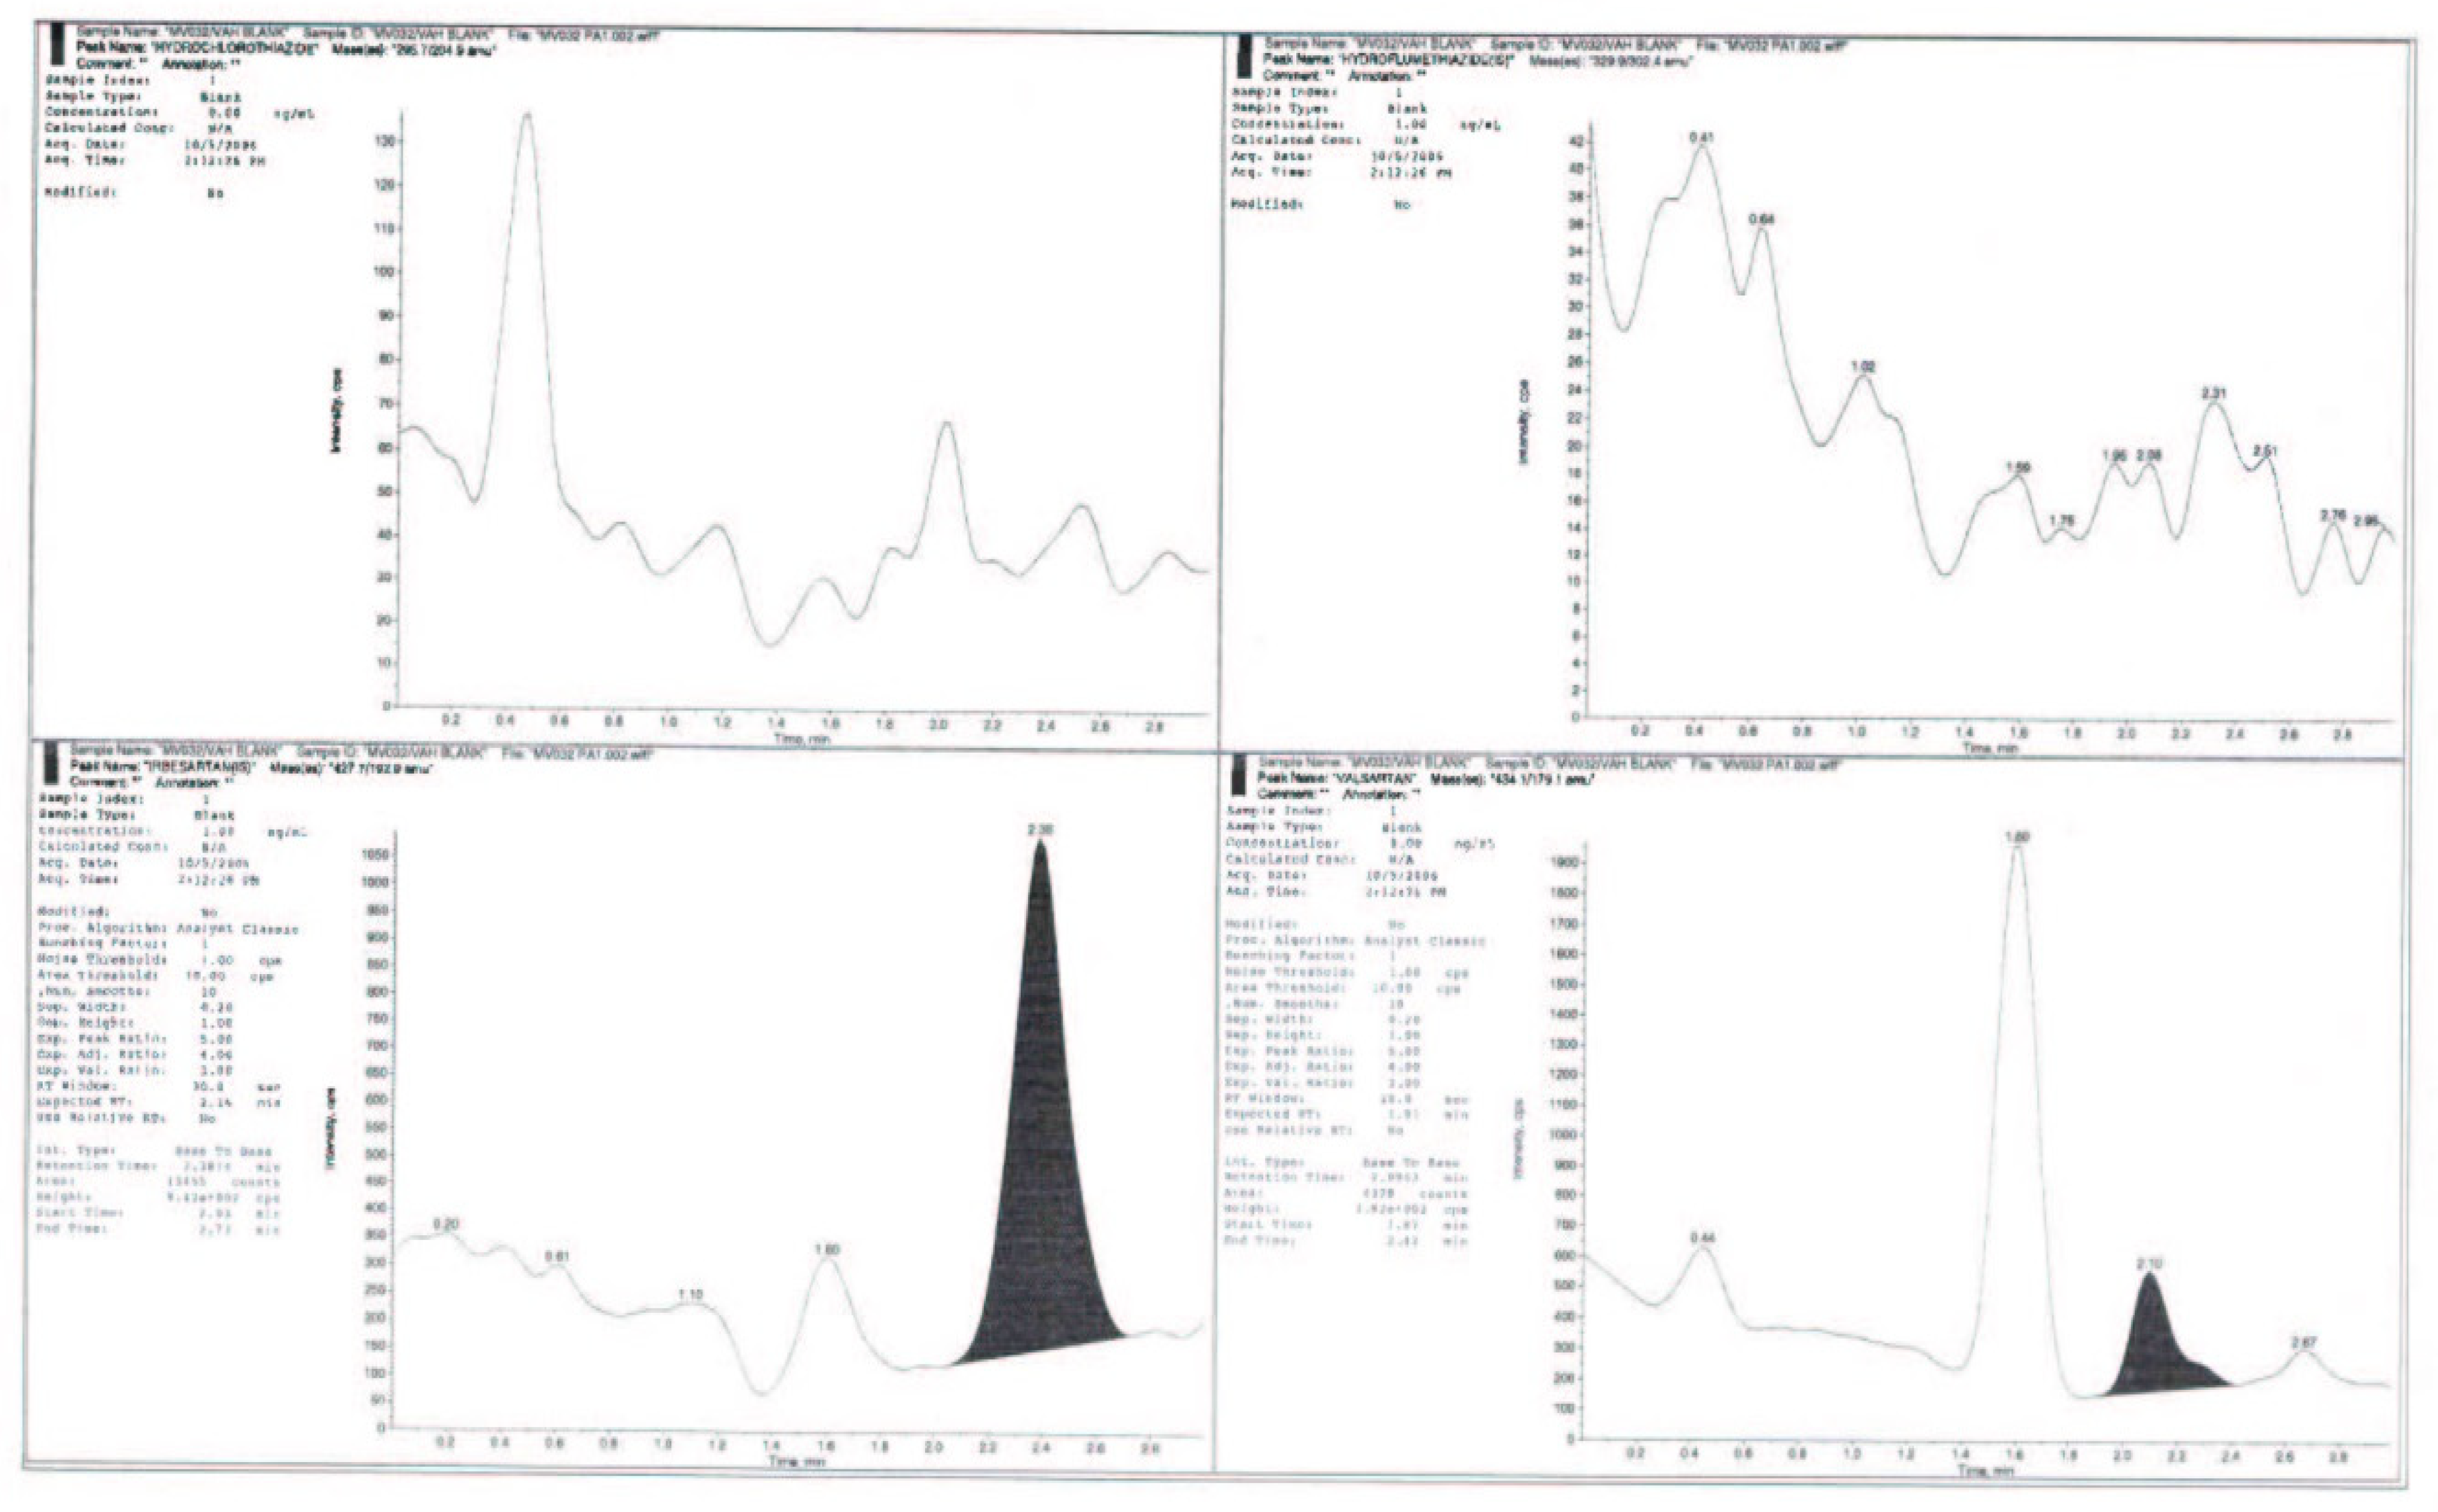
3.3. Selectivity
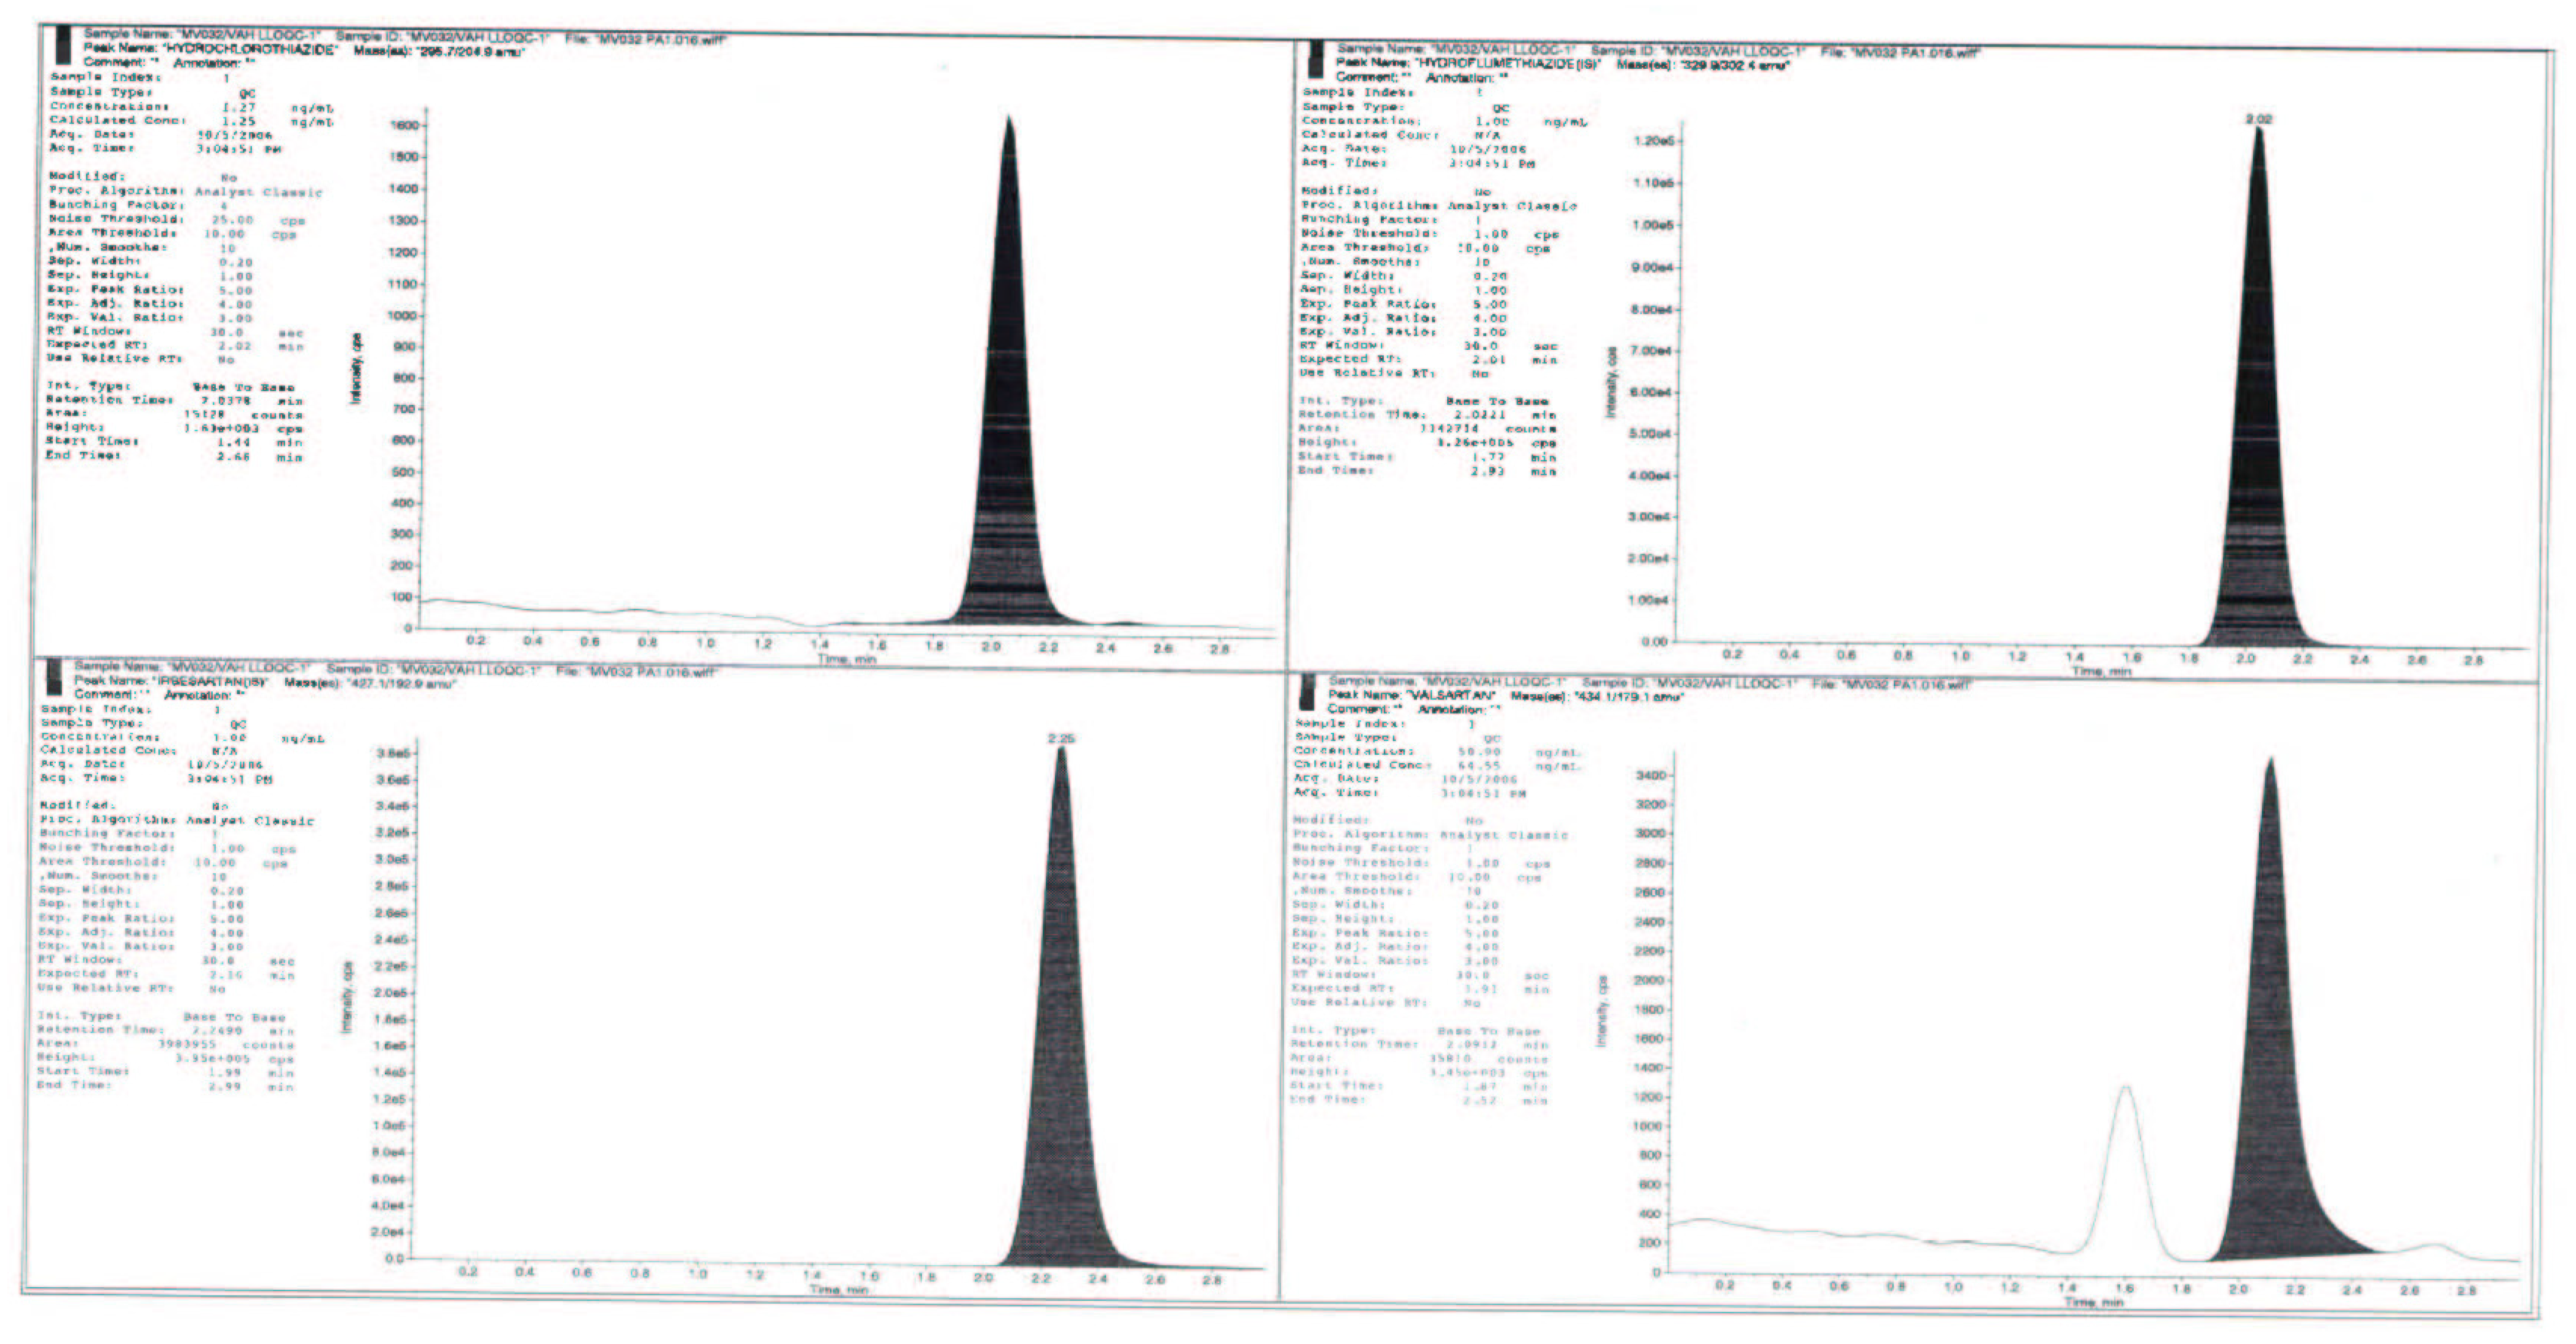
3.4. Sensitivity
3.5. Linearity and Goodness of Fit
3.6. Precision and Accuracy
3.7. Extraction Recovery and Matrix Effects
3.8. Anticoagulant Effect
3.9. Dilution Integrity
3.10. Ruggedness
3.11. Stability Studies
4. Conclusions
Supplementary Materials
Author Contributions
Funding
Data Availability Statement
Acknowledgments
Conflicts of Interest
References
- Gradman, A.; Basile, J.; Carter, B.; Bakris, G. Combination therapy in hypertension. J. Clin. Hypertens. 2011, 13, 146–154. [Google Scholar] [CrossRef] [PubMed]
- Jangala, H.; Vats, P.; Khuroo, A.H.; Monif, T. Development and Validation of LC-MS/MS Method for Simultaneous Estimation of Amlodipine and Valsartan in Human Plasma: Application to a Bioequivalence Study. Sci. Pharm. 2014, 82, 585–600. [Google Scholar] [CrossRef] [PubMed]
- Prescribing Information of Diovan (Valsartan) Tablets. Novartis Pharmaceuticals Corp. East Hanover, NJ 11/ 2011. Available online: https://www.accessdata.fda.gov/drugsatfda_docs/label/2011/021283s033lbl.pdf (accessed on 15 November 2022).
- Prescribing Information of Diovan HCT(Valsartan/Hydrochalothiazide) Tablets. Novartis Pharmaceuticals Corp. East Hanover, NJ 11/ 2011. Available online: https://www.accessdata.fda.gov/drugsatfda_docs/label/2011/020818s049lbl.pdf (accessed on 15 November 2022).
- Wellington, K.; Faulds, D.M. Valsartan/hydrochlorothiazide: A review of its pharmacology, therapeutic efficacy and place in the management of hypertension. Drugs 2002, 62, 1983–2005. [Google Scholar] [CrossRef] [PubMed]
- Kondrack, R.; Mohiuddin, S. Valsartan/hydrochlorothiazide: Pharmacology and clinical efficacy. Expert Opin. Drug Metab. Toxicol. 2009, 5, 1125–1134. [Google Scholar] [CrossRef]
- Patel, R.B.; Patel, M.R. An introduction to analytical method development for pharmaceutical formulations. Pharm. Inf. 2008, 6, 1. [Google Scholar]
- Jadhav, M.L.; Girase, M.V.; Tidme, S.K.; Junagade, M.S. Development and Validation of Spectrophotometric Methods for Simultaneous Estimation of Valsartan and Hydrochlorothiazide in Tablet Dosage Form. Int. J. Spectrosc. 2014, 2014, 1–6. [Google Scholar] [CrossRef]
- El-Gizawy, S.M.; Abdelmageed, O.H.; Omar, M.A.; Deryea, S.M.; Abdel-Megied, A.M. Development and Validation of HPLC Method for Simultaneous Determination of Amlodipine, Valsartan, Hydrochlorothiazide in Dosage Form and Spiked Human Plasma. Am. J. Anal. Chem. 2012, 03, 422–430. [Google Scholar] [CrossRef]
- Şatana, E.; Altınay, S.; Göğer, N.G.; Özkan, S.A.; Şentürk, Z. Simultaneous determination of valsartan and hydrochlorothiazide in tablets by first-derivative ultraviolet spectrophotometry and LC. J. Pharm. Biomed. Anal. 2001, 25, 1009–1013. [Google Scholar] [CrossRef]
- Sharma, M.; Kothari, C.; Sherikar, O.; Mehta, P. Concurrent Estimation of Amlodipine Besylate, Hydrochlorothiazide and Valsartan by RP-HPLC, HPTLC and UV-Spectrophotometry. J. Chromatogr. Sci. 2013, 52, 27–35. [Google Scholar] [CrossRef]
- Jain, P.S.; Patel, M.K.; Gorle, A.P.; Chaudhari, A.J.; Surana, S.J. Stability-Indicating Method for Simultaneous Estimation of Olmesartan Medoxomile, Amlodipine Besylate and Hydrochlorothiazide by RP-HPLC in Tablet Dosage Form. J. Chromatogr. Sci. 2012, 50, 680–687. [Google Scholar] [CrossRef]
- Koçyiğit-Kaymakçoğlu, B.; Unsalan, S.; Rollas, S. Determination and validation of ketoprofen, pantoprazole and valsartan together in human plasma by high performance liquid chromatography. Die Pharm. 2006, 61, 586–589. [Google Scholar]
- Daneshtalab, N.; Lewanczuk, R.Z.; Jamali, F. High-performance liquid chromatographic analysis of angiotensin II receptor antagonist valsartan using a liquid extraction method. J. Chromatogr. B 2002, 766, 345–349. [Google Scholar] [CrossRef] [PubMed]
- Iqbal, M.; Al-Rashood, K.A. Development and full validation of a quantitative assay for the determination of valsartan in human plasma and its application for bioequivalence study. Clin. Res. Regul. Aff. 2010, 28, 7–13. [Google Scholar] [CrossRef]
- Hillaert, S.; Bossche, W.V.D. Simultaneous determination of hydrochlorothiazide and several angiotensin-II-receptor antagonists by capillary electrophoresis. J. Pharm. Biomed. Anal. 2003, 31, 329–339. [Google Scholar] [CrossRef]
- Koseki, N.; Kawashita, H.; Hara, H.; Niina, M.; Tanaka, M.; Kawai, R.; Nagae, Y.; Masuda, N. Development and validation of a method for quantitative determination of valsartan in human plasma by liquid chromatography-tandem mass spectrometry. J. Pharm. Biomed. Anal. 2007, 43, 1769–1774. [Google Scholar] [CrossRef] [PubMed]
- Stolarczyk, M.; Maślanka, A.; Krzek, J.; Milczarek, J. Application of derivative spectrophotometry for determination of enalapril, hydrochlorothiazide and walsartan in complex pharmaceutical preparations. Acta Pol. Pharm.-Drug Res. 2008, 65, 275–281. [Google Scholar]
- Tekkeli, S.E.K. Development of an HPLC-UV method for the analysis of drugs used for combined hypertension therapy in pharmaceutical preparations and human plasma. J. Anal. Methods Chem. 2013, 2013, 179627. [Google Scholar]
- Sharma, R.N.; Pancholi, S.S. Simple RP-HPLC method for determination of triple drug combination of valsartan, amlodipine and hydrochlorothiazide in human plasma. Acta Pharm. 2012, 62, 45–58. [Google Scholar] [CrossRef]
- Li, H.; Wang, Y.; Jiang, Y.; Tang, Y.; Wang, J.; Zhao, L.; Gu, J. A liquid chromatography/tandem mass spectrometry method for the simultaneous quantification of valsartan and hydrochlorothiazide in human plasma. J. Chromatogr. B 2007, 852, 436–442. [Google Scholar] [CrossRef]
- Gadepalli, S.G.; Deme, P.; Kuncha, M.; Sistla, R. Simultaneous determination of amlodipine, valsartan and hydrochlorothiazide by LC-ESI-MS/MS and its application to pharmacokinetics in rats. J. Pharm. Anal. 2014, 4, 399–406. [Google Scholar] [CrossRef]
- Guidance for Industry, Bioanalytical Method Validation, US Department of Health and Human Services, Food and Drug Administration Centre for Drug Evaluation and Research (CDER), Centre for Veterinary Medicine (CVM), May 2018. Available online: https://www.fda.gov/files/drugs/published/Bioanalytical-Method-Validation-Guidance-for-Industry.pdf (accessed on 15 November 2022).
- Guideline on Bio-Analytical Method Validation. Available online: https://www.ema.europa.eu/en/documents/scientific-guideline/guideline-bioanalytical-method-validation_en.pdf (accessed on 7 December 2021).
- Ghosh, C.; Gaur, S.; Shinde, C.P.; Chakraborty, B. A Systematic Approach to Overcome the Matrix Effect during LC-ESI-MS/ MS Analysis by Different Sample Extraction Techniques. J. Bioequiv. Bioavailab. 2011, 3, 122–127. [Google Scholar] [CrossRef]


| Analyte | RT (min) | ESI Mode | Precursor Ion | Product Ion |
|---|---|---|---|---|
| VAL | 1.9 | Negative mode | 434.10 | 179.10 |
| HCTZ | 2.3 | Negative mode | 295.70 | 204.90 |
| IBR | 2.1 | Negative mode | 427.10 | 192.90 |
| HFMZ | 2.0 | Negative mode | 329.90 | 302.40 |
| Drugs | Valsartan | Hydrochlorothiazide |
|---|---|---|
| Concentrations range (ng/mL) | 50.2–6018.6 | 1.25–507.63 |
| SD | 0.807–524.011 | 0.023–16.438 |
| %CV | 1.57–8.67 | 1.91–4.73 |
| Linearity equation | Y = 9.74005x + 0.0027 | Y = 0.00754x + 0.00378 |
| R2 | 0.9967 | 0.9956 |
| LLOQ (ng/mL) | 50.9 | 1.27 |
| LOQ (ng/mL) | 145.5 | 3.35 |
| Nominal QC (ng/mL) | Precision (RSD, %) | Accuracy (%) | ||
|---|---|---|---|---|
| Intra-Day (n = 5) | Inter-Day (n = 15) | Intra-Day (n = 5) | Inter-Day (n = 15) | |
| VAL | ||||
| 50.9 | 10.22 | 12.40 | 114.22 | 108.16 |
| 145.5 | 4.76 | 12.0 | 108.06 | 99.13 |
| 2597.4 | 6.76 | 10.90 | 105.68 | 101.02 |
| 3684.2 | 8.68 | 11.15 | 106.60 | 98.41 |
| HCTZ | ||||
| 1.27 | 3.71 | 7.41 | 101.18 | 99.37 |
| 3.35 | 2.82 | 10.78 | 87.01 | 95.16 |
| 186.24 | 1.57 | 5.19 | 93.32 | 96.79 |
| 310.40 | 2.18 | 2.52 | 95.83 | 96.03 |
| Compound | QC Level | ER % | MF % | ||
|---|---|---|---|---|---|
| % Mean | % RSD | % Mean | % RSD | ||
| VAL | LQC | 73.51 | 6.95 | 88.34 | 4.29 |
| MQC | 71.54 | 5.80 | |||
| HQC | 90.65 | 3.69 | 94.43 | 1.96 | |
| Mean | 78.57 | 13.38 | |||
| HCTZ | LQC | 86.65 | 6.00 | 109.02 | 9.44 |
| MQC | 78.61 | 6.67 | |||
| HQC | 94.84 | 3.01 | 89.93 | 9.70 | |
| Mean | 86.70 | 9.36 | |||
| VAL | HCTZ | |||||
|---|---|---|---|---|---|---|
| Nominal Concentration (ng mL−1) | Precision (CV, %) | Accuracy (%) | Nominal Concentration (ng/mL) | Precision (CV, %) | Accuracy (%) | |
| Stability | ||||||
| Short term (7 h) | 145.5 | 7.90 | 107.01 | 3.35 | 7.54 | 98.95 |
| 3684.2 | 10.57 | 96.77 | 310.40 | 4.09 | 314.79 | |
| Freeze thaw (3 cycle) | 145.5 | 4.47 | 111.16 | 3.35 | 7.13 | 99.15 |
| 3684.2 | 10.15 | 98.13 | 310.40 | 6.32 | 97.73 | |
| Auto-sampler (66 h) | 145.5 | 4.24 | 101.67 | 3.35 | 7.05 | 86.92 |
| 3684.2 | 13.44 | 98.28 | 310.40 | 6.03 | 90.93 | |
| Long term (60 days) | 145.5 | 11.94 | 87.55 | 3.35 | 5.81 | 112.58 |
| 3684.2 | 7.68 | 102.17 | 310.40 | 5.00 | 105.85 | |
| Dilution integrity | 2-times | 7.94 | 96.80 | 2.43 | 106.08 | |
| 4-times | 3.25 | 90.93 | 3.52 | 100.42 | ||
Disclaimer/Publisher’s Note: The statements, opinions and data contained in all publications are solely those of the individual author(s) and contributor(s) and not of MDPI and/or the editor(s). MDPI and/or the editor(s) disclaim responsibility for any injury to people or property resulting from any ideas, methods, instructions or products referred to in the content. |
© 2023 by the authors. Licensee MDPI, Basel, Switzerland. This article is an open access article distributed under the terms and conditions of the Creative Commons Attribution (CC BY) license (https://creativecommons.org/licenses/by/4.0/).
Share and Cite
Haque, A.; Iqbal, M.; Alamoudi, M.K.; Alam, P. A Selective and Accurate LC-MS/MS Method for Simultaneous Quantification of Valsartan and Hydrochlorothiazide in Human Plasma. Separations 2023, 10, 119. https://doi.org/10.3390/separations10020119
Haque A, Iqbal M, Alamoudi MK, Alam P. A Selective and Accurate LC-MS/MS Method for Simultaneous Quantification of Valsartan and Hydrochlorothiazide in Human Plasma. Separations. 2023; 10(2):119. https://doi.org/10.3390/separations10020119
Chicago/Turabian StyleHaque, Anzarul, Muzaffar Iqbal, Mariam K. Alamoudi, and Prawez Alam. 2023. "A Selective and Accurate LC-MS/MS Method for Simultaneous Quantification of Valsartan and Hydrochlorothiazide in Human Plasma" Separations 10, no. 2: 119. https://doi.org/10.3390/separations10020119