
Analysis of Kazakhstan Crude Oil Biomarkers by Gas Chromatography in Combination with Mass Spectrometry
Abstract
:1. Introduction
- Sampling: Crude oil samples are collected from different wells or sources for analysis.
- Extraction and Separation: The crude oil is processed to isolate the organic compounds from the sample with the gas chromatography technique.
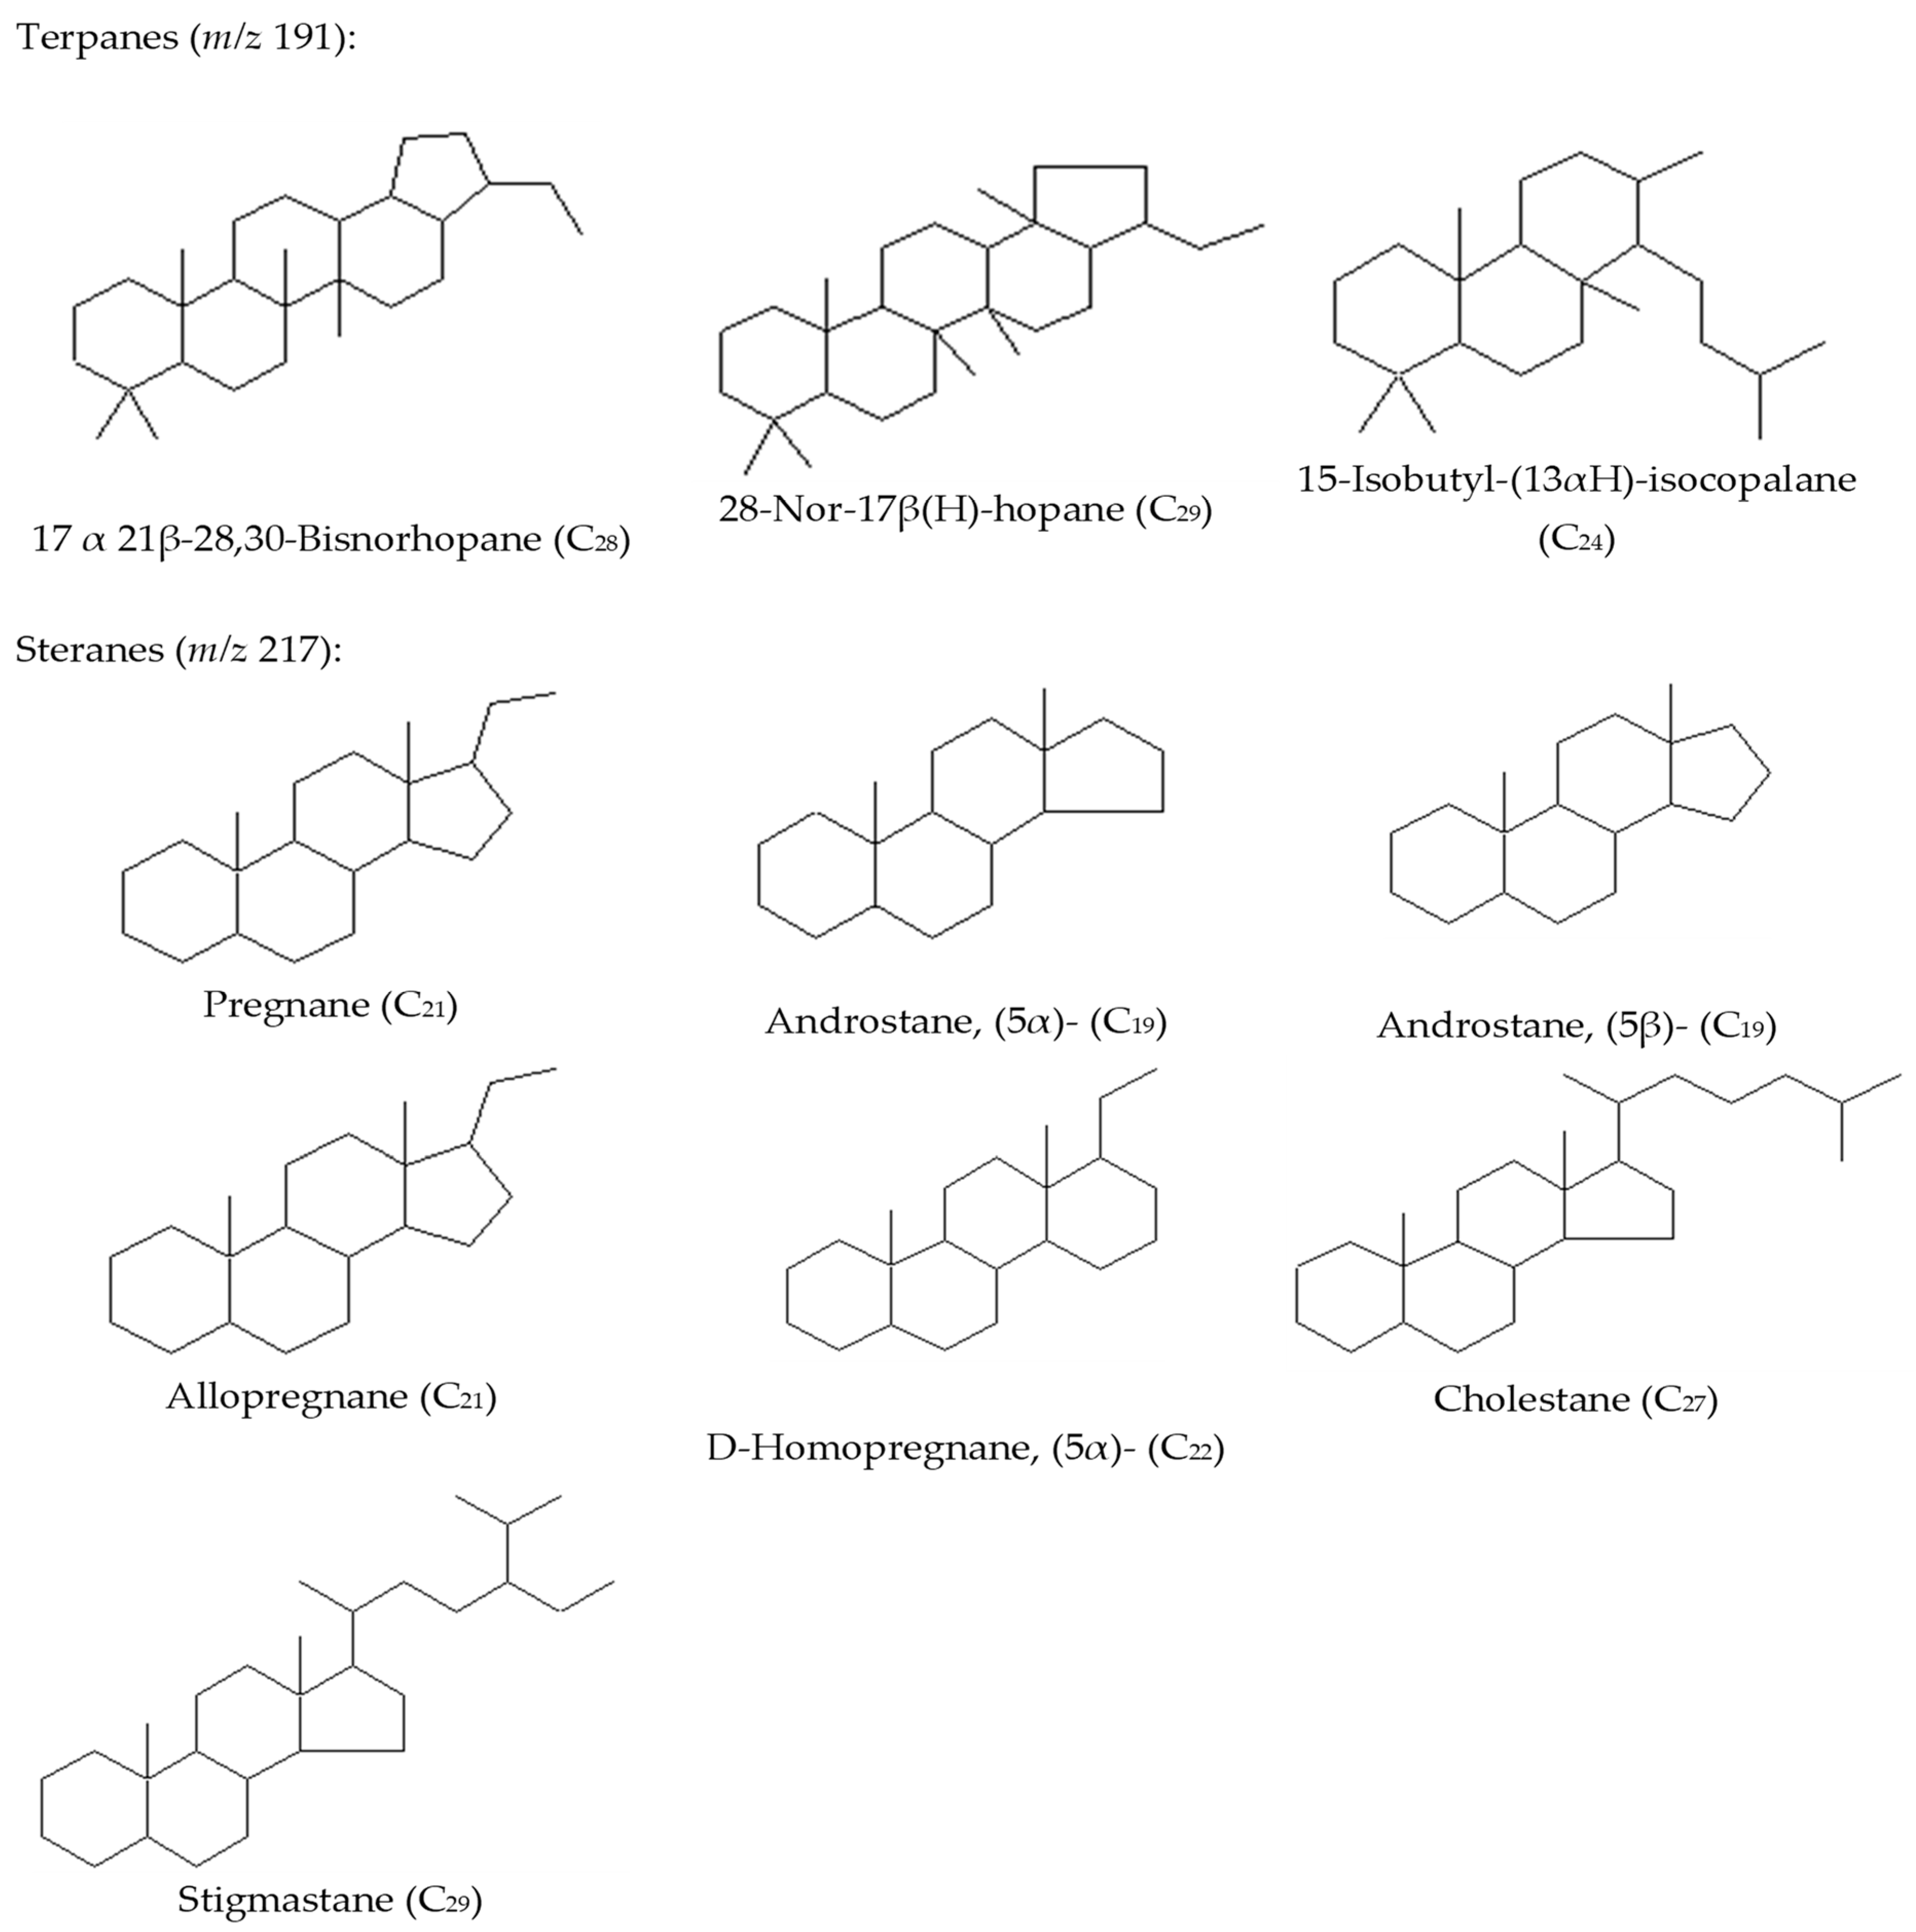
- Identification of Biomarkers: Various biomarkers are identified and analyzed including pristane (Pr), phytane (Ph), n-C17 alkane, n-C18 alkane, terpanes, pregnane, androstane, allopregnane, homopregnane, cholestane, and stigmastane.
- Comparative Analysis: The obtained biomarker data are compared to a database of known biomarker profiles of different crude oils to infer the possible origin and characteristics of the analyzed oil sample [10].
2. Materials and Methods
2.1. Selected Samples
2.2. Sample Separation
2.3. GC-MS Parameters for Biomarker Analysis
- 60 °C (held for 4 min) to 300 °C by a rate of 10 °C/min and held for 15 min.
- 50 °C (held for 5 min) to 250 °C by a rate of 10 °C/min, from 250 °C to 300 °C by a rate of 5 °C/min.
- 50 °C (held for 5 min) to 300 °C by a rate of 20 °C/min and held for 20 min.
3. Results and Discussion
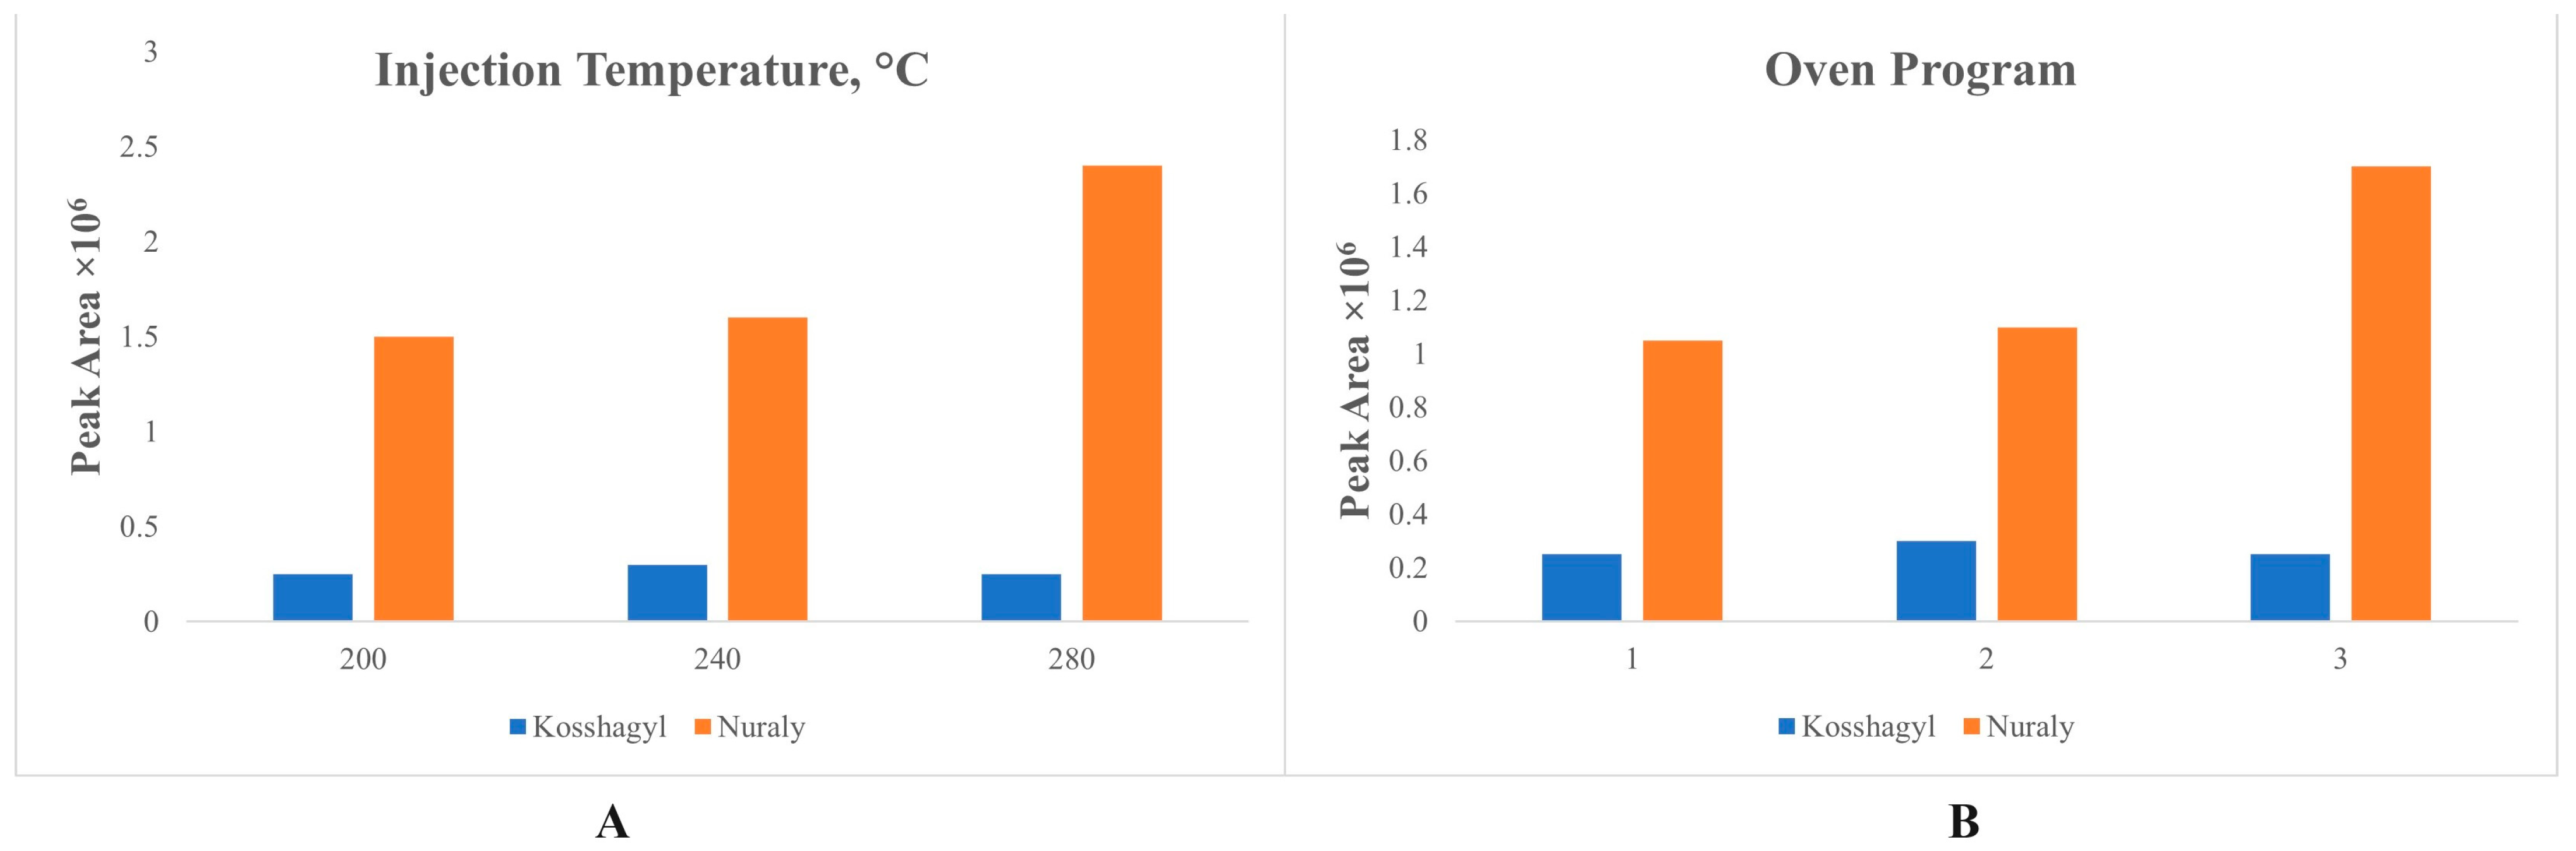
3.1. Optimal GC Parameters
3.2. Diagnostic Ratios of Biomarkers
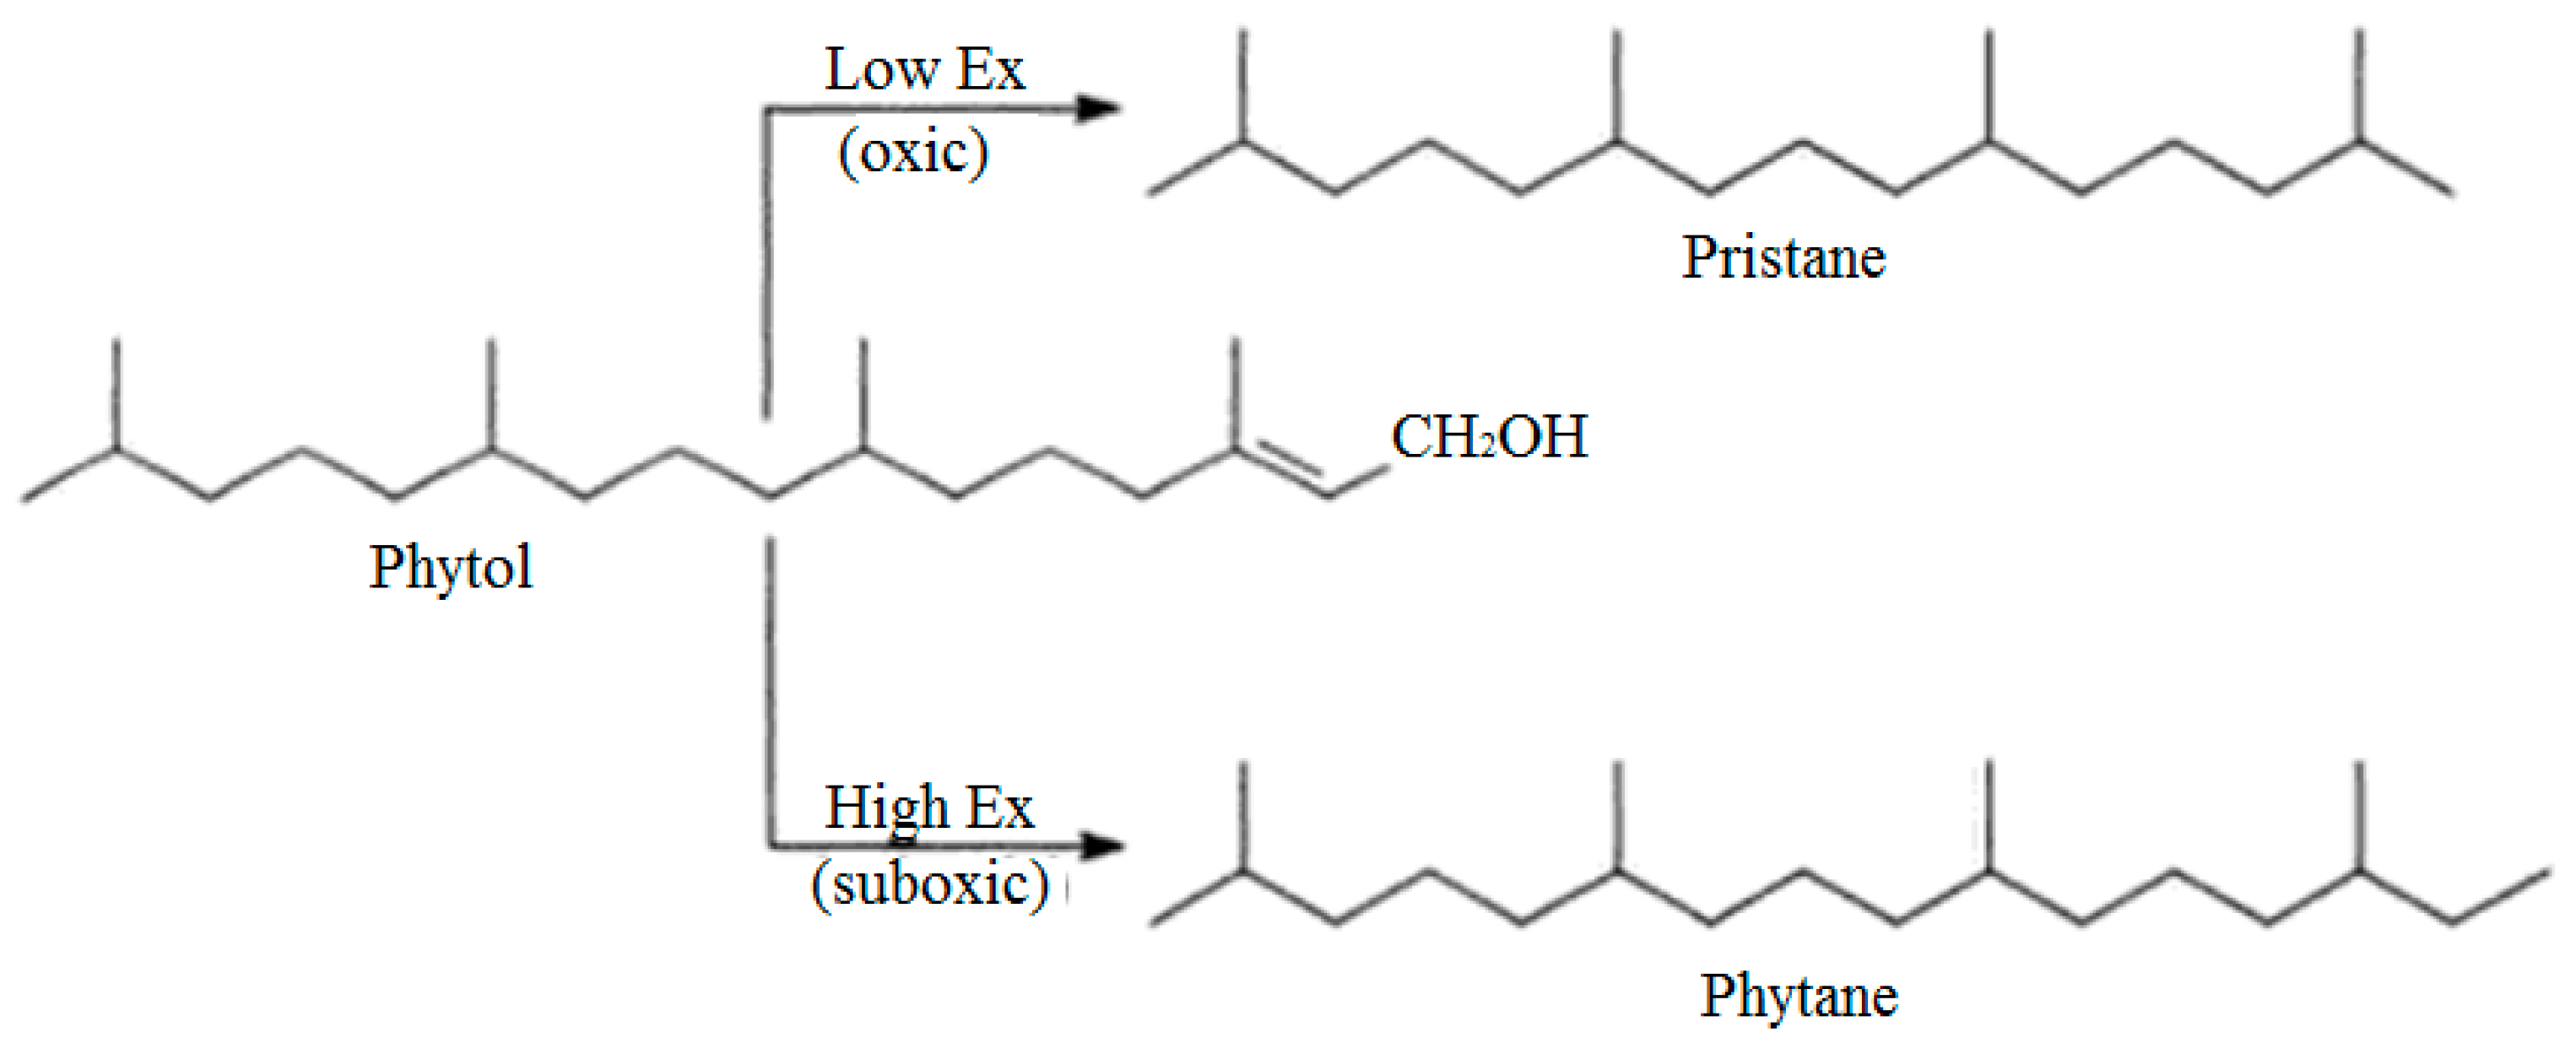
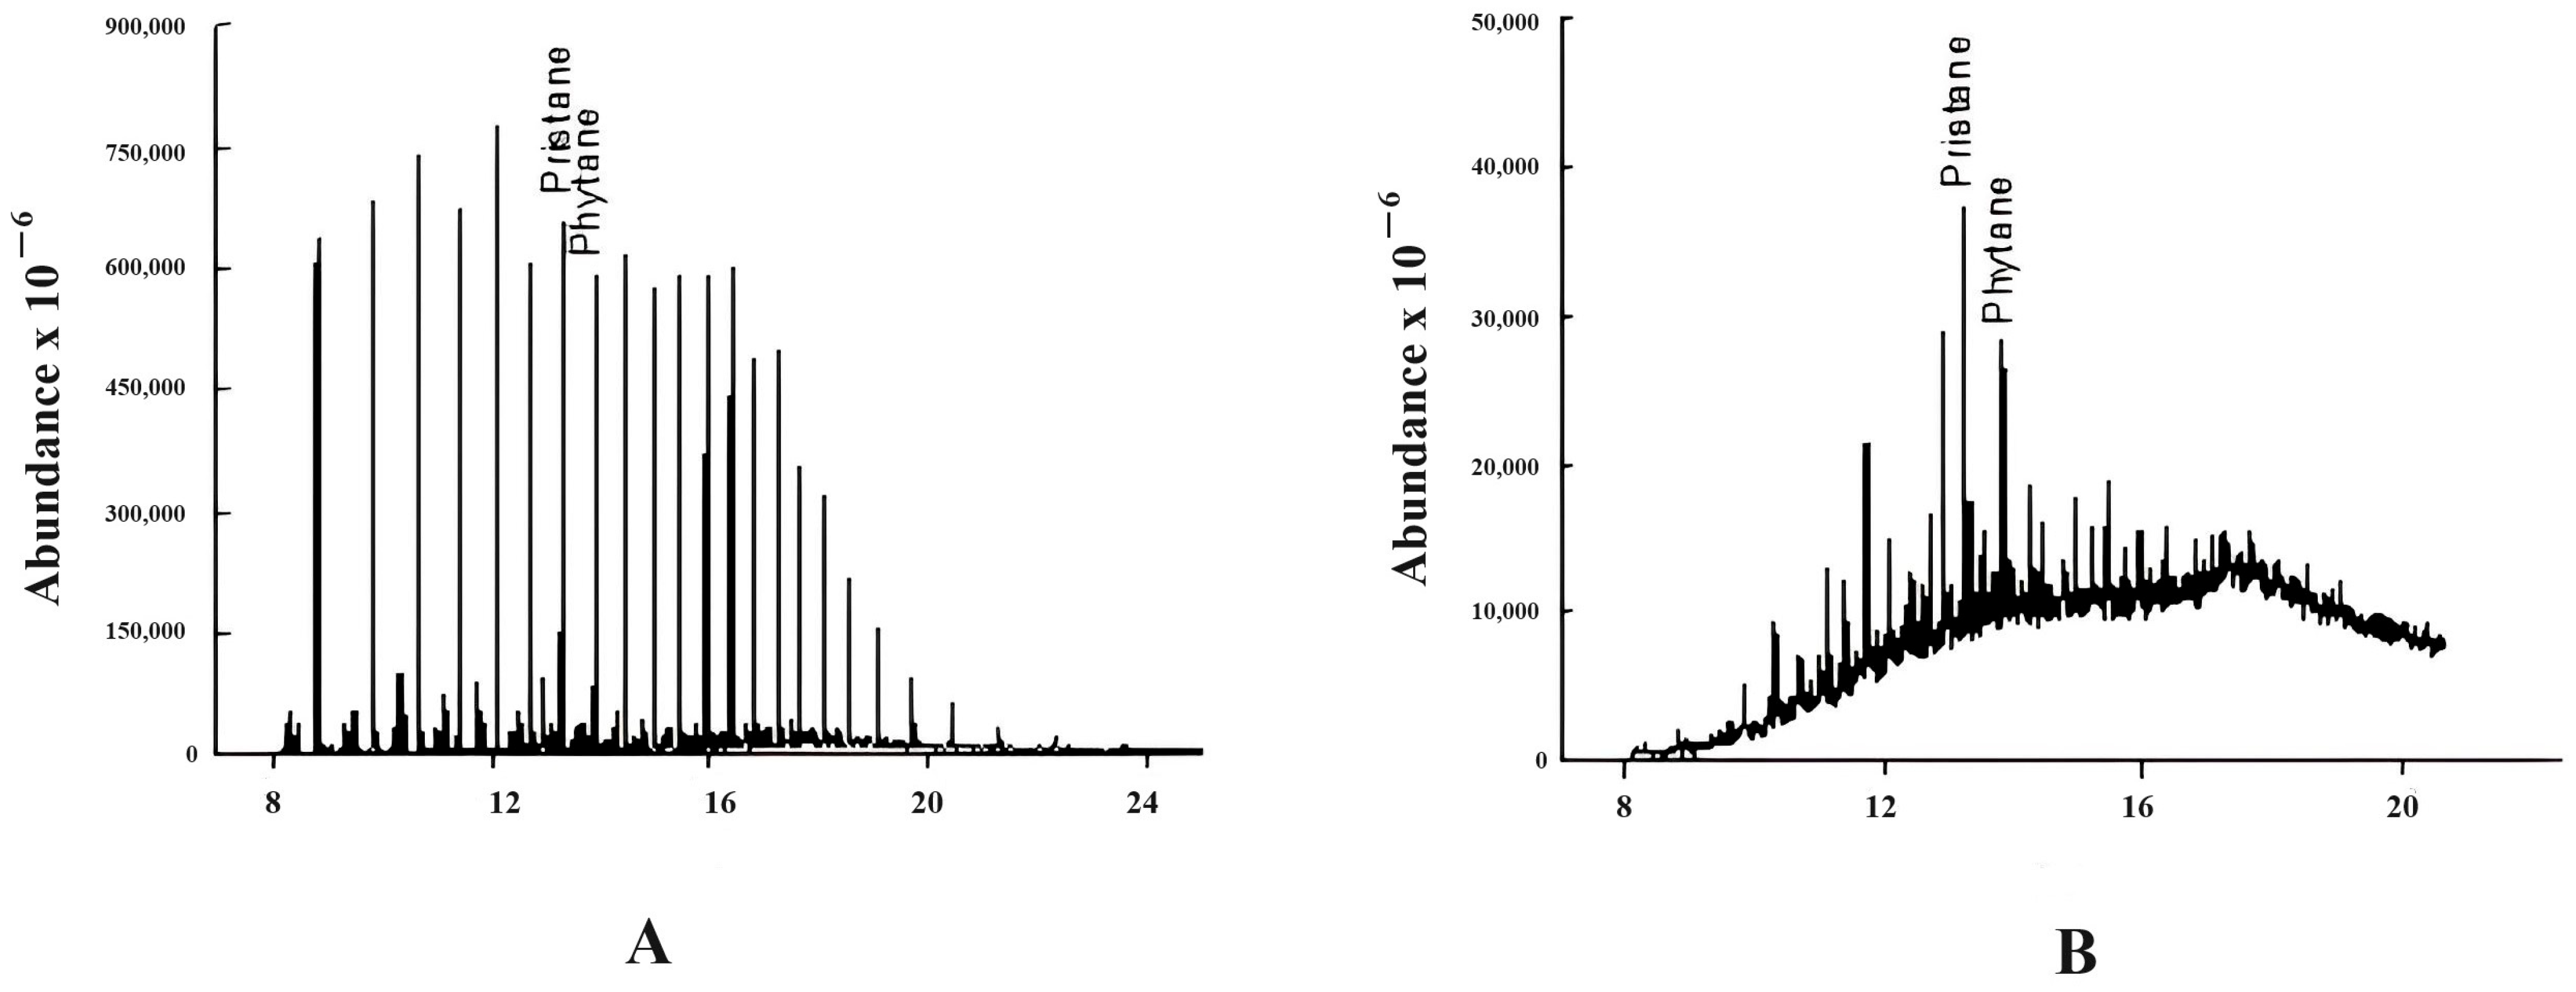
3.2.1. Pristane/Phytane (Pr/Ph)
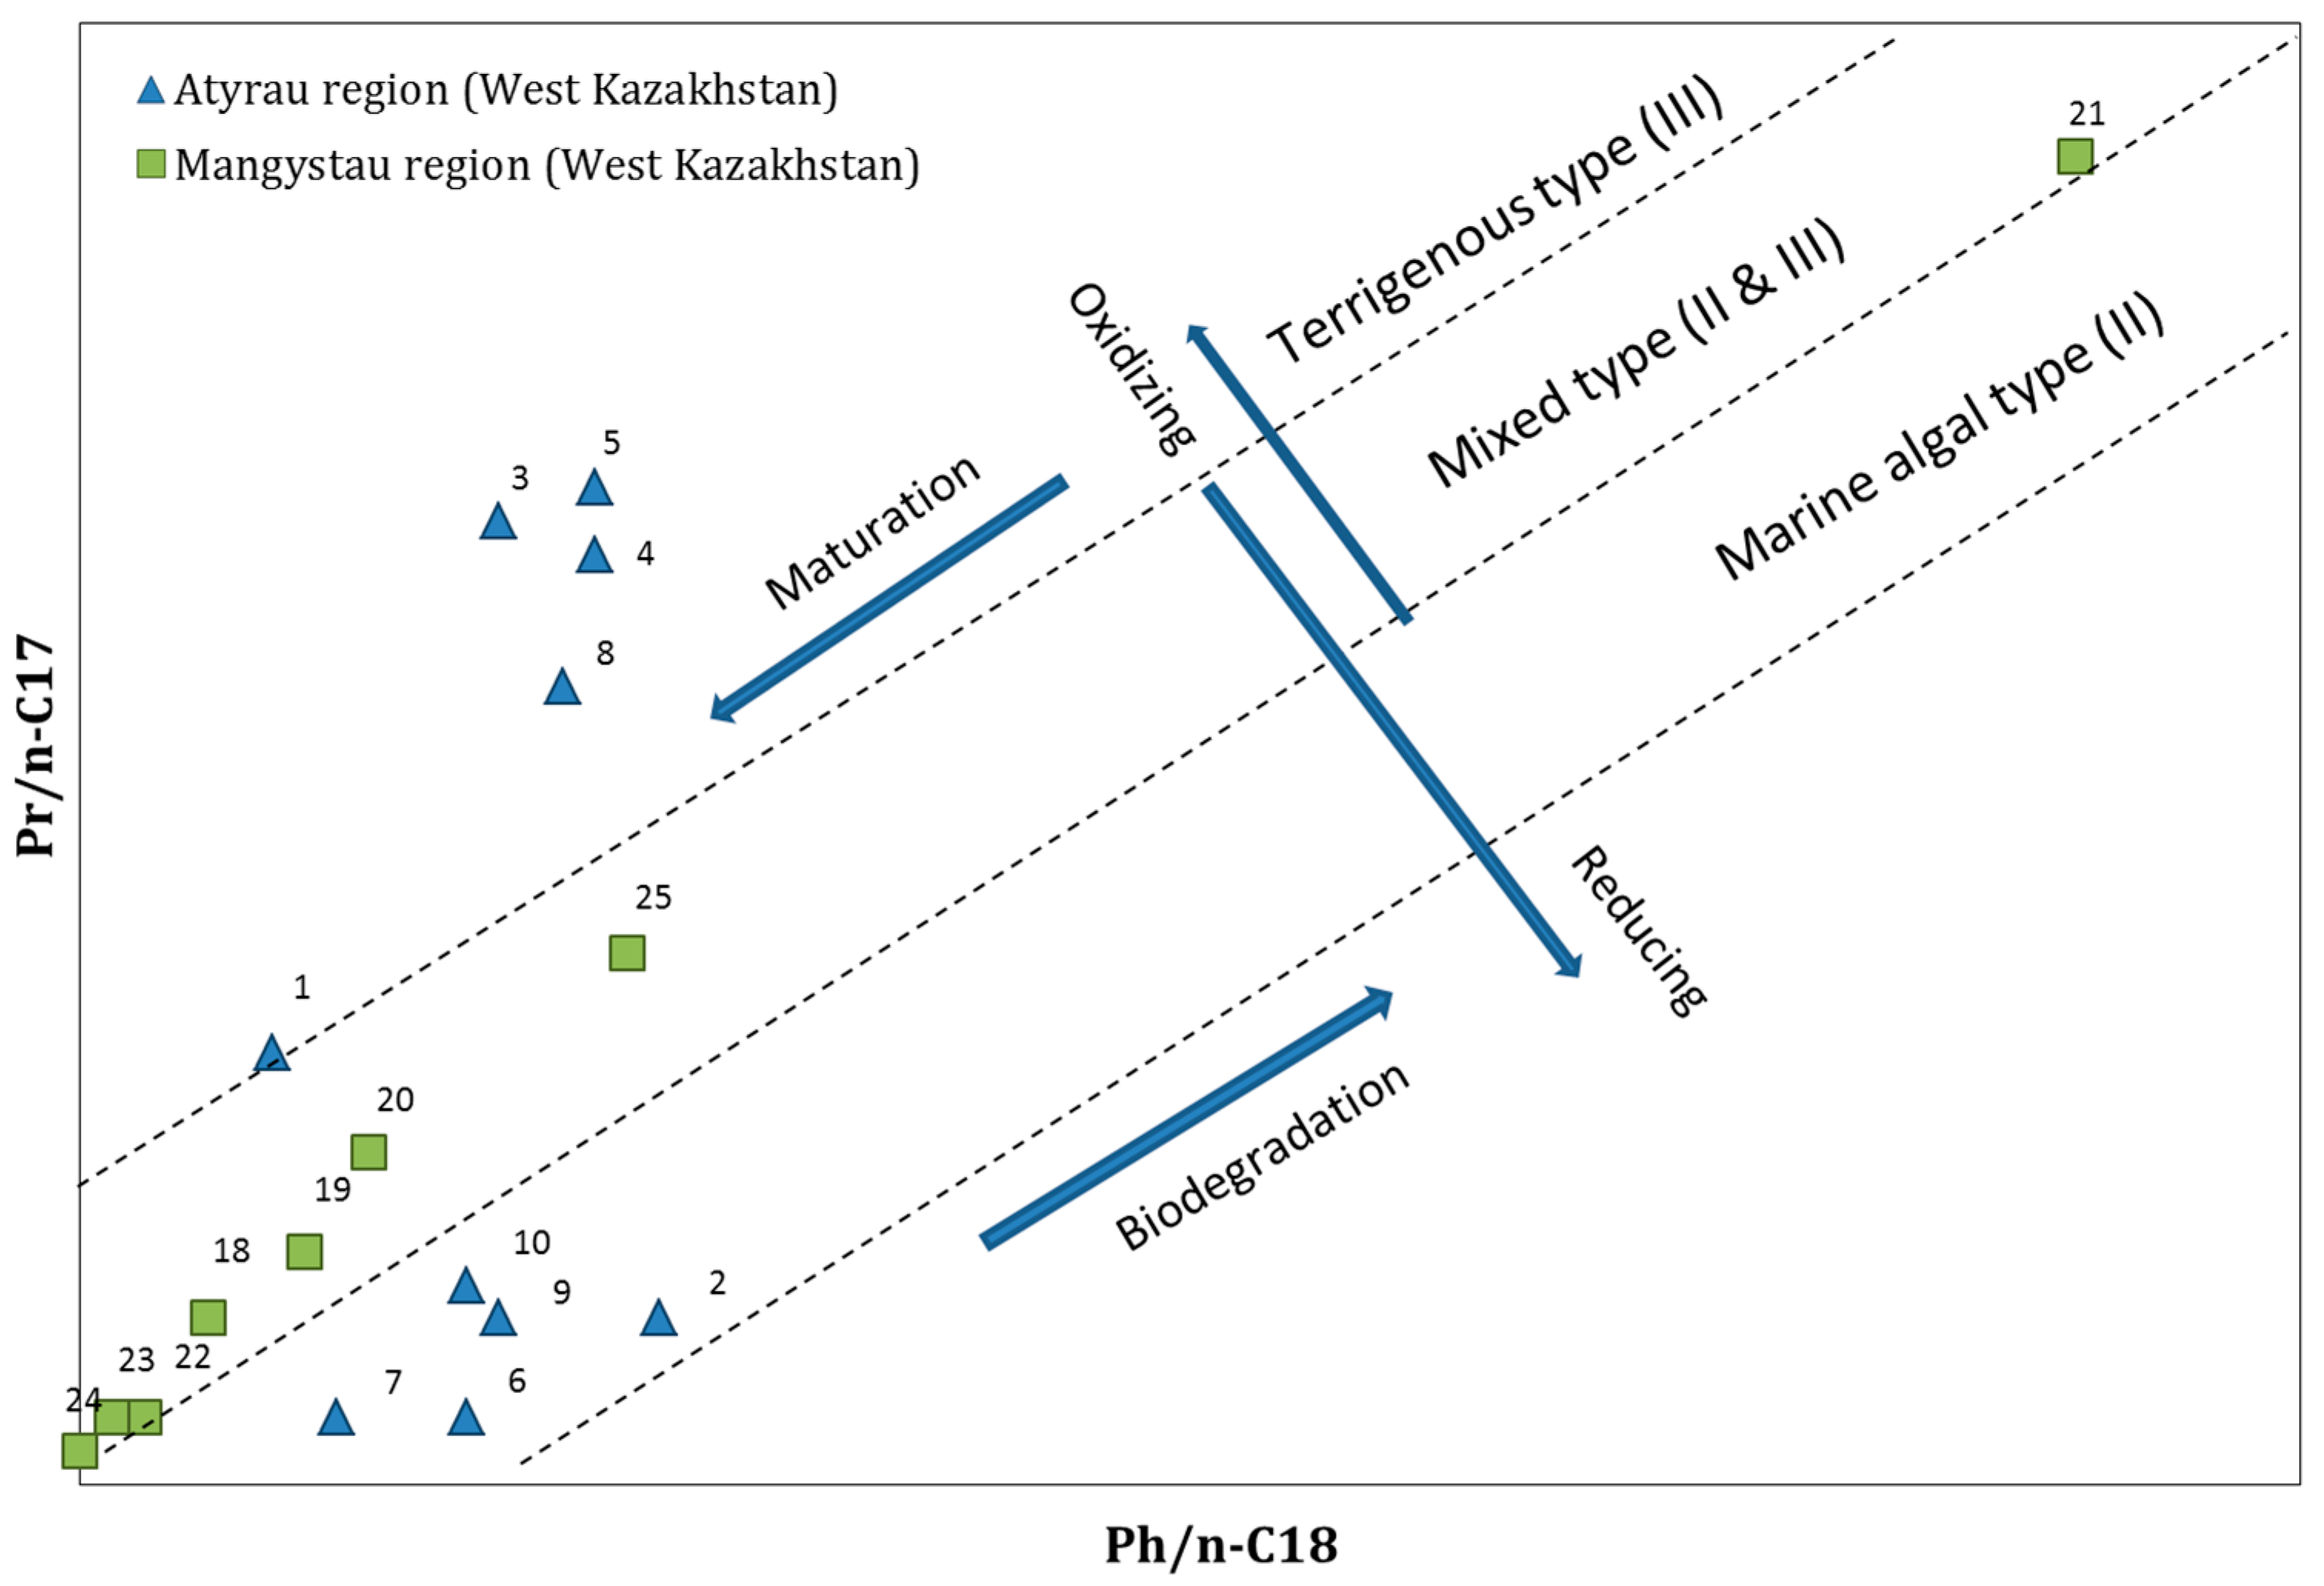
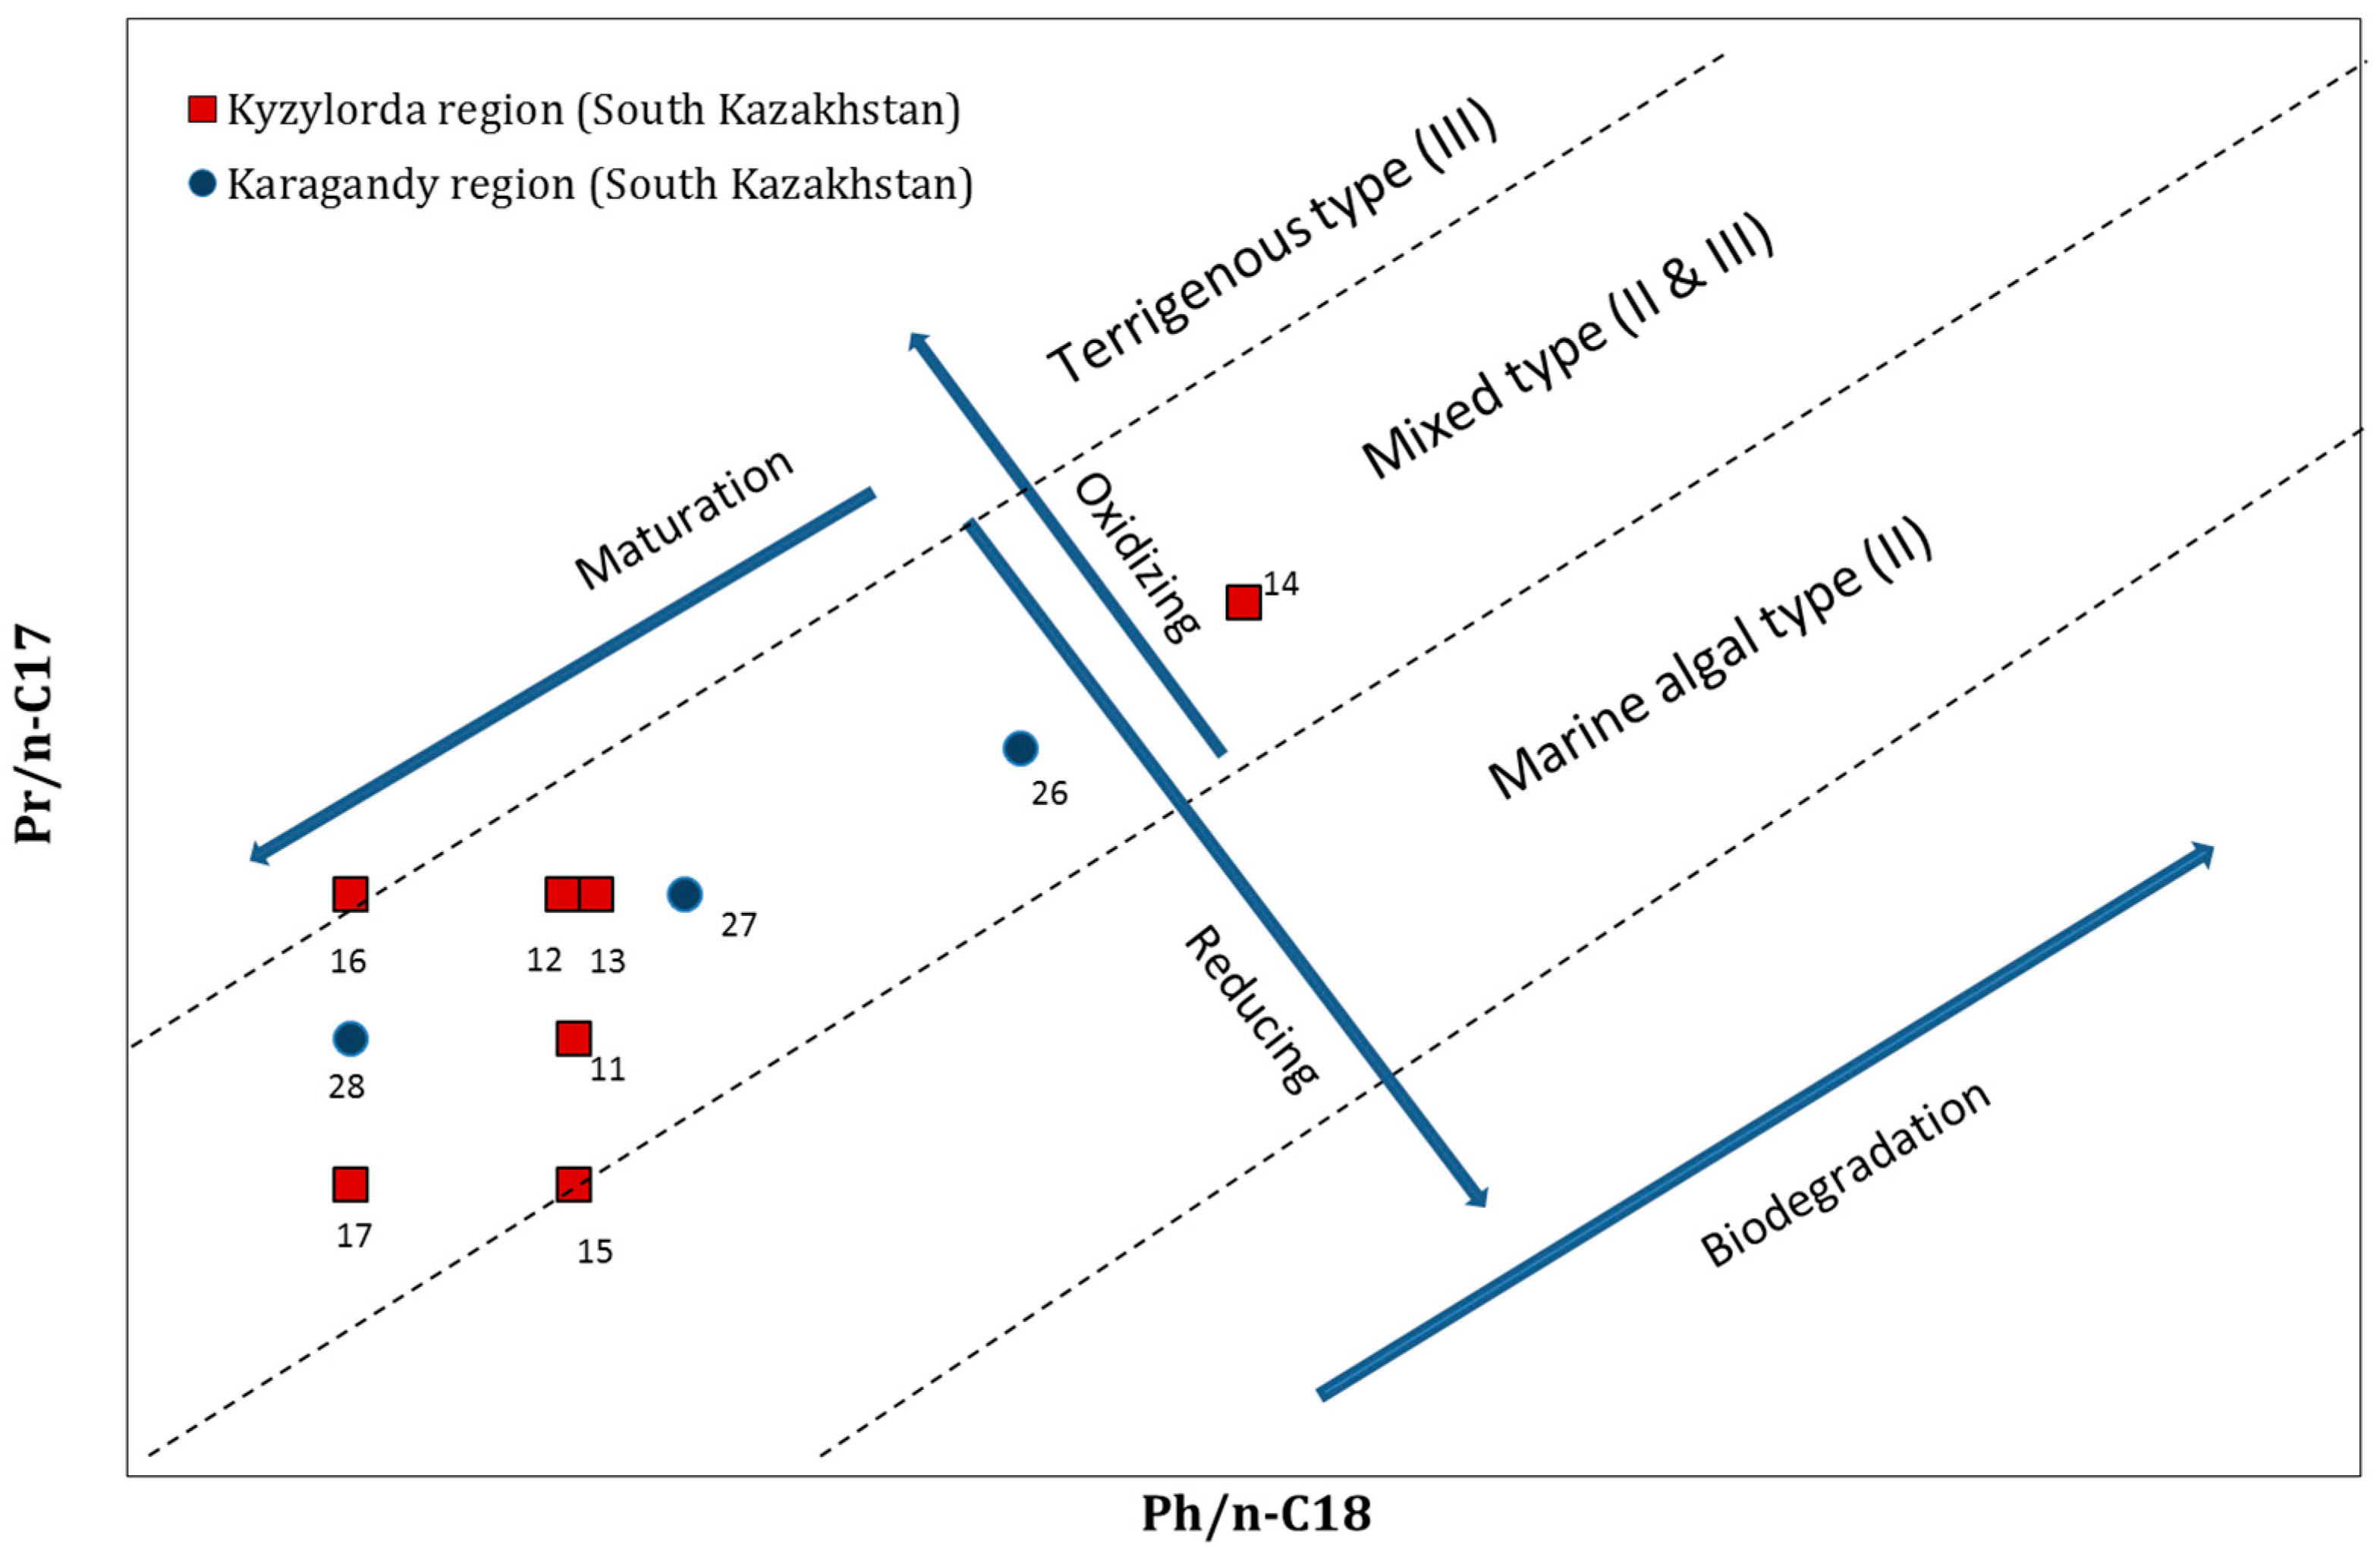
3.2.2. Isoprenoides/n-Alkanes Ratios (Pr/n-C17 and Ph/n-C18)
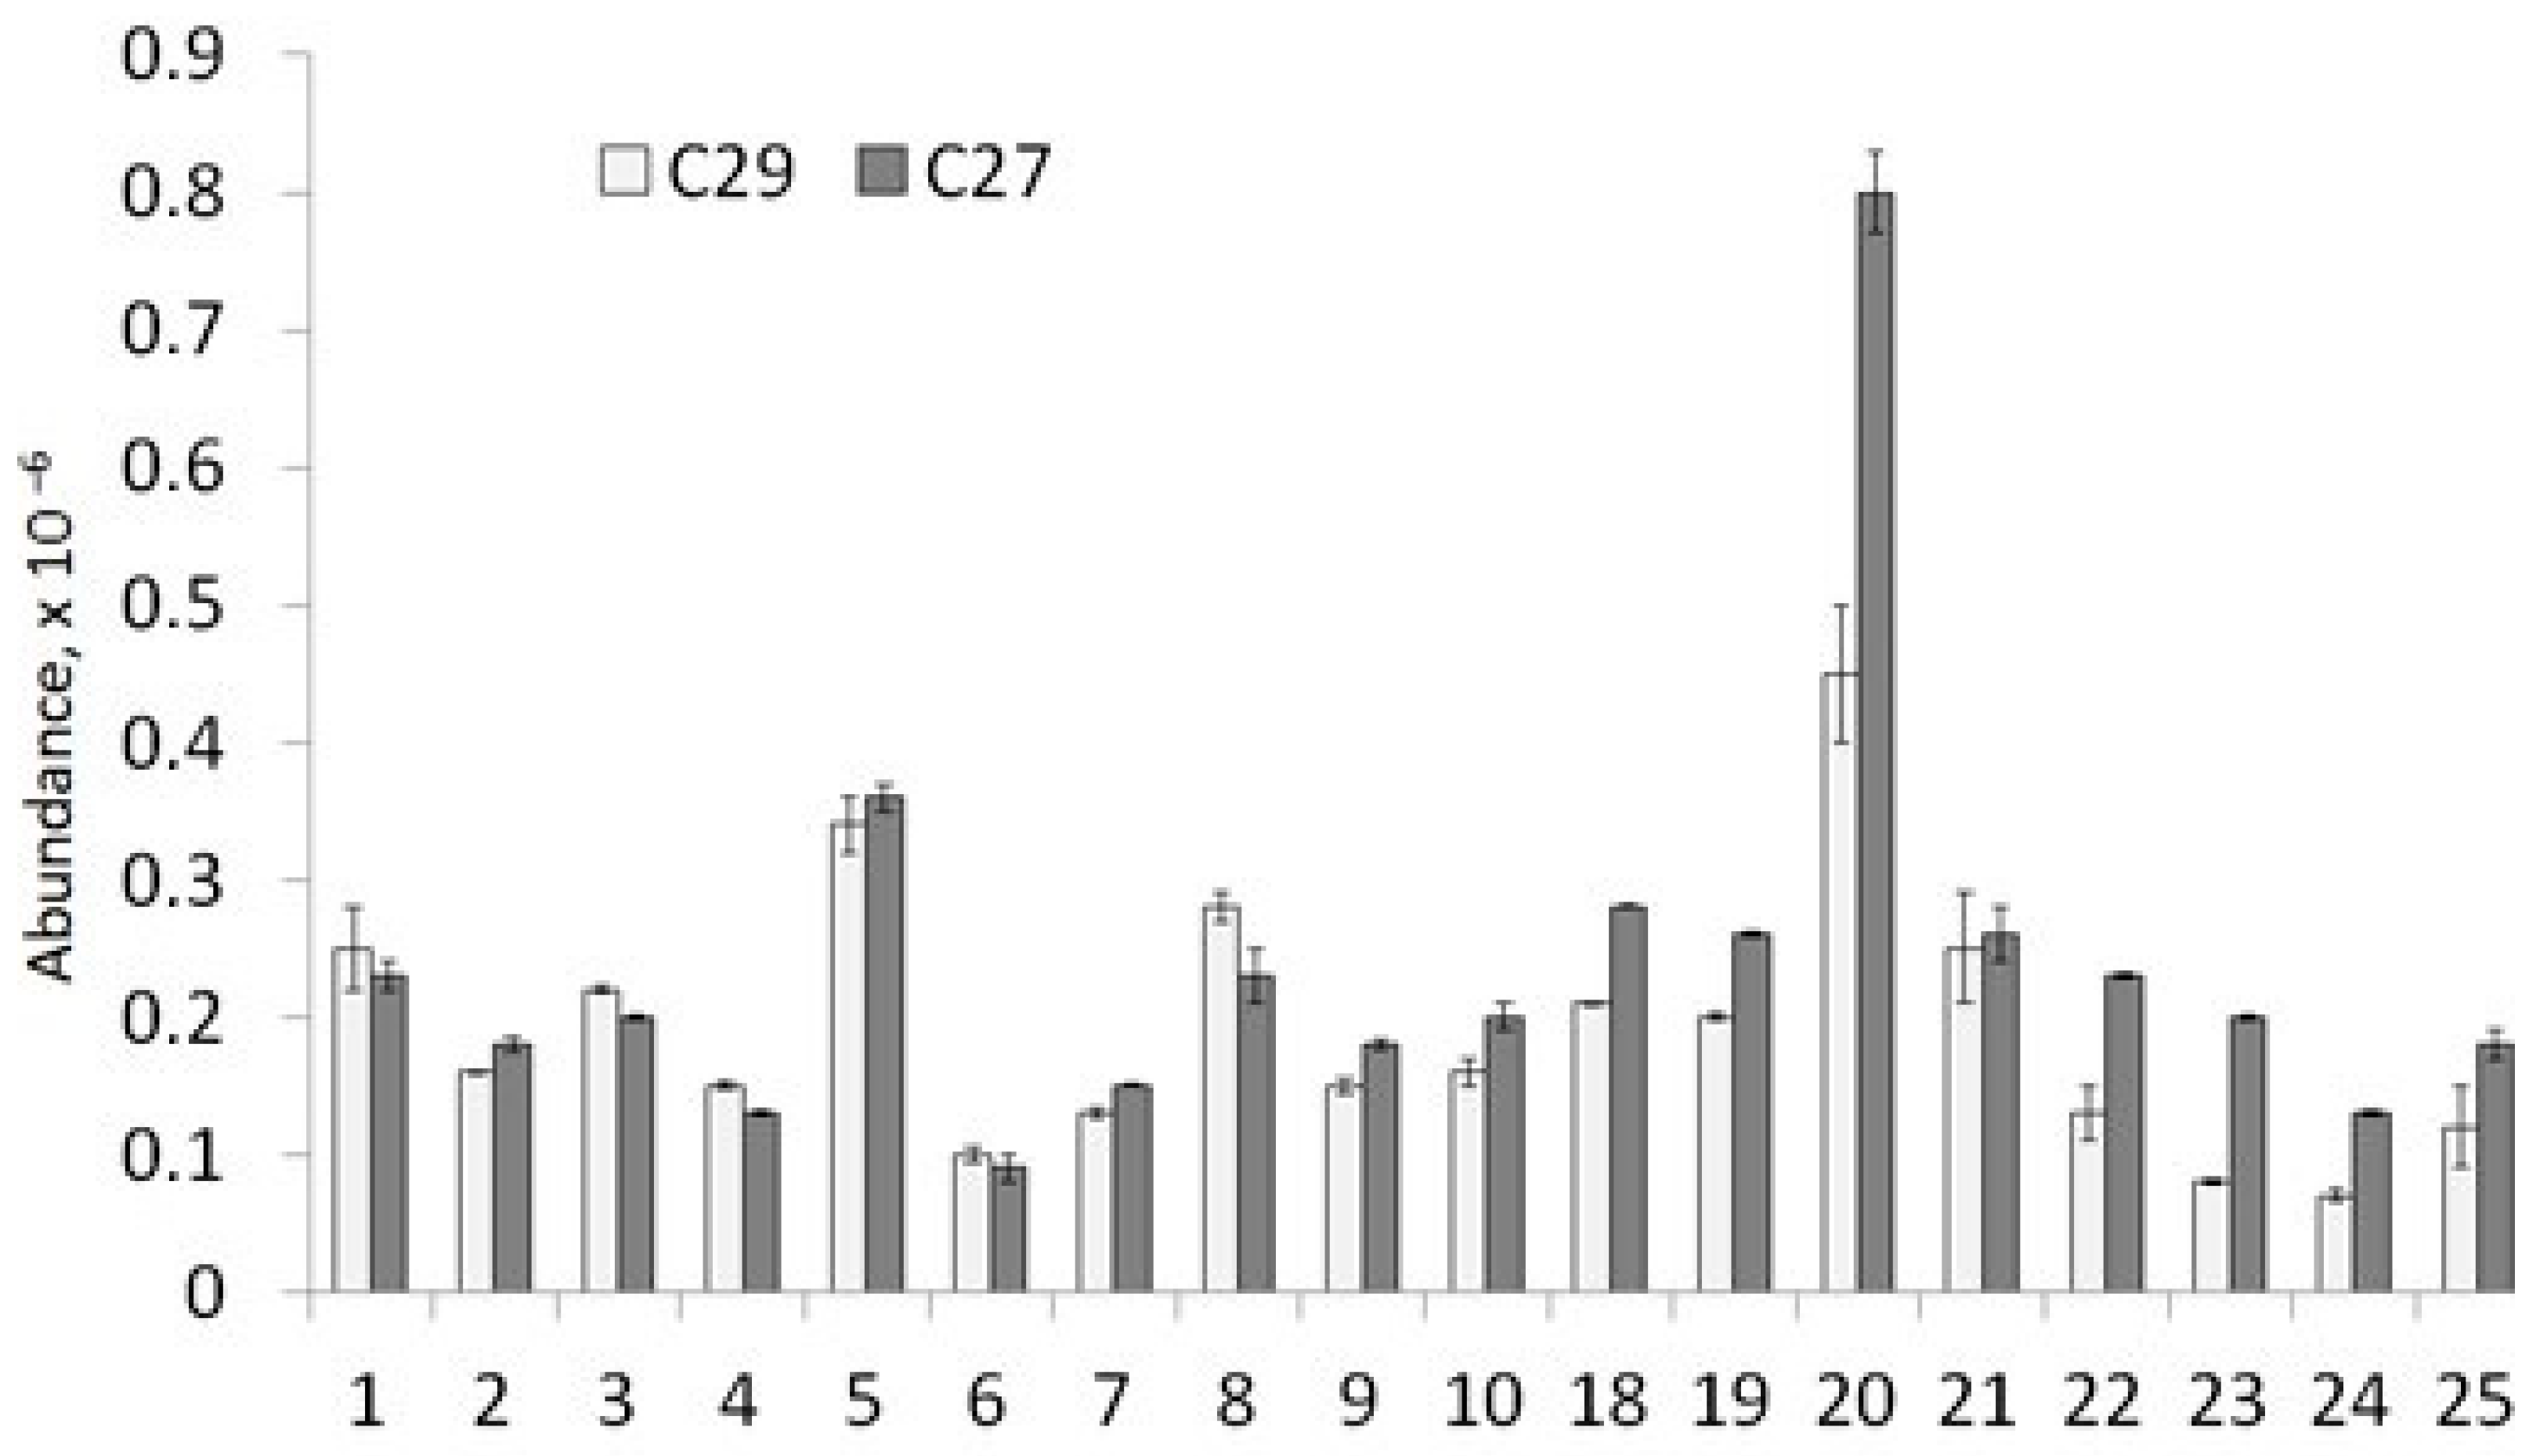
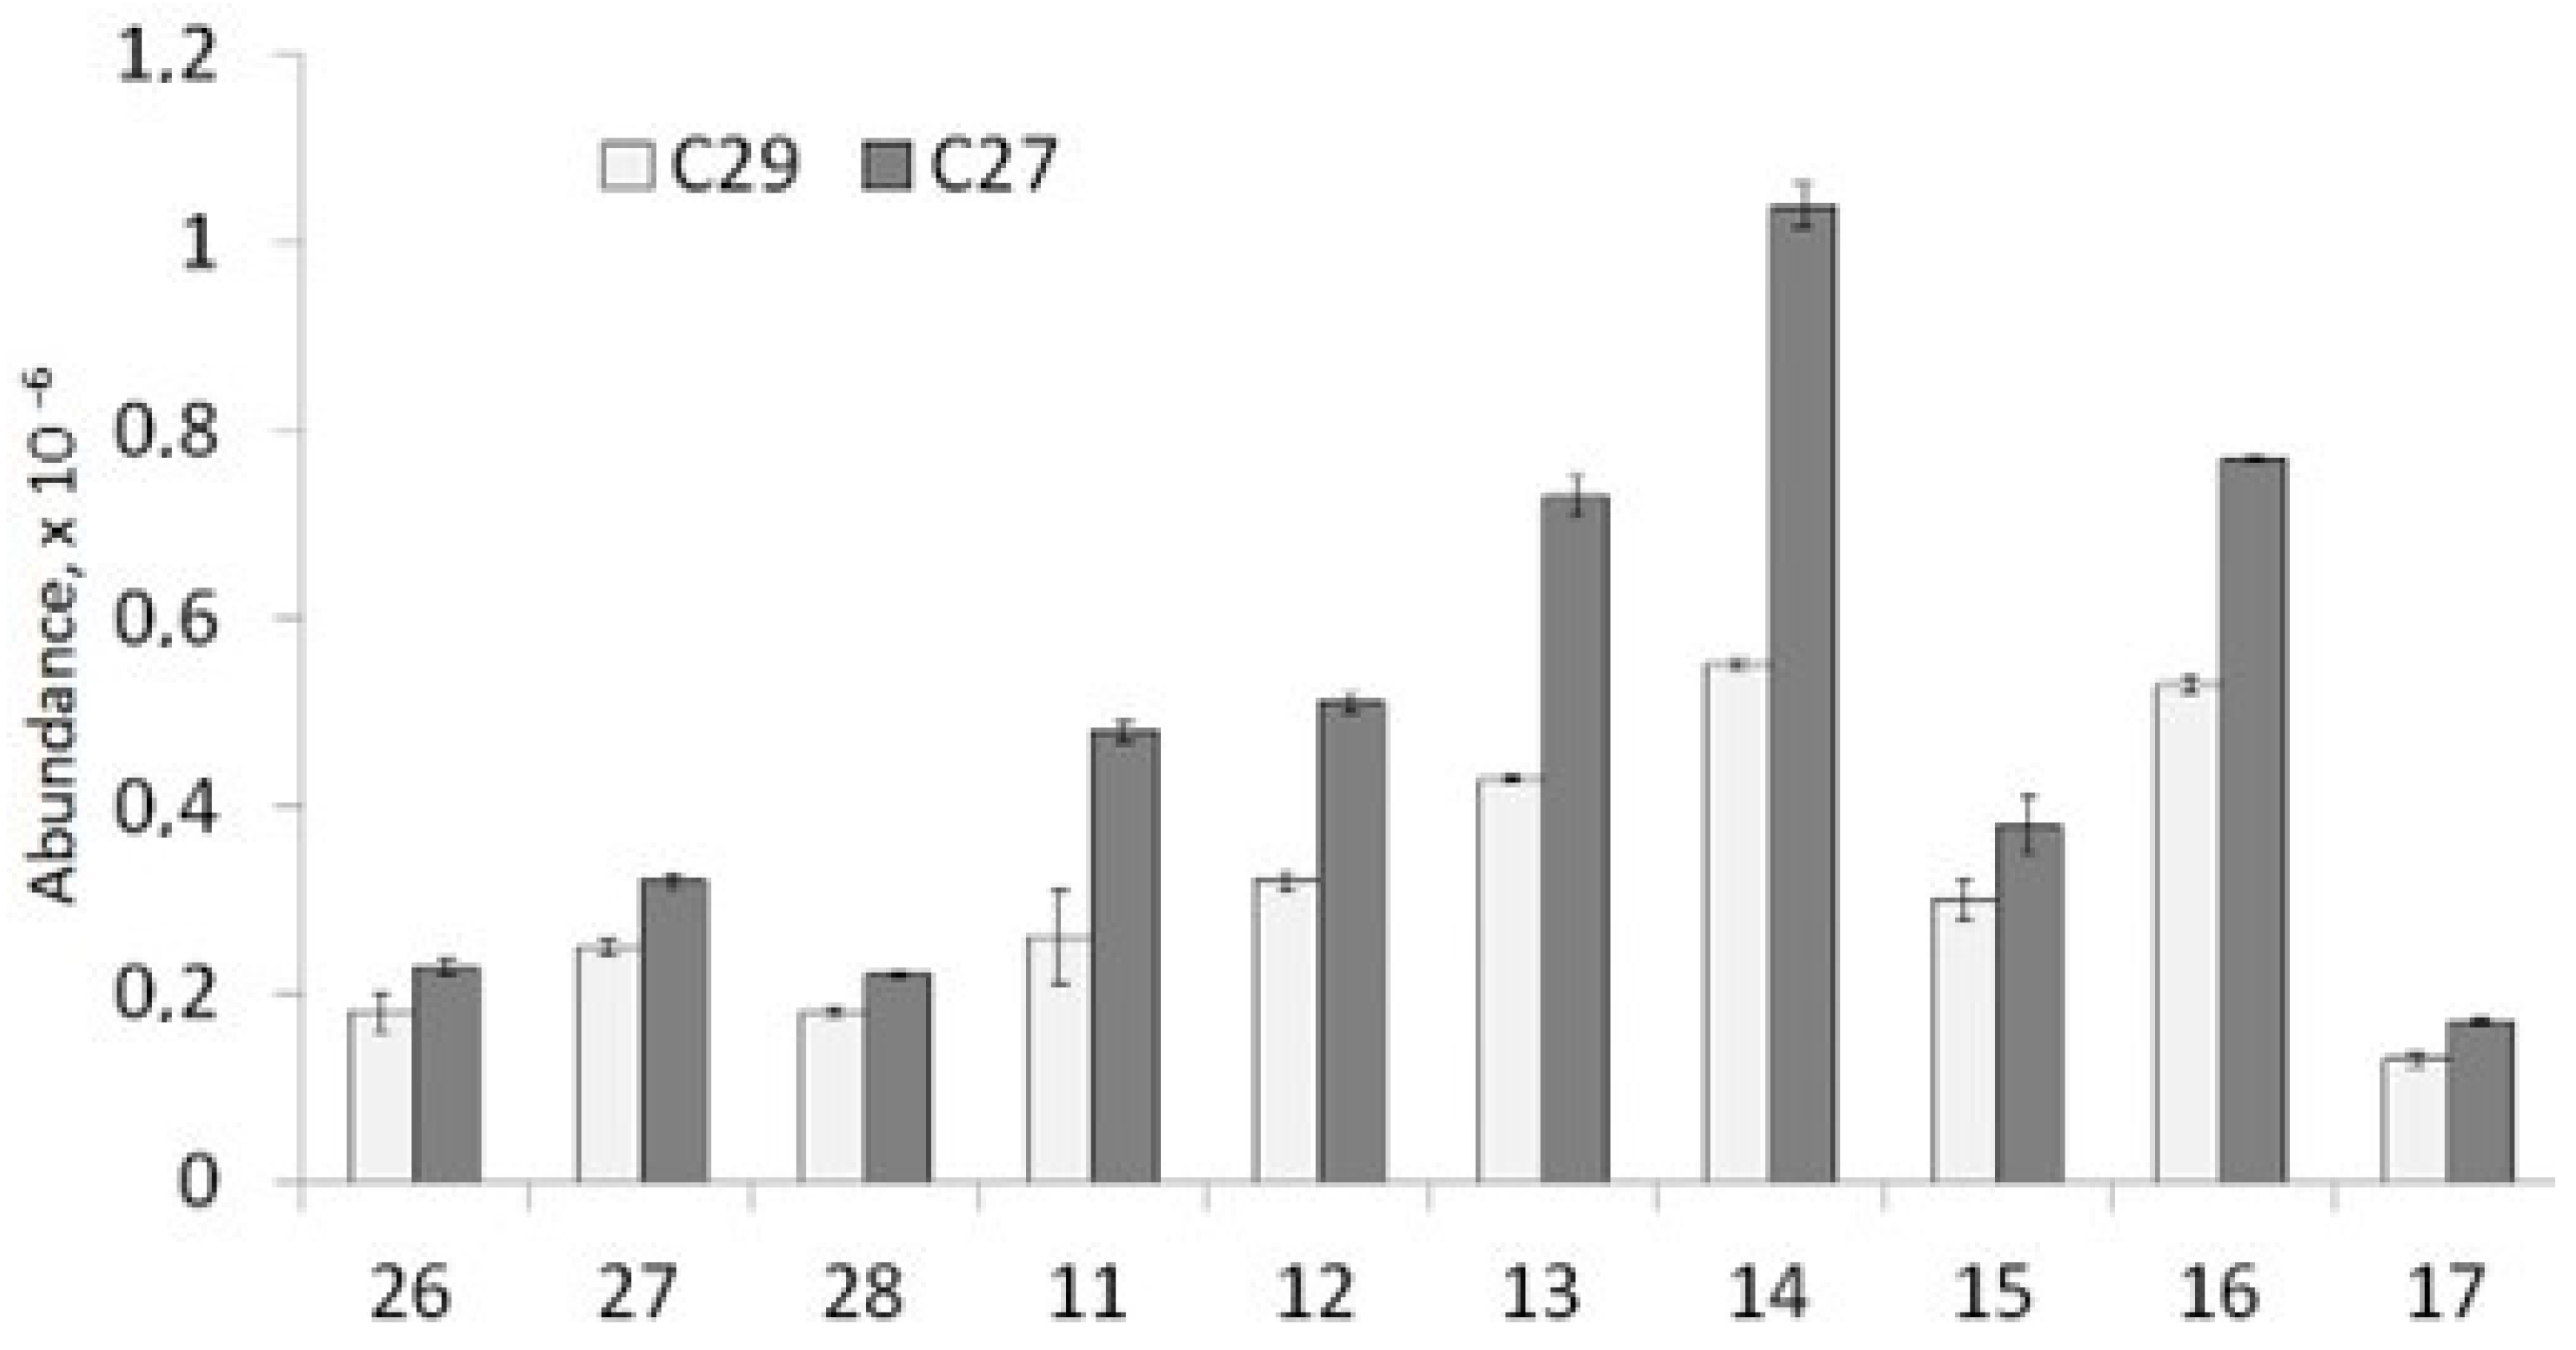
3.2.3. Sterane Distribution (m/z 217 and 218)
3.2.4. Tricyclic/Pentacyclic Terpanes (m/z 191)
4. Conclusions
Author Contributions
Funding
Data Availability Statement
Conflicts of Interest
Appendix A

| № | Analytes | Sample Preparation | Method | Parameters of GC | Country | Ref. |
|---|---|---|---|---|---|---|
| 1 | Hopanes, nor- hopanes, and steranes | Deasphalte samples in n-heptane. Saturated fraction by LC (alumina/silica + n-heptane). | GC-QMS | DB-5ms (60 m × 0.25 mm × 0.25 μm); Oven program: 70–110 °C, υ = 50 °C/min; υ = 5 °C/min to 295 °C. | France | [33] |
| 2 | Bicyclic alkanes, pentacyclic terpanes, and steranes | Deasphalte in n-heptane (reflux for 2 h with 100 mL of n-heptane for 2.5 g of crude oil). Column chromatography “aliphatic + aromatic” fraction. | GC-QMS | DBI (60 m × 0.32 mm × 0.25 μm); Oven program: for hopanes; 70–295 °C υ = 5 °C/min (15 min); Oven program: for steranes: 70–180 °C, υ = 10 °C/min, υ = 2 °C/min to 295 °C (25 min) | Brazil | [34] |
| 3 | Terpanes and Steranes | Crude oil (0.5 g) in 5 mL of n-pentane. Filter the supernatant using a syringe-operated (0.5 mm) Silica column + 2–3 mL of n-pentane. Concentrate the n-pentane fraction under a dry nitrogen jet to 0.5 mL and store for further analysis. | GC-MS | DB-5 (30 m × 0.32 mm × 0.25 μm); T(inj) 290 °C; Oven program: 50 °C (2 min)-300 °C, υ = 60 °C/min, 300 °C (18 min) | Kuwait | [35] |
| 4 | Terpanes and steranes | Alumina + n-hexane (saturated fraction). | GC-MS | SE-52 (60 m × 0.25 mm); T(inj) = 250 °C; Oven program: 40–300 °C υ = 3 °C/min | Spain | [36] |
| 5 | Stigmastane and hopanes | 10 g soil sample + silica column. Extract acetone + hexane (1:1) and a ratio of 1:2 (wt/vol) of solid to solvent. Shake 5 min, sonicate 15 min, shake 5 min, centrifuge 5 min. Fractionation (silica + hexane). | GC-MS | HP-5 (30 m × 0.25 mm × 0.25 μm); T(Inj) = 290 °C; Oven program: 40 °C (2 min)-140 °C, υ = 5 °C/min, υ = 10 °C/min to 300 °C (10 min) | Italy | [37] |
| 6 | Hopanes and steranes | Column chromatography 24–32 mg crude oil. The aliphatic fraction (n-hexane). The non-aliphatic fraction (dichloromethane and methanol (3:1, v:v). Concentrate in a stream of nitrogen, re-dissolve in 1 mL of n-hexane. | GC-QMS | ZB-5 (30 m × 0.25 mm × 0.1 µm); T(inj)-50 °C (0.2 min)-320 °C, υ = 150 °C/min (5 min); Oven program: for aliphatic fraction: 60 °C (4 min)-300 °C υ = 10 °C/min, 300 °C (15 min); Oven program: for non-aliphatic fractions: 80 °C (5 min)-370 °C υ = 10 °C/min, 370 °C (10 min) | Sweden | [38] |
| 7 | Hopanes and steranes | LC (saturated and aromatic hydrocarbons). | GC-FID GC-MS | SPB-1 (60 m × 0.53 mm); Oven program: 100–320 °C (20 min), υ = 3 °C/min. SE-54 (50 m × 0.25 mm); Oven program: 100–310 °C, υ = 4 °C/min. | Egypt | [39] |
| 8 | Hopanes, steranes, diasteranes, and triaromatic steroids | Water and sediment extracted of crude oil samples. Light-protected and stored at 4 °C until analysis 20–50 mg in 5 mL of CH2Cl2. | GC-MS | HP-5MS (60 m × 0.25 mm × 0.25 μm); T(Inj) = 300 °C; Oven program: 40 °C (1 min) to 300 °C, υ = 6 °C/min (30 min) | Spain | [40] |
| 9 | Sterane and tricyclic and pentacyclic terpanes (hopanes) biomarkers | Dissolve samples (1.6 mg) in 320 μL hexane. | GC-MS-MS | TR-1MS (60 m × 0.25 mm × 0.25 µm); T(inj) = 260 °C; Oven program: 50 °C (2 min)-150 °C υ = 20 °C/min, υ = 1.5 °C/min to 310 °C (17 min) | Germany | [41] |
| 10 | Dibenzothiophene, and hopanes, steranes | Dissolve in hexane 10 times Extract crude oil 100 mg in 10 mL of hexane using sonication. Centrifuge Dilute 10 times (1 mg/mL) | GC-QTOF | DB-5ms (30 m × 0.25 mm × 0.25 μm); Oven program: 50 °C (1 min)-320 °C (8 min) υ = 10 °C/min | Belgium, USA | [42] |
| 11 | Terpanes and steranes | Precipitate asphaltenes with n-heptane in a 1:40 v/v ratio. Separate into saturated, aromatic, and resin fractions by LC. Elute using a column filled with silica-alumina (aliphatics/n-hexane; aromatics/toluene;resins/toluene/methanol (70:30 v/v)). | GC-MS | HP-5ms (30 m × 0.25 mm); Oven program: 260–280 °C υ = 4 °C/min | Venezuela | [43] |
| 12 | Adamantanes and their derivatives | Oils were applied on a platinum tape and were subjected to thermal desorption at 350 °C for 20 s. | GC-MS | HP-5ms (30 m × 0.25 mm × 0.25 μm); Oven program: 40 °C (4 min)-290 °C (10 min) υ = 5 °C/min. | Russia | [44] |
| 13 | Hopane and sterane | Place samples in 40 mL clear vials. 25 mg oil in 10 mL hexane. Add 0.5 g of Chem-Tube-Hydromatrix and vortex the samples for 5 min and allow to settle at room temperature for 4 h. Filter and separate in silica gel. Vortex for 2 min and allow to settle for 2 min. | GC-MS | Hopane analysis: DB-EUPAH (20 m × 0.18 mm × 0.14 μm); Oven program: 50 °C (2 min)-310 °C (15 min) υ = 6 C/min. T(inj) = 280 °C; m/z 191. Sterane analysis: HP-5ms (60 m × 0,25 mm × 0.25 μm); Oven program: 50 °C (1 min)-150 °C (2 min) υ = 70 °C/min, υ = 5 °C/min to 310 °C (15 min). | USA | [45] |
| 14 | Saturated hydrocarbons, Steranes and terpanes, 25-Norhopanes, Aromatic hydrocarbons, and Triaromatic steroid hydrocarbons | Remove asphaltenes with n-hexane followed by filtration. Separate into saturate, aromatic, and polar fractions (silica and alumina (4:1, v/v) + n-hexane, Dichloromethane, and methanol, respectively). | GC-MS | HP-5 (30 m × 0.25 mm × 0.25 μm); Oven program: 80 °C (1 min)-280 °C (30 min) υ = 3 °C/min | China | [46] |
| 15 | Triterpanes oleananes, bicadinanes, hopanes, and steranes | Precipitate asphaltenes with n-hexane 50 times. Separate maltenes into saturated hydrocarbons, aromatic hydrocarbons, and resins fraction Remove n-alkanes from saturated fraction | GC-QMS | Rtx-5 (30 m × 0.25 mm × 0.25 μm); T(inj) = 300 °C; Oven program: 100 °C (3 min)-200 °C υ = 25 °C/min, υ = 2 °C/min to 300 °C (3 min) | India | [47] |
| 16 | Hopanes, steranes and diasteranes, and triaromatic steroids biomarkers | Oil samples were water and sediment extracted following an ASTM D2709—16 guide, light-protected, and stored at 4 C until analysis. | GC-MS | HP-5ms (60 m × 0.25 mm × 0.25 μm); Oven program: 40 °C (1 min)-300 °C, υ = 6 °C /min (30 min), Tinj. = 300 °C. | Spain | [48] |
| 17 | Hopanes and steranes and terpanes | Bitumen extractions were performed on 56 samples using a Soxhlet apparatus for 72 h with a dichloromethane/methanol mixture (93:7 v/v). | GC-MS | HP-5ms (30 m × 0.25 mm × 0.25 μm); Oven program: 50 °C (1 min)-100 °C, υ = 20 °C/min, 100-310 °C, υ = 3 °C/min (18 min) | China | [49] |
| 18 | Hopanes, steranes | The oil samples were deasphaltened by hexane. Then fractionated on a silica: alumina column using hexane, benzene, and methanol. | GC-MS | HP-5ms (60 m × 0.25 mm × 0.25 mm); Oven program: 50 °C (1 min)-120 °C, υ = 20 °C/min, 120-250 °C, υ = 4 °C/min, to 310 °C (3 °C/min, 30 min) | China | [50] |
| 19 | Hopanes, steranes | Extract by chloroform for 72 h by means of Soxhlet extraction. | GC-MS | HP-5 (30 m × 0.25 mm × 0.25 μm); T(inj) = 280 °C; Oven program: 80–290 °C at 4 °C/min (30 min) | China | [51] |
| 20 | Isoprenoid, Moretanes, Bisnorhopanes, Gammacerane, Pentacyclic extended hopane | Separated into saturate, aromatics and resins by column chromatography (1:1 alumina:silica gel). Elution with n-heptane, toluene, and chloroform. | GC-FID GC-QMS | SPB-1 (60 m × 0.53 mm); Oven program: 100–320 °C at 3 °C/min (20 min). SE 54 (50 m × 0.25 mm) Oven program: 100–310 °C at 4 °C/min | Egypt | [52] |
| 21 | Phenanthrene, anthracene, methyl-phenanthrene, methyl-anthracene | Extract 0.15 g oil samples with 10.0 mL n-hexane/dichlormethane (1:1, v/v), add about 1.00 g of anhydrous sodium sulfate. Vortexed for 30 s. Centrifuge at 3000 r.p.m. 5 min. Transfer 1.0 mL of the supernatant to a vial (silica gel. + n-hexane/dichloromethane (1:1, v/v). Vortex and centrifuge an aliquot of 1.0 mL analysis. | GC-MS | HP-5MS (60 m × 0.25 mm × 0.25 μm); T(inj)= 290 °C; Oven program: 60–300 °C υ = 6 °C/min (30 min). | China | [53] |
| 22 | n-alkanes, isoprenoids, and steranes and triterpanes | The samples were fractionated into saturated hydrocarbons, aromatic hydrocarbons, and polar compounds by column chromatography. For aliphatic fraction: hexane. For aromatic fraction: 1:1 (v/v) hexane/dichloromethane. | GC-MS-MS | ZB-5 (30 m × 0.25 mm × 0.10 μm); Oven program: 70–100 °C (30 °C/min) 100–308 °C (4 °C/min, 8 min) | Serbia | [54] |
| 23 | Pentacyclic terpanes | Oil samples were mixed with a solution of dichlormethane. | GC-MS | DB-5 (30 m × 0.25 mm × 0.25 μm); Oven program: 50–300 °C, (5 °C/min, 20 min) | Germany | [55] |
| 24 | Steranes, diasteranes, and pentacyclic triterpanes | The crude oils were diluted in dichloromethane prior to analysis. | GC-MS | MXT-5 (60 m × 0.25 mm × 0.25 μm); Tinj. = 300 °C; Oven program: 50 °C (3 min)-150 °C υ = 20 °C/min 150–350 °C, (2 °C/min, 25 min) | Mexico | [56] |
| 25 | Terpanes and steranes, bicyclic sesquiterpanes, and diamondoids | 16 mg of each oil in hexane. The oil solution was mixed with 100 mL of o-terphenyl and d50-tetracosane (200 mg/mL each) and 100 mL of mixture of deuterated naphthalene, acenaphthene, phenanthrene, benz[a]anthracene, and perylene (10 mg/mL each). | GC-MS | DB-5ms (30 m × 0.25 mm × 0.25 μm); Oven program: 50 °C (2 min)-310 °C υ = 6 °C/min (18 min) | Canada | [57] |
| 26 | Steranes and terpanes | Oil samples were extracted in a Soxhlet extractor using dichloromethane (DCM): methanol (93:7, v:v) for 72 h. Separated into maltene and asphaltene fractions using a deasphaltening procedure. | GC-MS | HP-1 (30 m × 0.25 mm × 0.25 μm); Tinj. = 300 °C; Oven program: 40–300 °C, υ = 4 °C/min (20 min) | China | [58] |
| 27 | Pristanes and phytanes | A total of 461 samples were subjected to bulk geochemical analysis. | GC-MS | RTX-1 (30 m × 0.32 mm × 0.25 μm); Oven program: 60-320 °C, υ = 4 °C/min | Colombia | [59] |
| 28 | Sterane, terpane, and aromatic biomarker distributions | Oil samples were subjected to asphaltene precipitation using excess n-hexane. The maltene was fractionated into saturated and aromatic hydrocarbons by column chromatography with activated silica gel using hexane, dichloromethane, and dichloromethane/methanol (50:50). | GC-MS | J&W DB5 (50 m × 0.2 mm × 0.11 µm); Oven program: 150–325 °C, υ = 2 °C/min | Egypt | [60] |
| 29 | Tricyclic terpanes, gammacerane, dibenzothiophene, steranes, and diasteranes, | The oils were deasphalted using n-hexane, and fractionated using column chromatography. | GC-MS | HP-5MS (30 m × 0.25 mm × 0.25 μm); Oven program: 50 °C (1 min)-120 °C, υ = 20 °C/min, 120–310, υ = 3 °C/min (25 min) | China | [61] |
| 30 | 17 adamantanes, 10 bicyclic sesquiterpanes, 37 terpanes, and 17 steranes | 2 g soil sample was spiked with acenaphthene-d10 the extracted sample solution was filtered and eluted with n-hexane and then concentrated to 1 mL. Eluted with n-hexane, mixed n-hexane/dichloromethane, dichloromethane. Concentrated and refreshed with cyclohexane. | GC-MS | HP-5 (30 m × 0.25 mm × 0.25 μm); Oven program: 50 °C (2 min)-300 °C, υ = 6 °C/min (15 min) | China | [62] |
| 31 | High C26/C25 tricyclic terpanes, low C31 homohopane, 4α-methyl-24-ethylcholestanes, and C30 tetracyclic polyprenoids | The oil samples were spiked with standard compound 5α-androstane and n-Hexane—to remove asphaltenes by ultrasound and centrifugation. Saturate and aromatic fractions were separated by activated silica gel/alumina column chromatography using n-hexane and n-hexane: dichloromethane (2:1, v/v). | GC-MS | HP-5MS (30 m × 0.25 mm × 0.25 μm); Tinj. = 300 °C; Oven program: 50 °C (2 min)-200 °C, υ = 4 °C/min, 200–310 °C υ = 2 °C/min (10 min) | China | [63] |
| 32 | 17.alfa., 21β-28, 30-Bisnorhopane, 28-Nor-17β(H)-hopane, 15-Isobutyl-(13αH)-isocopalane, Pregnane, Androstane, (5α)-, Androstane, (5β)-, Allopregnane, D-Homopregnane, (5α)-, Cholestane, and Stigmastane | Crude oil samples dissolved in n-hexane by column chromatography to the fractions of saturated and aromatic hydrocarbons. The silica gel is washed with acetone, hexane, and dichloromethane, completely dried, and activated at 160–180 °C for 20 h. The glass wool is washed with acetone, hexane, and dichloromethane. Sodium sulfate is calcined and cooled. 10 mL of crude oil. The eluents were collected as follows: 12 mL of hexane for saturated hydrocarbons (Fraction 1), 15 mL of hexane: dichloromethane for aromatic hydrocarbons (v/v, 1:1, Fraction 2). | GC-MS | DB-5ms (30 m × 0.25 mm × 0.25 μm); Tinj = 280 °C; Oven program: 50 °C (held for 5 min) to 300 °C by a rate of 20 °C/min and held for 20 min. | Kazakhstan | [this article] |
References
- Data Portal IndexMundi. Available online: https://www.indexmundi.com/g/r.aspx?v=88&t=20 (accessed on 15 September 2023).
- Kantarbayeva, A. Oil and Gas of Kazakhstan: Some Economic and Geopolitics Aspects. AlPari, January 2000. Available online: https://www.researchgate.net/publication/279997005_Oil_and_Gas_of_Kazakhstan_Some_Economic_and_Geopolitics_Aspects(accessed on 15 September 2023).
- U.S. Energy Information Administration. Country Analysis Brief: Kazakhstan. 2019. Available online: https://www.eia.gov/beta/international/analysis.php?iso=KAZ (accessed on 15 September 2023).
- Peters, K.E. The Biomarker Guide. In The Biomarker Guide, 1st–2nd ed.; Cambridge University Press: New York, NY, USA, 2006; Volume 1–2, p. 1155. [Google Scholar] [CrossRef]
- Wang, M.; Liu, S.; Li, J.; Gao, G.; Mi, J.; Li, E. Special Distribution of Crude Oil in the Lucaogou Formation in Jimusaer Sag and Genetic Analysis of Its Physical Difference. Hindawi Geofluids 2021, 2021, 6660079. [Google Scholar] [CrossRef]
- Alimzhanova, M.; Sergazina, M. Ecology monitoring of soil contaminated with petroleum by modern techniques of analysis. Int. Multidiscip. Sci. GeoConference SGEM 2015, 2, 157–163. [Google Scholar]
- Stout, S.A.; Wang, Z. Standard Handbook Oil Spill Environmental Forensics; Academic Press: New York, NY, USA, 2007. [Google Scholar]
- Aitkeldiyeva, S.A.; Faizulina, E.R.; Tatarkina, L.G.; Alimzhanova, M.B.; Daugaliyeva, S.T.; Auezova, O.N.; Alimbetova, A.V.; Spankulova, G.A.; Sadanov, A.K. Degradation of petroleum hydrocarbons with thermotolerant microorganisms. Rasayan J. Chem. 2020, 13, 1271–1282. [Google Scholar] [CrossRef]
- Faizulina, E.R.; Aitkeldiyeva, S.A.; Tatarkina, L.G.; Alimzhanova, M.B.; Auezova, Î.N.; Daugaliyeva, S.T.; Alimbetova, A.V.; Spankulova, G.A.; Sadanov, A.K. Pahs-degrading bacteria isolated from oilcontaminated soil of Western Kazakhstan. Ecol. Environ. Conserv. 2020, 26, 648–653. [Google Scholar]
- Zou, X.; Fan, X.; Chen, G.; Xu, T.; Ma, C. Geochemical Analysis of a Multi-Layer Hydrocarbon Reservoir in the Wuerhe Area, Junggar Basin. Appl. Sci. 2022, 12, 3871. [Google Scholar] [CrossRef]
- Alimzhanova, M.; Adilbekov, E.; Kapar, A.; Sagandykova, G.; Ashimuly, K. A stationary phase for solid-phase extraction based on natural nanomaterial shungite. Int. Multidiscip. Sci. GeoConference Surv. Geol. Min. Ecol. Manag. SGEM 2016, 2, 17–24. [Google Scholar]
- Li, E.; Li, Y.; Xiang, B.; Hou, D.; Mi, J.; Han, X.; Zhang, Y.; Gao, X. Chemometric Classification and Geochemistry of Crude Oils in the Eastern Fukang Sag, Junggar Basin, NW China. Energies 2022, 15, 8921. [Google Scholar] [CrossRef]
- Ivanov, K.S.; Erokhin, Y.V.; Kudryavtsev, D.A. Inorganic Geochemistry of Crude Oils of Northern Eurasia after ICP-MS Data as Clear Evidence for Their Deep Origin. Energies 2022, 15, 48. [Google Scholar] [CrossRef]
- Tomas, G.J.; Acuna, A.J. Study of petroleum biomarkers from the weathering of a crude oil in seawater. Rev. Int. Contam. Ambient. 2023, 39, 71–84. [Google Scholar] [CrossRef]
- Akhmedova, A.R.; Serebrennikova, O.V.; Shiganova, O.V. Saturated and Aromatic Hydrocarbons Biomarkers in Crude Oil and Bitumens from Kugas 364-0 Parametric Well (Sakha (Yakutia) Republic, Russia). Pet. Chem. 2023, 63, 82–92. [Google Scholar] [CrossRef]
- Chua, C.C.; Brunswick, P.; Kwok, H.; Yan, J.; Cuthbertson, D.; van Aggelen, G.; Helbing, C.C.; Shang, D. Enhanced analysis of weathered crude oils by gas chromatography-flame ionization detection, gas chromatography-mass spectrometry diagnostic ratios, and multivariate statistics. J. Chromatogr. A 2020, 1634, 461689. [Google Scholar] [CrossRef] [PubMed]
- Alimzhanova, M.B.; Abilev, M.B.; Kuandykova, M.M.; Kenessov, B.N.; Kamysbayev, D.K. Rapid Screening Method for the Total Petroleum Hydrocarbons in Water Samples by Solid-Phase Microextraction and GC-MS. Eurasian Chem.-Technol. J. 2012, 14, 177–182. [Google Scholar] [CrossRef]
- Alimzhanova, M.B.; Kenessov, B.N.; Nauryzbayev, M.K.; Koziel, J.A. Effects of moisture content and solvent additive on headspace solid phase microextraction of total petroleum hydrocarbons from soil. Eurasian Chem.-Technol. J. 2012, 14, 331–335. [Google Scholar] [CrossRef]
- Mereke, A.; Meruyert, S.; Yerlan, A.; Saniya, A. Optimization of the sample preparation parameters in crude oil analysis. Int. Multidiscip. Sci. GeoConference SGEM 2015, 17, 729–736. [Google Scholar] [CrossRef]
- Walters, C.C.; Wang, F.C.; Higgins, M.B.; Madincea, M.E. Universal Biomarker Analysis: Aromatic hydrocarbons. Org. Geochem. 2018, 124, 205–214. [Google Scholar] [CrossRef]
- Kayukova, G.P.; Gordadze, G.N.; Nigmedzyanova, L.Z.; Kiyamova, A.M.; Romanov, A.G.; Zaripova, S.K.; Naumova, R.P. Genesis of biomarker hydrocarbons in the environment and their role in the determination of crude oil contamination source. Pet. Chem. 2006, 46, 3–10. (In Russian) [Google Scholar] [CrossRef]
- Giruts, M.V.; Gordadze, G.N.; Koshelev, V.N.; Stroeva, A.R. Modelling of petroleum biomarker-hydrocarbons formation process using thermolysis and thermocatalysis of plant biomass. Pet. Chem. 2014, 54, 352–359. (In Russian) [Google Scholar]
- Bogatyrev, S.O.; Giruts, M.V.; Gordadze, G.N.; Koshelev, V.N.; Stokolos, O.A.; Stroeva, A.R. Generation of hydrocarbons of diamond-like structure from plant biomass. Chem. Technol. Fuel Oils 2014, 4, 15–20. (In Russian) [Google Scholar]
- Giruts, M.V.; Gordadze, G.N.; Morozov, O.N.; Romanov, A.G.; Tihomirov, V.I. Identification of crude oils of Samar region by their biomarker composition. Pet. Chem. 2010, 50, 424–430. (In Russian) [Google Scholar]
- Badmayev, C.M.; Giruts, M.V.; Gordadze, G.N.; Koshelev, V.N.; Stokolos, O.A.; Erdnieva, O.G. Identification of triamantanes in crude oils. Pet. Chem. 2012, 52, 83–85. (In Russian) [Google Scholar]
- Petrov, A.A. Biomarkers and geochemical conditions of crude oil formation in Russia. Geol. Oil Gas 1994, 6, 13–18. (In Russian) [Google Scholar]
- Dalluge, J.; Beens, J.; Brinkman, U.A.T. Comprehensive two-dimensional gas chromatography: A powerful and versatile analytical tool. J. Chromatogr. A 2003, 1000, 69–108. [Google Scholar] [CrossRef] [PubMed]
- Ruby, C.Y.; Marriott, P.J. Review of the Basic Concepts of Comprehensive Two-Dimensional Gas Chromatography. J. Chromatogr. Sci. 2002, 40, 276–291. [Google Scholar]
- Gorecki, T.; Harynuk, J.; Panic, O. The evolution of comprehensive two-dimensional gas chromatography (GC×GC). J. Sep. Sci. 2004, 27, 359–379. [Google Scholar] [CrossRef] [PubMed]
- Edwards, M.; Mostafa, A.; Gorecki, T. Modulation in comprehensive two-dimensional gas chromatography: 20 years of innovation. Anal. Bioanal. Chem. 2011, 401, 2335–2349. [Google Scholar] [CrossRef]
- Gaines, R.B.; Frysinger, G.S.; Reddy, C.M.; Nelson, R.K. Oil Spill Environmental Forensics; Academic Press: Cambridge, MA, USA, 2007; Volume 169. [Google Scholar]
- Ventura, G.T.; Hall, G.J.; Nelson, R.K.; Frysinger, G.S.; Raghuraman, B.; Pomerantz, A.E.; Reddy, C.M. Analysis of petroleum compositional similarity using multiway principal components analysis (MPCA) with comprehensive two-dimensional gas chromatographic data. J. Chromatogr. A 2011, 1218, 2584–2592. [Google Scholar] [CrossRef]
- Aguiar, A.; Silva, A.I.; Azevedo, D.A.; Aquino, F.R. Application of comprehensive two-dimensional gas chromatography coupled to time-of-flight mass spectrometry to biomarker characterization in Brazilian oils. Fuel 2010, 89, 2760–2768. [Google Scholar] [CrossRef]
- Pieri, N.; Jacquot, F. GC-MS identification of biomarkers in road asphalts and in their parent crude oils. Relationships between crude oil maturity and asphalt reactivity towards weathering. Org. Geochem. 1996, 25, 51–68. [Google Scholar] [CrossRef]
- Jacquot, F.; Doumenq, P. Biodegradation of the (aliphatic + aromatic) fraction of Oural crude oil. Biomarker identification using GC/MS SIM and GC/MS/MS’. Talanta 1996, 43, 319–330. [Google Scholar] [CrossRef]
- Hauser, A.; Dashti, H.; Khan, Z.H. Identification of biomarker compounds in selected Kuwait crude oils. Fuel 1999, 78, 1483–1488. [Google Scholar] [CrossRef]
- Galarraga, F.; Marquez, G.; Reategui, K. Comparative study of crude oils from the Machete area in the Eastern Venezuelan Basin by pyrolysis of asphaltenes. J. Anal. Appl. Pyrolysis 2007, 80, 289–296. [Google Scholar] [CrossRef]
- Gagni, S.; Cam, D. Stigmastane and hopanes as conserved biomarkers for estimating oil biodegradation in a former refinery plant-contaminated soil. Chemosphere 2007, 67, 1975–1981. [Google Scholar] [CrossRef]
- Siljeström, S.; Hode, T.; Lausmaa, J.; Sjövall, P. Detection of organic biomarkers in crude oils using ToF-SIMS. Org. Geochem. 2009, 40, 135–143. [Google Scholar] [CrossRef]
- Roushdy, M.; Nady, M.; Mostafa, Y.; Gendy, N.; Ali, H. Biomarkers Characteristics of Crude Oils from some Oilfields in the Gulf of Suez, Egypt. J. Am. Sci. 2010, 6, 911–925. [Google Scholar]
- Fernández-Varela, R.J.M.; Andrade, S.; Muniategui, D.P. Selecting a reduced suite of diagnostic ratios calculated between petroleum biomarkers and polycyclic aromatic hydrocarbons to characterize a set of crude oils. J. Chromatogr. A 2010, 1217, 8279–8289. [Google Scholar] [CrossRef] [PubMed]
- Huebschmann, H.; Frank, T. Analysis of Molecular Fossils: Crude Oil Steroid Biomarker Characterization Using Triple Quadrupole GC-MS/MS. Thermo Sci. Appl. Note 2010, 10261. [Google Scholar] [CrossRef]
- David, F.; Aronova, S. Analysis of Biomarkers in Crude Oil Using the Agilent 7200 GC/Q-TOF Application Note; Agilent Technologies Inc.: Santa Clara, CA, USA, 2011; Available online: https://www.agilent.com/cs/library/applications/5990-9477EN.pdf (accessed on 15 September 2023).
- Escobar, M.; Márquez, G.; Azuaje, V. Use of biomarkers, porphyrins, and trace elements to assess the origin, maturity, biodegradation, and migration of Alturitas oils in Venezuela. Fuel 2012, 97, 186–196. [Google Scholar] [CrossRef]
- Kashirtsev, V.A.; Nesterov, I.I.; Melenevskii, V.N.; Fursenko, E.A. ScienceDirect Biomarkers and adamantanes in crude oils from Cenomanian deposits of northern West Siberia. Russ. Geol. Geophys. 2013, 54, 958–965. [Google Scholar] [CrossRef]
- Mulabagal, V.; Yin, F.; John, G.F.; Hayworth, J.S.; Clement, T.P. Chemical fingerprinting of petroleum biomarkers in Deepwater Horizon oil spill samples collected from Alabama shoreline. Mar. Pollut. Bull. 2013, 70, 147–154. [Google Scholar] [CrossRef]
- Wu, Y.; Xia, Y.; Wang, Y.; Lei, T.; Chang, J.; Wang, Y. Distribution and properties of biomarkers in severely biodegraded crude oil of Gudao reservoir, China. J. Pet. Sci. Eng. 2013, 103, 97–105. [Google Scholar] [CrossRef]
- Mathur, N. Tertiary oils from Upper Assam Basin, India: A geochemical study using terrigenous biomarkers. Org. Chem. 2014, 76, 9–25. [Google Scholar] [CrossRef]
- Fernández-Varela, R.; Gómez-Carracedo, M.P.; Ballabio, D.; Andrade, J.M. The use of diagnostic ratios, biomarkers and 3-way Kohonen neural networks to monitor the temporal evolution of oil spills. Mar. Pollut. Bull. J. 2015, 96, 313–320. [Google Scholar] [CrossRef]
- Jiang, L.; Zhang, M. Geochemical characteristics and signi fi cances of rearranged hopanes in hydrocarbon source rocks, Songliao Basin, China. J. Pet. Sci. Eng. 2015, 131, 138–149. [Google Scholar] [CrossRef]
- Wang, Q.; Hao, F.; Xu, C.; Wang, Y.; Zou, H. Geochemical characterization of QHD29 oils on the eastern margin of Shijiutuo uplift, Bohai Sea, China: Insights from biomarker and stable carbon isotope analysis. Mar. Pet. Geol. 2015, 64, 266–275. [Google Scholar] [CrossRef]
- Sun, M.; Zhang, P.; Zhou, L.; Liu, H.; Li, G.; Chen, J.; Tan, H.; Fang, X.; Yi, Z.; Wang, G. Biomarker characteristics and oil accumulation period of Well Sutan 1 in in Qaidam Basin, China. J. Nat. Gas Geosci. 2016, 1, 85–91. [Google Scholar] [CrossRef]
- El Nady, M.M.; Naglaa, S.; Mohamed, L. Geochemical and biomarker characteristics of crude oils and source rock hydrocarbon extracts: An implication to their correlation, depositional environment and maturation in the Northern Western Desert, Egypt. Egypt. J. Pet. 2015, 25, 263–268. [Google Scholar] [CrossRef]
- Zhang, H.; Wang, C.; Zhao, R.; Yin, X.; Zhou, H.; Tan, L.; Wang, J. New diagnostic ratios based on phenanthrenes and anthracenes for effective distinguishing heavy fuel oils from crude oils. MPB 2016, 106, 58–61. [Google Scholar] [CrossRef] [PubMed]
- Musbah, A.; Tatjana, S.; Peter, H.; Jovan, B. Organic geochemistry of crude oils from the Intisar oil fi eld (East Sirte Intisar, Libya). J. Pet. Sci. Eng. 2016, 147, 605–616. [Google Scholar] [CrossRef]
- Moustafa, N.E.; Fars, K.E.-K. Simple identification approach for trace heteroatom-containing compounds in petroleum fraction by Automated Mass Spectral Deconvolution and Identification System. Chin. J. Chromatogr. 2016, 34, 925–932. [Google Scholar] [CrossRef]
- Lobodin, V.V.; Maksimova, E.V.; Rodgers, R.P. Gas Chromatography/Atmospheric Pressure Chemical Ionization Tandem Mass Spectrometry for Fingerprinting the Macondo Oil Spill. Anal. Chem. 2016, 88, 6914–6922. [Google Scholar] [CrossRef] [PubMed]
- Yang, C.; Lambert, P.; Zhang, G.; Yang, Z.; Landriault, M.; Hollebone, B.; Brown, C.E. Characterization of chemical fingerprints of unconventional Bakken crude oil. Environ. Pollut. 2017, 230, 609–620. [Google Scholar] [CrossRef]
- Pan, Y.; Liao, Y.; Sun, Y. The characteristics of bound biomarkers released from asphaltenes in a sequence of naturally biodegraded oils. Org. Geochem. 2017, 11, 56–66. [Google Scholar] [CrossRef]
- Rangel, A.; Osorno, J.F.; Ramirez, J.C.; De Bedout, J.; González, J.L.; Pabón, J.M. Geochemical assessment of the Colombian oils based on bulk petroleum properties and biomarker parameters. Mar. Pet. Geol. 2017, 86, 1291–1309. [Google Scholar] [CrossRef]
- Diasty, W.S.; El Beialy, S.Y.; El Anwari, T.A.; Peters, K.E.; Batten, D.J. Organic geochemistry of the Silurian Tanezzuft Formation and crude oils, NC115 Concession, Murzuq Basin, southwest Libya. Mar. Pet. Geol. 2017, 86, 367–385. [Google Scholar] [CrossRef]
- Song, D.; Wang, T.; Li, M.; Zhang, J.; Ou, G.; Ni, Z. Geochemistry and charge history of oils from the Yuqi area of Tarim Basin, China. Mar. Pet. Geol. 2017, 79, 81–98. [Google Scholar] [CrossRef]
- Kao, N.-H.; Su, M.-C.; Yen, C.-C.; Huang, Y.-J. A characterization of the soils and sediments in contaminated sites and rivers using petroleum biomarker compounds. J. Soils Sediments 2018, 19, 241–254. [Google Scholar] [CrossRef]
- Zhan, Z.-W.; Lin, X.-H.; Zou, Y.-R.; Li, Z.; Wang, D.; Liu, C.; Peng, P. Chemometric differentiation of crude oil families in the southern Dongying Depression, Bohai Bay Basin, China. Org. Geochem. 2018, 127, 37–49. [Google Scholar] [CrossRef]
- Wang, Z.; Stout, S.A. Oil Spill Environmental Forensics: Fingerprinting and Source Identification; Academic Press: New York, NY, USA, 2007; Volume 2. [Google Scholar]
- Zhamanbayeva, A.B.; Kurtova, O.Y.; Alimzhanova, M.B.; Zenkevich, I.G. Determination of C15-C20 isoprenoid alkanes characteristic ratios in the oils from Kazakhstan fields. Anal. Control 2019, 23, 237–246. [Google Scholar] [CrossRef]
- Peters, K.E.; Walters, C.C.; Moldowan, J.M. The Biomarker Guide, 2nd ed.; Volume II, Biomarkers and Isotopes in Petroleum Systems and Earth History; Cambridge University Press: Cambridge, UK, 2005; 684p. [Google Scholar]
- Moustafa, Y.M.; Morsi, R.E. Biomarkers. Chromatography and Its Applications. 2012. Available online: http://www.intechopen.com/books/chromatography-and-its-applications/biomarkers (accessed on 15 September 2023).
- Lijmbach, G. On the Origin of Petroleum: Proceedings of the 9th World Petroleum Congress; Applied Science Publishers: London, UK, 1975; Volume 2, pp. 357–369. [Google Scholar]
- Hunt, J.M. Petroleum Geochemistry and Geology, 2nd ed.; W. H. Freeman and Company: New York, NY, USA, 1996. [Google Scholar]
- Osuji, L.C.; Antia, B.C. Geochemical Implication of some Chemical Fossils as Indicators of Petroleum Source Rocks. AAPL J. Sci. Environ. Mgt. 2005, 9, 45–49. [Google Scholar]
- Didyk, B.M.; Simoneit, B.R.T.; Brassell, S.C.; Eglinton, G. Organic geochemical indicators of paleoenvironmental conditions of sedimentation. Nature 1978, 272, 216–222. [Google Scholar] [CrossRef]
- Van Graas, G.W. Biomarker maturity parameters for high maturities: Calibration of the working range up to the oil/condensate threshold. Org. Geochem. 1990, 16, 1025–1032. [Google Scholar] [CrossRef]
- Joshi, H.; Pandey, I. Physicochemical and biomarkers study of petroleum oils of KG Basin in India. Int. J. Sci. Res. Eng. Technol. 2014, 2, 595–603. [Google Scholar]


| No | Crude Oil Field | Year of Discovery | Location |
|---|---|---|---|
| 1 | Akingen | 1980 | Atyrau region (West Kazakhstan) |
| 2 | Akkudyk | 1981 | |
| 3 | Baichunas | 1931 | |
| 4 | Balgimbaev | 1978 | |
| 5 | Kosshagyl | 1926 | |
| 6 | Prorva | 1964 | |
| 7 | Tengiz | 1979 | |
| 8 | Zhanatalap | 1964 | |
| 9 | Dossor | 1911 | |
| 10 | Kashagan | 2000 | |
| 11 | Akshabulak | 1988 | Kyzylorda region (South Kazakhstan) |
| 12 | Aryskum | 1985 | |
| 13 | Aschysai | 2005 | |
| 14 | Konys and Bektas | 1989 and 1987 | |
| 15 | Nuraly | 1987 | |
| 16 | Sarybulak | 1975 | |
| 17 | Kyzylorda | 1986 | |
| 18 | Beineu | 1966 | Mangystau region (West Kazakhstan) |
| 19 | Kalamkas | 1976 | |
| 20 | Karamandybas | 1988 | |
| 21 | Karazhanbas | 1984 | |
| 22 | Zhanaozen | 1961 | |
| 23 | Zhangurshi | 1981 | |
| 24 | Zhetybai | 1961 | |
| 25 | Buzachi | 1975 | |
| 26 | Atasu | 1939 | Karagandy region (South Kazakhstan) |
| 27 | Kumkol | 1984 | |
| 28 | Kyzylkiya | 1986 |
| No | Biomarkers | Main Ion m/z (Dwell) | Additional Ions m/z (Dwell) | Formula | CAS |
|---|---|---|---|---|---|
| 1 | Pristane | 57 | 71, 43, 85, 41, 113 | C19H40 | 1921-70-6 |
| 2 | Phytane | 57 | 71, 43, 85, 41, 55 | C20H42 | 638-36-8 |
| 3 | n-C17 alkane | 57 | 43, 71, 85, 41, 55 | C17H36 | 628-78-7 |
| 4 | n-C18 alkane | 57 | 43, 71, 41, 85, 29 | C18H38 | 593-45-3 |
| 5 | Bisnorhopane | 191 | 95, 81, 69, 163, 55 | C28H48 | 65636-26-2 |
| 6 | Hopane | 191 | 109, 192, 123, 135, 137 | C29H50 | 36728-72-0 |
| 7 | Isobutyl-isocopalane | 191 | 69, 95, 81, 55 | C24H44 | 228729-94-0 |
| 8 | Pregnane | 55 | 41, 81, 67, 67, 217 | C21H36 | 481-26-5 |
| 9 | Androstane, (5α)-(C19) | 260 | 245, 95, 203, 81 | C19H32 | 438-22-2 |
| 10 | Androstane, (5β)-(C19) | 245 | 260, 41, 95, 55, 81 | C19H32 | 24887-75-0 |
| 11 | Allopregnane | 217 | 218, 149, 288, 109, 81 | C21H36 | 641-85-0 |
| 12 | Homopregnane | 217 | 302, 55, 95, 81, 67 | C22H38 | 35575-28-1 |
| 13 | Cholestane | 217 | 372, 218, 149, 95, 109 | C27H48 | 481-21-0 |
| 14 | Stigmastane | 217 | 43, 218, 55, 149, 41 | C29H52 | 601-58-1 |
| No | Location | Crude Oil Field | Ph/n-C18 | Pr/n-C17 | Pr/Ph |
|---|---|---|---|---|---|
| 1 | Atyrau region (West Kazakhstan) | Akingen | 1.1 | 1.4 | 1.7 |
| 2 | Akkudyk | 0.4 | 0.6 | 1.9 | |
| 3 | Baichunas | 1.2 | 3.0 | 1.4 | |
| 4 | Balgimbaev | 1.8 | 2.9 | 1.7 | |
| 5 | Kosshagyl | 2.3 | 3.1 | 1.7 | |
| 6 | Prorva | 0.3 | 0.3 | 1.3 | |
| 7 | Tengiz | 0.4 | 0.3 | 0.9 | |
| 8 | Zhanatalap | 3.5 | 2.5 | 1.6 | |
| 9 | Dossor | 0.7 | 0.6 | 1.4 | |
| 10 | Kashagan | 0.8 | 0.7 | 1.3 | |
| 11 | Kyzylorda region (South Kazakhstan) | Akshabulak | 0.2 | 0.3 | 2.0 |
| 12 | Aryskum | 0.2 | 0.4 | 2.0 | |
| 13 | Aschysai | 0.2 | 0.4 | 1.9 | |
| 14 | Konys and Bektas | 0.5 | 0.6 | 1.4 | |
| 15 | Nuraly | 0.2 | 0.2 | 1.9 | |
| 16 | Sarybulak | 0.1 | 0.4 | 3.3 | |
| 17 | Kyzylorda | 0.1 | 0.2 | 1.7 | |
| 18 | Mangystau region (West Kazakhstan) | Beineu | 0.5 | 0.6 | 1.2 |
| 19 | Kalamkas | 0.8 | 0.8 | 1.1 | |
| 20 | Karamandybas | 1.0 | 1.1 | 1.2 | |
| 21 | Karazhanbas | 6.3 | 4.1 | 0.9 | |
| 22 | Zhanaozen | 0.3 | 0.3 | 1.5 | |
| 23 | Zhangurshi | 0.2 | 0.3 | 1.8 | |
| 24 | Zhetybai | 0.1 | 0.2 | 1.9 | |
| 25 | Buzachi | 1.8 | 1.7 | 1.1 | |
| 26 | Karagandy region (South Kazakhstan) | Atasu | 0.4 | 0.5 | 1.4 |
| 27 | Kumkol | 0.2 | 0.4 | 2.0 | |
| 28 | Kyzylkiya | 0.1 | 0.3 | 2.6 |
Disclaimer/Publisher’s Note: The statements, opinions and data contained in all publications are solely those of the individual author(s) and contributor(s) and not of MDPI and/or the editor(s). MDPI and/or the editor(s) disclaim responsibility for any injury to people or property resulting from any ideas, methods, instructions or products referred to in the content. |
© 2023 by the authors. Licensee MDPI, Basel, Switzerland. This article is an open access article distributed under the terms and conditions of the Creative Commons Attribution (CC BY) license (https://creativecommons.org/licenses/by/4.0/).
Share and Cite
Alimzhanova, M.; Abdykarimov, B. Analysis of Kazakhstan Crude Oil Biomarkers by Gas Chromatography in Combination with Mass Spectrometry. Separations 2023, 10, 561. https://doi.org/10.3390/separations10110561
Alimzhanova M, Abdykarimov B. Analysis of Kazakhstan Crude Oil Biomarkers by Gas Chromatography in Combination with Mass Spectrometry. Separations. 2023; 10(11):561. https://doi.org/10.3390/separations10110561
Chicago/Turabian StyleAlimzhanova, Mereke, and Bauyrzhan Abdykarimov. 2023. "Analysis of Kazakhstan Crude Oil Biomarkers by Gas Chromatography in Combination with Mass Spectrometry" Separations 10, no. 11: 561. https://doi.org/10.3390/separations10110561