Review

Innovative Solutions for Food Analysis: Microextraction Techniques in Lipid Peroxidation Product Detection

by
Jorge A. Custodio-Mendoza
1,
Ana M. Ares-Fuentes
2,* and
Antonia M. Carro
3,4,5,*
1
Department of Technique and Food Development, Institute of Human Nutrition Sciences, Warsaw University of Life Sciences (WULS-SGGW), 02-776 Warszawa, Poland
2
Center for Applied Chemistry and Biotechnology (CQAB), University of Alcalá, 28805 Alcalá de Henares, Spain
3
Department of Analytical Chemistry, Nutrition and Food Science, University of Santiago de Compostela, 15782 Santiago de Compostela, Spain
4
Health Research Institute of Santiago de Compostela (IDIS), University of Santiago de Compostela, 15782 Santiago de Compostela, Spain
5
Instituto de Materiais (iMATUS), University of Santiago de Compostela, 15782 Santiago de Compostela, Spain
*
Authors to whom correspondence should be addressed.
Separations 2023, 10(10), 531; https://doi.org/10.3390/separations10100531
Submission received: 1 September 2023 / Revised: 22 September 2023 / Accepted: 28 September 2023 / Published: 4 October 2023

Abstract

:
Lipid peroxidation, the most aggressive reaction in food, results in the formation of reactive organic compounds that detrimentally impact food sensory qualities and consumers’ health. While controlled lipid peroxidation can enhance flavors and appearance in certain foods, secondary peroxidation products lead to sensory deterioration in a variety of products, such as oils, alcoholic beverages, and meat. This publication reviews the use of modern analytical techniques for detecting and quantifying carbonyl compounds, i.e., secondary lipid peroxidation products. The paper focuses specifically on microextraction-based methods: dispersive liquid-liquid microextraction (DLLME), solid-phase microextraction (SPME), and gas-diffusion microextraction (GDME). These techniques offer efficient and sensitive approaches to extracting and quantifying lipid oxidation products and contribute to the understanding of oxidative deterioration in various food products. The review outlines recent advancements, challenges, and limitations in these microextraction techniques, as well as emphasizes the potential for further innovation and improvement in the field of food analysis.

1. Introduction

Lipid peroxidation, autooxidation, or oxidative rancidity, is the most aggressive reaction in food that results in the formation of reactive organic compounds [1]. These compounds have an adverse effect on the sensory qualities of food and can potentially harm consumer health [1,2]. Lipid peroxidation is driven by the complex interaction of polyunsaturated fatty acids (PUFA) with reactive oxygen species (ROS) (Figure 1), resembling free radical reactions [3]. Exposure to factors like light, heat, or metallic ions initiates the process by releasing hydrogen atoms, forming radical carbonations. These radicals rearrange to create conjugated systems [1,2,4]. Atmospheric oxygen reacts with these conjugated dienes, generating peroxide radicals that sustain the chain reaction [3,4]. Although lipid peroxides are relatively stable, further degradation occurs through heat or metal ions, resulting in more stable secondary products [3,5]. The extent of autooxidation varies based on factors such as storage conditions, oxygen levels, and lipid composition, with the number of unsaturated bonds in the fatty acid influencing the susceptibility [5,6,7].
Controlled lipid peroxidation possesses positive effects, enhancing the flavors in certain products like aged cheese, roasted coffee beans, and toasted nuts [8,9]. However, secondary lipid peroxidation products can lead to sensory deterioration and off flavors in various foods, including oils, alcoholic beverages, meat, milk, and dairy products [9,10,11,12,13]. The susceptibility to autooxidation varies among different edible oils, with olive oil’s resistance attributed to its high phenolic content [10,14]. Alcoholic beverages, such as wine and beer, can develop lipid peroxidation products due to the interaction of PUFA in the raw materials with lipid peroxidation factors during production and fermentation [15,16]. Yeast metabolism in alcohol fermentation can also contribute to generating ROS, accelerating oxidative rancidity [17]. Extended periods of aging and storage, common in wines, further expose them to oxidative conditions [18]. Meat products, processed through grinding, cutting, and packaging, expose more surface area to ROS, promoting lipid peroxidation, which is exacerbated by extended storage times, especially under improper conditions [12,19]. Additionally, food products made from meat or fish are high in protein, PUFA and monounsaturated fatty acids (MUFA), and salt can experience protein deterioration due to primary (hydroperoxides) and secondary (aldehydes, ketones) lipid oxidation products reacting with free proteins, peptides, and amino acids [12,19].
Excessive lipid peroxidation can have adverse health effects by producing secondary peroxidation products that interact with biomolecules (proteins, peptides, nucleic acids, and other lipids) within cells, potentially leading to toxic and mutagenic effects [1,2,3].
These secondary lipid peroxidation products can follow two pathways: they can break down into carbonyl compounds like aldehydes, ketones, and alcohols [1,2], or undergo cyclization to form malondialdehyde, which can then dehydrate into acrolein [20].
The International Agency for Research on Cancer (IARC) classifies certain secondary peroxidation products based on their potential carcinogenic hazards to humans [21]. This classification (Table 1) categorizes compounds according to their level of evidence as carcinogens into different groups: Category 1, indicating sufficient evidence of its carcinogenicity to humans, Category 2A, suggesting they are probably carcinogenic to humans based on limited evidence. Category 2B, indicating that they are possibly carcinogenic to humans, supported by limited evidence, and Category 3, indicating insufficient evidence for their carcinogenicity.
Additionally, the European Food Safety Authority (EFSA) establishes tolerable daily intake values based on available toxicological information [26,27,28,29,30]. In cases where toxicological data are lacking for certain secondary peroxidation products, safety measures such as Acceptable Daily Intake (ADI) or Threshold of Toxicological Concern (TTC) can be applied [31].
Quantifying primary peroxidation products is challenging due to their reactivity and volatility [32]. Therefore, the measurement of secondary lipid peroxidation products is commonly used as biomarkers to monitor oxidative stress within cells [33]. Additionally, these products can serve as markers of food quality to assess the oxidative state of food products [34]. Various analytical techniques have emerged in recent years for analyzing and quantifying carbonyl compounds, with applications in food, biological, and environmental studies [33,35]. These methods primarily involve spectrometry and chromatography technologies [35]. A direct measurement of carbonyl compounds offers non-destructive and specific approaches, minimizing sample contamination risks due to their natural occurrence [35,36,37,38]. Direct methods for carbonyl compound analyses in food mainly employ flame ionization detectors (FID) and electron capture detectors (ECD). However, they may have increased detection limits due to potential analyte degradation within the detector [36,37,38]. In contrast, indirect methods offer a way to detect secondary peroxidation products by forming carbonyl adducts, which are determined using ultraviolet (UV), fluorescence (FLD), and mass spectrometry (MS) [10,39,40,41,42,43].
The traditional thiobarbituric acid (TBA) reactive substances (TBARS) assay has been employed to determine carbonyl compounds as lipid peroxidation products in biological and food samples [39]. This assay involves the reaction with TBA to form a chromophore detectable by spectrophotometric methods [39,43]. However, TBARS lack specificity due to interactions with various organic compounds [39]. Therefore, some applications incorporate a separation step, often via liquid chromatography (LC), before determination [43]. Other derivatization reagents, such as hydrazines, react with carbonyl compounds to form hydrazones, detectable spectroscopically after LC or gas chromatography-mass spectrometry (GC-MS) [40,41,42]. Phenyl hydrazine (PH) and derivatives such as 2,4-Dinitrophenylhydrazine (DNPH) and 2,3,4,5,6-pentafluorophenylhydrazine (PFPH) are commonly used for this purpose [40,41,42].
The choice of a sample preparation method depends on various factors, including the sample’s state (solid, liquid, gas), size, the analytical technique used, the type of analysis, properties of the analyte, and its initial concentration [44]. Traditional sample preparation methods often involve significant quantities of organic solvents, multiple steps, and result in substantial waste and time consumption [45]. An ideal sample preparation method should be simple, time efficient, cost effective, rugged, potentially automated, and align with the principles of green analytical chemistry, with a focus on minimizing sample, solvent, and waste usage [44,45]. Furthermore, simultaneous derivatization and extraction can reduce the overall analysis time while enhancing sensitivity and specificity [46]. In response to these needs, novel microextraction-based methods have emerged. Microextraction involves using a small volume of an extracting phase compared to the sample volume [47,48,49,50]. While it may not achieve exhaustive extraction, it significantly increases the concentration of the analyte in the extractive phase, reducing solvent usage [47,48,49,50]. The efficiency of microextraction depends on how the analyte partitions between the matrix and the extractive phase [51]. Since partitioning is not affected by analyte concentration, quantification is based on the absolute amount extracted [52]. The affinity of the analyte for the extraction phase determines the quantity extracted [51,52]. Moreover, microextraction operates on equilibrium, where extraction time determines the system’s equilibrium position [53]. Once equilibrium is reached, no further analyte extraction occurs [51,52,53]. Microextraction can also serve as a pre-concentration step before analysis [49,50,51].
Microextraction techniques, including dispersive liquid-liquid microextraction (DLLME), solid-phase microextraction (SPME), and gas-diffusion microextraction (GDME), have gained prominence in the analysis of lipid peroxidation in food. These techniques provide efficient and sensitive approaches to extracting and quantifying lipid oxidation products, thereby contributing to understanding the oxidative deterioration of food products. This review delves into the application of microextraction techniques for the detection of lipid peroxidation products in food. It highlights recent advances, identifies challenges, and discusses the limitations of GDME, SPME, and DLLME, with a focus on the potential for ongoing innovation and enhancement in food analysis.

2. Gas Diffusion Microextraction

GDME (Figure 2) was introduced to the scientific community through the Journal of Separation Science in 2010 [48].
GDME is a versatile and efficient technique offering several advantages in addressing food matrices complexities. Its selective extraction capability allows the isolation of specific target compounds from complex mixtures, ensuring precise analysis even in interfering components. GDME operates through passive diffusion, with target compounds migrating from the sample matrix into an acceptor phase, usually a liquid solution containing a derivative reagent. This process involves placing the acceptor phase in the GDME module containing a microporous hydrophobic membrane, typically a 5.0 µm PTFE membrane, which supports the acceptor phase. Equilibrium is established between the sample and acceptor phases, and the acceptor phase is collected for analysis. GDME’s minimal sample requirements make it well suited for limited availability, while its reduced solvent usage aligns with the trend of green analytical chemistry [45]. GDME exhibits high sensitivity, when coupled with sensitive detection methods like GC-MS or high-performance liquid chromatography-ultraviolet (HPLC-UV). This empowers the quantification of trace-level compounds in food analyses [10,48,54,55,56,57,58,59,60,61,62].
From quality control to monitoring changes during storage and processing, GDME’s synergy with analytical techniques such as GC and HPLC unveils the intricacies of food composition and quality, setting its status as an indispensable tool in modern food analysis practices. Its selective enrichment capabilities enhance the detectability of compounds, making GDME valuable for trace analysis. In practice, GDME is employed for discerning volatile aroma compounds, evaluating off flavors, assessing lipid oxidation products, and analyzing a spectrum of other volatile constituents. Additionally, GDME’s non-destructive nature preserves the integrity of samples for further investigations, enhancing the versatility of its applications across various food products, including solid (bread and coffee beans), liquid (beer, wine, soy sauce), and semi-liquid (vegetable oils) foods. Table 2 presents a comparison of the methods developed for the analysis of carbonyl compounds using GDME.

2.1. Alcoholic Beverages

Pacheco et al. (2010) demonstrated the effectiveness of GDME as a potent technique for simultaneously isolating vicinal diketones from beer [48]. The study explores critical parameters that influenced the extraction process, including extraction temperature, extraction time, stirring, derivatization, acceptor solution volume, pH, ionic strength, memory effect, and membrane repeatability. Under optimal conditions, they successfully extracted 1,3-pentadione and diacetyl from beer, achieved using 500 µL of a derivative solution containing 0.01% m/m OPDA (ortho-phenylenediamine) in a phosphate buffer. This extraction was carried out at 40 °C for 15 min, and the resulting diketone-oPDA derivatives were subsequently quantified using HPLC-UV analysis. This pioneering work highlighted GDME’s potential as a technique capable of effectively isolating vicinal diketones from beer and provided insights on the interplay between extraction parameters and its application in beer analysis. Subsequently, Gonçalves et al. [54] employed immersed GDME to extract carbonyl compounds from beer, specifically acetaldehyde, methyl propanal, and furfural. This extraction process utilized a derivative solution containing 3 g DNPH in 100 mL of water-acetonitrile (1:1) at pH 2.0. Optimal conditions were established, involving the use of 10 mL of beer and 750 µL of the derivative solution as the acceptor phase, with extraction for 5 min at 30 °C. Aldehyde-DNPH derivatives were analyzed using HPLC-UV, and the presence of these aldehydes was confirmed using HPLC–APCI–MS.
Conversely, Ferreira et al. [55] focused on the simultaneous extraction of 2-methyl butanal, 2-methyl propanal, 3-methyl butanal, acetaldehyde, and furfural from beer. They evaluated various parameters affecting the extraction process, such as time, temperature, derivatizing agent (DNPH and HBA), and two extraction approaches (headspace or immersed module). Aldehydes were extracted from 50 mL of beer using GDME in suspended mode, using 500 µL of derivative (HBA) solution as the acceptor solution, at 40 °C for 20 min. Aldehyde-HBA derivatives were quantified using HPLC-DAD.
The validated method was applied to assess the impact of beer storage on aldehyde formation. The collected data underwent Principal Component Analysis (PCA). Ferreira et al., found that storing beer at low temperatures effectively minimized the generation of staling aldehydes, compared to naturally and artificially aged beers. Thus, temperature was identified as a pivotal factor in beer storage, exerting a significant influence on sensory quality and organoleptic attributes.
Ramos et al. [56] focused on HPLC-UV determination of both free and total diacetyl in wines using immersed GDME. This study outlines a specific protocol for this analysis following a method established by Pacheco et al. [48] with slight modifications. In summary, the procedure involved a 400 μL O-PDA solution as the acceptor phase, facilitating the simultaneous extraction and derivatization of diacetyl from the wine sample within 20 min at a controlled temperature of 65 °C. The study demonstrated the application of immersed GDME with HPLC-UV as a viable method for accurately determining free and total diacetyl content within wines. Additionally, Cruz et al. [57] present another investigation that employs immersed GDME for HPLC-UV determination of free and total acetaldehyde in wines. The method utilizes DNPH derivatization in conjunction with immersed GDME, employing 1 mL of the derivative solution as the acceptor phase. The simultaneous extraction and derivatization processes occurred within 15 min, maintaining a temperature of 50 °C. This approach successfully quantified free and total acetaldehyde in wines using immersed GDME coupled with HPLC-UV analysis.
Subsequently, Ramos et al. [58] documented the application of suspended GDME for the analysis of diacetyl in both wine and beer samples. This study proposes a different GDME approach, focused on suspended mode extraction. Within this framework, 10 mL of the sample and 1 mL of an O-PDA solution serve as the acceptor solution. The extraction procedure takes place over a temperature of 60 °C for a duration of 10 min. In this context, the diacetyl-oPDA derivative, which is electroactive, is quantified using the technique of Differential Pulse Voltammetry. The suspended GDME technique demonstrates its potential for effectively extracting and analyzing diacetyl from wine and beer samples. This method expands the toolkit available for the precise determination of diacetyl content, contributing to a comprehensive understanding of the composition of these beverages.
Furthermore, Santos et al. [59] extended the utility of immersed GDME in a groundbreaking study involving the simultaneous extraction and determination of 2,3-pentadione, diacetyl, and methylglyoxal from wine, black tea, and soy sauce samples using HPLC-UV. In this work, they used 500 μL of an acceptor solution and conducted the extraction at 55 °C for 10 min, allowing the formation of the analyte-oPDA derivative. A notable innovation of this study was the examination of two different membrane types for GDME: the commonly used 5.0 µm PTFE membrane and the 0.22 µm PVDF membrane. Remarkably, under optimal conditions, the peak area achieved using the PVDF membrane was 2.5 times greater than that with the PTFE membrane. This unexpected enhancement opened the door to employing GDME for the extraction of methylglyoxal (MGO), a compound characterized by high water solubility and a low Henry’s law constant value. This experimental observation was a pivotal breakthrough, enabling the extraction of MGO, a compound that is notoriously challenging to extract using conventional volatile extraction techniques. The increased extraction efficiency observed with the PVDF membrane, though intriguing, remains partially unexplained. Ongoing research endeavors are aimed at comprehending the underlying mechanisms responsible for this phenomenon. The study demonstrated the potential of GDME with PVDF membranes for analytes, like MGO, contributing to a deeper understanding of extraction dynamics and opening avenues for improving analytical techniques.

2.2. Oil Samples

Custodio-Mendoza et al. [60] focused on analyzing free malondialdehyde (MDA) in edible oils employing the suspended GDME. Employing an asymmetrical screening design, the investigation systematically evaluated various parameters affecting the extraction and derivatization process. The study considered critical factors, including sample size, concentration of the derivative reagent, reaction time, and temperature. Through rigorous experimentation, optimal conditions were established, which involved utilizing 500 μL of a TBA solution as the acceptor phase. The simultaneous extraction and derivatization process was conducted at 65 °C for 30 min. The MDA-TBA derivative formed from this process was subsequently quantified using HPLC-UV and HPLC-FLD. The analysis extended to examining a collection of 54 edible oil samples, encompassing various types such as virgin and refined olive oils, sunflower oils, and seed oils. To explore the relationship between lipid peroxidation and oil processing, a hierarchical cluster analysis (HCA) was employed. This analysis allowed for the differentiation between virgin and refined oils, shedding light on the impact of oil processing on free MDA. The study demonstrated the utility of suspended GDME coupled with HPLC-UV and HPLC-FLD detection in quantifying free MDA in edible oils.

2.3. Solid Food

The concept of analyzing solid samples using GDME was introduced by Ferreira et al. [61], who pioneered its application in the determination of 2,3-pentadione, 2,3-hexadione, and diacetyl in bread. This innovative approach utilized suspended GDME to extract these diketones from finely ground bread samples (5 g). The process involved 500 μL of an O-PDA solution as the acceptor phase, with 15 min of extraction at 65 °C. The resultant diketone-oPDA derivative was subsequently analyzed using HPLC-UV. This methodology was successfully employed to determine the levels of these diketones in various bread samples. Notably, it was applied to unveil the time-dependent decrease in α-diketones in bread over a week, shedding light on the volatile compound’s evolution during storage. A noteworthy feature of this innovation is its potential to analyze a broader range of solid samples by altering the chemical composition of the acceptor extraction solution and potentially modifying the instrumental techniques.
GDME’s versatility can be harnessed for the qualitative analysis of coffee beans, as proposed by Cordeiro et al. [62]. They employed the suspended GDME technique to effectively identify carbonyl compounds in both green and roasted coffee beans. The study used extraction conditions involving 500 μL of O-PDA solution as the acceptor phase, with a 16 min extraction at 40 °C. Capitalizing on GDME’s well-established advantages, such as its high repeatability, cost effectiveness compared to SPME fibers, and substantial selectivity stemming from the combined extraction process strategy and derivatizing reagent, this approach offered a promising analytical methodology. It tentative identified twenty-seven carbonyl compounds within green and roasted coffee beans, discussing their associations with crucial coffee attributes. Some of these identified carbonyl compounds are recognized as marker compounds for distinct coffee characteristics. This analytical methodology showed significant promise by providing a single, low cost, reproducible, and easily executable technique. This approach can potentially measure various critical coffee attributes, aligning with the industry’s demands for efficient and comprehensive analysis methods.

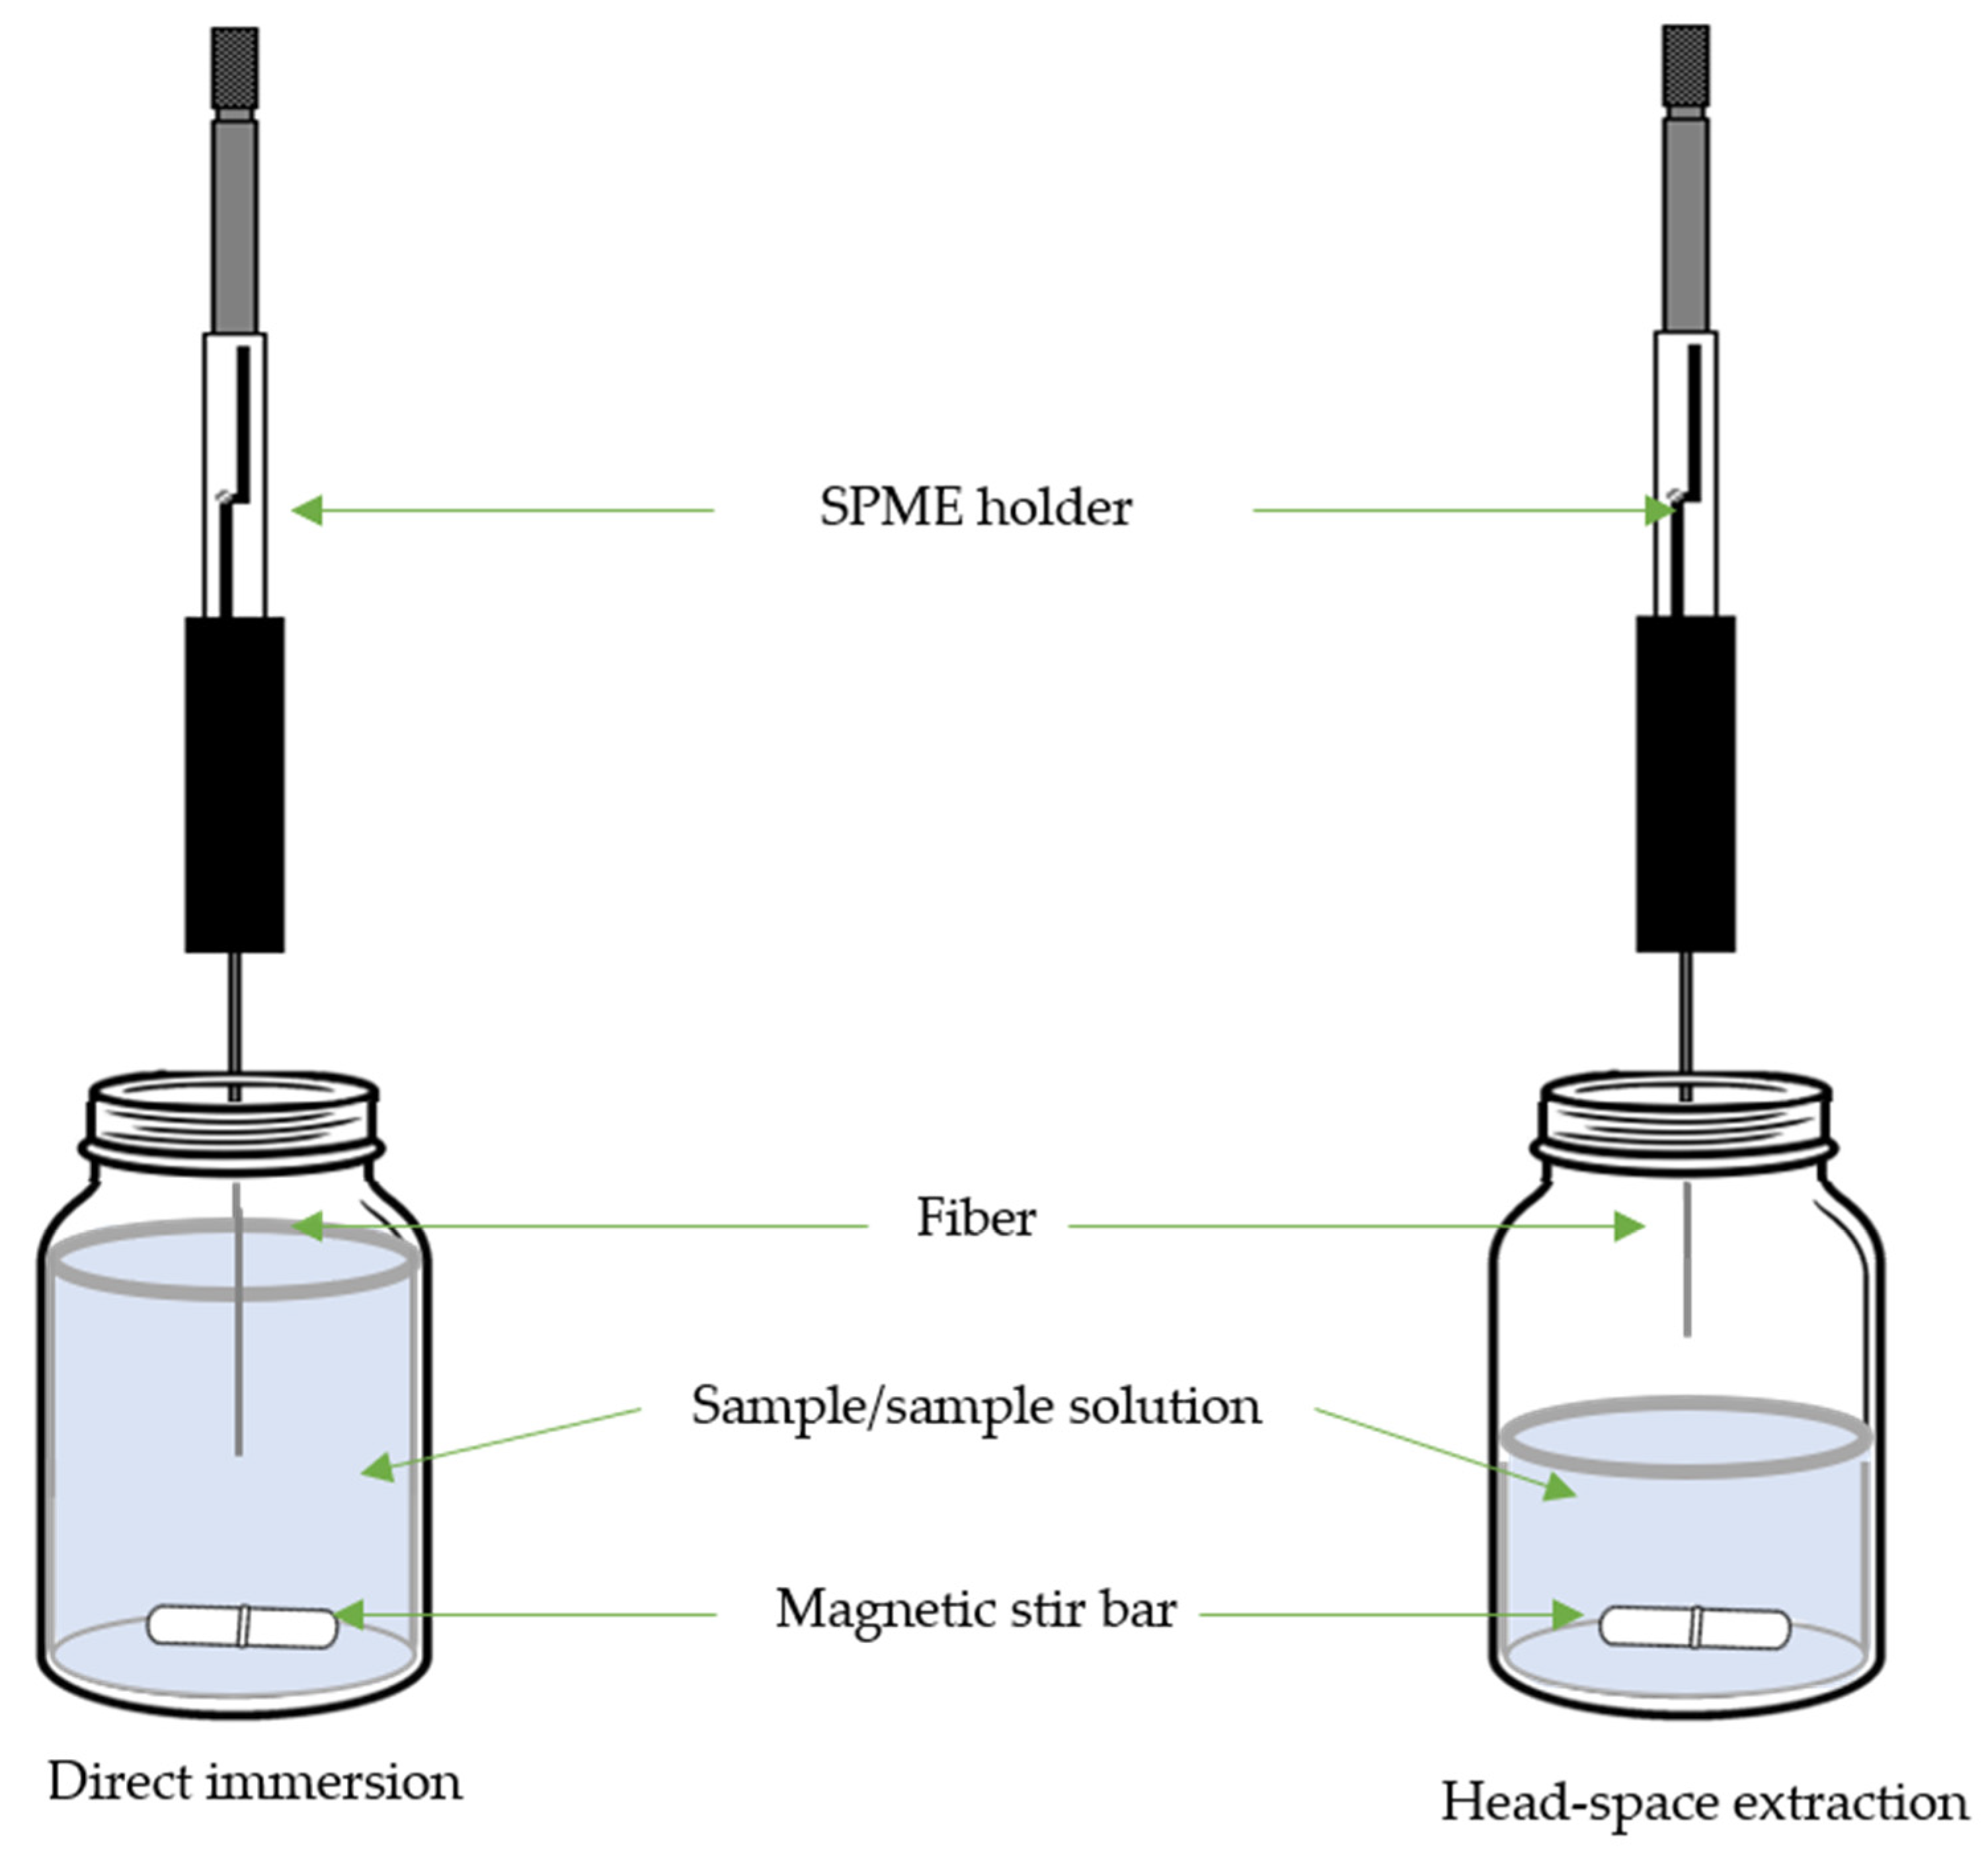
3. Solid-Phase Microextraction

SPME (Figure 3) is a well-established sample preparation technique commonly used in analytical chemistry to extract and concentrate target compounds from various sample matrices before analysis [49,51,63].
SPME finds particular utility in extracting volatile and semi-volatile compounds from complex matrices, especially in food analysis. SPME involves a fiber coated with a thin layer of an absorbent material, which is exposed to the sample to extract the analytes of interest [49,63]. The SPME process comprises several key steps: equilibration, when the SPME fiber is exposed to the sample (either in immersed mode or sample headspace) to allow analytes to partition between the sample matrix and the fiber coating, adsorption, when the analytes are absorbed onto the fiber coating, concentrating them from the sample matrix, and desorption of the analytes from the fiber coating to the analytical instrument for analysis [63].
The application of SPME for analyzing lipid peroxidation products is well justified due to its selective extraction capabilities, which minimize interference from complex matrices. SPME simplifies sample preparation by concentrating trace amounts of these compounds, enhancing sensitivity, and eliminating the need for extensive cleanup steps [49,63]. Furthermore, its reduced solvent usage aligns with environmental concerns [63]. SPME’s adaptability to various sample types enables real-time monitoring, making it versatile for studying lipid peroxidation in biological, food, and other samples [49,63]. Its compatibility with quantitative and qualitative analytical techniques, coupled with its ability to mitigate matrix effects, further underlines its value as a technique for accurate and comprehensive lipid peroxidation product analysis (Table 3).
However, information on the applications of SPME in the determination of volatile compounds from lipids decomposition in foods are limited. Additionally, a notable limitation of the SPME technique is the lack of reproducibility when using different fibers, especially from different batches. Consequently, most comparative studies are carried out with a single fiber to address this limitation.

3.1. Oils and High Lipid Content Samples

Jelén et al. [64] conducted a study on VOCs in various types of edible oils considering their susceptibility to oxidation during processing and storage after use. Their research aimed to identify and quantify these compounds, improving precision and accuracy in the analysis. They employed headspace solid-phase microextraction (HS-SPME) to extract many aldehydes, ketones, hydrocarbons, and alcohols from the autooxidation of fatty acids in 10 vegetable oils.
The research tested four types of fibers, 85 µm polyacrylate (PA), 100 µm poly(dimethylsiloxane) (PDMS), carbowax/divinylbenzene (CW/DVB), and divinylbenzene/carboxene in poly(dimethylsiloxane) (DVB/CAR/PDMS). Among these fibers, PA and PDMS demonstrated poor extraction abilities, while CW/DVB and DVB/CAR/PDMS successfully extracted all compounds. The latter fiber, DVB/CAR/PDMS, yielded the best results. They also explored the equilibrium time during the SPME process, selecting 30 min, even though equilibrium had not been reached in the 90 min studied for most compounds. For the qualitative analysis of fresh oils with a low volatile content, they recommended extraction at 50 °C. However, they noted that this temperature could lead to the degradation of labile compounds, posing a challenge for quantification. For volatile compounds generated during accelerated storage tests or storage at room temperature, the sampling temperature was found to be less critical, so the SPME extraction was performed at 20 °C.
Pentane is present in almost all samples, except in fresh rapeseed and corn oils. Pentanal, hexanal, and 2,4-decadienal were also quantified at relatively high concentrations. Other quantified compounds include pentanol, heptanal, and 2-nonanone. In SPME extraction at 20 °C, unwanted reactions are slowed down or eliminated. Therefore, this temperature is recommended when measuring volatile compounds in fresh oils. For volatile compounds emitted in the accelerated storage test, the sampling temperature is not determinative since the compounds generated during sampling represent a small percentage of all volatiles. SPME at 50 °C allowed for the identification of compounds by GC-MS in refined and cold-pressed rapeseed oils. In rapeseed oils, octanal and nonanal are the main volatile carbonyls derived from oleic acid, while hexanal is the main oxidation product of linoleic acid.
In another study, 4-hydroxy-2-nonenal (HNE) or the derivative of HNE with DNPH was isolated from oxidized oil or porcine liver using direct SPME [65]. The HNE was extracted twice with 2 mL of distilled water containing 0.1% BHT from the oil sample. The extract was increased to 10 mL with NaCl solution. SPME was applied after combining the extracts from the oil samples (100 mg) or porcine liver (1 g) with the same volume of DNPH (3.5 mg DNPH dissolved in 10 mL 1 M HCl) for HNE-DNPH. Factors such as fiber coating (PDMS, 100 µm; polyacrylate, 85 µm; PDMS/DVB, 60 µm; CAR/templated resin, 50 µm), NaCl concentration (0–20%), rate of stirring (0–200 rpm), adsorption temperature (30–55 °C), and adsorption time were studied (5–25 min). The optimal conditions were PDMS/DVB or polyacrylate fiber, 7.5% or 10% NaCl, 100 rpm for stirring, 40 °C or 50 °C of adsorption temperature, and 15 min or 20 min of adsorption time for HNE SPME or HNE-DNPH SPME, respectively. Analysis was carried out by HPLC with spectrophotometric detector (SP) at 223 nm and 370 nm for HNE or HNE-DNPH, respectively. Desorption of target compounds from the fiber was carried out in SPME/HPLC interface valve in static mode for 20 min. The proposed method demonstrates the successful detection of HNE in oxidized samples of soybean oil (in the form of HNE) and porcine liver (in the form of HNE-DNPH).
Derivatization with N-methylhydrazine combined with HS-SPME was employed to analyze MDA from cod liver oil using gas chromatograph and nitrogen phosphorus detector (GC-NPD) [66]. Due to the polar and reactive characteristics of MA, a derivatization step into a stable 1-methylpyrazole (1-MP), which is volatile at room temperature, is included in the extraction procedure. Other conditions were investigated: PDMS, 100 µm; PDMS/DVB, 65 µm and CAR/PDMS, 65 µm fibers; extraction times of 1, 5, 10, 20, and 30 min; and 0.05 M Tris buffer solution (pH 4, 7, 10). The HS-SPME process was successfully applicable using PDMS/DVB fiber for 10 min at pH 7.4. Desorption time was set at 5 min in the GC injection port at 200 °C. The MDA resulting from the oxidation induced with Fenton’s reagent was determined after the inhibitory effect of the natural antioxidants present in the sample.
HS-SPME-GC-FID was employed to study the volatile lipid oxidation product profiles in hazelnut samples with oxygen-absorbing sachets based on iron powder [67]. Five fibers were tested: PDMS, 100 µm; CAR/PDMS, 75 µm; PDMS/DVB, 65 µm; CAR/DVB, 65 µm; and DVB/PDMS/CAR, 50–30 µm. Four equilibrium temperatures were studied (50, 60, 70, and 80 °C). Equilibration times ranging from 5 to 60 min and three different extraction times (5, 10, and 20 min) were tested. Also, sample amounts of 0.1, 1, 10, and 15 g of ground hazelnuts were studied. Finally, optimal conditions were 0.1 g of sample, a CAR/PDMS fiber, extraction time of 10 min, equilibrium time of 10 min, and equilibrium temperature of 60 °C. Desorption was carried out at 300 °C for 15 min in the GC injector port. The oxygen-scavenging material reduced the oxidation process and the content of volatile compounds such as hexanal, which is an indicator of rancidity. This fact could create confusion among consumers about the real state of the food and mislead consumers. This method was applied to determine the hexanal formed in hazelnuts during storage under different conditions (room temperature, 40 °C, ultraviolet light, with and without oxygen scavenger). The results obtained were compared with those provided by electronic nose and a good correlation was obtained.
Hexanal, an indicator of rancidity, was confirmed as a parameter of oil deterioration using HS-SPME and GC-FID on three types of oils (peanut, soybean, and olive) and obtained results for seven other aldehydes [68]. The HS-SPME efficiency of five fibers (PDMS, 100 µm; PDMS/DVB, 65 µm; PA, 85 µm; CAR/PDMS, 85 µm; CW/DVB, 70 µm) was checked. The higher specific surface area offered by the CAR/PDMS fiber provided better extraction efficiency and was the selected fiber. Then, the influence of extraction temperature (23, 50, 70, and 90 °C), extraction time (1, 2, 5, 10, 15, and 20 min), desorption temperature (ranging from 200 °C to 275 °C), and desorption time (1, 2, 3, and 4 min) were studied. The optimal conditions were extraction at 50 °C for 15 min and desorption in GC injection port at 250 °C for 2 min.
HS-SPME-GC-MS was applied to analyze the presence of HNE, 4-oxo-2-nonenal (ONE), and 4,5-epoxy-2-decenal (EDE) in thermo-degraded sunflower oil (5 g) and in the three phases obtained after the in vitro digestion of oil (5 g of lipidic phase, 38 mL of aqueous phase and 4–5 g of pellet phase) [69]. DVB/CAR/PDMS, 50/30 µm fiber, 60 min of HS extraction at 50 °C, and with stirring at 250 rpm. The fiber was desorbed in the GC injection port for 10 min at 250 °C. It is confirmed that the compounds of interest are found in the oil samples and persist after the digestion process, mainly in the lipid phase.
Additionally, HS-SPME-GC-MS has been applied to study the evolution of cod liver oil samples, stored after opening [70]. In addition, it was considered whether any of the toxic α,β-unsaturated aldehydes (4-hydroxy-(E)-2-hexenal, 4-oxo-(E)-2-hexenal and 4,5-epoxy-2-heptenal) generated could act as markers of early oxidation of this oil. The extraction conditions were as follows: 1 g of oil was taken and kept at 50 °C for 15 min in a water bath, after which the DVB/CAR/PDMS 50/30 µm fiber was applied in the headspace for 60 min. The fiber was desorbed for 10 min at 220 °C in the injection port of the GC.
Volatile lipid oxidation product profiles of spray-dried emulsions with lipid components of sunflower oil were determined using HS-SPME-GC-MS [71]. A DVB/CAR/PDMS (50/30 µm) fiber was exposed for 30 min using three different conditions in temperature or stirring for the previous incubation step of 20 min (40 °C and 250 rpm; 50 °C and 250 rpm; 40 °C and 500 rpm). The desorption was carried out in 10 min in the GC injection at 250 °C. The influence of these SPME conditions (temperature and stirring speed) on the release of volatile lipid oxidation products was demonstrated by PCA analysis. Also, the volatile profiles were dependent on the relative humidity.
The behavior of lightly oxidized virgin and refined soybean oils during digestion in vitro was investigated using 1H nuclear magnetic resonance (1H NMR) and HS-SPME-GC-MS [72]. The study focused on understanding the impact of ovalbumin on lipid bio-accessibility and the levels of aldehydes and epoxides during digestion. The extraction conditions were extraction at 50 °C for 55 min using a DVB/CAR/PDMS 50/30 µm fiber after an equilibration time of 5 min. Desorption was performed in GC injection port at 250 °C for 10 min.
Finally, the composition of volatile compounds included different aldehydes, of which peanut oil during the roasting process of aromatic roasted peanut oil was studied [73]. Firstly, 3 g of peanut oil was mixed with 10 μL of 1,2,3-trichloropropane maintained 10 min at 50 °C in a water bath. Then, HS-SPME was applied using a PDMS/DVB 65 µm fiber exposed to the headspace for 40 min. The compounds were thermally desorbed in the GC-MS injection port for 5 min at 250 °C. Among all the identified compounds, unsaturated aldehydes were the main important components for flavor of vegetable oil. In the initial roasting stage of the oils, the non-heterocyclic compounds from lipid peroxidation represented were the predominant ones, especially the aldehydes. However, the total relative concentration of non-heterocyclic compounds did not increase significantly during the entire roasting process.

3.2. High Protein Content Samples

A comprehensive analysis of various (around 90) volatile compounds associated with the flavor of cooked meat were investigated by HS-SPME-GC-MS [74]. The study focused on volatile compounds in traditional Chinese Nanjing water-boiled salted duck (NJWSD), which underwent a specific cooking and storage process. The duck was roasted for 1 h at 90 °C and boiled at 85 °C to 90 °C for 40 min. Finally, duck breasts were vacuum packaged and stored at −20 °C. For analysis, 7 g of duck meat was used for experimental analysis after it was cut, frozen, and powdered. The HS-SPME conditions involved an equilibration time of 15 min at 45 °C prior to extraction for 40 min at 45 °C with CAR/PDMS 75 µm fiber, and desorption in GC injection port at 280 °C for 30 min. The study identified key lipid oxidation and degradation products such as pentanal, hexanal, octanal, nonanal, and 2,3-octanedione as principal components. Some of these products were noted for their participation in the Maillard reaction, which inhibited the formation of heterocyclic compounds not present in the volatile components of duck meat.
In another study, hexanal, pentanal, and malonaldehyde were determined by HS-SPME and GC-FID from raw and grilled chicken patties stored at −18 °C for 90 days [75]. They used a DVB/CAR/PDMS 50/30 µm fiber and desorption in GC injection port at 250 °C for 1 min was used. Different parameters were investigated: amount of sample (0.5, 1 and 2 g), water addition (0, 3 and 6 mL), butylated hydroxy anisole (BHA) addition (0, 5 and 10 mg), extraction time (5, 10, 15, 20, 30, 40, and 60 min), and extraction temperature (60 °C and 80 °C). The study found that the addition of water and magnetic stirring improved volatile extraction, but it causes a problem of masking the chromatographic peaks of interest due to the presence of 2-heptanone (internal standard) in the same zone. The use of BHA as an oxidant did not imply an improvement in the extraction either. The optimal conditions were determined as 2 g of sample, extraction for 10 min at 60 °C. The results obtained with the traditional TBARs test were compared. Raw samples showed significant Pearson correlations between all parameters, while grilled samples only showed a correlation between hexanal and pentanal.
Refrigeration-induced oxidative deterioration of frankfurter sausages was studied over 60 days at 4 °C, [76]. The study focused on the degradation of polyunsaturated fatty acids (PUFA) and the generation of MDA and hexanal, as well as the increase in carbonyl content resulting from protein oxidation and non-heme iron. The determination of MDA was performed using the TBARs test, while hexanal was analyzed by HS-SPME-GC-MS using a DVB/CAR/PDMS 50/30 µm fiber, 1 g of frankfurter for 30 min at 50 °C. The fiber was desorbed in the injection port at 220 °C during the chromatography run. The study observed that the different levels of MUFA, PUFA, and antioxidant content probably influences the lipid and protein degradation of the different samples studied.
The biochemical modifications of fish myosin protein, when reacting with various aldehydes (hexanal, 2-hexenal, 2,4-hexadienal, and 2,6-nonadienal) secondary products of lipid oxidation, were investigated [77]. The HS-SPME conditions were as follows: 4 mL of cod fillet sample were taken after equilibration for 15 min at 30 °C with a CAR/PDMS 85 µm fiber applied for 30 min. The aldehydes were desorbed for 3 min in a GC injector at 260 °C for GC-FID analysis. The study found that the aldehyde partition between the proteinaceous system and the gas phase decreases with time, except for hexanal. The content of carbonyl groups in myosin increased in the presence of aldehydes, especially with 2,6-nonadienal and 2-hexenal, probably due to the reaction with free amino groups. These interactions also cause a decrease in the solubility of the proteins.
A method for the determination of volatile carbonyl compounds associated with flavors in fish muscle was developed using HS-SPME with fiber derivatization and GC-MS analysis [78]. The study focused on the analysis of acetaldehyde, propanal, butanal,1-penten-3-one, pentanal, E-2-pentenal, hexanal, E-2-hexenal, heptanal, Z-4-heptenal, E-2-heptenal, octanal, (E,E)-2,4-heptadienal, nonanal, and furfural. The derivatization agent used was o-2,3,4,5,6-(Pentafluorobenzyl)hydroxylamine hydrochloride (PFBHA). The study involved saturating the fiber with the derivatizing agent in the headspace at 60 °C for 10 min with shaking. Different fibers and desorption temperatures were tested: 300 °C for CAR-PDMS, 75 µm; 260 °C for PDMS-DVB, 65 µm; 270 °C for CAR-PDMS-DVB, 2 cm-50/30 µm, and 220 °C for CW-DVB, 65 µm. The temperature (40, 50, and 60 °C) and the time (10, 15, 20, 25, and 30 min) of HS extraction were studied. The final conditions of 0.5 g of sample was mixed in water saturated in NaCl and PDMS-DVB was exposed to HS of 3 mL of the extract. Compounds were then extracted at 60 °C for 15 min and the oximes formed were desorbed in the GC injector for 4 min. This method was found to be highly sensitive and selective for the detection of volatile Maillard and Strecker compounds in fish samples. These compounds can be present at very low levels in fish samples, but their SPME detection requires their derivatization. On the other hand, the smoking process facilitates the formation of Maillard volatiles and furfural in the fish.
The impact of three different preservatives on the formation of volatile organic compounds (VOC) in white sturgeon caviar during a 14 month storage period was investigated [79]. The analysis involved the identification of heptanal, octanal, nonanal, decanal, 2-nonenal, 2-hexenal, and other VOC associated with the aroma of stored caviar samples. The results showed an increase in aldehydes related to the ripening processes occurring in sturgeon caviar samples. White sturgeon caviar contains 40% PUFA of total fatty acids and this leads to the formation of secondary oxidation products that influence the organoleptic properties of the caviar. For the analysis by HS-SPME-GC-MS, 5 g of sample, a DVB/CAR/PDMS 1 cm fiber, extraction time of 30 min, and temperature of 60 °C were considered. The fiber was then desorbed at 250 °C in the GC injection port. The study suggested that the addition of a mixture of sodium chloride, sorbic acid (E200), potassium sorbate (E202), and isoascorbic acid (E315) provided the highest stability of caviar samples during 14-month storage.
Lastly, 198 VOC from nine different chemical groups were identified in six typical dry cured meat products (loin, ham, salchichón, shoulder, chorizo, and jerky) [80]. These compounds highly influence the meat product’s aroma. HS-SPME-GC-MS was the adequate method used for the analysis. The extraction was carried out with DVB/CAR/PDMS 50/30 mm fiber at 37 °C for 30 min. Finally, the fiber was desorbed in the GC injection port at 260 °C for 8 min. The study reported a total of 18 aldehydes. Linear aldehydes derive from lipid oxidation of fatty acids while branched aldehydes are related to proteolysis and amino acid degradation. Hexanal, pentanal, and 2-octenal derive from the oxidation of linoleic, linolenic, and arachidonic fatty acids, while heptanal, octanal, nonanal, and 2-nonenal come from oleic acid autooxidation.

3.3. Cereal and Dairy Products

The analysis of pentanal, hexanal, heptanal, and pentane in liquid foods for infants based on milk and cereals was carried out using the HS-SPME-GC method (with GC-FID or GC-MS) [81]. These samples were stored for 9 months at 25, 30, and 37 °C and assessed eight times during the storage period. The procedure involved using 4 g of sample, an equilibration for 15 min at 37 °C with stirring, extraction for 45 min by CAR/PDMS 85 µm fiber and desorption in the GC injector at 250 °C for 5 min. The infant foods were fortified with the analytes of interest. The aldehyde content was inversely proportional to the storage temperature and decreased in the first 3 months, while the pentane content was directly proportional to the storage temperature and increased during all the months of storage.
In a related study, hexanal and pentane were determined in both liquid and powder infant formula, stored for four and seven months using the previously described method and conditions [82]. The hexanal content in IF was higher than in infant foods based on milk and cereals, and lower in samples stored for seven months, rather than four months. Continuing with this research direction, pentanal, hexanal, octanal, nonanal, 2-octenal, and dodecanal were determined in human milk by HS-SPME-GC-FID using a PDMS 100 µm fiber [102]. The procedure involved equilibrating a sample containing 1.5 g of salt at 25 °C for 15 min with stirring. Subsequently, the extraction was performed for 20 min and the desorption in the GC inlet was initiated at 40 °C until 300 °C and then maintained for 6 min. Hexanal, a primary peroxidation product, was found to be a good indicator. Its concentration depends on the fat content of the milk and the presence of antioxidants (α-tocopherol and ascorbic acid) present in the samples, which prevent lipid oxidation. Pasteurization only affected samples that contained very low levels of ascorbic acid.
The HS-SPME GC–MS method was optimized and validated to determine thirteen lipid oxidation compounds in whole milk powder [83]. The HS-SPME parameters were evaluated through experimental design. The optimal conditions using a DVB/Carboxen/PDMS 50/30 µm fiber were 2.4 g of sample, extraction for 45 min at 43 °C. The fiber was desorbed in the GC injector at 250 °C for 5 min. The method presents LODs ranging between 0.002 and 0.006 mg/L.
The generation of VOC from Maillard reactions, caramelization, and lipid oxidation processes is related to the formulation (fat content and egg composition) of bakery products [103]. These volatile compounds produced in the steps of mixing the dough and baking a complex product, such as a sponge cake, were studied. VOC from ingredients and dough were extracted by a HS-SPME using a DVB/CAR/PDMS 75 µm fiber at 100 °C for 30 min for oils and at 50 °C for 45 min for the other ingredients and dough. Desorption was performed into a GC inlet at 240 °C. Volatile compounds from baking vapors were extracted by a dynamic SPME device connected to the oven. For this purpose, two different extraction conditions were applied to the extraction chamber with the same fiber: 10 °C at 1 L/min and 40 °C at 7.5 L/min, and the analysis was carried out by GC-MS. The complex preparation of bakery products, conditioned by formulations that can be modified, affects the organoleptic and quality properties of the final products. Formulas containing the highest amounts of PUFA (sunflower oil) tended to be more oxidized when endogenous antioxidants were absent. Egg yolk was found to protect the PUFA from oxidation and is necessary to generate compounds derived from the Maillard reaction during the baking of the cake. It was observed that lipid oxidation already occurs during the dough preparation step and to a lesser extent during baking.
The preservation of milk’s nutritional qualities in cheese production through acid-induced coagulation or by enzymatic coagulation of raw or pasteurized milk was explored, with a focus on VOC, including hexanal, heptanal, octanal, and furfural [84]. The characterization and determination of these compounds are dealt with in some works, although their generation by lipid oxidation is not a directly addressed aspect. HS-SPME-GC-MS was used in all cases, although the operational conditions are not fully detailed: 10 g of smoked ewe cheese, CAR/PDMS fiber exposed into HS for 45 min at 50 °C and desorbed at 260 °C for 5 min; 1 g of mozzarella and 0.2 g of sodium chloride, DVB/Carboxen/PDMS 50/30 µm fiber exposed into HS for 15 min at 37 °C and desorbed at 220 °C for 2 min [85]; 0.5 g of Portuguese cheese, DVB/PDMS 65 µm fiber exposed into the HS for 45 min at 50 °C and desorbed at 250 °C [86]. The analysis was performed by GC-MS in all studies.
Furthermore, an electronic nose technique coupled with MS and SPME-GC/MS, based on headspace, was utilized to differentiate infant milk powder samples based on their volatile content over a 4 week storage period [104]. In this method, 0.5 g of sample was used to obtain a suspension that was equilibrated at 25 °C for 1 h. A PDMS/DVB 65 µm fiber was used for HS-SPME for 10 min at 25 °C. The volatiles were desorbed in the GC inlet at 250 °C for 3 min. The analysis by GC-MS showed that saturated aldehydes and hexanal, followed by pentanal, are the most abundant chemicals. HS-SPME-GC-MS was used to analyze the changes in flavor components of α- instant rice treated with catalase and butylated hydroxytoluene antioxidants during storage [105]. Although the specific fiber type for SPME was not indicated, 5 g was used in the study and the extraction in HS mode was carried out for 10 min at 80 °C. Catalase had the best inhibition effect on compounds such as benzaldehyde, nonanal, 1-octene-3-ol, heptanol, and trans -2-octenal, and maintained the original whiteness and flavor of rice.

3.4. Alcoholic Beverages

The study by Vasely et al. [87] investigated the analysis of nine different aldehydes present in beer, including (E)-2-nominal, 2-Methylbutanal, 2-methyl propanal, 3-methyl butanal, furfural, hexanal, methional, pentanal, and phenylacetaldehyde, using HS-SPME with on-fiber PFBHA derivatization. The experimental conditions for optimal results were determined: the aldehydes were extracted using the HS-SPME technique for 60 min at a temperature of 50 °C. The extraction used a 65 µm PDMS/DVB fiber. Subsequently, the compounds were desorbed from the fiber at a temperature of 250 °C and subjected to GC-MS analysis. Vasely and colleagues found that the levels of all the aldehydes increased during beer storage compared to the control sample. Notably, the increase in aldehyde concentrations was particularly significant after 12 weeks of storage at a temperature of 30 °C. For instance, furfural exhibited a remarkable 16-fold increase, while 2-methylpropanal showed a 7-fold increase. Despite these substantial increases, it was observed that none of the analyzed aldehydes surpassed their respective flavor thresholds in beer. However, the researchers suggested that the possibility of additive or synergistic effects should not be ruled out, meaning that while individual aldehydes might not cross the flavor threshold, their combined presence might contribute to developing a stale flavor in aged beer.
Subsequently, Saison et al. [88] employed a HS-SPME approach to quantify a wide range of 41 diverse carbonyl compounds in beer by GC-MS; the studies included glyoxal, methylglyoxal, furfural, diacetyl, and acrolein. To optimize the analysis process, the researchers introduced in-solution derivatization with PFBHA. This approach was combined with SPME and involved careful consideration of various parameters, such as fiber selection, PFBHA concentration, extraction temperature and time, and ionic strength, establishing that the optimal conditions for this combined approach were an extraction duration of 40 min at a temperature of 60 °C, using a PDMS/DVB fiber. The desorption of compounds from the fiber was carried out at a temperature of 250 °C. A notable finding of the study was that Saison and colleagues compared the effectiveness of on-fiber derivatization with in-solution derivatization. Intriguingly, they discovered that in-solution derivatization enabled the detection of several poorly extracted compounds using on-fiber derivatization. These compounds included 5-hydroxymethylfurfural, acrolein, hydroxyacetone, acetoin, glyoxal, and methylglyoxal. On the other hand, some compounds, particularly (E)-2-nonenal, were extracted more effectively using the on-fiber derivatization approach.
Later, Moreira et al. [89] developed a HS-SPME approach to determine the presence of 40 distinct carbonyl compounds in beer by GC-IT/MS. The carbonyl compounds they focused on included alkanals, alkenals, alkadienals, dicarbonyl compounds, Strecker aldehydes, ketones, and furans. The researchers employed a central composite design to optimize the extraction conditions and the addition of PFBHA. This design is a statistical methodology that systematically explores parameter space to find optimal conditions. The results of their optimization indicated that the most effective extraction conditions were achieved through the following steps: They incubated 5 mL of beer with 700 mg/L of PFBHA for 7 min. After this incubation, they extracted the volatile compounds for 20 min at a temperature of 45 °C using a PDMS/DVB fiber desorbed at 250 °C.
Later, Hernandes et al. [16] developed and validated an analytical method involving HS-SPME-GC/MS-SIM to assess the potential exposure risk to carbonyl compounds and furan derivatives through beer consumption. The researchers selected a set of target compounds for analysis, including acetaldehyde, acrolein, ethyl carbamate, formaldehyde, furfural, and furfuryl alcohol. The optimal extraction conditions involved a 60 min extraction at 55 °C and in-solution derivatization with PFBAH in a DVB/CAR/PDMS fiber, followed by desorption at 250 °C. Using this optimized method, the researchers analyzed 30 beer samples, including 8 ale and 22 lager beers. The results showed that ethyl carbamate was detected in only a lager and an ale.
On the other hand, acetaldehyde, acrolein, formaldehyde, and furfuryl alcohol were detected in all commercial beers. Furfural was found at higher concentrations in both ale and lager beers. Of note, acrolein was the only compound detected at levels that could pose a health risk to consumers due to its genotoxic properties.
Continuing their research, Hernandes et al. [90] applied the same analytical method to assess these carbonyl compounds during the various brewing stages of craft beer production. Ethyl carbamate and furfural were not detected throughout the brewing process, while the other target compounds were found in all phases of beer manufacturing. Boiling and fermentation were critical steps in forming acrolein, acetaldehyde, and furfuryl alcohol. In contrast, maturation and pasteurization played pivotal roles in reducing the levels of these compounds, both in ale and lager production. Formaldehyde was found at similar levels throughout all ale brewing stages, whereas in lager brewing, the highest levels were detected after boiling. The observed differences in compound levels during lager and ale brewing stages were attributed to variations in raw material composition, boiling time and temperature, and fermentation processes.
Pérez Olivero and Pérez Trujillo [91] developed a HS-SPME to determine 18 distinct carbonyl compounds in wines. The method was coupled with an analysis of GC-Ion Trap/Mass Spectrometry (GC-ITMS). In their study, the researchers sought to optimize various factors influencing the HS-SPME extraction process, including five different fibers with varying polarities, extraction time and temperature, desorption time and temperature, pH, ionic strength, and the presence of various wine constituents such as tannins, anthocyanins, sucrose, sulfur dioxide (SO2), and alcohol content. Synthetic wine samples spiked with the target analytes were used for optimization purposes. The optimal conditions for effective extraction and quantification involved using a DVB/CAR/PDMS fiber, extracting the carbonyl compounds at 40 °C for 45 min, and fiber desorption at 250 °C. Importantly, this method did not require derivatization, simplifying the analysis process. Applying the optimized method to white and red wine samples, Pérez Olivero and Pérez Trujillo found that acetoin was the predominant carbonyl compound in all wines analyzed. Notably, (E)-2-hexen-1-al was absent in all red wine samples. Through analysis of variance, they determined that compounds such as 2,3-pentadione, octanal, acetoin, (E)-2-octenal, furfural, 5-methyl furfural, (E)-2-(Z)-6-nonadienal, phenylacetaldehyde, β-damascenone, and vanillin exhibited statistically significant differences in average content between red and white wines. Specifically, the mentioned compounds generally showed higher average content in red wines, except for (E)-2-(Z)-6-nonadienal, which had higher content in white wines.
Later, Batkhup et al. [92] analyzed volatile aroma compounds in mulberry wines using HS-SPME with a DVB-CAR-PDMS fiber and GC-MS. The extraction was performed at a temperature of 40 °C for 30 min. Their study focused on mulberry wines and aimed to identify and quantify the volatile compounds responsible for their aroma profile. The researchers were able to analyze approximately 80 volatile compounds present in mulberry wines. These compounds belonged to various chemical groups, with higher alcohols, fatty acids, esters, and some particularly prominent volatile phenols. The concentrations of these volatile compounds ranged from trace amounts to 138.36 mg/L. Notably, the diversity of compounds and their wide concentration range highlighted the complexity of mulberry wine aroma. The researchers introduced a novel methodology for analyzing mulberry wines using HS-SPME coupled with GC-MS. They found that using a 50/30 µm DVB-CAR-PDMS fiber offered superior extraction efficiency compared to other fiber types (p < 0.05). This was especially evident for compounds like esters, higher alcohols, and fatty acids, which are significant contributors to the overall aroma profile of the wine.
Lago et al. [93] undertook a study that focused on validating an analytical method for the simultaneous quantitative determination of six toxic compounds—formaldehyde, acetaldehyde, ethyl carbamate, furan, furfural, and acrolein—in wines. They combined headspace solid-phase microextraction (HS-SPME) and comprehensive two-dimensional gas chromatography with time-of-flight mass spectrometric detection (GC × GC/TOFMS). This method was suitable for simultaneously determining if these compounds are potentially harmful if present in wines in excessive amounts. Acetaldehyde and acrolein, in particular, coeluted with other wine compounds, highlighting the challenge that one-dimensional gas chromatography could pose when attempting to quantify these specific compounds accurately. The researchers observed that the degree of ripeness and the duration of grape maceration appeared to influence the concentrations of these toxic compounds. This indicates that the maturation level of grapes and the time they are subjected to maceration could impact the final concentration of these compounds in the resulting wines. Notably, the study evaluated the potential health risks associated with exposure to these toxic compounds through wine consumption. Calculated Margin of Exposure (MOE) values were determined, which provide insight into the potential health risks based on exposure levels and toxicological data. When comparing these values to a threshold of 10,000, it was found that furan, acrolein, and ethyl carbamate exposure through wine consumption might pose risks to consumer health as the calculated MOE values fell below this safety threshold.
Ferreira et al. [94] conducted a study on developing and validating an analytical method for determining formaldehyde, acetaldehyde, acrolein, furfural, and ethyl carbamate in must and wines. They employed a gas chromatography with mass spectrometric detection in selected ion monitoring mode (GC/qMS-SIM) method, preceded by comprehensive two-dimensional gas chromatography with a time-of-flight mass spectrometric detector (GC × GC/TOFMS) analyses to identify and resolve possible coelutions. The research began by addressing coelutions of derivatized acetaldehyde and acrolein with other compounds. These coelutions were fixed in the second chromatographic dimension (2D) of GC × GC/TOFMS. To enhance specificity, the researchers used the most intense ions from the mass spectra of the analytes that were not present in the mass spectra of interfering compounds in the GC/qMS-SIM analysis. Various figures of merit were assessed to validate the developed GC/qMS-SIM method. These included recovery rates (90–102%), relative standard deviations for repeatability and precision assays (below 9% and 12%, respectively), as well as limits of detection and quantification for all compounds, which demonstrated the method’s sensitivity (values below 0.8 and 1.5 μg L−1, respectively). The study’s results confirmed that furan-containing compounds could be accurately analyzed using HS-SPME-qGC/MS without interference from artifact formation during extraction and desorption.
Additionally, the importance of adjusting the ethanol content in samples based on the level of ethanol was demonstrated. Ethyl carbamate was not detected in the analyzed samples, while formaldehyde was found in levels below the limit of quantification (LOQ) at 0.6 μg L−1. All samples were positive for acetaldehyde (19.9 to 44.0 μg L−1) and furfural (1.1 to 6.9 μg L−1). Acrolein was detected in 75% of the samples, with concentrations ranging from 0.7 to 50.2 μg L−1.
Moreira et al. [95] developed a comprehensive method for quantifying carbonyl compounds in various categories of Port wines. The methodology involved the integration of headspace solid-phase microextraction (HS-SPME) coupled with gas chromatography-triple quadrupole/mass spectrometry detection (GC-TQ/MS). A prior PFBHA derivatization step complemented this approach. The study aimed to quantify 38 carbonyl compounds in diverse categories, such as alkanals, alkenals, Strecker aldehydes, dialdehydes, ketones, and furan aldehydes, present in different Port wines. The researchers meticulously optimized the extraction conditions to achieve accurate results. The optimal extraction conditions were determined: incubating 2 mL of wine with 2.3 g/L of PFBHA for 10 min, followed by extraction for 20 min at 32 °C. Applying this method to various categories of Port wines yielded interesting findings. Tawny wines with ‘indication of age’ (ranging from 10 to 40 years old) exhibited the highest levels of specific carbonyl compounds, including propanal, pentanal, hexanal, Strecker aldehydes, diacetyl, methyl glyoxal, 3-pentanone, and 2-furfural. On the other hand, Ruby wines were characterized by having the highest amounts of certain unidentified compounds.
Piergiovanni et al. [96] conducted a study to develop an automated method for quantifying odor-active carbonyl compounds in wines. The study aimed to improve robustness, productivity, and environmental sustainability in oenological analytical chemistry. The process combined HS-SPME with Gas Chromatography-Tandem Mass Spectrometry (GC-MS/MS). It was designed to assess volatile carbonyl compounds (VCCs) in wines as a quality control tool for various winemaking stages. The researchers optimized the method by utilizing an autosampler, adhering to green analytical chemistry principles, incorporating solvent-less techniques, and minimizing sample volumes. They investigated 44 VCCs, including linear and unsaturated aldehydes, Strecker aldehydes, and ketones. The method was applied to study VCC evolution in white and red wines after accelerated aging. The most significant concentration variations were observed in furans and linear/Strecker aldehydes, with distinct behavior differences between white and red wine cultivars—notably, the results aligned with contemporary models of carbonyl evolution during wine aging.
Wardencki, Sowiński, & Curyło [97] developed a direct SPME to analyze VOCs (2-butenal, acrolein, butanal, ethanal, isobutanal, isopentanal, methanal, pentanal, and propanal) in alcoholic solutions like vodka. The method involved chemical derivatization using PFBHA and GC-ECD. Experimental conditions such as alcohol content, exposure time, temperature, and agitation were optimized. After 1.5h PFBHA derivatization, optimal conditions included immersing the SPME fiber in the sample solution for 15 min at room temperature (20 °C) and desorbing at 250 °C. The method was successfully applied to real alcoholic beverages in a total analysis time of 2 h. This approach enhanced the understanding of aldehyde compounds in spirits and improved analytical techniques in beverage analyses.
Rodrigues, Caldeira, & Camara [11] developed a sensitive method for analyzing volatile and semi-volatile compounds in alcoholic beverages (wine, beer, whisky). The approach involved HS-SPME and gas chromatography with quadrupole mass detection (GC–qMSD). The researchers optimized key experimental factors that influenced the equilibrium of VOCs and SVOCs between the sample and the SPME fiber. These factors included the type of fiber coating, extraction time, temperature, sample stirring, and ionic strength. They evaluated and compared the performance of five commercially available SPME fibers: polydimethylsiloxane (PDMS, 100 µm), polyacrylate (PA, 85 µm), polydimethylsiloxane/divinylbenzene (PDMS/DVB, 65 µm), carboxenTM/polydimethylsiloxane (CAR/PDMS, 75 µm), and divinylbenzene/carboxen on polydimethylsiloxane (DVB/CAR/PDMS, 50/30 µm) (StableFlex). Optimal conditions involved the HS-SPME using PDMS, CAR/PDMS, and DVB/CAR/PDMS fibers for 60 min at 30 °C. This allowed for comparing different beverages in terms of compound profiles. The method identified 44 compounds in white wines, 64 in beers, and 104 in whiskies. Crucial compounds varied across drinks, e.g., ethyl octanoate and ethyl decanoate in wines, isoamyl alcohol and isoamyl acetate in beers, and ethyl decanoate and ethyl octanoate in whiskies. The method improved understanding of the composition of alcoholic beverages’ volatile and semi-volatile compounds.
López-Vázquez et al. [98] developed a method to determine aldehydes in grape pomace distillates (Orujo) using PFBHA derivatization of target aldehydes HS-SPME and GC-MS analyses. The study focused on 20 aldehyde compounds, including aromatic short-chain aldehydes and fatty long-chain aldehydes. Optimal conditions involved adding 1.5 g/L of the derivatizing agent 2 min pre-incubation and 40 min of extraction at 55 °C. This optimized methodology was then applied to various grape pomace distillates obtained using a steam distillation system with a demetilant column called a “vertical method extractor”. The researchers observed significant changes in the quality profile of the distillates due to the use of the column. These changes were associated with undesirable rancid and piquant smells in the distillates. However, the newly developed analytical process showed promise in amending these sensory issues and providing insights into the aldehyde composition that contributed to the distillate’s aromatic profile changes.
Perestrelo et al. [99] conducted a study to establish the volatomic fingerprint of ciders produced in different geographical regions on Madeira Island. They employed 30 min HS-SPME at 50 °C using a DVB/CAR/PDMS fiber desorbed at 250 °C and GC–MS to analyze the volatile compounds present in these ciders. The main aim was to explore how the geographical origin affects the volatile patterns of ciders and to identify potential molecular markers associated with different regions. They identified 107 VOCs in various chemical families. Out of these, 50 VOCs were found to be shared across all the ciders that were analyzed. Importantly, significant variations in the relative content of VOCs were observed among ciders from different geographical regions. To assess the potential of these identified VOCs for distinguishing ciders based on their regions of origin, the researchers employed chemometric tools like a principal components analysis (PCA) and partial least squares-discriminant analysis (PLS-DA). The PCA analysis revealed noticeable distinctions among ciders from various island geographical regions.
Additionally, PLS-DA identified fifteen key VOCs that were crucial in distinguishing ciders based on their origins. These fifteen VOCs, including terpenoids, alcohols, acids, and esters, demonstrated variable importance in projection (VIP) values greater than one. The results of this study provide valuable insights into the volatile characteristics of ciders produced on Madeira Island. The identified VOC could be useful markers to enhance the cider-making process and improve the final product’s overall quality. Furthermore, the ability to discriminate ciders based on geographical regions is significant for protecting the product’s distinct quality and characteristics from specific areas.
Yu et al. [100] conducted a study to identify distinct carbonyl compounds in Huangjiu, a traditional Chinese alcoholic beverage with varying sugar contents from different regions. The authors developed and validated a method for detecting volatile carbonyl compounds in Huangjiu. The optimal extraction conditions involved incubating 5 mL of Huangjiu with 1.3 g/L of PFBHA at 45 °C for 5 min. Subsequently, the volatile carbonyl compounds were extracted by HS-SPME at 45 °C for 35 min using a DVB/CAR/PDMS fiber. The researchers performed a targeted quantitative analysis of 50 carbonyl compounds in Huangjiu. Their findings revealed significant levels of Strecker aldehydes and furans in the beverage. Through orthogonal projections to latent structures discriminant analysis (OPLS-DA), the researchers differentiated Huangjiu samples based on sugar content, raw materials, and region of origin. They found differential carbonyl compounds associated with these categories: 19 for sugar content variation, 20 for raw material differences, and varying numbers (22 and 8) for different regions.
Lim & Shin [101] introduced a sensitive and straightforward analytical method using HS-SPME GC–MS to detect glyoxal (GO) and MGO in alcoholic beverages and fermented foods. The technique involved derivatizing the analytes with TFEH at 85 °C for 20 min. Notably, this technique was suitable for automation, as all reagents and samples could be combined in the autosampler vial during the preparation step. The derivatization reaction proceeded rapidly and was fully completed within 20 min in the solution. This HS-SPME GC–MS method contributes to our understanding of their presence and levels in these products. This advancement enhances the routine GO and MGO content analyte, thus facilitating quality control and broader research efforts in the field.

4. Dispersive Liquid-Liquid Microextraction

DLLME (Figure 4) is a miniaturized LLE technique introduced by Rezaee et al. [106]. Since its introduction in 2006, this technique garnered the interest of analysts and has been widely used for the extraction of various types of analytes from different matrices, such as water, tissues, biological fluids, and food matrices [107,108,109]. The DLLME system consists of a ternary solvent system comprising an aqueous phase containing the analytes of interest, a dispersive solvent that is miscible with both the aqueous phase and the third component of the system, which is the extracting solvent. The mixture formed by the dispersant and the extractant is rapidly injected into the aqueous solution, forming a cloudy solution. This microemulsion is composed of tiny droplets of extractant solvent dispersed in the aqueous phase, thereby increasing the contact surface between them and facilitating quick equilibrium.
DLLME is characterized by its simplicity, speed, efficiency, and capacity for high enrichment due to the high proportion of donor and acceptor phases. Therefore, the most important parameters of DLLME are the selection of extraction conditions and the choice of dispersive solvents for analytes extraction. An appropriate dispersive solvent must be miscible with the extraction phase and the aqueous phase to create fine droplets in the sample matrices, thus enhancing the interaction between the two phases, resulting in high extraction efficiency.
The most commonly used dispersing solvents are acetone, acetonitrile, and short-chain alcohols (such as methanol, ethanol, and propanol) [109]. The extracting solvent must possess higher density than water, high extraction capacity, and good chromatographic behavior. In classical DLLME, chlorinated solvents such as chloroform, carbon tetrachloride, chlorobenzene, or dichloromethane are the most commonly used extractive solvents. However, these solvents are toxic and harmful to the environment. Over recent years, DLLME has evolved, utilizing less toxic extracting solvents, such as ionic liquids (IL) or less dense extractant solvents than the aqueous phase, such as alcohols [108,109,110]. Ionic liquids (IL) exhibit unique properties, including negligible vapor pressure, miscibility with water and organic solvents, good solubility for organic and inorganic compounds, high temperature, stability, and respect for the environment. Additionally, they efficiently absorb and transfer microwave energy and are formed by a central molecule that combines organic cations and several anions [110,111].
Furthermore, DLLME can be coupled in a single step of in situ derivatization and extraction of analytes of interest and even combined with other extraction techniques, such as GDME or ultrasound-assisted extraction (UAE). Table 4 presents a comparison of the methods developed for the analysis of secondary peroxidation products using DLLME.

4.1. Beverages

Xu et al. (2011) [112] applied single-step ionic liquid-based dispersive liquid-liquid microextraction (IL-based DLLME) simultaneously with microwave-assisted formaldehyde derivatization on beverage samples. The study evaluated critical parameters that influence the extraction process, including volume (40–90 µL) and type ([C4MIM][PF6], [C6MIM][PF6], C8MIM][PF6]) of extraction solvent, type (acetonitrile, methanol, and acetone) and volume (0–1 mL) of dispersant solvent, microwave power (60–240 W), irradiation time (30–120 s), derivatization volume (10–60 µL), pH (2–5), and ionic strength.
Results showed that when [C4MIM][PF6] was used as the extraction solvent, the sample solution was always transparent and no IL phase appeared at the bottom of the tube after centrifugation, possibly due to its higher water solubility. [C6MIM][PF6] provided the best chromatographic peak responses. Under the optimal conditions, 5 mL of the corresponding sample (including draft beer, cola, apple juice, orange juice, and peach juice) was mixed with 400 µL of acetonitrile, 70 µL of [C6MIM][PF6], and 40 µL of DNPH (as derivatization reagent). The resulting solution was subjected to microwave energy for 90 s and 120 W. The extracted IL drop was subsequently subjected to its determination by HPLC-UV. The proposed method demonstrates the efficacy of DLLME as a potent technique for isolating formaldehyde from beverage samples. Additionally, the use of IL as an extraction solvent allows a reduction in organic solvent. Simultaneous extraction and derivatization in DLLME shortens extraction times.

4.2. Coffee

Bellanda Galuch et al. [113] demonstrated the efficacy of DLLME as a potent technique for isolating acrylamide from brewed coffee. Acrylamide was quantified by UPLC-MS/MS. Various parameters affecting the extraction process, such as dispersive and extractive solvents and volumes, and ionic strength, were evaluated. Finally, 300 μL of coffee was mixed with a solution containing 400 μL of acetonitrile (dispersion solvent) and 100 μL of dichloromethane (extractive solvent). The DLLME allows the extraction of AA without further steps, avoiding the derivatization step which affects analysis time and solvent consumption. The proposed method was successfully applied to 17 coffees powdered of different origin (Brazil, Argentina, Italy, and Colombia), coffee bean variety (100% Arabica, Robusta and Arabica blend, and Predominantly Arabica), and degrees of roasting (dark roasted, medium, and medium-light coffee) in a precise way that can be used to evaluate the exposure of the human body to this contaminant from a highly consumed beverage.
Zhang et al. [114] presented simultaneous HS-GC analysis using EC and MS analysis for polychlorinated biphenyls (PCBs) and acrylamide at trace levels from milk and coffee samples using DLLME. The optimized in situ DLLME method uses a hydrophilic IL-based extraction solvent [HeOHMIM][Cl] (168 µL) which dissolves in an aqueous sample solution (2 mL). The addition of 368 µL of LiNTf2 leads to the formation of hydrophobic IL [BMIM][NTf2]. Extraction parameters, including IL molar ratio, metathesis reagent, and mass of IL employed were optimized, as well as the effects of HS oven temperature and HS sample vial volume. Acrylamide was quantified in prepared coffee samples. This method has enormous potential for routine analysis of contaminants present in complex food samples.
Custodio-Mendoza [115] focused on the simultaneous extraction of malondialdehyde, acrolein, and 4-hydroxy-2-nonenal from beverages, including beer, coffee, black tea, and fruit juices. An asymmetrical screening design and a central composite surface response design were used to investigate the influence of the most critical factors during the extraction process. Experimental designs included the study of critical factors, such as ultrasound time and temperature, extraction and disperser solvents volumes, salt addition, and derivatization reagent concentration. Optimal conditions were achieved using 1.3 mL ACN (disperser solvent) mixed with 90 µL chloroform (extraction solvent) and utilizing 0.5 mL derivatization reagent DNPH. The simultaneous extraction and derivatization process was conducted in an ultrasound bath at 60 °C for 5 min. The DNPH derivative formed from this process was subsequently quantified using GC-MS. The method was applied to simultaneously determine the compounds in 60 different beverage samples. The study demonstrated the utility of DLLME coupled with GC-MS detection to quantify these compounds in various beverages.

4.3. Milk

DLLME also has some limitations, such as operational difficulty, microdroplet instability, and bubble formation during extraction, affecting accuracy. An alternative approach involves the automation of the DLLME process. In developing this path, Nascimiento et al. [116] developed an analytical method using IL-DLLME in a batch pulsed-flow analyzer for formaldehyde determination in milk. Pulse flows were used to aid dispersion in the extractor, resulting in greater precision and greater extraction efficiency. Liquid (whole, skimmed, and pasteurized semi-skimmed) and whole powdered milk samples (1 mL) were treated with 1 mL of 0.2 M trichloroacetic acid to precipitate proteins. Using pulsed flows, 672 µL of sample was mixed with 176 µL of 2.0% (w/v) acetylacetone and 15% (w/v) ammonium acetate by Hantzsch reaction at 50 °C for 30 s to carry out the derivatization reaction. The solution was then mixed by adding 500 µL of an extractant-dispersant solvent mixture (150 µL of trihexyltetradecylphosphonium chloride as extractant and 400 µL of MeOH). Analyte derivatization and sample extraction are carried out in a closed system, allowing 10 extractions per hour. Simultaneous extraction and derivatization took place in a heated and closed chamber, improving the dispersion of the extractant. Processing of samples by flow batches favored phase separation and detection in the chamber, avoiding contamination and loss of analytes. The study demonstrated the potential of DLLME for detecting milk adulteration, opening avenues for enhancing analytical techniques.

4.4. Solid Food

Altunay’s research focuses on DLLME assisted by supramolecular alkanol solvent (SSA-DLLME) for the extraction of acrylamide in processed food samples, including coffee, chocolate, roasted nuts, chips, cereals and biscuits, potatoes, bread, and caramelized fruit [117].
The method developed was simple, fast, sensitive, selective, and environmentally friendly. The main innovation of this work was the use of alkanol-based supramolecular (SUPRAS) solvent as the extraction solvent. SUPRASs have the ability to dissolve solutes with varying polarities, concentrate them, and achieve high extraction efficiencies due to mixed-mode structures and multiple binding sites. Four factors affecting extraction, vortex time, pH, sample volume, and solvent volume were evaluated using a factorial design. Under optimal conditions, 1 mL of food sample was extracted with 400 µL of the prepared SUPRAS-2 (sodium dodecyl sulfate/tetrabutylammonium bromide/AlCl3). It was allowed to stand for 3 min after shaking for 2 min. The final volume of the extracting phase was brought to 500 µL with methanol and subjected to UV spectrophotometry. The results were comparable with those obtained using determination techniques with greater sensitivity, such as GC-MS or LC-MS/MS.
Nematollahi et al. (2020) employed DLLME coupled to GC-MS for extraction of acrylamide in 24 types of roasted nuts and seeds including almond, pistachio, peanut, and hazelnut, and roasted seeds including sunflower, pumpkin, and watermelon [118]. The samples were pretreated before DLLME to remove fats, proteins, and carbohydrates. The supernatant was subjected to derivatization with Xanthydrol and subsequently to DLLME by adding 80 µL of tetrachlorethylene (extraction solvent) and 300 µL of ethanol (dispersion solvent). The developed method was successfully used to quantify acrylamide in five significant groups of roasted nuts and seeds, demonstrating its potential utility in estimating exposure for the population.
Zokaei et al. used UAE-DLLME with GC-MS determination for the analysis of acrylamide in potato chip samples [119]. Acrylamide was derivatized using Xanthydrol solution before extraction with 60 µL tetrachlorethylene (extraction solvent) and 600 µL ethanol (dispersing solvent). The practical applicability of the proposed method under optimal conditions for acrylamide analysis was evaluated in potato chip samples.

4.5. Cereal Products

Nematollahi et al. [120] focused on the extraction of acrylamide in cereal products using DLLME and previously derivatizing it with Xanthydrol [114]. The Xanhydrol derivative was then subjected to GC-MS analysis. The most important parameters influencing the microextraction procedure, the extraction solvent volume, dispersing solvent volume, salt percentage, and pH, were evaluated by central composite design (CCD) as well as response surface design (RSM). Finally, tetrachloroethylene (80 μL) was chosen as the extracting solvent and ethanol (300 μL) was selected as the dispersing solvent. The proposed method was evaluated on 71 samples of different cereal products and showed a high capability for the fast determination of acrylamide in different complex cereal samples.
In Norouzi’s work, bread samples were derivatized with Xanthydrol for 30 min and light protected [121]. The Xanthydrol derivative was subjected to DLLME using 80 µL of ethylene tetrachloride and 0.55 mL methanol. The main factors affecting extraction were evaluated using a central composite design (CCD). The use of the UAE coupled to the DLLME allows for improved transfer of the analyte from the complex sample to the extraction solvent, reducing the extraction time and providing high sensitivity, accuracy, precision, and acceptable results in the analysis of real bread samples.

5. Combined Microextraction Techniques

Recent advancements in analytical sample preparation reflect a growing trend of integrating diverse extraction techniques to enhance aspects such as separation, cleanup, detection limits, enrichment factors, and the handling of complex sample matrices. The combination of microextraction methods to assess both organic and inorganic targets has proven valuable within the realm of modern analytical chemistry [122]. This approach allows for the concurrent execution of target extraction, pre-concentration, and cleanup stages, effectively shortening the overall procedure time and aligning well with the principles of green analytical chemistry [45,46,47]. This trend underscores a significant progression in analytical sample preparation, harnessing the strengths of various techniques to address intricate analytical challenges and yielding enhanced accuracy, sensitivity, and efficiency in analyzing a wide range of samples [123].
Custodio-Mendoza and colleagues introduced a novel approach involving simultaneous GC-MS analysis of MDA, acrolein (ACRL), formaldehyde, acetaldehyde, propanal, and pentanal, utilizing suspended GDME combined with DLLME [10]. The requirement for analytes to be in a suitable non-polar organic solvent for GC-MS analysis posed limitations on GDME’s application. This challenge became particularly pronounced for carbonyl compounds, especially when derivatized, due to their high volatility, making solvent exchanges intricate.
To address this, Custodio-Mendoza et al. employed a multi-step strategy. They commenced with GDME under optimized conditions: a 10 min extraction at 60 °C using 1 mL of DNPH (0.5 g/L in 2 M HCl) solution as the acceptor phase. The innovation emerged in the subsequent steps. The acceptor phase, containing aldehyde-DNPH derivatives, was transferred to a tube containing 4 mL of ultrapure water to undergo DLLME. A mixture of acetonitrile (0.75 mL) and 70 μL chloroform was injected into the aqueous phase and subjected to sonication at 60 °C for 5 min. This combination of techniques resulted in a cleaner extract with enhanced selectivity and sensitivity. Various solvents including isooctane, hexane, and chloroform were evaluated for optimal extraction.
Remarkably, DLLME facilitated solvent exchange and amplified method sensitivity through enrichment factors, significantly lowering detection limits and enhancing result precision. Another distinctive aspect of their approach was incorporating ultrasonic agitation during the GDME process, which substantially reduced extraction time, optimizing method efficiency and cost-effectiveness. This advancement not only surmounted a significant analytical challenge but also refined sensitivity and analysis speed. The processing and storage of edible oils can lead to oxidation, generating volatile compounds like hydrocarbons, aldehydes, alcohols, and ketones. Thus, quantifying these products serves as potential markers for food quality in the oxidative state. Notably, the method was successfully applied to the quantification of forty-eight samples of vegetable oil, spanning categories such as extra virgin olive oil, refined olive oil, olive-pomace oil, and refined seed oil. The outcomes revealed the presence of acrolein and propanal across all samples, with the highest concentration found in one category. Moreover, malondialdehyde levels seemed to decrease in oils enriched with antioxidants or virgin oils. This comprehensive approach demonstrated the potential for robust lipid peroxidation assessment in various oil types.

6. Conclusions

While controlled lipid peroxidation enhances food flavors and aromas, excessive peroxidation results in the formation of secondary products, leading to sensory deterioration and off flavors, and potentially representing a health risk. Analyzing lipid peroxidation products is challenging due to reactivity and volatility. As a result, microextraction techniques, such as DLLME, SPME, and GDME, are efficient for quantifying lipid peroxidation products in food, which can be used as food quality markers.
GDME, when applied to analyze carbonyl compounds, has shown potential for accurate and sensitive results. Adjusting GDME operational parameters (sample size, acceptor solution volume and composition, pH, reaction time and temperature) allows successful analyses of secondary lipid peroxidation products. Combining GDME with advanced analytical techniques, such as HPLC-UV and GC-MS, improves precision and efficiency in quantifying malondialdehyde, glyoxal, diacetyl, and acrolein, among others, in different food matrices such as alcoholic beverages, oils, and solid foods. This innovative approach addresses challenges in sample preparation, solvent usage, and sensitivity, paving the way for advancements in food analyses.
SPME’s versatility and selective extraction make it ideal for analyzing lipid peroxidation products, reducing interference from complex matrices. SPME’s minimal solvent usage aligns with trends of green analytical chemistry, and its compatibility with various analytical techniques reinforces its value for accurate food analysis. HS-SPME-GC-MS provides insights into volatile compound formations (i.e., hexanal, pentanal, and malondialdehyde) associated with lipid oxidation, Maillard reactions, and proteolysis. HS-SPME offers precise quantification when parameters like fiber type, temperature, and extraction time are optimized. SPME has been used to investigate factors affecting the formation of volatile compounds in cooked meats, cereals, dairy products, infant foods, and alcoholic beverages, providing valuable information for quality control and authentication. Derivatization techniques, particularly with pentafluorobenzyl hydroxylamine, enhance sensitivity and selectivity for the detection of challenging compounds.
DLLME is a powerful and versatile technique for extracting analytes from diverse matrices due to its simplicity, speed, and efficiency. The proper selection of extraction conditions and suitable solvents is crucial for successful DLLME. Dispersing solvents like acetone or acetonitrile influence droplet formation, while ionic liquids (ILs) and less dense alcohols are preferred as extractive solvents over traditional chlorinated solvents due to their environmentally friendly nature and microwave compatibility. DLLME has been effectively applied to assess lipid peroxidation byproducts in a wide range of foods, including beverages, coffee, milk, and solid foods. Combining IL-based DLLME with microwave-assisted derivatization has proven precise for formaldehyde quantification in beverages. It has also shown proficiency in isolating undesirable elements like acrylamide in coffee analysis. Researchers are working on automating DLLME through pulsed-flow analyzers to enhance accuracy and efficiency, particularly for milk adulteration detection. DLLME excels in solid food analyses, achieving success in processed foods, nuts, seeds, and cereals, underscoring its versatility. Innovative solvent systems and parameter optimizations have enabled the sensitive and precise quantification of contaminants like acrylamide while streamlining the analytical process.
Notably, the combined use of microextraction techniques, including GDME, SPME, and DLLME, shows significant promise for analyzing lipid peroxidation products. This approach improves sensitivity, expands analyte coverage, reduces matrix interference, and optimizes resource utilization. By synergistically applying these techniques, accuracy is enhanced through cross verification and capitalizing on their complementary strengths. This innovative approach fosters scientific advancements and adapts to evolving analytical challenges, making it a valuable strategy for studying lipid oxidation processes.
Research into compounds like malondialdehyde, acrolein, furan, and ethyl carbamate addresses health concerns due to their potential presence in concentrations that may pose risks to consumers. Calculating Margin of Exposure (MOE) values provides essential information for assessing health risks and guiding regulatory decisions.
Furthermore, this research advances our understanding of oxidative processes and drives innovations in antioxidants, packaging, and production methods, ultimately enhancing food quality and safety. It also facilitates compliance with regulatory standards, optimization of production processes, and ensures transparency in food labeling through the analysis of secondary peroxidation products.
DLLME, SPME, and GDME each have their advantages in terms of cost-effectiveness and energy efficiency, depending on the specific analytical requirements and the availability of equipment and materials. In terms of cost efficiency, all these methods require an initial investment in materials and reagents. Despite common laboratory materials, DLLME necessitates the use of a micro-syringe to collect the extractive phase (drop), GDME modules are not commercially available yet, and SPME requires relatively costly fibers and holders. In contrast, DLLME and GDME can be considered cost effective in terms of chemical usage, while SPME offers long-term savings by reducing solvent consumption. Regarding energy effectiveness, these techniques are generally comparable, employing the same stirring methods (magnetic, ultrasound) and incubation via water baths. DLLME can also be stirred using vortex or hand shaking, but is limited to room temperature applications, which fall outside the scope of lipid peroxidation product analysis. The best choice for a particular application will depend on various factors, including the target analyte, sample matrix, derivatization conditions, analytical instrument, and available resources.
Future advancements in microextraction techniques for secondary lipid peroxidation products offer substantial potential. Researchers can enhance sensitivity through optimized methods for carbonyl compounds, incorporating advanced detection methods like high-resolution mass spectrometry. For GDME, improvements focus on selectivity via modified membranes, portable on-site devices, and integration with other sample prep techniques. SPME can benefit from novel coatings for improved target interaction, high-temperature stability, miniaturization for point-of-care use, and automation for efficiency and real-time feedback. DLLME offers opportunities in solvent selection for better efficiency and eco-friendliness, along with automation and miniaturization to boost throughput and reduce costs.
Expanding the use of microextraction to diverse sample types, including complex food and biological samples, while emphasizing high-throughput analysis and automation, improves throughput, precision, and consistency in clinical studies and food quality control. These efforts contribute to a better understanding of the roles of lipid peroxidation products in health, disease, and environmental monitoring. Standardization, integration with other omics data, and exploring multimodal extraction strategies will further enhance the capabilities of this field.

Author Contributions

Conceptualization, J.A.C.-M. and A.M.C.; investigation, J.A.C.-M., A.M.A.-F. and A.M.C.; writing—original draft preparation, J.A.C.-M., A.M.A.-F. and A.M.C.; writing—review and editing, J.A.C.-M., A.M.A.-F. and A.M.C.; visualization, J.A.C.-M., A.M.A.-F. and A.M.C.; project administration, A.M.C. All authors have read and agreed to the published version of the manuscript.

Funding

This work was supported by the Spanish Ministry of Science, Innovation, and Universities (Project RTI2018-096450-B-I00) and FEDER funds.

Data Availability Statement

No new data were created or analyzed in this study. Data sharing is not applicable to this article.

Conflicts of Interest

The authors declare no conflict of interest. The funders had no role in the design of the study; in the collection, analyses, or interpretation of data; in the writing of the manuscript; or in the decision to publish the results.

References

  1. Yin, H.; Xu, L.; Porter, N.A. Free radical lipid peroxidation: Mechanisms and analysis. Chem. Rev. 2011, 111, 5944–5972. [Google Scholar] [CrossRef] [PubMed]
  2. Guéraud, F.; Atalay, M.; Bresgen, N.; Cipak, A.; Eckl, P.M.; Huc, L.; Uchida, K. Chemistry and biochemistry of lipid peroxidation products. Free Radic. Res. 2010, 44, 1098–1124. [Google Scholar] [CrossRef] [PubMed]
  3. Repetto, M.; Semprine, J.; Boveris, A. Lipid peroxidation: Chemical mechanism, biological implications and analytical determination. Lipid Peroxidation 2012, 1, 3–30. [Google Scholar]
  4. Sun, Y.E.; Wang, W.D.; Chen, H.W.; Li, C. Autoxidation of unsaturated lipids in food emulsion. Crit. Rev. Food Sci. Nutr. 2011, 51, 453–466. [Google Scholar] [CrossRef] [PubMed]
  5. Pryoir, W.A.; Prier, D.G.; Lightsey, J.W. Kinetic and mechanism studies of peroxy, vitamin e and anti-oxidant free radicals by pulse radiolysis. In Autoxidation in Food and Biological Systems, 1st ed.; Simic, M.G., Karel, M., Eds.; Springer Science & Business Media: Washington, DC, USA, 2013; pp. 17–26. [Google Scholar]
  6. Zielinski, Z.A.; Pratt, D.A. Lipid Peroxidation: Kinetics, mechanisms, and products. J. Org. Chem. 2017, 82, 2817–2825. [Google Scholar] [CrossRef] [PubMed]
  7. Islam, F.; Imran, A.; Nosheen, F.; Fatima, M.; Arshad, M.U.; Afzaal, M.; Ijaz, N.; Noreen, R.; Mehta, S.; Biswas, S.; et al. Functional roles and novel tools for improving-oxidative stability of polyunsaturated fatty acids: A comprehensive review. Food Sci Nutr. 2023, 11, 2471–2482. [Google Scholar] [CrossRef]
  8. Rendón, M.Y.; Salva, T.D.J.G.; Bragagnolo, N. Impact of chemical changes on the sensory characteristics of coffee beans during storage. Food Chem. 2014, 147, 279–286. [Google Scholar] [CrossRef]
  9. Pegg, R.B.; Shahidi, F. Off flavors and rancidity in foods. In Handbook of Meat, Poultry and Seafood Quality; Nollet, L.M.L., Ed.; Wiley-Blackwell: Oxford, UK, 2012; Part 2; pp. 127–139. [Google Scholar]
  10. Custodio-Mendoza, J.A.; Aja-Macaya, J.; Valente, I.M.; Rodrigues, J.A.; Almeida, P.J.; Lorenzo, R.A.; Carro, A.M. Determination of malondialdehyde, acrolein and four other products of lipid peroxidation in edible oils by Gas-Diffusion Microextraction combined with Dispersive Liquid-Liquid Microextraction. J. Chromatogr. A 2020, 1627, 461397. [Google Scholar] [CrossRef]
  11. Rodrigues, F.; Caldeira, M.; Câmara, J.D.S. Development of a dynamic headspace solid-phase microextraction procedure coupled to GC–qMSD for evaluation the chemical profile in alcoholic beverages. Anal. Chim. Acta 2008, 609, 82–104. [Google Scholar] [CrossRef]
  12. Min, B.; Ahn, D.U. Mechanism of lipid peroxidation in meat and meat products-A review. Food Sci. Biotechnol. 2005, 14, 152–163. [Google Scholar]
  13. Khan, I.T.; Nadeem, M.; Imran, M.; Ullah, R.; Ajmal, M.; Jaspal, M.H. Antioxidant properties of Milk and dairy products: A comprehensive review of the current knowledge. Lipids Health Dis. 2019, 18, 1–13. [Google Scholar] [CrossRef] [PubMed]
  14. Carrasco-Pancorbo, A.; Cerretani, L.; Bendini, A.; Segura-Carretero, A.; Del Carlo, M.; Gallina-Toschi, T.; Lercker, G.; Compagnone, D.; Fernandez-Gutierrez, A. Evaluation of the antioxidant capacity of individual phenolic compounds in virgin olive oil. J. Agric. Food Chem. 2005, 53, 8918–8925. [Google Scholar] [CrossRef] [PubMed]
  15. Wiśniewska, P.; Śliwińska, M.; Dymerski, T.; Wardencki, W.; Namieśnik, J. The analysis of raw spirits–a review of methodology. J. Inst. Brew. 2016, 122, 5–10. [Google Scholar] [CrossRef]
  16. Hernandes, K.C.; Souza-Silva, É.A.; Assumpção, C.F.; Zini, C.A.; Welke, J.E. Carbonyl compounds and furan derivatives with toxic potential evaluated in the brewing stages of craft beer. Food Addit. Contam. Part A 2020, 37, 61–68. [Google Scholar] [CrossRef] [PubMed]
  17. Perrone, G.G.; Tan, S.X.; Dawes, I.W. Reactive oxygen species and yeast apoptosis. Biochim. Biophys. Acta Mol. Cell. Res. 2008, 1783, 1354–1368. [Google Scholar] [CrossRef] [PubMed]
  18. Culleré, L.; Cacho, J.; Ferreira, V. An assessment of the role played by some oxidation-related aldehydes in wine aroma. J. Agric. Food. Chem. 2007, 55, 876–881. [Google Scholar] [CrossRef] [PubMed]
  19. Amaral, A.B.; Silva, M.V.D.; Lannes, S.C.D.S. Lipid oxidation in meat: Mechanisms and protective factors—A review. Food Sci. Tech. 2018, 38, 1–15. [Google Scholar] [CrossRef]
  20. Łuczaj, W.; Skrzydlewska, E. DNA damage caused by lipid peroxidation products. Cell Mol. Biol. Lett. 2003, 8, 391–413. [Google Scholar]
  21. World Health Organization. IARC Monographs on the Identification of Carcinogenic Hazards to Humans. 2023. Available online: https://monographs.iarc.who.int/list-of-classifications/ (accessed on 25 August 2023).
  22. European Food Safety Authority (EFSA). Opinion of the Scientific Panel on food additives, flavourings, processing aids and materials in contact with food (AFC) related to use of formaldehyde as a preservative during the manufacture and preparation of food additives. EFSA J. 2007, 5, 415. [Google Scholar] [CrossRef]
  23. Center for Drug Evaluation and Research M7(R2) Addendum: Application of the Principles of the ICH M7 Guideline, U.S. Food and Drug Administration. Available online: https://www.fda.gov/media/157451/download (accessed on 25 August 2023).
  24. Van Andel, I.; Sleijffers, A.; Schenk, E.; Rambali, B.; Wolterink, G.; Vleeming, W.; van Amsterdam, J.G.C. Adverse Health Effects of Cigarette Smoke: Aldehydes Crotonaldehyde, Butyraldehyde, Hexanal and Malonaldehyde; Dutch National Institute of Public Health and the Environment: Utrecht, The Netherland, 2006; Available online: http://hdl.handle.net/10029/7336 (accessed on 25 August 2023).
  25. Gomes, R.; Meek, M.K. Acrolein. Concise International Chemical Assessment Document 43. World Health Organization. 2002. Available online: https://www.who.int/ipcs/publications/cicad/en/cicad43.pdf (accessed on 25 August 2023).
  26. Papastergiadis, A.; Fatouh, A.; Jacxsens, L.; Lachat, C.; Shrestha, K.; Daelman, J.; Kolsteren, P.; Van Langenhove, H.; De Meulenaer, B. Exposure assessment of Malondialdehyde, 4-Hydroxy-2-(E)-Nonenal and 4-Hydroxy-2-(E)-Hexenal through specific foods available in Belgium. Food Chem. Tox. 2014, 73, 51–58. [Google Scholar] [CrossRef]
  27. Guth, S.; Baum, M.; Cartus, A.T.; Diel, P.; Engel, K.H.; Engeli, B.; Epe, B.; Grune, T.; Haller, D.; Heinz, V.; et al. Evaluation of the genotoxic potential of acrylamide: Arguments for the derivation of a tolerable daily intake (TDI value). Food Chem. Toxicol. 2023, 173, 113632. [Google Scholar] [CrossRef] [PubMed]
  28. Clark, S.; Winter, C.K. Diacetyl in foods: A review of safety and sensory characteristics. Compr. Rev. Food Sci. Food Saf. 2015, 14, 634–643. [Google Scholar] [CrossRef]
  29. EFSA Panel on Food Additives and Flavourings (FAF); Younes, M.; Aquilina, G.; Castle, L.; Engel, K.H.; Fowler, P.; Mennes, W. Scientific Opinion on Flavouring Group Evaluation 13 Revision 3 (FGE. 13Rev3): Furfuryl and furan derivatives with and without additional side-chain substituents and heteroatoms from chemical group 14. EFSA J. 2021, 19, 06386. [Google Scholar]
  30. Kielhorn, J.; Pohlenz-Michel, C.; Schmidt, S.; Mangelsdorf, I. Glyoxal. World Health Organization. 2004. Available online: https://apps.who.int/iris/handle/10665/42867 (accessed on 25 August 2023).
  31. Renwick, A.G. Structure-based thresholds of toxicological concern—Guidance for application to substances present at low levels in the diet. Toxicol. Appl. Pharmacol. 2005, 207, 585–591. [Google Scholar] [CrossRef] [PubMed]
  32. Amorati, R.; Valgimigli, L. Advantages and limitations of common testing methods for antioxidants. Free Radic. Res. 2015, 49, 633–649. [Google Scholar] [CrossRef]
  33. Demirci-Cekic, S.; Özkan, G.; Avan, A.N.; Uzunboy, S.; Çapanoğlu, E.; Apak, R. Biomarkers of oxidative stress and antioxidant defense. J. Pharm. Biomed. Anal. 2022, 209, 114477. [Google Scholar] [CrossRef]
  34. Grebenteuch, S.; Kroh, L.W.; Drusch, S.; Rohn, S. Formation of secondary and tertiary volatile compounds resulting from the lipid oxidation of rapeseed oil. Foods 2021, 10, 2417. [Google Scholar] [CrossRef]
  35. Laghrib, F.; Lahrich, S.; El Mhammedi, M.A. Recent Advances in Direct and Indirect Methods for Sensing Carbonyl Compounds Aldehydes in Environment and Foodstuffs. J. Electrochem. Soc. 2019, 166, B1543. [Google Scholar] [CrossRef]
  36. Li, H.; Li, H.; Liu, X.; Chen, B. Analysis of volatile flavor compounds in top fermented wheat beer by headspace sampling-gas chromatography. Int. J. Agric. Biol. Eng. 2012, 5, 67–75. [Google Scholar]
  37. Zamani, A.; Fashi, A. Extraction and preconcentration of trace malondialdehyde from lipid-rich foods using ion pair–based solvent bar liquid-phase microextraction. Food Anal. Methods 2019, 12, 1625–1634. [Google Scholar] [CrossRef]
  38. Zhang, D.; Zhang, J.; Li, M.; Li, W.; Aimaiti, G.; Tuersun, G.; Chu, Q. A novel miniaturised electrophoretic method for determining formaldehyde and acetaldehyde in food using 2-thiobarbituric acid derivatisation. Food Chem. 2011, 129, 206–212. [Google Scholar] [CrossRef]
  39. Zeb, A.; Ullah, F. A simple spectrophotometric method for the determination of thiobarbituric acid reactive substances in fried fast foods. J. Anal. Methods Chem. 2016, 2016, 9412767. [Google Scholar] [CrossRef] [PubMed]
  40. Mathew, S.; Grey, C.; Rumpunen, K.; Adlercreutz, P. Analysis of carbonyl compounds in sea buckthorn for the evaluation of triglyceride oxidation, by enzymatic hydrolysis and derivatisation methodology. Food Chem. 2011, 126, 1399–1405. [Google Scholar] [CrossRef]
  41. Suh, J.H.; Ho, C.T.; Wang, Y. Evaluation of carbonyl species in fish oil: An improved LC–MS/MS method. Food Control 2017, 78, 463–468. [Google Scholar] [CrossRef]
  42. Serrano, M.; Gallego, M.; Silva, M. Quantitative analysis of aldehydes in canned vegetables using static headspace–gas chromatography–mass spectrometry. J. Chromatogr. A 2017, 1524, 21–28. [Google Scholar] [CrossRef] [PubMed]
  43. Zelzer, S.; Oberreither, R.; Bernecker, C.; Stelzer, I.; Truschnig-Wilders, M.; Fauler, G. Measurement of total and free malondialdehyde by gas–chromatography mass spectrometry–comparison with high-performance liquid chromatography methology. Free Radic. Res. 2013, 47, 651–656. [Google Scholar] [CrossRef]
  44. Ghorbani, M.; Aghamohammadhassan, M.; Chamsaz, M.; Akhlaghi, H.; Pedramrad, T. Dispersive solid phase microextraction. TrAC Trends Anal. Chem. 2019, 118, 793–809. [Google Scholar] [CrossRef]
  45. López-Lorente, Á.I.; Pena-Pereira, F.; Pedersen-Bjergaard, S.; Zuin, V.G.; Ozkan, S.A.; Psillakis, E. The ten principles of green sample preparation. TrAC Trends Anal. Chem. 2022, 148, 116530. [Google Scholar] [CrossRef]
  46. Atapattu, S.N.; Rosenfeld, J.M. Analytical derivatizations in environmental analysis. J. Chromatogr. 2022, 1678, 463348. [Google Scholar] [CrossRef]
  47. Kokosa, J.M.; Przyjazny, A. Green microextraction methodologies for sample preparations. Green Anal. Chem. 2022, 3, 100023. [Google Scholar] [CrossRef]
  48. Pacheco, J.G.; Valente, I.M.; Gonçalves, L.M.; Rodrigues, J.A.; Barros, A.A. Gas-diffusion microextraction. J. Sep. Sci. 2010, 33, 3207–3212. [Google Scholar] [CrossRef] [PubMed]
  49. Jalili, V.; Barkhordari, A.; Ghiasvand, A. A comprehensive look at solid-phase microextraction technique: A review of reviews. Microchem. J. 2020, 152, 104319. [Google Scholar] [CrossRef]
  50. Sajid, M. Dispersive liquid-liquid microextraction: Evolution in design, application areas, and green aspects. TrAC Trends Anal. Chem. 2022, 152, 116636. [Google Scholar] [CrossRef]
  51. More, V.N.; Mundhe, D.G. Microextraction techniques in analysis of drugs. Int. J. Res. Pharm.Chem. 2013, 3, 330–344. [Google Scholar]
  52. Risheed, C.M.; Fakhre, N.A.; Mohammed, M.I.; Ali, D.K. Hollow Fiber Nano Membrane as Liquid Phase Microextraction for Determination of Enrofloxacin in the Prsence of Florfenicol and Tylosin in Chicken Tissues. Egypt. J. Chem. 2022, 65, 133–141. [Google Scholar] [CrossRef]
  53. Mirnaghi, F.S.; Goryński, K.; Rodriguez-Lafuente, A.; Boyacı, E.; Bojko, B.; Pawliszyn, J. Microextraction versus exhaustive extraction approaches for simultaneous analysis of compounds in wide range of polarity. J. Chromatogr. A 2013, 1316, 37–43. [Google Scholar] [CrossRef]
  54. Gonçalves, L.M.; Magalhães, P.J.; Valente, I.M.; Pacheco, J.G.; Dostálek, P.; Sýkora, D.; Rodrigues, J.A.; Barros, A.A. Analysis of aldehydes in beer by gas-diffusion microextraction: Characterization by high-performance liquid chromatography–diode-array detection–atmospheric pressure chemical ionization–mass spectrometry. J. Chromatogr. A 2010, 1217, 3717–3722. [Google Scholar] [CrossRef]
  55. Ferreira, I.M.; Carvalho, D.O.; da Silva, M.G.; Guido, L.F. Gas-Diffusion Microextraction (GDME) Combined with Derivatization for Assessing Beer Staling Aldehydes: Validation and Application. Foods 2021, 10, 1704. [Google Scholar] [CrossRef]
  56. Ramos, R.M.; Pacheco, J.G.; Gonçalves, L.M.; Valente, I.M.; Rodrigues, J.A.; Barros, A.A. Determination of free and total diacetyl in wine by HPLC–UV using gas-diffusion microextraction and pre-column derivatization. Food Control 2012, 24, 220–224. [Google Scholar] [CrossRef]
  57. Cruz, M.P.; Valente, I.M.; Gonçalves, L.M.; Rodrigues, J.A.; Barros, A.A. Application of gas-diffusion microextraction to the analysis of free and bound acetaldehyde in wines by HPLC–UV and characterization of the extracted compounds by MS/MS detection. Anal. Bioanal. Chem. 2012, 403, 1031–1037. [Google Scholar] [CrossRef]
  58. Ramos, R.M.; Gonçalves, L.M.; Vyskočil, V.; Rodrigues, J.A. Voltammetric determination of trace amounts of diacetyl at a mercury meniscus modified silver solid amalgam electrode following gas-diffusion microextraction. Talanta 2017, 169, 203–208. [Google Scholar] [CrossRef] [PubMed]
  59. Santos, C.M.; Valente, I.M.; Gonçalves, L.M.; Rodrigues, J.A. Chromatographic analysis of methylglyoxal and other α-dicarbonyls using gas-diffusion microextraction. Analyst 2013, 138, 7233–7237. [Google Scholar] [CrossRef] [PubMed]
  60. Custodio-Mendoza, J.A.; Valente, I.M.; Ramos, R.M.; Lorenzo, R.A.; Carro, A.M.; Rodrigues, J.A. Analysis of free malondialdehyde in edible oils using gas-diffusion microextraction. J. Food Compos. Anal. 2019, 82, 103254. [Google Scholar] [CrossRef]
  61. Ferreira, R.C.; Ramos, R.M.; Gonçalves, L.M.; Almeida, P.J.; Rodrigues, J.A. Application of gas-diffusion microextraction to solid samples using the chromatographic determination of α-diketones in bread as a case study. Analyst 2015, 140, 3648–3653. [Google Scholar] [CrossRef] [PubMed]
  62. Cordeiro, L.; Valente, I.M.; Santos, J.R.; Rodrigues, J.A. Qualitative carbonyl profile in coffee beans through GDME-HPLC-DAD-MS/MS for coffee preliminary characterization. Food Res. Int. 2018, 107, 536–543. [Google Scholar] [CrossRef]
  63. Câmara, J.S.; Perestrelo, R.; Berenguer, C.V.; Andrade, C.F.; Gomes, T.M.; Olayanju, B.; Pereira, J.A. Green extraction techniques as advanced sample preparation approaches in biological, food, and environmental matrices: A review. Molecules 2022, 27, 2953. [Google Scholar] [CrossRef]
  64. Jeleń, H.H.; Obuchowska, M.; Zawirska-Wojtasiak, R.; Wasowicz, E. Headspace solid-phase microextraction use for the characterization of volatile compounds in vegetable oils of different sensory quality. J. Agric. Food Chem. 2000, 48, 2360–2367. [Google Scholar] [CrossRef]
  65. Uchida, T.; Gotoh, N.; Wada, S. Method for analysis of 4-hydroxy-2-(E)-nonenal with solid-phase microextraction. Lipids 2002, 37, 621–626. [Google Scholar] [CrossRef]
  66. Fujioka, K.; Shibamoto, T. Improved malonaldehyde assay using headspace solid-phase microextraction and its application to the measurement of the antioxidant activity of phytochemicals. J. Agric. Food Chem. 2005, 53, 4708–4713. [Google Scholar] [CrossRef]
  67. Pastorelli, S.; Valzacchi, S.; Rodriguez, A.; Simoneau, C. Solid-phase microextraction method for the determination of hexanal in hazelnuts as an indicator of the interaction of active packaging materials with food aroma compounds. Food Addit. Contam. 2006, 23, 1236–1241. [Google Scholar] [CrossRef]
  68. Ma, C.; Ji, J.; Tan, C.; Chen, D.; Luo, F.; Wang, Y.; Chen, X. Headspace solid-phase microextraction coupled to gas chromatography for the analysis of aldehydes in edible oils. Talanta 2014, 120, 94–99. [Google Scholar] [CrossRef]
  69. Goicoechea, E.; Van Twillert, K.; Duits, M.; Brandon, E.D.; Kootstra, P.R.; Blokland, M.H.; Guillén, M.D. Use of an in vitro digestion model to study the bioaccessibility of 4-hydroxy-2-nonenal and related aldehydes present in oxidized oils rich in omega-6 acyl groups. J. Agric. Food Chem. 2008, 56, 8475–8483. [Google Scholar] [CrossRef]
  70. Guillén, M.D.; Carton, I.; Salmeron, J.; Casas, C. Headspace composition of cod liver oil and its evolution in storage after opening. First evidence of the presence of toxic aldehydes. Food chem. 2009, 114, 1291–1300. [Google Scholar] [CrossRef]
  71. Damerau, A.; Kamlang-ek, P.; Moisio, T.; Lampi, A.M.; Piironen, V. Effect of SPME extraction conditions and humidity on the release of volatile lipid oxidation products from spray-dried emulsions. Food Chem. 2014, 157, 1–9. [Google Scholar] [CrossRef]
  72. Martin-Rubio, A.S.; Sopelana, P.; Guillén, M.D. The key role of ovalbumin in lipid bioaccessibility and oxidation product profile during the in vitro digestion of slightly oxidized soybean oil. Food Func. 2019, 10, 4440–4451. [Google Scholar] [CrossRef]
  73. Liu, X.; Jin, Q.; Liu, Y.; Huang, J.; Wang, X.; Mao, W.; Wang, S. Changes in volatile compounds of peanut oil during the roasting process for production of aromatic roasted peanut oil. J. Food Sci. 2011, 76, C404–C412. [Google Scholar] [CrossRef] [PubMed]
  74. Liu, Y.; Xu, X.L.; Ouyang, G.F.; Zhou, G.H. Changes in volatile compounds of traditional Chinese Nanjing water-boiled salted duck during processing. J. Food Sci. 2006, 71, S371–S377. [Google Scholar] [CrossRef]
  75. Mariutti, L.R.; Nogueira, G.C.; Bragagnolo, N. Solid phase microextraction-gas chromatography for the evaluation of secondary lipid oxidation products in chicken patties during long-term storage. J. Braz. Chem. Soc. 2009, 20, 1849–1855. [Google Scholar] [CrossRef]
  76. Estévez, M.; Ventanas, S.; Cava, R. Oxidation of lipids and proteins in frankfurters with different fatty acid compositions and tocopherol and phenolic contents. Food Chem. 2007, 100, 55–63. [Google Scholar] [CrossRef]
  77. Chopin, C.; Kone, M.; Serot, T. Study of the interaction of fish myosin with the products of lipid oxidation: The case of aldehydes. Food Chem. 2007, 105, 126–132. [Google Scholar] [CrossRef]
  78. Iglesias, J.; Gallardo, J.M.; Medina, I. Determination of carbonyl compounds in fish species samples with solid-phase microextraction with on-fibre derivatization. Food Chem. 2010, 123, 771–778. [Google Scholar] [CrossRef]
  79. Lopez, A.; Bellagamba, F.; Tirloni, E.; Vasconi, M.; Stella, S.; Bernardi, C.; Pazzaglia, M.; Moretti, V.M. Evolution of food safety features and volatile profile in white sturgeon caviar treated with different formulations of salt and preservatives during a long-term storage time. Foods 2021, 10, 850. [Google Scholar] [CrossRef] [PubMed]
  80. Domínguez, R.; Purriños, L.; Pérez-Santaescolástica, C.; Pateiro, M.; Barba, F.J.; Tomasevic, I.; Bastianello Campagnol, P.C.; Lorenzo, J.M. Characterization of volatile compounds of dry-cured meat products using HS-SPME-GC/MS technique. Food Anal. Methods 2019, 12, 1263–1284. [Google Scholar] [CrossRef]
  81. García-Llatas, G.; Lagarda, M.J.; Clemente, G.; Farré, R. Monitoring of headspace volatiles in milk-cereal-based liquid infant foods during storage. Eur. J. Lipid Sci. Technol. 2006, 108, 1028–1036. [Google Scholar] [CrossRef]
  82. García-Llatas, G.; Lagarda, M.J.; Romero, F.; Abellán, P.; Farré, R. A headspace solid-phase microextraction method of use in monitoring hexanal and pentane during storage: Application to liquid infant foods and powdered infant formulas. Food Chem. 2007, 101, 1078–1086. [Google Scholar] [CrossRef]
  83. Clarke, H.J.; Mannion, D.T.; O’Sullivan, M.G.; Kerry, J.P.; Kilcawley, K.N. Development of a headspace solid-phase microextraction gas chromatography mass spectrometry method for the quantification of volatiles associated with lipid oxidation in whole milk powder using response surface methodology. Food Chem. 2019, 292, 75–80. [Google Scholar] [CrossRef]
  84. Majcher, M.A.; Goderska, K.; Pikul, J.; Jeleń, H.H. Changes in volatile, sensory and microbial profiles during preparation of smoked ewe cheese. J. Sci. Food Agric. 2011, 91, 1416–1423. [Google Scholar] [CrossRef]
  85. Natrella, G.; Faccia, M.; Lorenzo, J.M.; De Palo, P.; Gambacorta, G. Sensory characteristics and volatile organic compound profile of high-moisture mozzarella made by traditional and direct acidification technology. J. Dairy Sci. 2020, 103, 2089–2097. [Google Scholar] [CrossRef]
  86. Cardinali, F.; Foligni, R.; Ferrocino, I.; Harasym, J.; Orkusz, A.; Milanović, V.; Franciosa, O.; Garofalo, C.; Mannozzi, C.; Mozzon, M.; et al. Microbiological, morpho-textural, and volatile characterization of Portuguese Queijo de Nisa PDO cheese. Food Res. Int. 2022, 162, 112011. [Google Scholar] [CrossRef]
  87. Vesely, P.; Lusk, L.; Basarova, G.; Seabrooks, J.; Ryder, D. Analysis of aldehydes in beer using solid-phase microextraction with on-fiber derivatization and gas chromatography/mass spectrometry. J. Agric. Food Chem. 2003, 51, 6941–6944. [Google Scholar] [CrossRef]
  88. Saison, D.; De Schutter, D.P.; Delvaux, F.; Delvaux, F.R. Determination of carbonyl compounds in beer by derivatisation and headspace solid-phase microextraction in combination with gas chromatography and mass spectrometry. J. Chromatogr. A 2009, 1216, 5061–5068. [Google Scholar] [CrossRef] [PubMed]
  89. Moreira, N.; Meireles, S.; Brandão, T.; de Pinho, P.G. Optimization of the HS-SPME–GC–IT/MS method using a central composite design for volatile carbonyl compounds determination in beers. Talanta 2013, 117, 523–531. [Google Scholar] [CrossRef] [PubMed]
  90. Hernandes, K.C.; Souza-Silva, É.A.; Assumpção, C.F.; Zini, C.A.; Welke, J.E. Validation of an analytical method using HS-SPME-GC/MS-SIM to assess the exposure risk to carbonyl compounds and furan derivatives through beer consumption. Food Addit. Contam. Part A 2019, 36, 1808–1821. [Google Scholar] [CrossRef] [PubMed]
  91. Perez Olivero, S.J.; Perez Trujillo, J.P. A new method for the determination of carbonyl compounds in wines by headspace solid-phase microextraction coupled to gas chromatography−ion trap mass spectrometry. J. Agric. Food Chem. 2010, 58, 12976–12985. [Google Scholar] [CrossRef] [PubMed]
  92. Butkhup, L.; Jeenphakdee, M.; Jorjong, S.; Samappito, S.; Samappito, W.; Chowtivannakul, S. HS-SPME-GC-MS analysis of volatile aromatic compounds in alcohol related beverages made with mulberry fruits. Food Sci. Biotechnol. 2011, 20, 1021–1032. [Google Scholar] [CrossRef]
  93. Lago, L.O.; Nicolli, K.P.; Marques, A.B.; Zini, C.A.; Welke, J.E. Influence of ripeness and maceration of the grapes on levels of furan and carbonyl compounds in wine—Simultaneous quantitative determination and assessment of the exposure risk to these compounds. Food Chem. 2017, 230, 594–603. [Google Scholar] [CrossRef]
  94. Ferreira, D.C.; Hernandes, K.C.; Nicolli, K.P.; Souza-Silva, É.A.; Manfroi, V.; Zini, C.A.; Welke, J.E. Development of a method for determination of target toxic carbonyl compounds in must and wine using HS-SPME-GC/MS-SIM after preliminary GC× GC/TOFMS analyses. Food Anal. Methods 2019, 12, 108–120. [Google Scholar] [CrossRef]
  95. Moreira, N.; Araújo, A.M.; Rogerson, F.; Vasconcelos, I.; De Freitas, V.; de Pinho, P.G. Development and optimization of a HS-SPME-GC-MS methodology to quantify volatile carbonyl compounds in Port wines. Food Chem. 2019, 270, 518–526. [Google Scholar] [CrossRef]
  96. Piergiovanni, M.; Carlin, S.; Lotti, C.; Vrhovsek, U.; Mattivi, F. Development of a Fully Automated Method HS-SPME-GC-MS/MS for the Determination of Odor-Active Carbonyls in Wines: A “Green” Approach to Improve Robustness and Productivity in the Oenological Analytical Chemistry. J. Agric. Food Chem. 2023. [CrossRef]
  97. Wardencki, W.; Sowiński, P.; Curyło, J. Evaluation of headspace solid-phase microextraction for the analysis of volatile carbonyl compounds in spirits and alcoholic beverages. J. Chromatogr. A 2003, 984, 89–96. [Google Scholar] [CrossRef]
  98. López-Vázquez, C.; Orriols, I.; Perelló, M.C.; De Revel, G. Determination of aldehydes as pentafluorobenzyl derivatives in grape pomace distillates by HS-SPME-GC/MS. Food Chem. 2012, 130, 1127–1133. [Google Scholar] [CrossRef]
  99. Perestrelo, R.; Silva, C.L.; Silva, P.; Medina, S.; Pereira, R.; Câmara, J.S. Untargeted fingerprinting of cider volatiles from different geographical regions by HS-SPME/GC-MS. Microchem. J. 2019, 148, 643–651. [Google Scholar] [CrossRef]
  100. Yu, J.; Zhou, Z.; Xu, X.; Ren, H.; Gong, M.; Ji, Z.; Liu, S.; Hu, Z.; Mao, J. Differentiating Huangjiu with Varying Sugar Contents from Different Regions Based on Targeted Metabolomics Analyses of Volatile Carbonyl Compounds. Foods 2023, 12, 1455. [Google Scholar] [CrossRef] [PubMed]
  101. Lim, H.H.; Shin, H.S. In-solution derivatization and detection of glyoxal and methylglyoxal in alcoholic beverages and fermented foods by headspace solid-phase microextraction and gas chromatography–mass spectrometry. J. Food Compos. Anal. 2020, 92, 103584. [Google Scholar] [CrossRef]
  102. Elisia, I.; Kitts, D.D. Quantification of hexanal as an index of lipid oxidation in human milk and association with antioxidant components. J. Clin. Biochem. Nutr. 2011, 49, 147–152. [Google Scholar] [CrossRef] [PubMed]
  103. Maire, M.; Rega, B.; Cuvelier, M.E.; Soto, P.; Giampaoli, P. Lipid oxidation in baked products: Impact of formula and process on the generation of volatile compounds. Food Chem. 2013, 141, 3510–3518. [Google Scholar] [CrossRef]
  104. Fenaille, F.; Visani, P.; Fumeaux, R.; Milo, C.; Guy, P.A. Comparison of mass spectrometry-based electronic nose and solid phase microextraction gas chromatography mass spectrometry technique to assess infant formula oxidation. J. Agric. Food Chem. 2003, 51, 2790–2796. [Google Scholar] [CrossRef]
  105. Li, X.; He, Y.; Xie, Y.; Zhu, D.; Yang, L.; Wang, S.; Liu, H. Effect of catalase on lipid oxidation and flavor substances of α-instant rice during storage. Food Sci. Tech. 2022, 42, e46822. [Google Scholar] [CrossRef]
  106. Rezaee, M.; Assadi, Y.; Hosseini, M.R.M.; Aghaee, E.; Ahmadi, F.; Berijani, S. Determination of organic compounds in water using dispersive liquid-liquid microextraction. J. Chromatogr. A 2006, 1116, 1–9. [Google Scholar] [CrossRef]
  107. Yan, H.; Wang, H. Recent development and applications of dispersive liquid-liquid microextraction. J. Chromatogr. A 2013, 1295, 1–15. [Google Scholar] [CrossRef]
  108. Jain, R.; Singh, R. Applications of dispersive liquid–liquid micro-extraction in forensic toxicology. TrAC Trends Anal. Chem. 2016, 75, 227–237. [Google Scholar] [CrossRef]
  109. El-Deen, A.K.; Elmansi, H.; Belal, F.; Magdy, G. Recent advances in dispersion strategies for dispersive liquid-liquid microextraction from green chemistry perspectives. Microchem. J. 2023, 191, 108807. [Google Scholar] [CrossRef]
  110. Rykowska, I.; Ziemblińska, J.; Nowak, I. Modern approaches in dispersive liquid-liquid microextraction (DLLME) based on ionic liquids: A review. J. Mol. Liq. 2018, 259, 319–339. [Google Scholar] [CrossRef]
  111. Marcinkowska, R.; Konieczna, K.; Marcinkowski, Ł.; Namieśnik, J.; Kloskowski, A. Application of ionic liquids in microextraction techniques: Current trends and future perspectives. TrAC Trends Anal. Chem. 2019, 119, 115614. [Google Scholar] [CrossRef]
  112. Xu, X.; Su, R.; Zhao, X.; Liu, Z.; Li, D.; Li, X.; Zhang, H.; Wang, Z. Determination of formaldehyde in beverages using microwave-assisted derivatization and ionic liquid-based dispersive liquid–liquid microextraction followed by high-performance liquid chromatography. Talanta 2011, 85, 2632–2638. [Google Scholar] [CrossRef]
  113. Galuch, M.B.; Magon, T.F.S.; Silveira, R.; Nicácio, A.E.; Pizzo, J.S.; Bonafe, E.G.; Maldaner, L.; Santos, O.O.; Visentainer, J.V. Determination of acrylamide in brewed coffee by dispersive liquid–liquid microextraction (DLLME) and ultra-performance liquid chromatography tandem mass spectrometry (UPLC-MS/MS). Food Chem. 2019, 282, 120–126. [Google Scholar] [CrossRef]
  114. Zhang, C.; Cagliero, C.; Pierson, S.A.; Anderson, J.L. Rapid and sensitive analysis of polychlorinated biphenyls and acrylamide in food samples using ionic liquid-based in situ dispersive liquid-liquid microextraction coupled to headspace gas chromatography. J. Chromatogr. A 2017, 1481, 1–11. [Google Scholar] [CrossRef]
  115. Custodio-Mendoza, J.A.; Caamaño-Fernandez, C.; Lage, M.A.; Almeida, P.J.; Lorenzo, R.A.; Carro, A.M. GC–MS determination of malondialdehyde, acrolein, and 4-hydroxy-2-nonenal by ultrasound-assisted dispersive liquid-liquid microextraction in beverages. Food Chem. 2022, 384, 132530. [Google Scholar] [CrossRef]
  116. Nascimento, C.F.; Brasil, M.A.; Costa, S.P.; Pinto, P.C.; Saraiva, M.L.M.; Rocha, F.R. Exploitation of pulsed flows for on-line dispersive liquid–liquid microextraction: Spectrophotometric determination of formaldehyde in milk. Talanta 2015, 144, 1189–1194. [Google Scholar] [CrossRef]
  117. Altunay, N.; Elik, A.; Tuzen, M.; Lanjwani, M.F.; Mogaddam, M.R.A. Determination and extraction of acrylamide in processed food samples using alkanol-based supramolecular solvent-assisted dispersive liquid-liquid microextraction coupled with spectrophotometer: Optimization using factorial design. J. Food Compos. Anal. 2023, 115, 105023. [Google Scholar] [CrossRef]
  118. Nematollahi, A.; Kamankesh, M.; Hosseini, H.; Hadian, Z.; Ghasemi, J.; Mohammadi, A. Investigation and determination of acrylamide in 24 types of roasted nuts and seeds using microextraction method coupled with gas chromatography–mass spectrometry: Central composite design. J. Food Meas. Charact. 2020, 14, 1249–1260. [Google Scholar] [CrossRef]
  119. Zokaei, M.; Abedi, A.S.; Kamankesh, M.; Shojaee-Aliababadi, S.; Mohammadi, A. Ultrasonic-assisted extraction and dispersive liquid-liquid microextraction combined with gas chromatography-mass spectrometry as an efficient and sensitive method for determining of acrylamide in potato chips samples. Food chem. 2017, 234, 55–61. [Google Scholar] [CrossRef]
  120. Nematollahi, A.; Kamankesh, M.; Hosseini, H.; Ghasemi, J.; Hosseini-Esfahani, F.; Mohammadi, A. Investigation and determination of acrylamide in the main group of cereal products using advanced microextraction method coupled with gas chromatography-mass spectrometry. J. Cereal Sci. 2019, 87, 157–164. [Google Scholar] [CrossRef]
  121. Norouzi, E.; Kamankesh, M.; Mohammadi, A.; Attaran, A. Acrylamide in bread samples: Determining using ultrasonic-assisted extraction and microextraction method followed by gas chromatography-mass spectrometry. J. cereal sci. 2018, 79, 1–5. [Google Scholar] [CrossRef]
  122. Moreda-Piñeiro, J.; Moreda-Piñeiro, A. Recent advances in combining microextraction techniques for sample pre-treatment. TRAC Trends Anal. Chem. 2015, 71, 265–274. [Google Scholar] [CrossRef]
  123. Sajid, M.; Płotka-Wasylka, J. Combined extraction and microextraction techniques: Recent trends and future perspectives. TRAC Trends Anal. Chem. 2018, 103, 74–86. [Google Scholar] [CrossRef]
Figure 1. Pathway of lipid peroxidation.
Separations 10 00531 g001
Figure 2. Scheme of gas-diffusion microextraction (GDME).
Separations 10 00531 g002
Figure 3. Scheme of solid-phase microextraction (SPME).
Separations 10 00531 g003
Figure 4. Scheme of dispersive liquid-liquid microextraction (DLLME).
Separations 10 00531 g004
Table 1. Classification of secondary lipid peroxidation products based on their carcinogenetic and recommended exposure levels.
Secondary ProductCAS NumberIARC CategoryTolerable Daily Intake
µg/Kg bw/Day
Reference
Saturate CarbonylsFormaldehyde50-00-01150[22]
Acetaldehyde75-07-02B185 a[23]
Hexanal66-25-1-780 *[24]
α,β-Unsaturated CarbonylsAcrolein107-02-82A7.5[25]
4-hydroxy-2-nonenal75899-68-231.5 **[26]
4-hydroxy-2-hexenal17427-21-331.5 **[26]
Acrylamide79-06-12ANE[27]
Crotonaldehyde4170-30-32B--
DicarbonylsMalondialdehyde102-52-3330 **[26]
Glyoxal107-22-2-200[28]
Methylglyoxal78-98-83--
Diacetyl431-03-900 *[28]
FuransDihydro-2(3H)-furanone96-48-03--
Furfural98-01-13500[29]
IARC, International Agency for Research on Cancer; bw, body way; a Acceptable intake reported at µg/day; * Acceptable daily intake; ** Threshold of toxicological concern set by The International Programme on Chemical Safety (IPCS); NE, non-established.
Table 2. Analytical method for determination of secondary peroxidation products by gas-diffusion microextraction (GDME).
Target CompoundSampleGDMEDerivative ReagentDeterminationLOD
µg/L or µg/Kg
Recovery
%
Ref.
ModeVacceptor solution
mL
t
min
T
°C
1,3-pentadione
Diacetyl
BeerImmersed0.51540O-PDAHPLC-UV3.8–4.6-[48]
2 aldehydes &
Furfural
BeerImmersed0.75530DNPHHPLC-UV1.5–12.3-[54]
5 aldehydesBeerSuspended0.52040HBAHPLC-DAD1.2–1857.7>96%[55]
Diacetyl 1WineImmersed0.42065O-PDAHPLC-UV3.8-[56]
Acetaldehyde 1WineImmersed1.01550DNPHHPLC-UV800–1100-[57]
DiacetylWine & beerSuspended1.01060O-PDADPV0.053-[58]
α-DCCWine; black tea & soy sauceImmersed 20.51055O-PDAHPLC-UV50–200-[59]
MDAVegetable oilSuspended0.53065TBAHPLC-UV/FLD250–350≥82%[60]
4 aldehydes Acrolein & MDA Vegetable oilSuspended1.01060DPNHGC-MS50–100≥95%[10]
2 ketones & diacetylGround breadSuspended0.51565O-PDAHPLC-UV6–12-[61]
27 carbonyl compounds 3Green & roast coffee beansSuspended0.51640O-PDAHPLC-DAD50–200-[62]
1 free and total; 2 0.22 um PVDF membrane; 3 Qualitative analysis; LOD, limit of detection; Ref., reference; DNPH, 2,4-dinitrophenylhydrazine; HBA, 4-hydrazinobenzoic acid; O-PDA, O-phenylenediamine; α-DCC, α-dicarbonyl compounds; MDA, malondialdehyde; TBA, 2-thiobarbituric acid; DPV, differential pulse voltammetry.
Table 3. Analytical methods for determination of secondary peroxidation products by solid-phase microextraction (SPME).
Target CompoundSampleSPMEDerivative ReagentDeterminationLOD
µg/L or µg/Kg
Recovery
%
Ref.
Modet
min
T
°C
FiberTdesorption
°C
14 aldehydes & ketonesVegetable oilHS3020DVB/CAR/PDMS270-GC-FID & GC-MS0.04–2.24-[64]
4-HNEOils & porcine liverDI1540PDMS/DVB DNPHHPLC-SP0.001–1.4266–87%[65]
MDACod liver oilHS10RTPDMS/DVB200N-MHGC-NPD0.7491%[66]
HexanalHazelnutHS1060CAR/PDMS300-GC-FID8.01-[67]
7 aldehydesPeanut, soybean and olive oilsHS1550CAR/PDMS250-GC-FID4.6–10.285–110[68]
3 α,β-UCSunflower oil digestion phasesHS6050DVB/CAR/PDMS250-GC-MS--[69]
100 carbonyl compoundsCod liver oilHS6050DVB/CAR/PDMS220-GC-MS--[70]
18 VOCSunflower oil emulsionsHS3050DVB/CAR/PDMS250-GC-MS--[71]
Aldehydes & 2-pentylfuranSoybean oilsHS5550DVB/CAR/PDMS250-GC-MS--[72]
VOCPeanut oilHS4050PDMS/DVB250-GC-MS--[73]
4 aldehydes & 1 ketoneRoast & boiled duckHS4045CAR/PDMS280-GC-MS--[74]
3 aldehydesChicken pattiesHS1060DVB/CAR/PDMS250-GC-FID--[75]
HexanalPig sausagesHS3050DVB/CAR/PDMS220-GC-MS--[76]
2 aldehydes & 2 dialdehydesCodHS3050CAR/PDMS260-GC-FID--[77]
8 aldehydesFishHS1560PDMS/DVB260PFBHAGC-MS1.4–6.179–102[78]
6 aldehydesCaviarHS3060DVB/CAR/PDMS250-GC-MS--[79]
198 VOCsDry cured meatHS3037 260-GC-MS--[80]
AldehydesInfant formulaHS1025PDMS/DVB250-GC-MS--[81]
3 aldehydes & pentaneInfant formulaHS4537CAR/PDMS250-GC-FID0.02–1.05 -[82]
13 Carbonyl compoundsMilk powderHS4543 250-GC-MS2–6-[83]
VOCSmoked cheeseHS4550CAR/PDMS260-GC-MS--[84]
VOCMozzarellaHS1537 220-GC-MS--[85]
VOCPortuguese cheeseHS4550DVB/PDMS250-GC-MS--[86]
9 aldehydesBeerHS6050PDMS/DVB250PFBHA *GC-MS-89–114[87]
41 carbonyl compoundsBeerHS4060PDMS/DVB250PFBHA *,**GC-MS0.003–20,000-[88]
250 carbonyl compoundsBeerHS2045PDMS/DVB250PFBAH **GC-ITMS0.003–0.51088–114[89]
6 carbonyl compoundBeerHS6055DVB/CAR/PDMS250TFEH **GC-MS0.03–0.5 90–105[16]
6 carbonyl compoundCraft beerHS6055DVB/CAR/PDMS250TFEH **GC-MS0.03–0.5 90–105[90]
18 carbonyl compoundWineHS4540DVB/CAR/PDMS250-GC-ITMS0.62–129.219–190[91]
80 VOCWineHS3040DVB/CAR/PDMS240-GC-MS--[92]
6 carbonyl compoundSyrah winesHS4555DVB/CAR/PDMS250TFEHGCxGC-TOFMS0.5–5.290–106[93]
3 aldehydesMust & wineHS4555DVB/CAR/PDMS250TFEHGC-qMS0.1–0.890–102[94]
38 carbonyl compoundPort wineHS2032PDMS/DVB250PFBHAGC-MS0.006–0.08988–119[95]
45 carbonyl compoundWineHS2040PDMS/DVB250PFBHAGC-MS/MS-71–146[96]
9 aldehydesSpirits and alcoholic beveragesDI1520PDMS250PFBHAGC-ECD0.05–0.5 -[97]
VOC & SVOCBeer, wine & whiskyHS6030PDMS
CAR/PDMS
DVB/CAR/PDMS
250
260
260
- GC-MS--[11]
20 aldehydesGreen pomace distillatesHS4055PDMS/DVB250PFBHAGC-MS0.0007–0.0276–110[98]
107 VOCCiderHS3050DVB/CAR/PDMS250 - GC-MS--[99]
53 carbonyl compoundsHuangjiu (alcoholic beverage)HS3545DVB/CAR/PDMS250PFBHAGC-MS/MS-71–146[100]
2 α-DCCSoybean paste, red pepper past, soy sauce, wine, beer, distilled liquorHS2085DVB/CAR/PDMS240TFEHGC-MS0.7–1.192–104[101]
LOD, limit of detection; HS, headspace; 4-HNE, 4-hydroxy-2-nonenal; DI, direct immersion; DVB, divinylbenzene; CAR, carboxen®; PDMS, polydimethylsiloxane; DNPH, 2,4-dinitrophenylhydrazine; MDA, malondialdehyde; N-MH, N-methylhydrazine; α-β-UC, α-β-unsaturated carbonyl compound; VOC, volatile organic compounds; SVOC, semi volatile organic compounds; α-DCC, α-dicarbonyl compound, * on fiber derivatization, ** in-solution derivatization.
Table 4. Analytical method for determination of secondary peroxidation products by dispersive liquid-liquid microextraction (DLLME).
Target CompoundSampleDLLMEDerivative ReagentDeterm.LOD
µg/L or µg/Kg
Rec.
%
Ref.
ModeDisperserExtracting SolventT
min
T
°C
FormaldehydeBeveragesMW-IL-ACNIL 3453W1.5-DNPHHPLC-UV0.1285–95[112]
AcrylamideBrewed coffee-ACN DCM ---UPLC-MS/MS90097–106[113]
PCB and acrylamideMilk/CoffeeIL[HeOHMIM][Cl] [BMIM][NTf2]---HS-GC-ECD-MS--[114]
MDA, acrolein, 4-HNEBeveragesUSACN CH3Cl5 60 °CDNPHGC-MS50–20094–102[115]
FormaldehydeMilkILMeOHIL 3453W0.75 45 °CACACUV10091–103[116]
AcrylamideCoffee, chocolate, roasted nuts, French fries, cereals, biscuits, chips, bread, and
caramelized fruit
SSASUPRAS-2
(SDS/TBABr/AlCl3)
2 -UV0.293–96[117]
AcrylamideNuts and seeds-PCEEtOH3 -XanthydrolGC-MS0.695[118]
AcrylamidePotato chipsUAEPCEEtOH2 -XanthydrolGC-MS0.697[119]
AcrylamideCereal products-PCEEtOH1 -XanthydrolGC-MS0.695[120]
AcrylamideBreadUAEPCEMeOH1-XanthydrolGC-MS0.5498[121]
4 aldehydes Acrolein & MDA Vegetable oilUSACN CH3Cl5 60DPNHGC-MS50–100≥95%10
LOD, limit of detection; Determ., determination; Rec., recovery; Ref., reference; MW, Microwave; IL, Ionic liquid; IL 3453W, Trihexyltetradecylphosphonium Chloride; DNPH, 2,4-dinitrophenylhydrazine; DCM, Dichloromethane; PCB, polychlorinated biphenyls; MDA, malondialdehyde; US, Ultrasound; UAE, ultrasound-assisted extraction; PCE, tetrachloroethylene, SSA, supramolecular solvent-assisted; ACAC, acetylacetone in an ammonium acetate (2.0% v/v).
Disclaimer/Publisher’s Note: The statements, opinions and data contained in all publications are solely those of the individual author(s) and contributor(s) and not of MDPI and/or the editor(s). MDPI and/or the editor(s) disclaim responsibility for any injury to people or property resulting from any ideas, methods, instructions or products referred to in the content.

