Communication

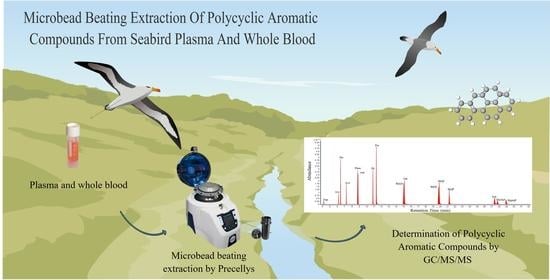
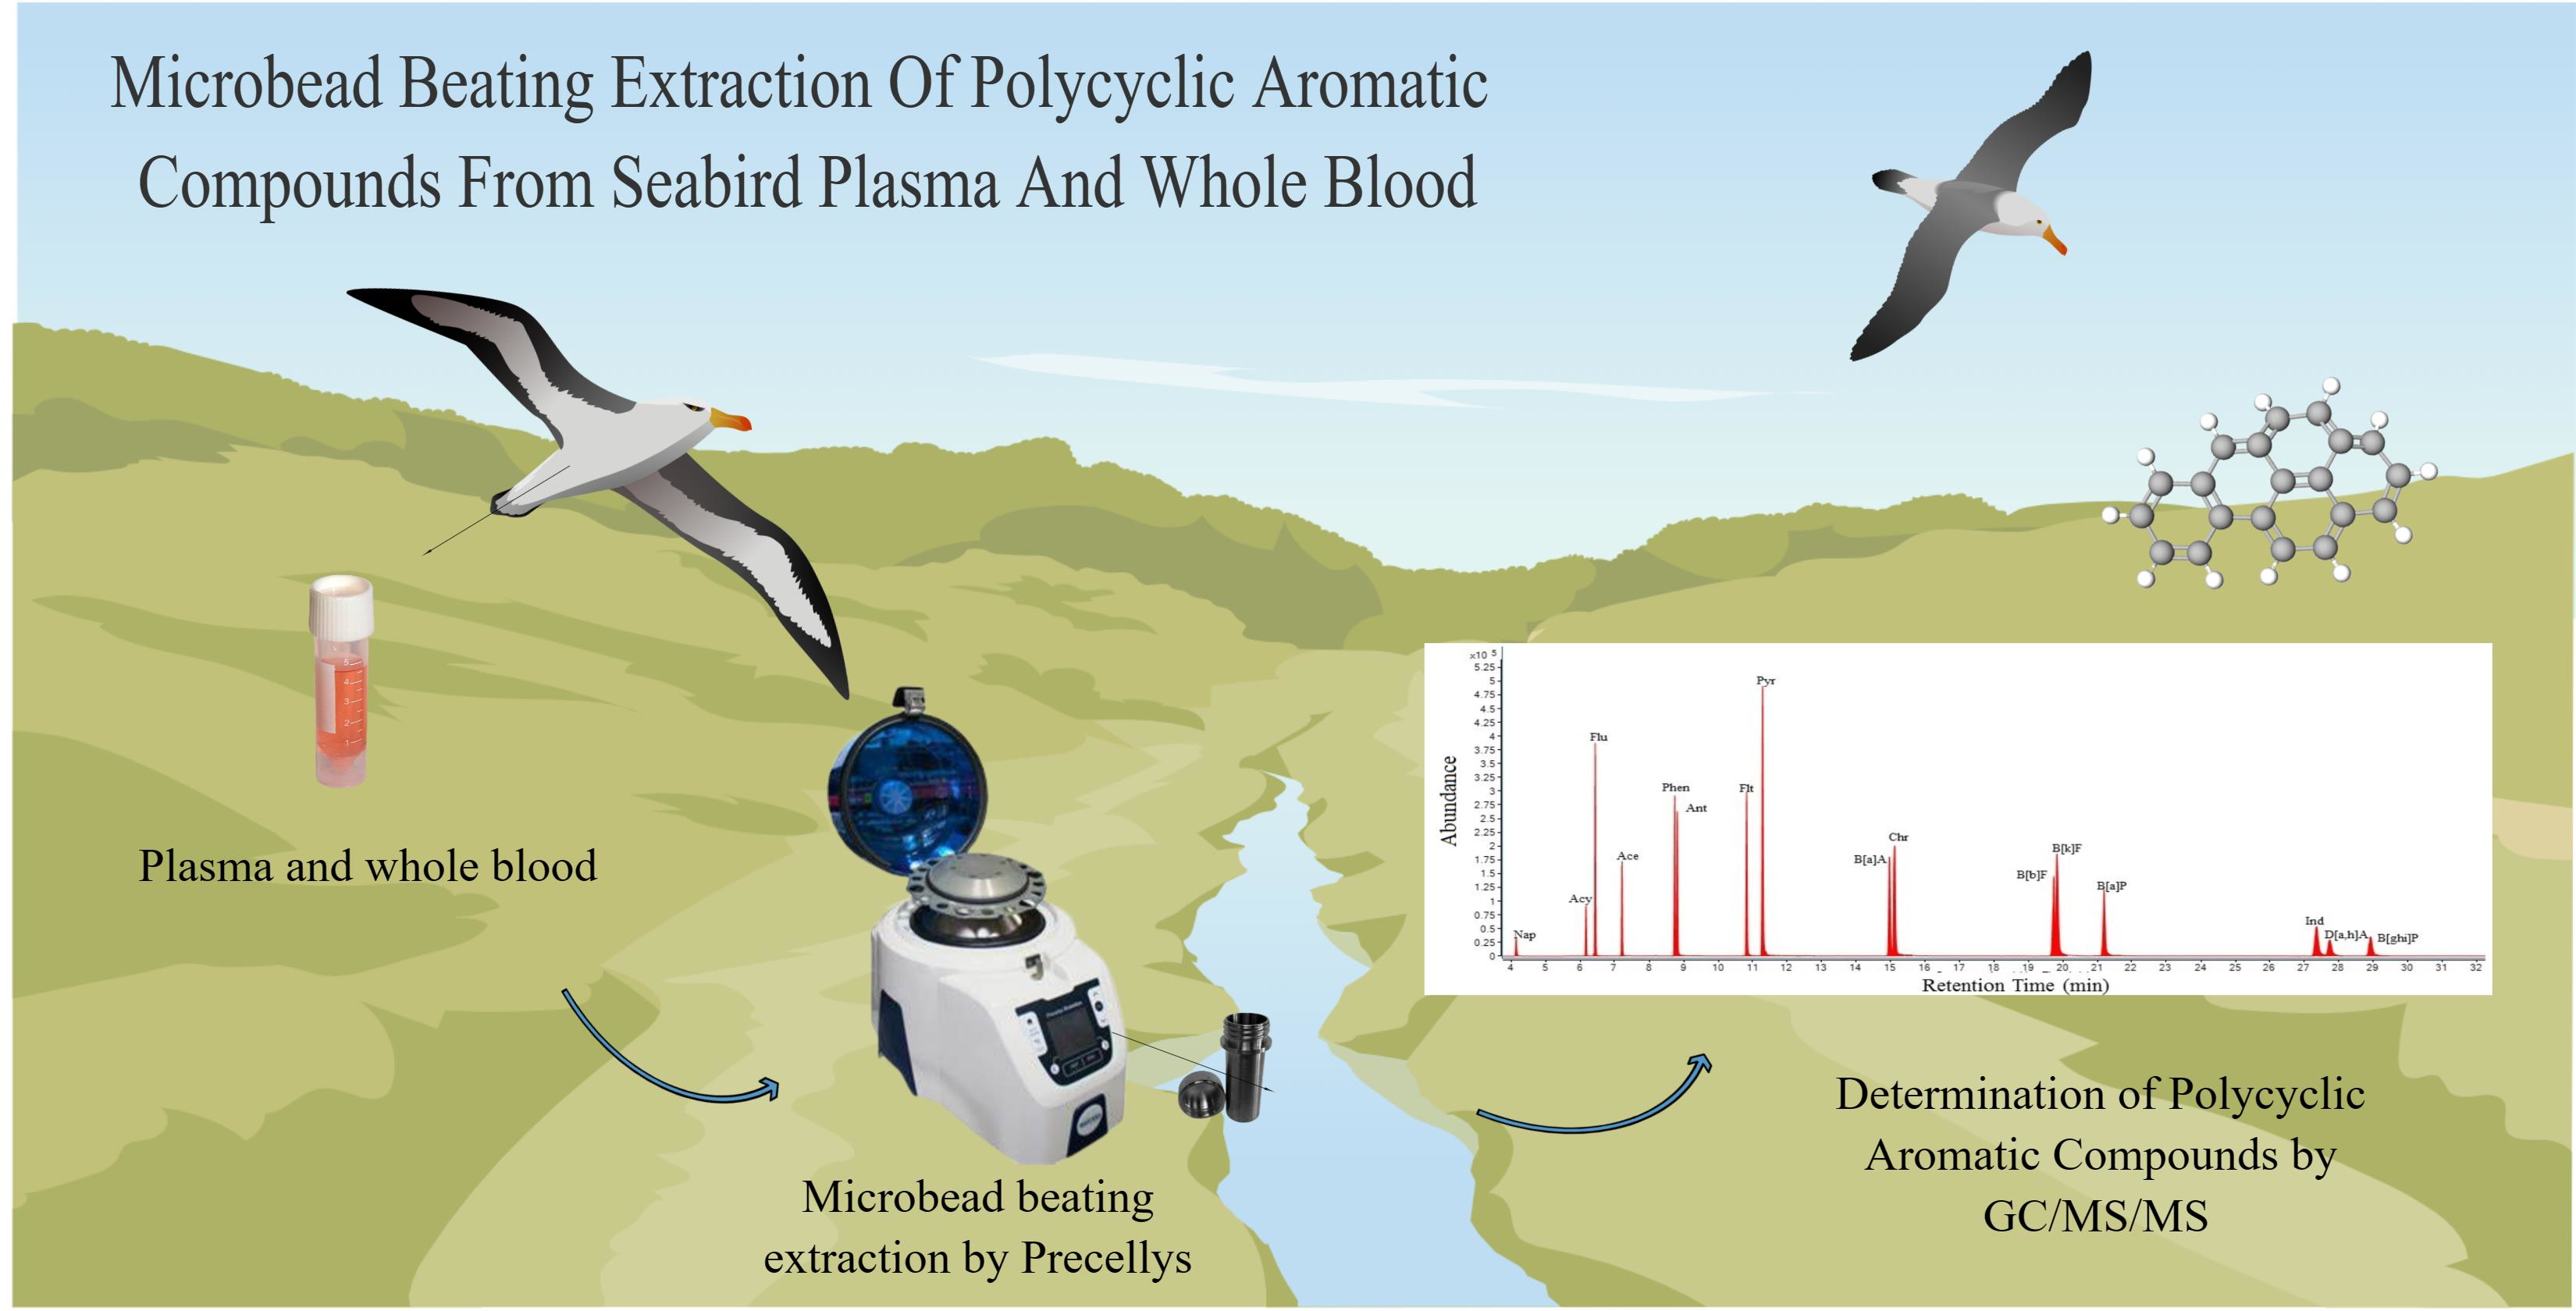
Microbead-Beating Extraction of Polycyclic Aromatic Compounds from Seabird Plasma and Whole Blood

1
Department of Chemistry, University of Manitoba, Winnipeg, MB R3T 2N2, Canada
2
Water Science and Technology Directorate, Environment and Climate Change Canada, Burlington, ON L7S 1A1, Canada
3
Wildlife Landscape Science Directorate, Environment and Climate Change Canada, Ottawa, ON K1A 0H3, Canada
*
Authors to whom correspondence should be addressed.
Separations 2023, 10(1), 48; https://doi.org/10.3390/separations10010048
Submission received: 7 December 2022 / Revised: 4 January 2023 / Accepted: 10 January 2023 / Published: 12 January 2023
(This article belongs to the Special Issue Feature Papers in Separations from Editorial Board Members)

Abstract

:
Seabirds are widely regarded as an invaluable bioindicator of environmental health. Matrices including eggs and feathers have been used as non-lethal means to assess contaminant burdens. We have developed a new approach for extraction of polycyclic aromatic compounds (PACs) from seabird plasma and serum based on automated microbead-beating homogenization and extraction. Commercially available bovine serum and plasma were purposely fortified with a suite of PACs separately at three dosing levels, placed inside a custom-made stainless-steel tube containing ceramic microbeads, and subjected to an extraction process using a Precellys tissue homogenizer. Tubes were shaken forcefully in three-dimensions, facilitating high mass-transfer of PACs from the matrix into the hexane extraction solvent. The accuracy of the method ranged from 55 to 120% and limits of detection and quantitation ranged from 0.1 to 8 and 0.2 to 27 pg/μL, respectively. The method exhibited good repeatability with both inter- and intra-day repeatability < 30%. The developed method represents an effective and efficient approach to extraction of PACs from important biological matrices.

Graphical Abstract

1. Introduction

Polycyclic aromatic compounds (PACs) are a large family of combustion-produced and environmentally persistent organic contaminants with various chemical structures [1,2]. They occur naturally through volcanic activities and wildfires [3]. Anthropogenic activities are the primary source contribution of PACs because of incomplete combustion of fuels in myriad processes including industrial emissions and mobile emissions from vehicles [4,5]. The most important environmental compartments for PACs are air, water, plants, foods, and soils. Some PACs exhibit carcinogenic and mutagenic properties, and their non-polar and hydrophobic characteristics make them environmentally persistent with an associated ecological threat [6,7]. Therefore, the determination and remediation of PACs are of great interest. Several strategies have been used to remove PACs from the environment, including leaching, photo/chemical oxidation, biodegradation, wet/dry deposition, and chemical degradation [8,9].
Even though PACs have been measured for decades, challenges still remain with their accurate determination. Convoluting factors, particularly for alkylated polycyclic aromatic hydrocarbons (APAHs), are the large number of theoretically possible constitutional isomers and the lack of commercially available standards [10,11,12]. Gas chromatography with mass spectrometry (GC-MS) is the preferred methodology for analysis of PACs [13]. Analytical methods based on selected ion monitoring (SIM) or multiple reaction monitoring (MRM) are often used to increase the MS specificity and detectability [14,15]. Regardless of the choice of detection method, the sample matrix, sampling method, and sample preparation are determining factors in overall precision and accuracy [16].
In support of biomonitoring studies, PACs have been measured in a host of biological samples including aquatic biota, wildlife, and human matrices. Human samples including urine, blood serum plasma, saliva, and different body parts (such as hair) have been analyzed for PACs [17]. Idowu et al. [16] analyzed mussel tissue (Mytilus edulis) for a suite of PACs. Swisłowski et al. [18] used moss as a biological indicator for the determination of 13 PACs in the atmosphere. Xia et al. [19] determined halogenated PACs in different biological samples (river otter (Lontra Canadensis), northern pike (Esox lucius), lake whitefish (Coregonus clupeaformis), and snails (Gastropod sp.)) from the Alberta oil sands region in Canada.
Birds can be exposed to environmental contaminants externally through physical contact and internally through consumption of contaminated water and/or food [20]. Various organs (e.g., kidney, liver), tissues (e.g., muscle, bone, fat), eggs, feathers, and excrements are used to determine pollutant concentrations in the environment. Seabirds have also been used as a bioindicator in several long-term monitoring programs in Canada. For example, organochlorine pesticides in eggs of seabird species from Prince Leopold Island in the Canadian High Arctic have been monitored for over four decades [21]. Esparza et al. monitored mercury (Hg) and POPs in the blood profile of murre birds in northern Hudson Bay [22]. Bianchini et al. monitored PAHs in sanderlings at Chaplin Lake by exposing them orally with environmentally relevant PAH mixture during a 21-day period [23].
To date, liquid-liquid extraction has been the most used technique to analyze PAHs in blood samples [24,25,26,27,28,29,30,31,32]. In one study, an ultra-turrax homogenizer was employed to extract PAHs from the blood samples of red kites (Milvus milvus) with n-hexane. Extracts were analyzed by a GC-MS/MS instrument [33]. Provatas et al. used the QuEChERS method for the extraction of PAHs from avian blood and plasma samples with analysis by liquid chromatography and UV detection [34]. In another study, flamingo blood samples were vortexed and ultrasonicated with 1.5 mL of hexane:dichloromethane (1:1) for extraction of PAHs with analysis by GC-MS/MS [35]. Paruk et al. extracted parent and alkylated PAHs from plasma samples of common loons (Gavia immer) by LLE in 2.5 mL hexane [36]. Troisi et al. employed centrifugation and shaking for extraction of PAHs from swan (Cygnus) plasma samples in methanol. Extracts were cleaned up by solid-phase extraction, and an analysis was done by GC-MS [37]. In the study by Burgos-Nunez et al., seabird blood samples were sonicated and extracted with 20 mL of dichloromethane (DCM) [38].
Compared to solid-phase extraction, LLE is simpler, more cost-effective, and, because of the small volumes of extracting solvent typically used, can also lead to reduced sample processing times. However, one disadvantage of conventional LLE can be the limited mass-transfer of the target analyte from matrices to the extraction solvent. Recent work by our group has shown that improved mass-transfer of analytes can be achieved using 3D microbead-beating homogenization and extraction for determination of PACs in seabird eggs [39].
Based on our earlier study using 3D microbead-beating homogenization and extraction, we hypothesize that this approach can be expanded and used to exhaustively extract a wide range of PACs from seabird plasma and serum matrices. This study provides evidence to support our hypothesis and presents the method performance characteristics of our validated and optimized method.

2. Materials and Methods

2.1. Chemicals

Organic solvents used were of Optima grade and purchased from Fisher Chemicals (Ottawa, ON, Canada). The suite of analytical standards included: fifteen (15) individual APAHs; sixteen (16) PAHs; isotope dilution internal standards containing 15 of the 16 deuterated PAHs, used for recovery internal standard (RIS); and labelled d10-anthracene, used as the instrument performance internal standard (IPIS,). All were of >98% purity and were purchased from AccuStandard Inc. (New Haven, OH, USA) and Caledon Laboratory Chemicals (Georgetown, ON, Canada). The full list of target analytes and their suppliers can be found in Table 1. The bovine plasma and serum used as control samples were purchased from LAMPIRE Biological Laboratories (Pipersville, PA, USA), and the chicken serum and plasma were purchased from Cedarlane Laboratories (Burlington, ON, Canada).

2.2. Sample Processing by Microbead-Beating Extraction

Method validation was performed using bovine serum and plasma. One (1 mL) of each matrix type was transferred separately to a custom-made 7 mL stainless-steel tube (see Figure 1) containing ceramic microbeads (1 g) and, subsequently, spiked with a suite of PAHs at three dosing levels (10, 50, and 250 pg/µL), APAHs (50 pg/µL), and RIS (10 ng/µL, 10 µL). Hexane (10 mL) was added to each of the fortified samples and extraction was performed with a Precellys Evolution Homogenizer (Bertin Technologies, Montigny-le-Bretonneux, France) at 6500 rpm with 3 cycles for 20 s and 120 s between the cycles (total time of 5 min). Method blanks consisted of stainless-steel tubes containing only 10 mL of hexane and tubes containing an unfortified matrix. After extraction, the upper solvent layer was carefully transferred into a test tube and reduced to 1 mL under a gentle stream of high-purity nitrogen gas. Extracts were fortified with IPIS (10 ng/µL, 10 µL) and transferred to GC vials. Method verification was performed using chicken serum and plasma samples at the medium dosing level (50 pg/µL) for both PAHs and APAHs using the procedures outlined above.

2.3. GC-MS/MS Conditions

An Agilent 7890 GC coupled to a triple quadrupole mass spectrometer (Agilent Technologies, Mississauga, ON, Canada) fitted with an electron ionization (EI) source was used for MS/MS acquisition. An Agilent J&W DB-5ms Ultra Inert column (30 m × 0.25 mm, 0.25 µm film thickness) with helium as the carrier gas at a constant flow rate of 1.2 mL/min. 1 μL of sample was injected with a PAL RSI 85 auto-sampler at 250 °C in splitless mode. The oven temperature was held at: 60 °C for 1 min; raised to 120 °C at 35 °C/min; raised to 220 °C at 14 °C/min; raised to 260 °C at 5 °C/min and held for 5 min; raised to 300 °C at 10 °C/min; and, finally, raised to 310 °C at 50 °C/min. Both transfer line and source temperature were set at 320 °C. The quantification and confirmation ions and the multiple reaction monitoring (MRM) ion transitions for PAHs and APAHs are reported in Idowu et al. [40].

2.4. Method Performance Characteristics

The Eurachem guide The Fitness for the Purpose of Analytical Methods was used to assess the fitness of purposes of our method [41]. The limit of detection (LOD) and the limit of quantification (LOQ) for microbead-beating extraction were determined by extracting six replicates (n = 6) of each plasma and serum matrix fortified with 10 pg/µL of the PACs studied. Procedural blanks (nb = 5) were prepared by using extraction solvent spiked with the suite of deuterated PAH internal standards. The adjusted standard deviation (s0′) was calculated from the results of replicate measurements by the ratio defined in the Eurachem guide [41].
s 0 = s 0   1 n + 1 n b
where s0 is the standard deviation of single results for each target analyte and s0′ is the adjusted standard deviation used for determining the LOD and LOQ values. Finally, LODs were calculated as 3 × s0′, and LOQs were calculated as 10 × s0′.
Repeatability of our method validation study was calculated by extracting and quantifying PACs from plasma and serum in replicate over three consecutive days (interday, n = 3) and over a 24 h period (intraday, n = 6). Accuracy was determined by analyzing six replicates of plasma and serum at each dosing level of PACs.
The working range for APAHs was based on an 11-point calibration curve (2, 5, 10, 20, 50, 100, 200, 400, 600, 800, and 1000 pg/µL) and for PAHs our calibration curve was constructed using 10, 100, 200, 300, 400, 500, 600, 700, 800, 900, and 1000 pg/µL calibration standards. Instrument performance internal standard (IPIS) was added to each calibration point at a constant concentration (100 pg/µL) to account for any small fluctuations in the signal of the instrument between injections. Calibration standards were injected randomly and in triplicate. The peak area obtained for each PACs analyte was normalized to d10-anthracene (IPIS) and plotted as a function of concentration. The linearity was evaluated by the magnitude of R2 (correlation coefficient) value and the level of significance (p-value). Residual plots were generated and examined to ensure the random distribution was about zero to confirm linearity.

3. Results and Discussion

Supply chain issues necessitated the use of bovine serum/plasma for our method validation. Only recently were we able to procure chicken serum/plasma matrices and use them to verify the results from our bovine samples. Validation was performed at three doses of PAHs and a single dose of APAHs; verification was performed at a single dose of both PAHs and APAHs. Performance characteristics are presented in Table 1 and Table 2.
For PAHs at the 10 pg/µL spiking level, accuracies were all between 60% and 110%, which is commensurate with the criteria of the Association of Official Analytical Chemists (AOAC), except for pyrene (52%) [42]. For PAHs at the 50 pg/µL spiking level, all accuracies were between 80% and 115%, except for fluoranthene (134%) and pyrene (51%), and at the 250 pg/µL spiking level, our accuracy ranged from 75 to 115%, except for pyrene (125%). For APAHs, accuracies fell in the range of 70% to 105%. Representative GC-MS/MS chromatograms showing ion traces of method blank, fortified plasma, and serum samples (250 pg/µL) for PAHs is shown in Figure 2.
Based on the Student t-test, there were no statistically significant differences in accuracies for PAHs at high spiking level (p < 0.05) in either of the two matrices. The recoveries of pyrene in both matrices at the low (average 56%) and medium (average 57%) spiking levels were smaller (Student t-test, p > 0.05) than those measured at the high dose (average 121%). Furthermore, the recoveries of fluoranthene in both plasma and serum at the medium (average 133%) spiking level were higher than those measured at the low and high doses. For all APAHs, there were no significant differences in recoveries at the spiking level (50 pg/µL) in both matrices.
Precision (relative standard deviation, RSD) was assessed using interday and intraday repeatability. For all PACs, precision was determined by using 6 replicates over 24 h (intraday) and 6 replicates over consecutive days (interday) for bovine plasma and serum matrices. For PAHs, RSD percentages were all between 2% and 20% (intraday) at all spiking levels except for benzo(k) fluoranthene in the serum at the high (26%) spiking level and fluoranthene in the plasma at the medium (26%) spiking level. Interday repeatability for PAHs ranged from 4% to 20%, except for benzo(g,h,i), perylene (26%), and pyrene (average 23% in both matrices). For APAHs, only three compounds retene, 9-Bu-fluorene, and 4-Me-dibenzothiphene exceeded an intraday RSD of 30%. Intraday repeatability of all APAHs was lower than 25%.
We used the Student t-test to compare the precision in both matrices. For PAHs at the low dose, there were no statistically significant differences in RSD% between matrices. At the medium and high spiking levels for a few compounds, RSD percentages were higher (p < 0.05) compared to the low level. For all APAHs, there were no significant differences in the precision at the spiking level (50 pg/µL).
The LODs/LOQs for PAHs in both plasma and serum were all less than 0.85/2.85 pg/µL, respectively, except naphthalene (1.3/4.1 pg/µL). The LODs/LOQs for APAHs were all below 15/50 pg/µL.
Verification of our method was performed at a single medium dose of PAHs and APAHs (50 pg/µL) in chicken plasma/serum matrices. Figure 3 and Figure 4 show the comparison of recoveries of PAHs in bovine and chicken serum and plasma, respectively. We compared the accuracy and precision in both matrices using the Student t-test. For both PAHs and APAHs, there were no significant differences (p < 0.05) in the recovery and RSD percentages at the stated spiking level (50 pg/µL), except for acenaphthylene (55%), anthracene (55%), fluorene (52%), and phenanthrene (58%) between the two matrix types. Even with these differences, in general, the comparison between the bovine and chicken matrices were considered acceptable and suggest that the bovine serum/plasma was a suitable surrogate matrix for our validation studies.
Morin-Crini et al. used an ultra-turrax homogenizer to extract PAHs from the whole blood of red kites. The average LODs was 0.71 pg/µL, RSD% was 16%, and recovery was 100% for all PAH compounds [33]. In another study, PAHs in avian blood cells and plasma were extracted utilizing vortex and HPLC. The recoveries were in the range of 73–107% with RSD < 5.2% [34]. Paruk et al. employed LLE to extract parent and alkylated PAHs from loon plasma samples. The detection limits were 5.0 ng/g [36]. Troisi et al. extracted PAHs of swan plasma samples by the addition of methanol followed by centrifugation. The limit of detection was 1 ppm, and the recovery was 70–80% [37]. In general, the performance characteristics of our study are similar to previous published studies with the additional benefit of reduced sample processing times.

4. Conclusions

The results of our method validation demonstrated effectiveness and suitability of the 3D microbead-beating homogenization approach for the extraction of PACs in blood matrices (serum and plasma), particularly in comparison to SPE-based methods. Overall, the results from bovine serum/plasma were similar to those obtained with chicken serum/plasma. The microbead-beating extraction increases mass-transfer of the target analytes from the matrix into the extraction solvent resulting in good recoveries. In addition, low detection limits were achieved in concert with good repeatability (inter- and intra-day) and linearity, measured according to AOAC and Eurachem criteria.

Author Contributions

V.M.: conceptualization, methodology, validation, formal analysis, investigation, writing—original draft, writing—review and editing, and visualization. T.H., I.I. and Z.X.: validation and investigation. N.V.: methodology. C.M.: validation, investigation, writing—review and editing, and visualization. P.J.T.: writing—review and editing. G.T.T.: conceptualization, methodology, validation, formal analysis, investigation, writing—original draft, writing—review and editing, visualization, supervision, funding acquisition, and project administration. All authors have read and agreed to the published version of the manuscript.

Funding

This research was funded by a Natural Sciences and Engineering Research Council—Discovery Grant (to GTT) grant number RGPIN-05354-2019).

Data Availability Statement

Derived data supporting the findings of this study are available from the corresponding authors on reasonable request.

Acknowledgments

The authors thank Olga Francisco for reviewing an earlier version of the manuscript.

Conflicts of Interest

The authors declare no conflict of interest.

References

  1. Berthiaume, A.; Galarneau, E.; Marson, G. Polycyclic aromatic compounds (PACs) in the Canadian environment: Sources and emissions. Environ. Pollut. 2021, 269, 116008. [Google Scholar] [CrossRef] [PubMed]
  2. Marvin, C.; Tomy, G.T.; Thomas, P.J.; Holloway, A.C.; Sandau, C.D.; Idowu, I.; Xia, Z. Considerations for prioritization of polycyclic aromatic compounds as environmental contaminants. Environ. Sci. Technol. 2020, 54, 14787–14789. [Google Scholar] [CrossRef]
  3. Hussain, K.; Hoque, R.R.; Balachandran, S.; Medhi, S.; Idris, M.G.; Rahman, M.; Hussain, F.L. Monitoring and risk analysis of PAHs in the environment. In Handbook of Environmental Materials Management; Hussain, C., Ed.; Springer International Publishing: Cham, Switzerland, 2018; pp. 1–35. [Google Scholar] [CrossRef]
  4. Jia, H.; Zhao, S.; Shi, Y.; Zhu, L.; Wang, C.; Sharma, V.K. Transformation of polycyclic aromatic hydrocarbons and formation of environmentally persistent free radicals on modified montmorillonite: The role of surface metal ions and polycyclic aromatic hydrocarbon molecular properties. Environ. Sci. Technol. 2018, 52, 5725–5733. [Google Scholar] [CrossRef] [PubMed]
  5. Jin, R.; Zheng, M.; Lammel, G.; Bandowe, B.A.M.; Liu, G. Chlorinated and brominated polycyclic aromatic hydrocarbons: Sources, formation mechanisms, and occurrence in the environment. Prog. Energy Combust. Sci. 2020, 76, 100803. [Google Scholar] [CrossRef]
  6. Mehr, M.R.; Keshavarzi, B.; Moore, F.; Fooladivanda, S.; Sorooshian, A.; Biester, H. Spatial distribution, environmental risk and sources of heavy metals and polycyclic aromatic hydrocarbons (PAHs) in surface sediments-northwest of Persian Gulf. Cont. Shelf Res. 2020, 193, 104036. [Google Scholar] [CrossRef]
  7. Meng, Y.; Liu, X.; Lu, S.; Zhang, T.; Jin, B.; Wang, Q.; Tang, Z.; Liu, Y.; Guo, X.; Zhou, J. A review on occurrence and risk of polycyclic aromatic hydrocarbons (PAHs) in lakes of China. Sci. Total Environ. 2019, 651, 2497–2506. [Google Scholar] [CrossRef]
  8. Gbeddy, G.; Goonetilleke, A.; Ayoko, G.A.; Egodawatta, P. Transformation and degradation of polycyclic aromatic hydrocarbons (PAHs) in urban road surfaces: Influential factors, implications and recommendations. Environ. Pollut. 2020, 257, 113510. [Google Scholar] [CrossRef]
  9. Shahsavari, E.; Schwarz, A.; Aburto-Medina, A.; Ball, A.S. Biological degradation of polycyclic aromatic compounds (PAHs) in soil: A current perspective. Curr. Pollut. Rep. 2019, 5, 84–92. [Google Scholar] [CrossRef]
  10. Srogi, K. Monitoring of environmental exposure to polycyclic aromatic hydrocarbons: A review. Environ. Chem. Lett. 2007, 5, 169–195. [Google Scholar] [CrossRef]
  11. Abdel-Shafy, H.I.; Mansour, M.S. A review on polycyclic aromatic hydrocarbons: Source, environmental impact, effect on human health and remediation. Egypt. J. Petrol. 2016, 25, 107–123. [Google Scholar] [CrossRef] [Green Version]
  12. Johnson, W.; Idowu, I.; Francisco, O.; Marvin, C.; Thomas, P.J.; Stetefeld, J.; Tomy, G.T. Enumeration of the constitutional isomers of environmentally relevant substituted polycyclic aromatic compounds. Chemosphere 2018, 202, 9–16. [Google Scholar] [CrossRef]
  13. Zeigler, C.; MacNamara, K.; Wang, Z.; Robbat, A., Jr. Total alkylated polycyclic aromatic hydrocarbon characterization and quantitative comparison of selected ion monitoring versus full scan gas chromatography/mass spectrometry based on spectral deconvolution. J. Chromatogr. A 2008, 1205, 109–116. [Google Scholar] [CrossRef]
  14. Zeigler, C.; Wilton, N.; Robbat, A., Jr. Toward the accurate analysis of C1–C4 polycyclic aromatic sulfur heterocycles. Anal. Chem. 2012, 84, 2245–2252. [Google Scholar] [CrossRef]
  15. Zhao, Y.; Hong, B.; Fan, Y.; Wen, M.; Han, X. Accurate analysis of polycyclic aromatic hydrocarbons (PAHs) and alkylated PAHs homologs in crude oil for improving the gas chromatography/mass spectrometry performance. Ecotoxicol. Environ. Saf. 2014, 100, 242–250. [Google Scholar] [CrossRef]
  16. Idowu, I.; Johnson, W.; Francisco, O.; Obal, T.; Marvin, C.; Thomas, P.J.; Sandau, C.D.; Stetefeld, J.; Tomy, G.T. Comprehensive two-dimensional gas chromatography high-resolution mass spectrometry for the analysis of substituted and unsubstituted polycyclic aromatic compounds in environmental samples. J. Chromatogr. A 2018, 1579, 106–114. [Google Scholar] [CrossRef]
  17. Santos, P.M.; del Nogal Sánchez, M.; Pavón, J.L.P.; Cordero, B.M. Determination of polycyclic aromatic hydrocarbons in human biological samples: A critical review. TrAC Trends Anal. Chem. 2019, 113, 194–209. [Google Scholar] [CrossRef]
  18. Świsłowski, P.; Hrabák, P.; Wacławek, S.; Liskova, K.; Antos, V.; Rajfur, M.; Ząbkowska-Wacławek, M. The application of active biomonitoring with the use of mosses to identify polycyclic aromatic hydrocarbons in an atmospheric aerosol. Molecules 2021, 26, 7258. [Google Scholar] [CrossRef]
  19. Xia, Z.; Idowu, I.; Marvin, C.; Thomas, P.J.; Johnson, W.; Francisco, O.; Stetefeld, J.; Crimmins, B.; Fry, M.; Tomy, G.T. Identification of halogenated polycyclic aromatic hydrocarbons in biological samples from Alberta Oil-Sands Region. Chemosphere 2019, 215, 206–213. [Google Scholar] [CrossRef]
  20. Roux, K.E.; Marra, P.P. The presence and impact of environmental lead in passerine birds along an urban to rural land use gradient. Arch. Environ. Contam. Toxicol. 2007, 53, 261–268. [Google Scholar] [CrossRef]
  21. Braune, B.M.; Gaston, A.J.; Mallory, M.L. Temporal trends of legacy organochlorines in eggs of Canadian Arctic seabirds monitored over four decades. Sci. Total Environ. 2019, 646, 551–563. [Google Scholar] [CrossRef]
  22. Esparza, I.; Elliott, K.H.; Choy, E.S.; Braune, B.M.; Letcher, R.J.; Patterson, A.; Fernie, K.J. Mercury, legacy and emerging POPs, and endocrine-behavioural linkages: Implications of Arctic change in a diving seabird. Environ. Res. 2022, 212, 113190. [Google Scholar] [CrossRef] [PubMed]
  23. Bianchini, K.; Morrissey, C.A. Polycyclic aromatic hydrocarbon exposure impairs pre-migratory fuelling in captively-dosed Sanderling (Calidris alba). Ecotoxicol. Environ. Saf. 2018, 161, 383–391. [Google Scholar] [CrossRef] [PubMed]
  24. Pleil, J.; Stiegel, M.; Sobus, J.; Tabucchi, S.; Ghio, A.; Madden, M. Cumulative exposure assessment for trace-level polycyclic aromatic hydrocarbons (PAHs) using human blood and plasma analysis. J. Chromatogr. B 2010, 878, 1753–1760. [Google Scholar] [CrossRef] [PubMed]
  25. Singh, V.K.; Patel, D.K.; Ram, S.; Mathur, N.; Siddiqui, M.; Behari, J.R. Blood levels of polycyclic aromatic hydrocarbons in children of Lucknow, India. Arch. Environ. Contam. Toxicol. 2008, 54, 348–354. [Google Scholar] [CrossRef] [PubMed]
  26. Singh, V.K.; Patel, D.; Ram, S.; Mathur, N.; Siddiqui, M. Blood levels of polycyclic aromatic hydrocarbons in children and their association with oxidative stress indices: An Indian perspective. Clin. Biochem. 2008, 41, 152–161. [Google Scholar] [CrossRef]
  27. Singh, V.K.; Anand, M.; Rawtani, D.; Singh, U.P.; Patel, D.; Mehrotra, P.; Mathur, N.; Siddiqui, M. Blood levels of polycyclic aromatic hydrocarbons in women with benign and malignant breast lesions: A case-control study. Asian J. Med. Sci. 2010, 1, 80–86. [Google Scholar] [CrossRef] [Green Version]
  28. Guo, Y.; Huo, X.; Wu, K.; Liu, J.; Zhang, Y.; Xu, X. Carcinogenic polycyclic aromatic hydrocarbons in umbilical cord blood of human neonates from Guiyu, China. Sci. Total Environ. 2012, 427, 35–40. [Google Scholar] [CrossRef]
  29. Yu, Y.; Wang, X.; Wang, B.; Tao, S.; Liu, W.; Wang, X.; Cao, J.; Li, B.; Lu, X.; Wong, M.H. Polycyclic aromatic hydrocarbon residues in human milk, placenta, and umbilical cord blood in Beijing, China. Environ. Sci. Technol. 2011, 45, 10235–10242. [Google Scholar] [CrossRef]
  30. Xu, X.; Yekeen, T.A.; Xiao, Q.; Wang, Y.; Lu, F.; Huo, X. Placental IGF-1 and IGFBP-3 expression correlate with umbilical cord blood PAH and PBDE levels from prenatal exposure to electronic waste. Environ. Pollut. 2013, 182, 63–69. [Google Scholar] [CrossRef]
  31. Xu, X.; Liu, J.; Huang, C.; Lu, F.; Chiung, Y.M.; Huo, X. Association of polycyclic aromatic hydrocarbons (PAHs) and lead co-exposure with child physical growth and development in an e-waste recycling town. Chemosphere 2015, 139, 295–302. [Google Scholar] [CrossRef]
  32. Dong, X.; Wang, Q.; Peng, J.; Wu, M.; Pan, B.; Xing, B. Transfer of polycyclic aromatic hydrocarbons from mother to fetus in relation to pregnancy complications. Sci. Total Environ. 2018, 636, 61–68. [Google Scholar] [CrossRef]
  33. Morin-Crini, N.; Scheifler, R.; Amiot, C.; Riols, R.; Coeurdassier, M. Determination of polycyclic aromatic hydrocarbon (PAH) contents in micro-volumes of the whole blood and liver of Red Kite by a simplified GC-MS/MS method. Int. J. Environ. Anal. Chem. 2022, 102, 834–843. [Google Scholar] [CrossRef]
  34. Provatas, A.A.; Yevdokimov, A.V.; King, C.A.; Gatley, E.L.; Stuart, J.D.; Evers, D.C.; Perkins, C.R. Rapid quick, easy, cheap, effective, rugged, and safe extraction with novel phospholipid cleanup: A streamlined ultra high performance liquid chromatography with ultraviolet detection approach for screening polycyclic aromatic hydrocarbons in avian blood cells and plasma. J. Sep. Sci. 2015, 38, 2677–2683. [Google Scholar]
  35. Dulsat-Masvidal, M.; Bertolero, A.; Mateo, R.; Lacorte, S. Legacy and emerging contaminants in flamingos’ chicks’ blood from the Ebro Delta Natural Park. Chemosphere 2022, 312, 137205. [Google Scholar] [CrossRef]
  36. Paruk, J.D.; Adams, E.M.; Uher-Koch, H.; Kovach, K.A.; Long IV, D.; Perkins, C.; Schoch, N.; Evers, D.C. Polycyclic aromatic hydrocarbons in blood related to lower body mass in common loons. Sci. Total Environ. 2016, 565, 360–368. [Google Scholar] [CrossRef]
  37. Troisi, G.; Borjesson, L. Development of an immunoassay for the determination of polyaromatic hydrocarbons in plasma samples from oiled seabirds. Environ. Sci. Technol. 2005, 39, 3748–3755. [Google Scholar] [CrossRef]
  38. Burgos-Núñez, S.; Navarro-Frómeta, A.; Marrugo-Negrete, J.; Enamorado-Montes, G.; Urango-Cárdenas, I. Polycyclic aromatic hydrocarbons and heavy metals in the Cispata Bay, Colombia: A marine tropical ecosystem. Mar. Pollut. Bull. 2017, 120, 379–386. [Google Scholar] [CrossRef]
  39. Xia, Z.; Idowu, I.; Halldorson, T.; Lucas, A.-M.; Stein, C.; Kaur, M.; Tomy, T.; Marvin, C.; Thomas, P.J.; Hebert, C.E.; et al. Microbead beating extraction of avian eggs for polycyclic aromatic compounds. Chemosphere 2023. Under review. [Google Scholar]
  40. Idowu, I.; Francisco, O.; Thomas, P.J.; Johnson, W.; Marvin, C.; Stetefeld, J.; Tomy, G.T. Validation of a simultaneous method for determining polycyclic aromatic compounds and alkylated isomers in biota. Rapid Commun. Mass Spectrom. 2018, 32, 277–287. [Google Scholar] [CrossRef]
  41. Magnusson, B.; Omemark, U. Eurachem Guide: The Fitness for Purpose of Analytical Methods: A Laboratory Guide to Method Validation and Related Topics. Available online: https://www.eurachem.org/images/stories/Guides/pdf/MV_guide_2nd_ed_EN.pdf. (accessed on 21 August 2022).
  42. Association of Official Analytical Chemist International. Guidelines for Standard Method Performance Requirements AOAC Official Methods of Analysis. Appendix F. 2016, pp. 1–18. Available online: http://www.eoma.aoac.org/app_f.pdf (accessed on 21 August 2022).
Figure 1. Custom-designed 7 mL stainless-steel tube with ceramic microbeads.
Separations 10 00048 g001
Figure 2. GC/MS/MS ion chromatograms of PAHs in our method blank (top panel), fortified (250 pg/µL) plasma (middle panel) and serum (bottom panel) bovine samples. The single peak in chromatogram of the method blank is an interferent and has a different retention time to naphthalene.
Separations 10 00048 g002
Figure 3. Comparison of the mean recovery percent ± standard deviation of PAHs in chicken and bovine serum.
Separations 10 00048 g003
Figure 4. Comparison of the mean recovery percent ± standard deviation of PAHs in chicken and bovine plasma.
Separations 10 00048 g004
Table 1. Method performance characteristics of our method for the analysis of PAHs in bovine serum and plasma using microbead-beating extraction and GC-EI-MS/MS detection and quantitation *.
CompoundSpiking LevelInterday Precision
RSD (%)
LOD
pg µL−1
LOQ
pg µL−1
10 pg µL−150 pg µL−1250 pg µL−1
AccuracyPrecisionAccuracyPrecisionAccuracyPrecision
(%)RSD (%)(%)RSD (%)(%)RSD (%)
PAHsPSPSPSPSPSPSPSPSPS
Ace76.685.56.310.189.194.45.63.584.190.56.315.05.710.50.70.52.21.7
Acy91.996.42.53.892.892.96.61.780.889.10.72.56.95.40.30.30.91.1
Ant93.4107.315.512.386.196.95.45.381.198.31.26.09.27.20.40.31.40.9
B[a]A84.685.76.07.291.892.213.04.181.393.47.57.913.412.80.20.30.80.9
B[a]P94.096.94.13.293.488.33.414.083.699.311.012.110.713.40.40.41.41.5
B[b]F93.493.84.85.497.796.69.37.482.2106.73.626.210.16.80.40.41.31.5
B[ghi]P107.893.54.113.986.896.916.811.189.398.820.219.715.520.60.50.41.81.4
B[k]F81.7101.220.011.695.6101.424.010.681.4110.112.718.825.214.10.50.61.81.9
Chr87.994.912.26.480.295.911.28.776.597.45.710.78.86.00.50.51.71.7
D[a,h]A93.086.718.512.187.491.614.010.095.5107.87.511.511.812.50.60.42.11.2
Flt66.769.48.26.5132.1133.725.76.585.799.45.24.220.913.40.30.40.91.3
Flu83.593.08.55.890.189.18.32.681.082.72.312.98.14.00.30.31.01.0
Ind80.680.91.612.486.187.87.010.680.297.47.67.910.012.20.60.91.92.8
Nap62.588.45.412.987.893.61.54.982.791.32.32.46.516.71.20.84.12.7
Phen61.467.15.94.13101.2110.89.75.480.793.11.33.410.39.040.30.21.10.6
Pyr52.659.54.41.861.051.616.67.6117.1125.91.711.621.623.80.30.40.91.2
* Note: P = Plasma; S = Serum; Ace = Acenaphthene; Acy = Acenaphthylene; Ant = Anthracene; B[a]A = Benzo[a]Anthracene; B[a]P = Benzo[a]Pyrene; B[b]F = Benzo[b]Fluoranthene; B[g,h,i]P = Benzo[g,h,i]Pyrene; B[k]F = Benzo[k]Fluoranthene; Chr = Chrysene; D[a,h]A = Dibenzo[a,h]Anthracene; Flt = Fluoranthene; Flu = Fluorene; Ind = Indeno[1,2,3-c,d]pyrene; Nap = Naphthalene; Phen = Phenanthrene; Pyr = Pyrene.
Table 2. Method performance characteristics of our method for the analysis of APAHs in bovine serum and plasma using microbead-beating extraction and GC-EI-MS/MS detection and quantitation.
CompoundsSpiking Level LOD pg µL−1LOQ pg µL−1
50 pg µL−1Interday Precision RSD (%)
Accuracy (%)Precision RSD (%)
APAHsPlasmaSerumPlasmaPlasmaPlasmaSerumPlasmaSerumPlasmaSerum
2-Methylnaphthalene70.974.317.316.624.024.43.86.112.720.2
1,2,5,6-Me4-Naphthalene89.8102.221.720.918.720.96.95.723.019.0
3-Methylphenanthrene99.494.517.916.08.511.00.10.10.30.4
1,2,6,9-Me4-Phenanthrene105.279.129.123.99.49.37.08.923.529.7
Retene100.386.331.325.211.211.60.10.10.20.3
2-Me-Chrysene89.4102.920.622.111.712.47.44.424.814.8
1,3,6-Me3-Chrysene90.481.415.719.115.621.00.50.11.60.2
1-Me-Fluorene104.3108.417.916.08.513.90.30.41.21.4
9-Bu-Fluorene100.394.931.323.99.412.17.05.423.417.9
Benzothiophene78.799.121.720.918.711.60.30.50.91.8
4-Me-Dibenzothiophene94.5106.331.325.211.210.10.10.10.20.2
4-Bu-Dibenzothiophene105.289.120.520.19.412.81.23.14.310.2
1-Me-Pyrene87.3102.920.622.111.714.22.93.39.611.2
1-Bu-Pyrene76.292.315.719.115.611.63.814.512.648.4
2,3-BNT98.6100.820.520.121.224.58.37.227.524.1
Disclaimer/Publisher’s Note: The statements, opinions and data contained in all publications are solely those of the individual author(s) and contributor(s) and not of MDPI and/or the editor(s). MDPI and/or the editor(s) disclaim responsibility for any injury to people or property resulting from any ideas, methods, instructions or products referred to in the content.

