Article

Comparison of Two Extraction Procedures, SPE and DLLME, for Determining Plasticizer Residues in Hot Drinks at Vending Machines

1
Department of Agriculture, Environmental and Food Sciences, University of Molise, Via De Sanctis, I-86100 Campobasso, Italy
2
Department of Public Health and Infectious Diseases, Sapienza University, Piazzale Aldo Moro 5, I-00185 Rome, Italy
*
Authors to whom correspondence should be addressed.
Processes 2021, 9(9), 1588; https://doi.org/10.3390/pr9091588
Submission received: 11 August 2021 / Revised: 31 August 2021 / Accepted: 1 September 2021 / Published: 5 September 2021

Abstract

:
This paper would like to compare two extraction procedures for analyzing phthalates (PAEs) in hot drinks collected at vending machines, usually coffee and tea. The two analytical procedures are based on Solid Phase Extraction (SPE) using C18 cartridge and on dispersive liquid-liquid microextraction (DLLME) assisted by ultrasound and vortex for improving the dispersion mechanically, with each followed by a routinary analytical method such as GC-FID. Seven phthalates (DMP, DEP, DiBP, DBP, DEHP, DOP, DDP) have been analyzed and determined. All the analytical parameters (i.e., recovery, limit of detection, limit of quantification, enrichment factors, repeatability, reproducibility) have been investigated and discussed, as has the matrix effect. The entire procedure has been applied to hot drink matrices, e.g., coffee, decaffeinated coffee, barley coffee, ginseng coffee and tea.

1. Introduction

Beginning in the second half of the 1800s, the first types of modern organic plastics were developed: first Alexander Parkes’ Parkesine (1860), then John Wesley Hyatt’s celluloid (1870) [1,2]. Since then, the use and growth in consumption of plastic materials have been due both to their low production price and to their properties, which originate from the different plasticizers introduced at the end of the 1800s. Those most used today to increase the structural flexibility of plastics are phthalates, introduced in 1920 and still a subject of ongoing investigation with respect to both human health and to the environment due to their interfering action on the endocrine system. Their use allows greater flexibility and malleability of the finished product thanks to the nature of their bond with the polymer chain of the plastic material. In fact, phthalates are incorporated in the amorphous portion of the plastic structure, reducing the secondary interactions between the polymer molecules and thus allowing for greater mobility of the molecules themselves. This type of plasticizer, not being chemically bound, is subject to evaporation, migration and extraction. Such processes are strongly influenced by the chemical-physical characteristics of the different phthalates and in particular by their molecular weight [3]. In fact, for high molecular weight (HMW) phthalates (PAEs) such as diisononyl phthalate (DiNP) and diisodecyl phthalate (DiDP), the tendency to migrate is lessened due to stronger bonds with the polymer chain; for low molecular weight (LMW) phthalates, such as bis(2-ethylhexyl) phthalate (DEHP), dibutyl phthalate (DBP), diisobutyl phthalate (DiBP) and benzyl butyl phthalate (BBP), this is not the case. Besides having a greater tendency to migrate, LMWs are classified as toxic agents for reproduction and are included in Annex XIV as “Substances of Very High Concern” and in the “Candidate List” of substances subject to authorization by the European Union (EU) Regulation Registration, Evaluation, Authorization of Chemicals (REACH) [4]. Consequently, and in order to protect consumer health, the EU has established migration limits for these substances within food of 60 mg kg−1 for dimethyl phthalate (DMP), diethylphthalate (DEP), DiBP and dioctyl phthalate (DOP); 0.3 and 1.5 mg kg−1 for DBP and DEHP, respectively; and a limit of 60 mg kg−1 for specific generic migration [5]. In particular, the leaching of these substances is influenced by some parameters such as temperature [3,6,7]. For this reason, in recent years, studies have been carried out on the presence of these molecules in hot drinks due to the use of both plastic capsules and single use product (SUP) type glasses supplied by the vending machines [8,9,10,11]. Given their presence at (ultra-) trace levels in food matrices, it is necessary for identification and quantification to use pretreatment techniques both for sample cleanup and for their preconcentration, thereby eliminating interferents and reducing the matrix effect. One of the first extraction and preconcentration techniques was liquid-liquid extraction (LLE), which exploits the different chemical affinity between analytes and solvents. It involves considerable problems related to both the use of high quantities of often toxic solvents (thus entailing a risk both for the operator and for the environment), and of long analysis times for extraction, as preconcentration factors are often not enough. The introduction of solid phase extraction (SPE) and afterwards of liquid-liquid dispersive microextraction (DLMME) made it possible to overcome these limits [12,13,14,15].
SPE is a sample pretreatment technique that is based, as is DLLE, on the partitioning of the analytes present in a sample between the sample solution and a stationary phase consisting of an adsorbent solid. Over time, different types of SPE have been developed, depending on the amount of adsorbent phase used and the solid support used to contain it [16]. The applicability of the SPE to the different matrices analyzed is mainly determined by the polarity of the analytes and the adsorbent used. Polymeric sorbents based on styrene-divinyl benzenes such as XAD have been introduced, also for the retention of polar substances [17]. Then, there is graphitized carbon (GCB), which has high versatility but which encounters particular problems in the elution of acidic substances due to the strong interaction between these compounds and the oxygen complexes present on its surface [18]. In recent years, immunosorbents have been developed that, thanks to the high chemical selectivity provided by the antigen–antibody interaction, give the analytical method a high sensitivity [19].
The DLLME, introduced by Rezaee et al. in 2006, is based on a three-component system consisting of the solution containing the analytes, an extraction solvent and a dispersant, the latter quickly added to the sample to create a peat solution [20]. This technique involves the extraction of analytes from a solution by adding a small volume of an extraction solvent immiscible with the aqueous sample. In order to optimize the extraction, the researchers used a dispersion solvent to favor the contact surface between the aqueous solution and the extractant with the formation of an oil-in-water micro-emulsion [21]. The factors that influence this technique are (i) the volume and type of the extractant, (ii) the dispersant and (iii) the extraction time [22]. The division of the analytes between the solution and the extractant is very fast, and it takes only a few seconds to obtain an optimal extraction. On the other hand, the volume of the extraction solvent is very important; in fact, the final concentration of the analytes depends on it. Its optimization allows for maximization of the pre-concentration factor and the aptitude of this technique for the subsequent detection of pollutants present in traces. Initially, chlorinated organic compounds with a density greater than water were used as extraction solvents; subsequently, due to their toxicity, low-density organic solvents such as long-chain alcohols and hydrocarbons were preferred [23,24]. DLLME has proved extremely versatile in the search for molecules such as organophosphorus pesticides (OPPs), chlorobenzenes, triazine herbicides, chlorophenols, polychlorobiphenyls (PCBs), halogenated organic compounds, pyrethroid pesticides in various food matrices [25], as well as phthalate esters in both food and alcoholic/recreational drinks [26] and in different plastic beverage containers [27].
The objective of this work was to search for and quantify seven phthalate molecules—DMP, DEP, DiBP, DBP, DEHP, DOP and di-decyl phthalate (DDP)—by using two different extraction techniques in hot recreative drinks distributed by vending machines; in particular, beverages such as tea and coffee were analyzed. The study initially concerned the parameters of two different extraction methods, SPE and DLLME, both used to pre-concentrate the analytes present within the samples and eliminate the interferents. Subsequently, after having optimized the parameters of the two extraction methods, we moved on to the study of the analytical parameters, using gas chromatography with flame ionization detector (FID), in order to have a simple and effective method for a routine analysis.

2. Materials and Methods

2.1. Materials

All standards of the seven phthalic acid esters investigated in this study, namely DMP, DEP, DiBP, DBP, DEHP, DOP and DDP, were obtained from Sigma-Aldrich (Milan, Italy). The standard solution of the PAEs was prepared in acetone, by dissolving an appropriate amount of each phthalate standard to obtain a concentration of 500 μg mL−1. The internal standard (IS) used was phenanthrene, obtained from Merck (Darmstadt, Germany). The IS used during the analysis was also prepared in acetone at a concentration of 80 μg mL−1.

2.2. GC-FID Conditions

In this study, the gas chromatographic system used was a model Master GC Dani (Monza, Italy) equipped with a flame ionization detector (FID). The analysis software Clarity v.2.6.3 (Data Apex 2007, Prague, Czech Republic) was used. A fused-silica capillary column with chemically bonded phase (SE-54, 5% phenyl—95% dimethylpolysiloxane, Teknokroma, Rome, Italy) was used, with the following chromatographic characteristics: 30 m × 250 µm i.d.; df film thickness, 0.25 µm; theoretical plate number, N, 120,000 for n-dodecane at 90 °C; capacity factor, kf, 7.3; optimum linear velocity of carrier gas, hydrogen, uopt, 34.5 cm s−1; utilization of theoretical efficiency, 95% [28].
Hydrogen was used as the gas carrier for the gas chromatography analysis at linear and constant velocity (ū) of 38 cm s−1. A programmed temperature vaporizer (PTV) injector was used in which 1 μL of the sample was injected when in spitless mode. The vaporizer was heated from 110 °C to 280 °C at 800 °C min−1 after five seconds from the injection and maintained for 5 min. After 2 min the splitter valve was opened. After the injection, the oven temperature was programmed from 100 °C to 280 °C at 10 °C min−1, whereas the FID temperature was 310 °C.

2.3. Extraction Methods

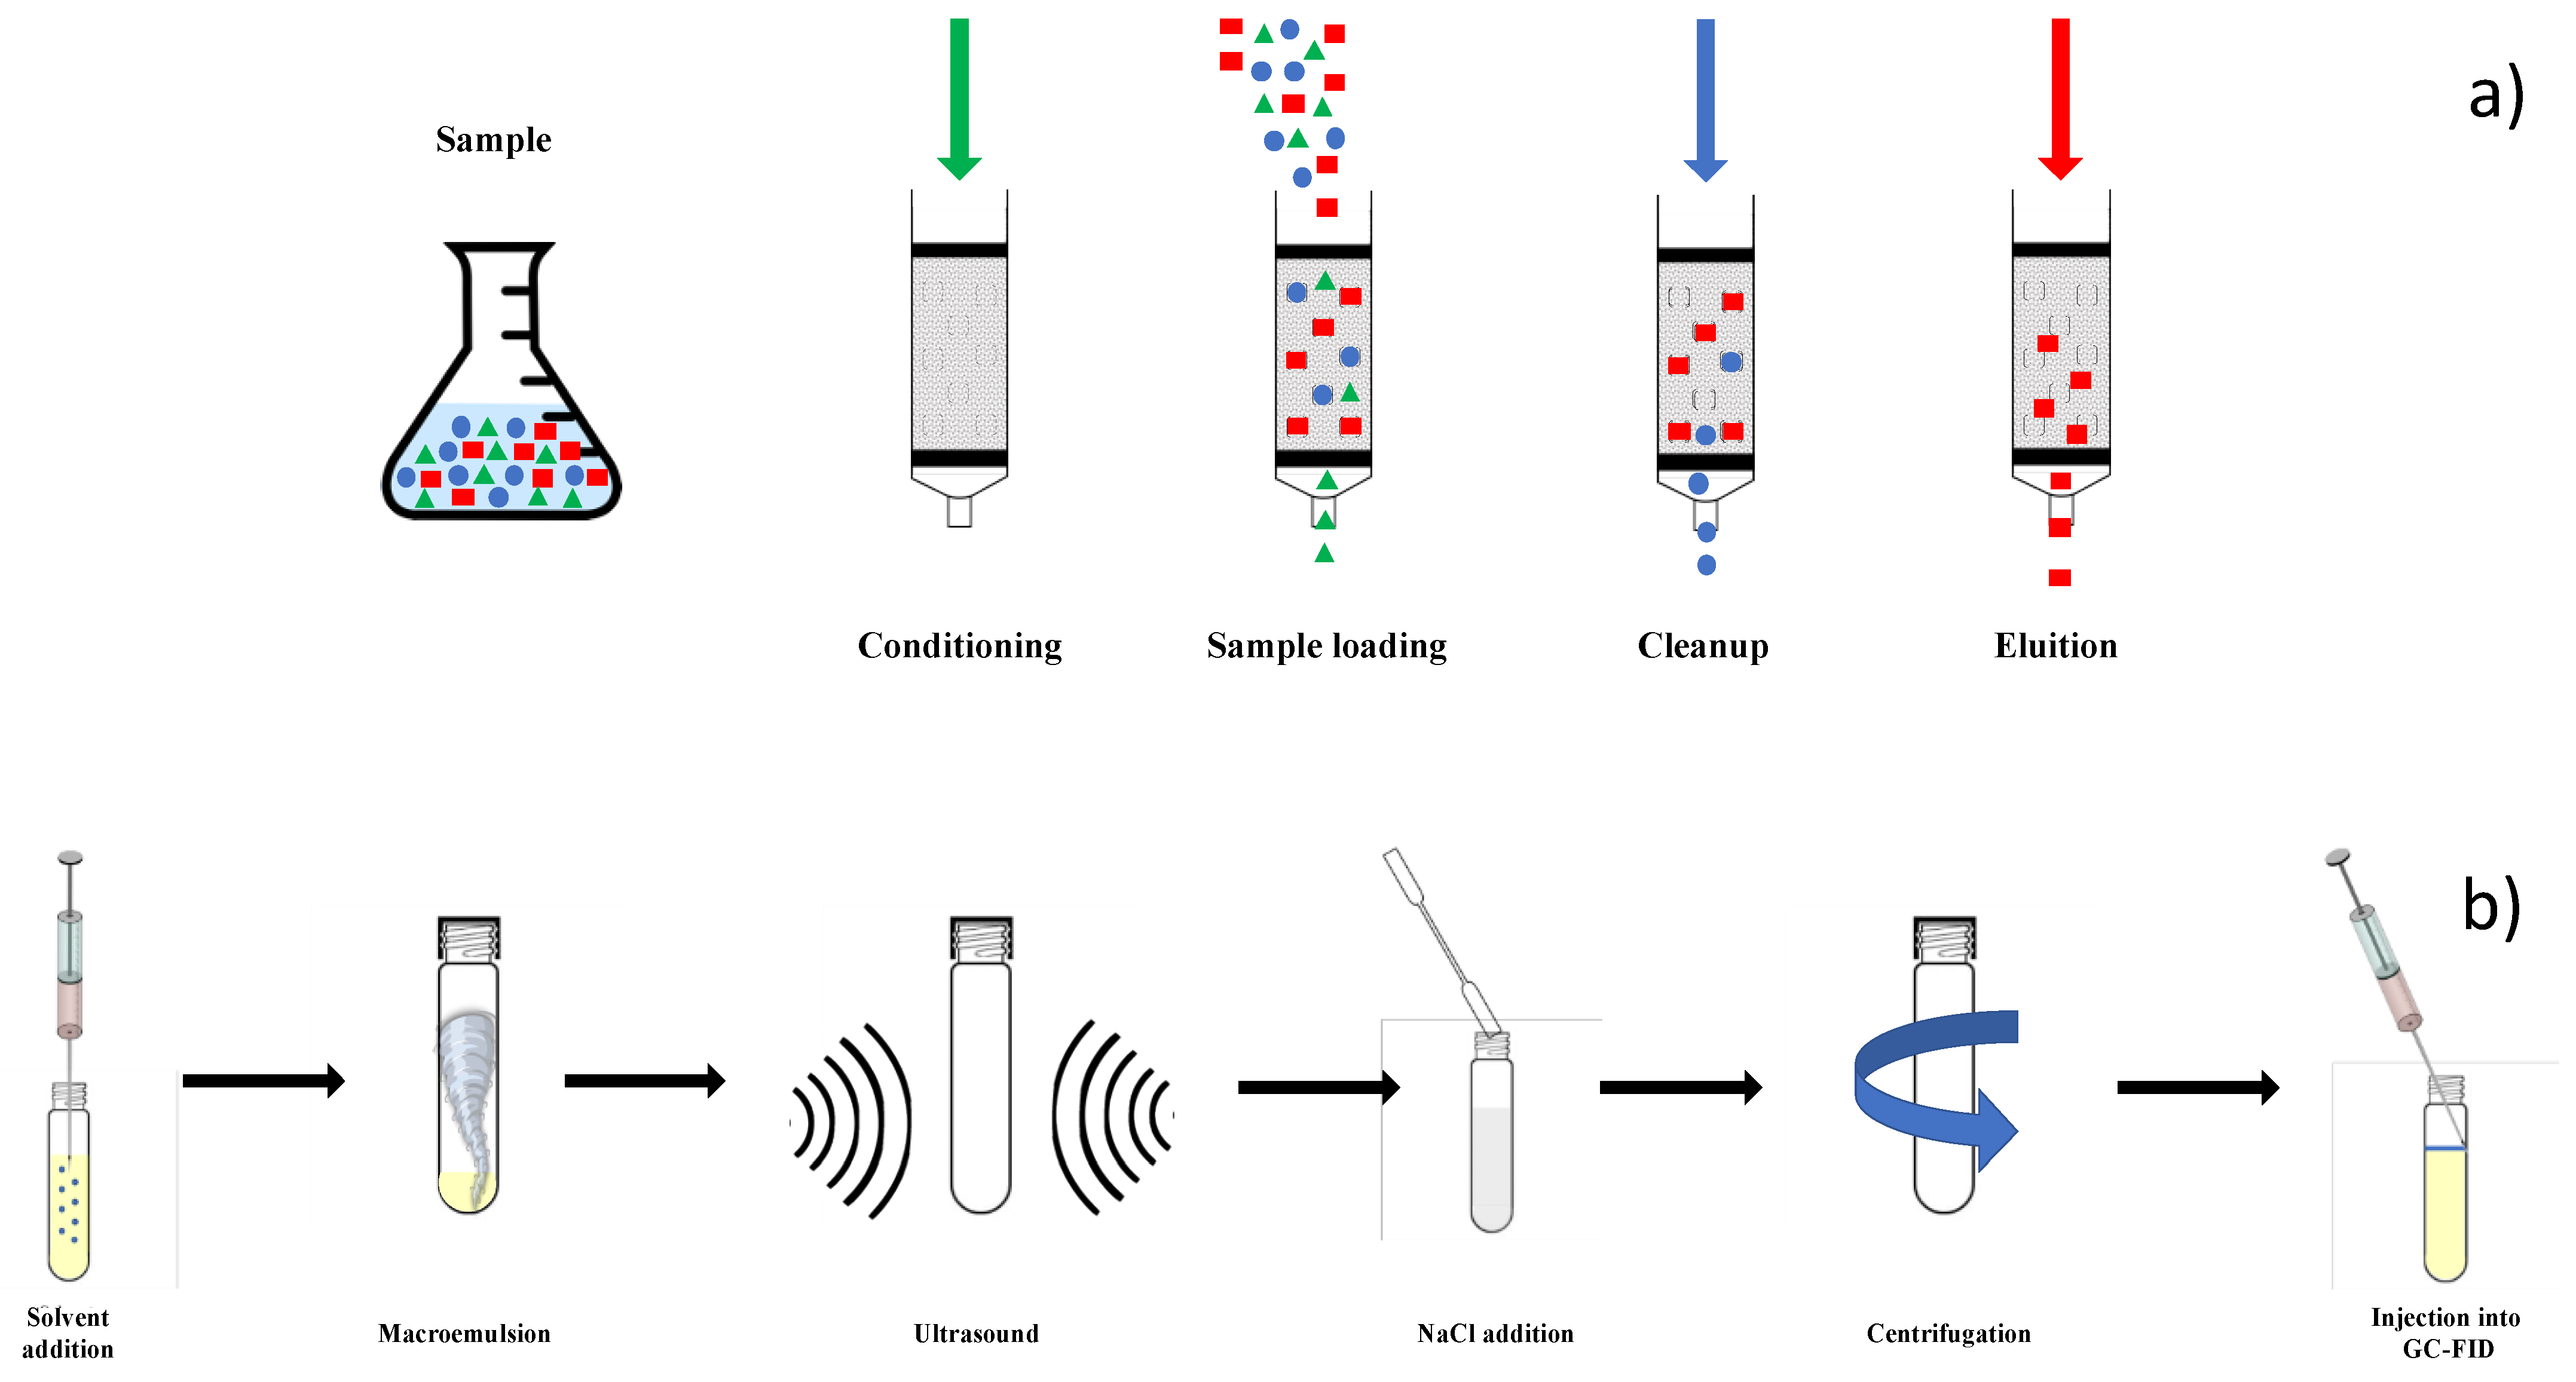
2.3.1. Solid Phase Extraction (SPE)

The SPE technique was used for the extraction of PAEs from hot infused drinks by using reverse-phase silica bonded to an octadecyl group (C18) as stationary phase. Before use, the adsorbent phase was conditioned with 3 mL of different of organic solvents such as acetone, methanol and n-heptane. After conditioning, the cartridge was rinsed with distilled water. A total of 40 mL of hot infused drink was passed through the C18 cartridge at a rate of approximately 5–6 mL min−1. PAEs were then adsorbed by the stationary phase. The adsorbent phase was appropriately dried with gentle airflow for about 20 min, and then the adsorbed phthalates were extracted by means of 3 mL of n-heptane by gravity flow. The eluate was then collected in a glass vial and concentrated to 250 µL under gentle nitrogen flow. After adding the IS, 1 µL was injected into the separation system for the analysis. Figure 1a shows the scheme of the main steps of SPE extraction.

2.3.2. Dispersive Liquid-Liquid Microextraction (DLLME)

The extraction of PAEs from hot infused drinks was also performed with the dispersive liquid-liquid extraction technique, as modified in our laboratory through ultrasound-vortex-assisted dispersive liquid-liquid microextraction (UVA-DLLME) [28]; the vortex and ultrasonic bath were used to create the microemulsion between extractant and solution, avoiding the use of dispersant solvent along with its related implications. A total of 10 mL of the matrix solution was placed in a Pyrex glass with a conical bottom, with 4 µL of the IS. After, 50 µL of n-heptane was rapidly injected into the solution. The obtained solution was subjected to the action of the vortex (ZX3, VELP Scientific, Usmate, Milan, Italy) for 5 min and sonicated by ultrasound (mod. 18–35, Starsonic, Liarre s.r.l., Casalfiumanese, Italy) for 6 min, which allows the formation of the oil-in-water microemulsion [7]. The cloudy solution was centrifuged (mod. Neya 8, Giorgio Bolmac s.r.l., Carpi, Italy) at 4000 rpm for 30 min in order to achieve phase separation. A total of 1 µL of n-heptane, which was in the upper phase, was injected into the GC-FID for the analysis. Figure 1b shows the scheme of the main steps of UVA-DLLME extraction.

3. Results and Discussion

In this paper, two different extraction techniques are compared for the extraction of PAEs from hot drinks generally consumed in plastic containers. PAEs can migrate from the walls of the container into the content of it, since they are not chemically bound to the plastic polymer [18]. Since recent studies demonstrated their possible negative effects on humans [29,30], a sensitive and reliable extraction method is necessary for their extraction and consequent quantification in most consumed beverages.
In order to set up the best analytical conditions for SPE, the adsorption isotherms and breakthrough curves were studied. Figure 2 shows the distribution isotherms for PAEs between the aqueous solution phase and the C18 adsorbent (CS is the solute concentration in solid phase, and CL the solute concentration in liquid phase). The curves are shifted toward the solid phase (CS >> CL,) at different (low and high) PAE concentrations; such occurrence means that the compounds (solutes) have an affinity toward the adsorbent.
Another important parameter in the SPE methodology evaluation regards the breakthrough curves. In fact, they allow the maximum volume passing through the cartridge to be determined without loss of analyte. Over such volume the adsorbent phase is not able to retain analytes, and it begins to release analytes in the eluate. Figure 3 shows the breakthrough curves for the seven PAEs investigated, i.e., the analyte fraction (Ci/C0%) vs. volume (mL).
The breakthrough curves allow us to find the volume of breakthrough, i.e., the maximum volume for quantitatively retaining the investigated compounds by the adsorbent. The theoretical breakthrough volume was 40 mL, which was also used as the experimental breakthrough volume.
Table 1 shows the PAE recoveries for each solvent tested in this study, namely acetone, ethyl acetate, n-heptane, toluene, iso-octane, n-pentane, ethanol and chloroform. Acetone, ethyl acetate and n-heptane were able to extract PAEs, with different performances (between 40.5% and 100.2%, 21.8% and 101.9%, and 61.4% and 94.7%, respectively). The other solvents such as toluene, iso-octane, n-pentane, ethanol and chloroform show very low recoveries. Looking at the data obtained, the best extraction solvent was n-heptane.
As regards the analytical parameters, Table 2 shows the main results obtained by means of the SPE technique followed by GC-FID analysis applied to a real matrix, namely coffee. In particular, the seven PAEs were investigated in the linearity range 5–500 µg mL−1 (except DEP and DDP, investigated in the range 10–500 µg mL−1), showing R2 > 0.9938 and achieving percentage recoveries ranging between 75 and 95%, except for DMP (0.9862 and 43.2%, respectively).
In order to validate the analytical protocol, the sensibility of the method in terms of limit of detection (LOD) and limit of quantification (LOQ) was studied. LODs and LOQs were determined on the basis of the criteria proposed by the International Conference on Harmonization, namely Validation of Analytical Procedure: an analyte that produces a chromatographic peak equal to three times, LOD, or seven times, LOQ, the standard deviation of the baseline noise. The extraction method used showed the value of LODs and LOQs as ranging between 0.1 and 0.9 µg mL- 1 as well as 1.3 and 8.2 µg mL−1, respectively, confirming the goodness of the analytical methodology. Precision and accuracy were studied on the basis of the repeatability of the method in one day (intra-day 1 and 2) and in three consecutive days (inter-day). Relative standard deviation (RSD) is also reported in Table 2 for intra-day and inter-day measurements, ranging between 3.9 and 11% as well as 5.2 and 14.7%, respectively. Finally, Figure 4 shows a chromatogram of a beverage sample, coffee, spiked with a mixing solution containing 30 µg mL−1 of each PAE after SPE procedure; the peaks are well-solved and neat.
On the other hand, as regards DLLME, the original protocol of this extraction technique is based on a ternary system, which extracts analytes in aqueous solution. The dispersing and extracting solvents are added rapidly to the aqueous solution in order to obtain a cloudy solution. The dispersing solvent carries the extraction solvent into the aqueous solution, increasing the contact surface between the investigated analytes and the extraction solvent, as shown in Figure 2. In this work, dispersion was achieved by vortexing and ultrasound, as deeply investigated in a previous paper [28]. In this case we have eliminated the addition of NaCl because it has been noted that the breaking of the microemulsion is ensured only by the centrifugation phase, allowing a reduction in the steps of the method and, therefore, the analysis times.
By using UVA-DLLME as the extraction technique, the authors were able to achieve percentage recoveries ranging between 70.2 and 104.0%, which are reported in Table 3. Further, LODs and LOQs achieved by this approach are slightly better than those reported in Table 2 as well as in the intra-day and inter-day precision.
Finally, Figure 5 shows the chromatogram of the same sample analyzed in Figure 4 (i.e., a beverage sample, precisely coffee, spiked with a mixing solution containing 30 µg mL−1 of each PAE), this time processed by UVA-DLLME. As can be seen, the chromatogram is still well-solved and clear, but in this case the baseline is better, allowing for a lower LOQ than that determined by the SPE approach.
In general, both SPE and UVA-DLLME techniques showed good and satisfactory percentage recoveries. The UVA-DLLME technique showed higher recoveries compared to SPE, ranging between 70.2 and 104.0% as well as 77.7 and 93.6%, respectively. The LODs and LOQs obtained are sufficient for determining and quantifying the PAEs in hot beverages. In particular, the UVA-DLLME showed lower values of LOD and LOQ compared to those of SPE, which highlights the higher sensibility of the SPE. Furthermore, the SPE technique has the advantage of achieving higher pre-concentration factors, compared to the UVA-DLLME, whereas this latter technique reduces the analysis times for obtaining the final solution to be injected in the GC, as well as using a smaller volume of solution. The analytical parameters show that the UVA-DLLME technique had greater precision, achieving recoveries ranging between 70.2 and 104.0%, with an RSD lower than 9.2%. These data confirm the robustness and goodness of the analytical protocol. Although the SPE technique showed a higher pre-concentration factor and a higher sensitivity, the UVA-DLLME reached higher quantitative recoveries, with higher precision. Furthermore, UVA-DLLME allowed us to extract the analytes by means of a small amount of n-heptane (50 µL).
Finally, the UVA-DLLME procedure was applied to coffee and decaffeinated coffee samples. Figure 6 shows the relative chromatogram of the decaffeinated sample; for both samples the only peaks detected were DEHP and DOP (DBP is less than the LOQ to be evaluated), at levels not affecting human health.
Even if these data show no worrying situation, the next step of this approach is to confirm the results obtained by gas chromatography mass spectrometry analysis (GC-MS); this method of analysis can reach very low LOQs and avoid positive/negative artifacts that could affect the results.

4. Conclusions

The DLLME has become a very environmentally friendly sample preparation technique because it is fast, economical, easy to use with a high enrichment factor, and consumes a low volume of organic solvent. On the other hand, the SPE is a well-studied and developed extraction technique. The aim of this paper was to compare and select these two extraction methods, which can achieve quantitative and qualitative recoveries of PAEs from hot beverages with high sensitivity, reliability and reproducibility. The two methods have been compared, investigating all the analytical parameters; DLLME has been applied to the analysis of real samples evidencing no preliminary adverse effect for human health. The next step of this deep study into microplastics in hot beverages is to use GC-MS for confirming the absence of PAE release in such matrices.

Author Contributions

Conceptualization, M.V.R. and P.A.; methodology, A.I.; software, S.P.; validation, I.N. and P.A.; formal analysis, A.I. and C.D.F.; investigation, A.I. and C.D.F.; resources, P.A.; data curation, C.P. and M.V.; writing—original draft preparation, I.N., S.P. and C.D.F.; writing—review and editing, P.A.; visualization, M.V.R. and P.A.; supervision, M.V.R.; project administration, M.V.R.; funding acquisition, P.A. All authors have read and agreed to the published version of the manuscript.

Funding

This research received no external funding.

Institutional Review Board Statement

Not applicable.

Informed Consent Statement

Not applicable.

Data Availability Statement

Data are contained within the article.

Acknowledgments

The authors would like to thank Maurizio Manigrasso for his helpful suggestions in the data presentation.

Conflicts of Interest

The authors declare no conflict of interest.

References

  1. Maier, R.D.; Schiller, M. Plastics Additives Handbook, 6th ed.; Carl Hanser: New York, NY, USA, 2009; ISBN 3446408010. [Google Scholar]
  2. Rasmussen, S.C. From Parkesine to Celluloid: The birth of organic plastics. Angew. Chem. 2021, 60, 8012–8016. [Google Scholar] [CrossRef] [PubMed]
  3. Rahman, M.; Brazel, C.S. The plasticizer market: An assessment of traditional plasticizers and research trends to meet new challenges. Prog. Polym. Sci. 2004, 29, 1223–1248. [Google Scholar] [CrossRef]
  4. Regulation (EC) No 1907/2006 of the European Parliament and of the Council of 18 December 2006 concerning the Registration, Evaluation, Authorisation and Restriction of Chemicals (REACH), establishing a European Chemicals Agency. Off. J. Eur. Union 2006, L 396/1–520. Available online: https://osha.europa.eu/en/legislation/directives/regulation-ec-no-1907-2006-of-the-european-parliament-and-of-the-council (accessed on 5 September 2021).
  5. The European Commission. Commission Regulation (EU) No 10/2011 of 14 January 2011 on plastic materials and articles intended to come into contact with food. Off. J. Eur. Union 2011, 54, L 12/1–L 12/89. [Google Scholar]
  6. Sarath Josh, M.K.; Pradeep, S.; Balachandran, S.; Sudha Devi, R.; Vijayalakshmi Amma, K.S.; Benjamin, S. Temperature- and solvent-dependent migrations of di(2-ethylhexyl)phthalate, the hazardous plasticizer from commercial PVC blood storage bag. J. Polym. Res. 2021, 19, 9915. [Google Scholar] [CrossRef]
  7. Notardonato, I.; Passarella, S.; Ianiri, G.; Di Fiore, C.; Russo, M.V.; Avino, P. Analytical scheme for simultaneous determination of phthalates and bisphenol A in honey samples based on dispersive liquid-liquid microextraction followed by GC-IT/MS. Effect of the thermal stress on PAE/BP-A levels. Methods Protoc. 2020, 3, 23. [Google Scholar] [CrossRef] [PubMed] [Green Version]
  8. De Toni, L.; Tisato, F.; Seraglia, R.; Roverso, M.; Gandin, V.; Marzano, C.; Padrini, R.; Foresta, C. Phthalates and heavy metals as endocrine disruptors in food: A study on prepacked coffee products. Toxicol. Rep. 2017, 4, 234–239. [Google Scholar] [CrossRef] [PubMed]
  9. Lo Turco, V.; Di Bella, G.; Giorgia Potortì, A.; Fede, M.R.; Dugo, G. Determination of plasticizer residues in tea by solid phase extraction–gas chromatography–mass spectrometry. Eur. Food Res. Technol. 2015, 240, 451–458. [Google Scholar] [CrossRef]
  10. Di Bella, G.; Potortì, A.G.; Lo Turco, V.; Saitta, M.; Dugo, G. Plasticizer residues by HRGC-MS in espresso coffees from capsules, pods and moka pots. Food Control 2014, 41, 185–192. [Google Scholar] [CrossRef]
  11. Ranjan, V.P.; Joseph, A.; Goel, S. Microplastics and other harmful substances released from disposable paper cups into hot water. J. Hazard. Mater. 2021, 404, 124118. [Google Scholar] [CrossRef]
  12. Casajuana, N.; Lacorte, S. Presence and release of phthalic esters and other endocrine disrupting compounds in drinking water. Chromatographia 2003, 57, 649–655. [Google Scholar] [CrossRef]
  13. Russo, M.V.; Avino, P.; Cinelli, G.; Notardonato, I. Sampling of organophosphorus pesticides at trace levels in the atmosphere using XAD-2 adsorbent and analysis by gas chromatography coupled with nitrogen-phosphorus and ion-trap mass spectrometry detectors. Anal. Bioanal. Chem. 2012, 404, 1517–1527. [Google Scholar] [CrossRef] [PubMed]
  14. Russo, M.V.; Avino, P.; Perugini, L.; Notardonato, I. Extraction and GC-MS analysis of phthalate esters in food matrices: A review. RSC Adv. 2015, 5, 37023–37043. [Google Scholar] [CrossRef]
  15. Silvestre, C.I.C.; Santos, J.L.M.; Lima, J.L.F.C.; Zagatto, E.A.G. Liquid-liquid extraction in flow analysis: A critical review. Anal. Chim. Acta 2009, 652, 54–65. [Google Scholar] [CrossRef]
  16. Żwir-Ferenc, A.; Biziuk, M. Solid Phase Extraction technique—Trends, opportunities and applications. Pol. J. Environ. Stud. 2006, 15, 677–690. [Google Scholar]
  17. Fontanals, N.; Marcé, R.M.; Borrull, F. New materials in sorptive extraction techniques for polar compounds. J. Chromatogr. A 2007, 1152, 14–31. [Google Scholar] [CrossRef] [PubMed]
  18. Forgács, E. Retention characteristics and practical applications of carbon sorbents. J. Chromatogr. A 2002, 975, 229–243. [Google Scholar] [CrossRef]
  19. Esteve-Turrillas, F.A.; Mercader, J.V.; Agulló, C.; Abad-Somovilla, A.; Abad-Fuentes, A. Development of immunoaffinity columns for pyraclostrobin extraction from fruit juices and analysis by liquid chromatography with UV detection. J. Chromatogr. A 2011, 1218, 4902–4909. [Google Scholar] [CrossRef] [PubMed]
  20. Rezaee, M.; Assadi, Y.; Milani Hosseini, M.R.; Aghaee, E.; Ahmadi, F.; Berijani, S. Determination of organic compounds in water using dispersive liquid-liquid microextraction. J. Chromatogr. A 2006, 26, 1–9. [Google Scholar] [CrossRef]
  21. Šandrejová, J.; Campillo, N.; Viñas, P.; Andruch, V. Classification and terminology in dispersive liquid-liquid microextraction. Microchem. J. 2016, 127, 184–186. [Google Scholar] [CrossRef]
  22. Russo, M.V.; Notardonato, I.; Avino, P.; Cinelli, G. Fast determination of phthalate ester residues in soft drinks and light alcoholic beverages by ultrasound/vortex assisted dispersive liquid-liquid microextraction followed by gas chromatography-ion trap mass spectrometry. RSC Adv. 2014, 4, 59655–59663. [Google Scholar] [CrossRef]
  23. Hongyuan, Y.; Hui, W. Recent development and applications of dispersive liquid-liquid microextraction. J. Chromatogr. A 2013, 1295, 1–15. [Google Scholar]
  24. Rezaee, M.; Yamini, Y.; Faraji, M. Evolution of dispersive liquid–liquid microextraction method. J. Chromatogr. A 2010, 1217, 2342–2357. [Google Scholar] [CrossRef] [PubMed]
  25. Hashemi, B.; Zohrabi, P.; Kim, K.-H.; Shamsipur, M.; Deep, A.; Hong, J. Recent advances in liquid-phase microextraction techniques for the analysis of environmental pollutants. TrAC-Trend. Anal. Chem. 2017, 97, 83–95. [Google Scholar] [CrossRef]
  26. Quigley, A.; Cummins, W.; Connolly, D. Dispersive liquid-liquid microextraction in the analysis of milk and dairy products: A review. J. Chem. 2016, 2016, 4040165. [Google Scholar] [CrossRef] [Green Version]
  27. Notardonato, I.; Protano, C.; Vitali, M.; Avino, P. Phthalates and bisphenol-A determination and release from different beverage plastic containers by dispersive liquid-liquid microextraction and GC-IT/MS analysis. Food Anal. Method. 2019, 12, 2562–2571. [Google Scholar] [CrossRef]
  28. Russo, M.V.; Avino, P.; Notardonato, I. Fast analysis of phthalates in freeze-dried baby foods by ultrasound-vortex-assisted liquid-liquid microextraction coupled with gas chromatography-ion trap/mass spectrometry. J. Chromatogr. A 2016, 1474, 1–7. [Google Scholar] [CrossRef] [PubMed]
  29. Cheshmazar, E.; Arfaeinia, L.; Vasseghian, Y.; Ramavandi, B.; Moradi, M.; Hashem, S.; Asgari, E.; Arfaeinia, H.; Dragoi, E.; Mousavi, K.A. Phthalate acid esters in pickled vegetables packaged in polyethylene terephthalate container: Occurrence, migration and estrogenic activity-associated risk assessment. J. Food Compos. Anal. 2021, 99, 103880. [Google Scholar] [CrossRef]
  30. Wang, X.; Xu, M.; Yang, A.; Wang, Y.; Hou, S.; Zheng, N.; Liang, D.; Hua, X.; Dong, D. Health risks of population exposure to phthalic acid esters through the use of plastic containers for takeaway food in China. Sci. Total Environ. 2021, 785, 147347. [Google Scholar] [CrossRef]
Figure 1. Master schemes of the extraction procedures investigated in this study for analyzing phthalates (PAEs) in hot drinks: (a) Solid Phase Extraction (SPE); (b) Ultrasound-Vortex-Assisted Dispersive Liquid-Liquid Microextraction (UVA-DLLME).
Processes 09 01588 g001
Figure 2. Distribution isotherms of PAEs between C18 adsorbent and the water solution at 25 °C.
Processes 09 01588 g002
Figure 3. Breakthrough curves of the investigated PAEs in 100 mL solution spiked with 40 µg mL−1 of each analyte on the C18 cartridge (100 mg).
Processes 09 01588 g003
Figure 4. SPE-GC-FID chromatogram of a coffee sample spiked with 30 µg mL−1 of each PAE. Peaks: 1 DMP, 2 DEP, I.S. Internal Standard, 3 DiBP, 4 DBP, 5 DEHP, 6 DOP, 7 DDP; for experimental conditions: see text.
Processes 09 01588 g004
Figure 5. UVA-DLLME-GC-FID chromatogram of a coffee sample spiked with 30 µg mL−1 of each PAE. Peaks: see Figure 4; for experimental conditions: see text.
Processes 09 01588 g005
Figure 6. UVA-DLLME-GC-FID chromatogram of a decaffeinated coffee sample. Peaks: see Figure 4; for experimental conditions: see text.
Processes 09 01588 g006
Table 1. Recoveries (%) of each PAE in relation to different solvents used for the extraction. In brackets are reported the coefficients of variation (cv%) 1.
PAE 2AcetoneEthyl Acet.n-HeptaneTolueneiso-Octanen-PentaneEthanolChloroform
DMP40.5 (11.2)101.9 (4.1)61.4 (8.3)n.a. 3n.a.n.a.n.a.n.a.
DEP97.5 (8.7)90.7 (6.2)78.3 (4.2)n.a.n.a.n.a.44.1 (17.9)n.a.
DiBP96.4 (6.3)21.8 (5.1)87.5 (4.9)10.4 (4.4)12.7 (9.9)n.a.14.5 (8.3)13.5 (6.3)
DBP100.2 (5.2)19.9 (3.9)75.2 (5.6)8.5 (9.9)n.a.n.a.10.9 (11.4)10.7 (9.5)
DEHP82.0 (8.3)19.2 (6.4)91.6 (3.4)8.7 (7.2)8.8 (7.1)8.5 (6.2)19.3 (8.7)56.9 (7.1)
DOP92.6 (7.5)8.1 (5.9)80.1 (2.9)4.4 (5.2)n.a.n.a.5.2 (7.9)6.9 (6.9)
DDP85.6 (6.9)10.7 (4.7)94.7 (3.6)7.2 (6.9)n.a.n.a.8.4 (9.1)10.6 (5.1)
1 c.v.%: ratio between standard deviation and average value × 100; 2 dimethylphthalate (DMP); diethylphthalate (DEP); di-isobutylphthalate (DiBP); di-n-butylphthalate (DBP); di-2-(ethylhexyl)phthalate (DEHP); di-octyl phthalate (DOP); di-decyl phthalate (DDP); 3 n.a. not analyzed.
Table 2. Correlation coefficients (R2) in the range 5–500 µg mL−1, limit of detection (LOD), limit of quantification (LOQ), recoveries and intra-day and inter-day precision along with relative standard deviation (RSD) in coffee samples of each PAE investigated by means of SPE approach.
PAE 1R2LODLOQRecoveryIntra-Day 1Intra-Day 2Inter-DayRSD
(µg mL−1)(µg mL−1)(% ± s.d. 2)(% ± s.d.)(% ± s.d.)(% ± s.d.)(%)
DMP0.98620.45.843.2 ± 7.162.5 ± 5.665.2 ± 7.264.3 ± 9.411.0/14.7
DEP0.99380.68.280.7 ± 4.876.6 ± 3.882.4 ± 4.979.5 ± 4.04.9/5.2
DiBP0.99540.23.486.2 ± 3.585.3 ± 3.488.3 ± 5.385.9 ± 6.96.0/8.1
DBP0.99720.24.180.1 ± 3.279.1 ± 3.976.4 ± 2.177.7 ± 5.94.9/7.6
DEHP0.99830.91.794.5 ± 1.990.9 ± 3.696.3 ± 3.993.6 ± 6.24.0/6.7
DOP0.99780.11.383.6 ± 3.383.1 ± 3.381.9 ± 3.582.5 ± 5.23.9/6.3
DDP0.99742.96.293.1 ± 4.691.5 ± 5.593.8 ± 5.892.6 ± 7.86.0/8.4
1 For PAE acronyms, see Table 1; 2 s.d. standard deviation.
Table 3. Correlation coefficients (R2) in the range 5–500 µg mL−1, limit of detection (LOD), limit of quantification (LOQ), recoveries and intra-day and inter-day precision along with relative standard deviation (RSD) in coffee samples of each PAE investigated by means of UVA-DLLME approach.
PAE 1R2LODLOQRecoveryIntra-Day 1Intra-Day 2Inter-DayRSD
(µg mL−1)(µg mL−1)(% ± s.d. 2)(% ± s.d.)(% ± s.d.)(% ± s.d.)(%)
DMP0.98801.22.870.2 ± 5.282.1 ± 9.384.5 ± 8.272.3 ± 6.76.9/9.2
DEP0.99910.62.489.3 ± 7.596.9 ± 4.998.1 ± 5.387.4 ± 5.35.4/6.1
DiBP0.99590.61.3103.7 ± 5.2104.2 ± 6.3102.4 ± 5.7102.3 ± 6.55.8/6.4
DBP0.99670.41.3102.3 ± 3.2100.2 ± 5.2104.1 ± 6.199.2 ± 9.16.4/9.2
DEHP0.99700.71.2100.2 ± 3.698.6 ± 3.698.5 ± 4.298.7 ± 6.84.1/6.9
DOP0.99711.62.8103.7 ± 2.998.9 ± 5.197.6 ± 5.3101.3 ± 5.25.2/5.1
DDP0.99650.52.4104.0 ± 3.799.1 ± 4.399.2 ± 3.2101.5 ± 7.34.3/7.2
1 For PAE acronyms, see Table 1; 2 s.d. standard deviation.
Publisher’s Note: MDPI stays neutral with regard to jurisdictional claims in published maps and institutional affiliations.

