Article

Optimization Study on Increasing Yield and Capacity of Fluid Catalytic Cracking (FCC) Units

College of Information Science and Technology, Beijing University of Chemical Technology, Beijing 100020, China
*
Author to whom correspondence should be addressed.
Processes 2021, 9(9), 1497; https://doi.org/10.3390/pr9091497
Submission received: 29 July 2021 / Revised: 18 August 2021 / Accepted: 23 August 2021 / Published: 25 August 2021

Abstract

:
The fluidized catalytic cracking (FCC) unit is the primary production unit for gasoline and olefins in refineries. Improving product yield and processing capacity is closely related to the economic benefits of refineries. In this paper, we use the Aspen HYSYS software to model the mechanism of an 800 kt/a FCC unit in China. The simulation of the FCC unit based on the 21-lump models and the simulation results are in good agreement with the actual factory production data. Then we find out the optimization method to improve the product yield and processing capacity through the model research. The results of the study indicate the following optimization plans: when keeping the riser outlet temperature (ROT) in the range of 535~545 °C, it can increase the yield of gasoline and liquefied petroleum gas (LPG) by up to 5%; when keeping the riser outlet temperature (ROT) in the range of 510~520 °C, it can increase the yield of gasoline and diesel by up to 0.5%; the optimal ROT of control temperature should be 530 °C when ensuring the same gasoline yield and increasing processing capacity, it can increase the feed rate by 14.3% which in turn increases gasoline production. Through the above plans, the refinery can achieve the production goals of yield and capacity. Therefore, the refinery can get more profits.

1. Introduction

The current economic environment, policies and regulations, and environmental protection pressure on refinery process integration and operation optimization [1,2]. The FCC unit is the oil refinery’s largest production unit for gasoline and light products [3]. It plays a key role in the operation of all refineries [4]. The yield and output of the staple products of the FCC unit are the keys to ensuring the economic benefits of the refinery. Refinery operators can fine-tune the device based on experience to increase the yield and output of the FCC unit. However, it is necessary to realize the improvement for the unit by grasping the chemical reaction, the feed characteristics, and the equipment performance [5,6]. On this basis, it is crucial to use a strict model [7]. In particular, a strict model validated by unit data can determine the key locations for process improvement.
Previous authors have studied the problems of the FCC units in terms of mechanism modeling and operational optimization. Especially the efforts of Arbel et al. [8] and McFarlane et al. [9] in this area merit highlighting. In Arbel’s work, they developed a 10-lump model. Although this model fits well for simulating industrial production trends, with the 10-lump model it is difficult to deal with heavy feedstocks (boiling points above 510 °C), so the developed model is not widely applicable. McFarlane provided an Advanced Continuous Simulation Language (ACSL) program to integrate the FCCU model. However, this model is highly nonlinear and strongly interacting, making it difficult to adapt widely to various refineries. Alshamsi [10] subsequently established a four-lump model and optimized the product by varying the height of the riser reactor. Stratiev et al. [11] increased the output of the FCC unit by using vortex separation system (VSS) riser technology to modify the reactor and regenerator. Luo et al. [12] developed a new catalyst with a special coke. They found that it can effectively improve tar conversion rates and gas yields. Wallin et al. [13] achieved the maximization of refinery profits by changing the catalyst to oil ratio to alter the catalyst’s efficiency.
However, most of the early work used very simplified chemical reactions to express the process kinetics. In addition, both the reaction regeneration and fractionation systems are complex and difficult to converge. The early work in the literature did not integrate the FCC reaction model with its complex fractionation system, which would cause optimization to deviate from the actual large-scale integration conditions. At the same time, it is time-consuming and labor-intensive work to reform the catalytic cracking unit, develop new catalysts or change the properties of raw materials. This research work fills the gap between the development of rigorous dynamics models in large refineries and industrial applications. We have eliminated the barriers among the three FCC systems and combined them into a complete system. In this way, we can more truly and comprehensively reflect the overall picture of the processing system of the refinery, find the laws and change trends in the system, and then efficiently and accurately realize the optimization of the system.
Moreover, we use the FCC process mechanism model established by Aspen HYSYS to find a convenient way to increase the yield and output of the FCC unit by changing the ROT. This method is conducive to the adjustment of the refinery, not just confined to the laboratory. Furthermore, there is no need to invest too much in cost, and the danger is also within the controllable range.

2. Materials and Methods

2.1. Case Study

We take an 800 kt/a FCC refinery in China as the research object. The FCC unit mainly comprises the reaction regeneration system, fractionation system, and absorption stabilization System [14]. Figure 1 shows a sketch of the process flow.

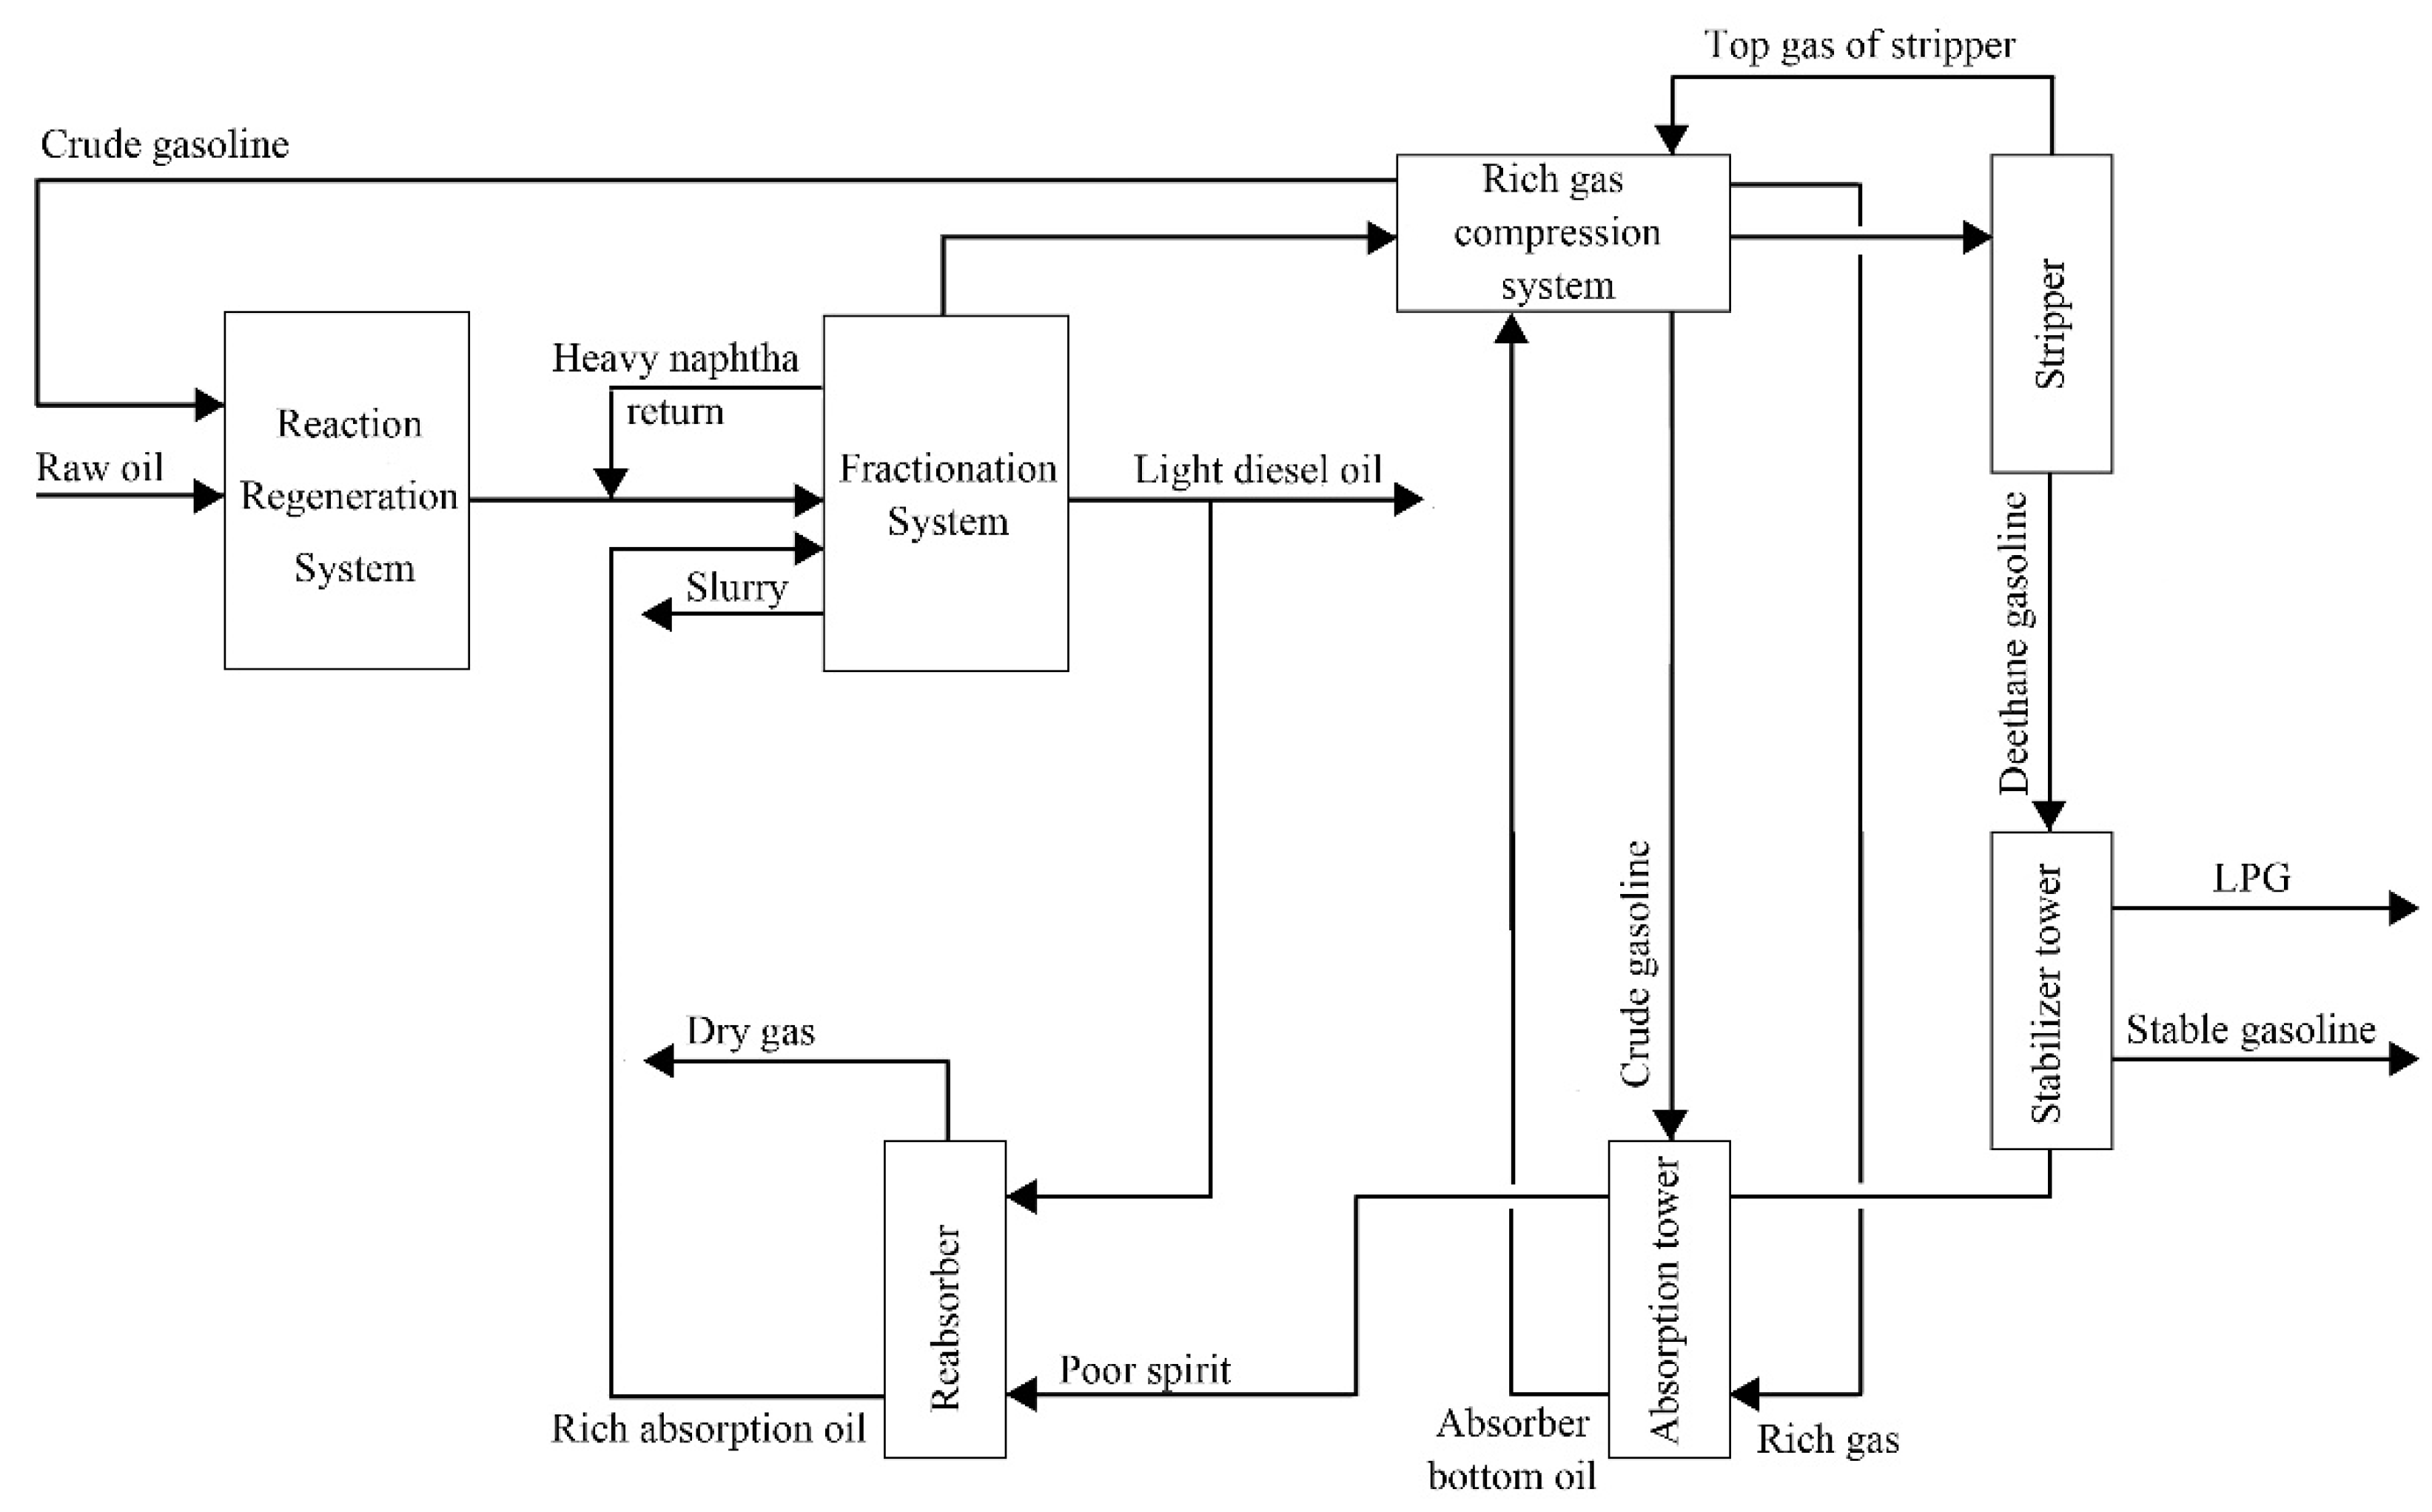
2.1.1. Reaction Regeneration System

The crude oil is sent from the upstream device to the oil tank and then enters the riser reactor after preheating and atomization. The spent catalyst recovered by the device enters the stripping section. It comes into countercurrent contact with steam to strip the oil gas carried by the catalyst. Most of the catalyst enters the coking tank through the standby inclined tube. The reacted oil gas needs to remove the catalyst and then enter the lower part of the fractionation tower through the reaction oil gas pipeline.

2.1.2. Fractionation System

The reacted oil gas from the settler enters the bottom of the fractionation tower and then meets the circulating oil slurry in the upper return column to wash and remove the catalyst and excess heat. The oil gas at the top of the fractionation tower is cooled to 40 °C and then enters the phase separator for vapor-liquid separation. The separated rich gas enters the air pressure machine. The oil pump pumps the remaining crude gasoline and enters the top of the absorption column as an absorbent. The light diesel oil is extracted from the fractionation tower’s 12th and 14th floors, sent to the light diesel oil stripping tower, and then cooled out of the device after steam stripping. Cool the lean absorption oil to 40 °C. Part of it goes to the tank area, and the rest goes to the top of the absorption tower as absorbent.

2.1.3. Absorption Stabilization System

At the top of the fractionation tower, the rich gas enters a first-stage air compressor for compression and then cools to 40 °C for vapor-liquid separation. The separated rich gas enters the second-stage air compressor for compression. Then it is washed with acid water and cooled by the dry air cooler. Then it is mixed with the bottom oil of the absorption column and the top gas of the desorption column and then cooled to 40 °C for vapor-liquid separation. The separated rich gas enters from the bottom of the absorption column and is absorbed with crude gasoline and stable gasoline. The lean gas goes to the reabsorption column and is further absorbed by light diesel oil. After the top dry gas of the absorption column enters the separator tank, it is divided into two parts, one goes to the product refining unit for desulfurization, and the other is used as pre-lift dry gas. The separated condensate oil is pumped and boosted directly into the top of the desorption column to desorb the components less than C3. The de-ethane gasoline is drawn from the bottom of the desorption column and sent to the stabilization column for fractionation after self-pressure and heat exchange. Liquid hydrocarbons distill from the top of the stabilizing column. Part of it returns to the stabilizing column, and the rest goes to the product refining unit. Stabilized gasoline flows out from the bottom of the stabilizing column. A part of it goes to the gasoline hydrogenation unit as a gasoline product. The other part goes to the absorption column as the supplementary absorbent.

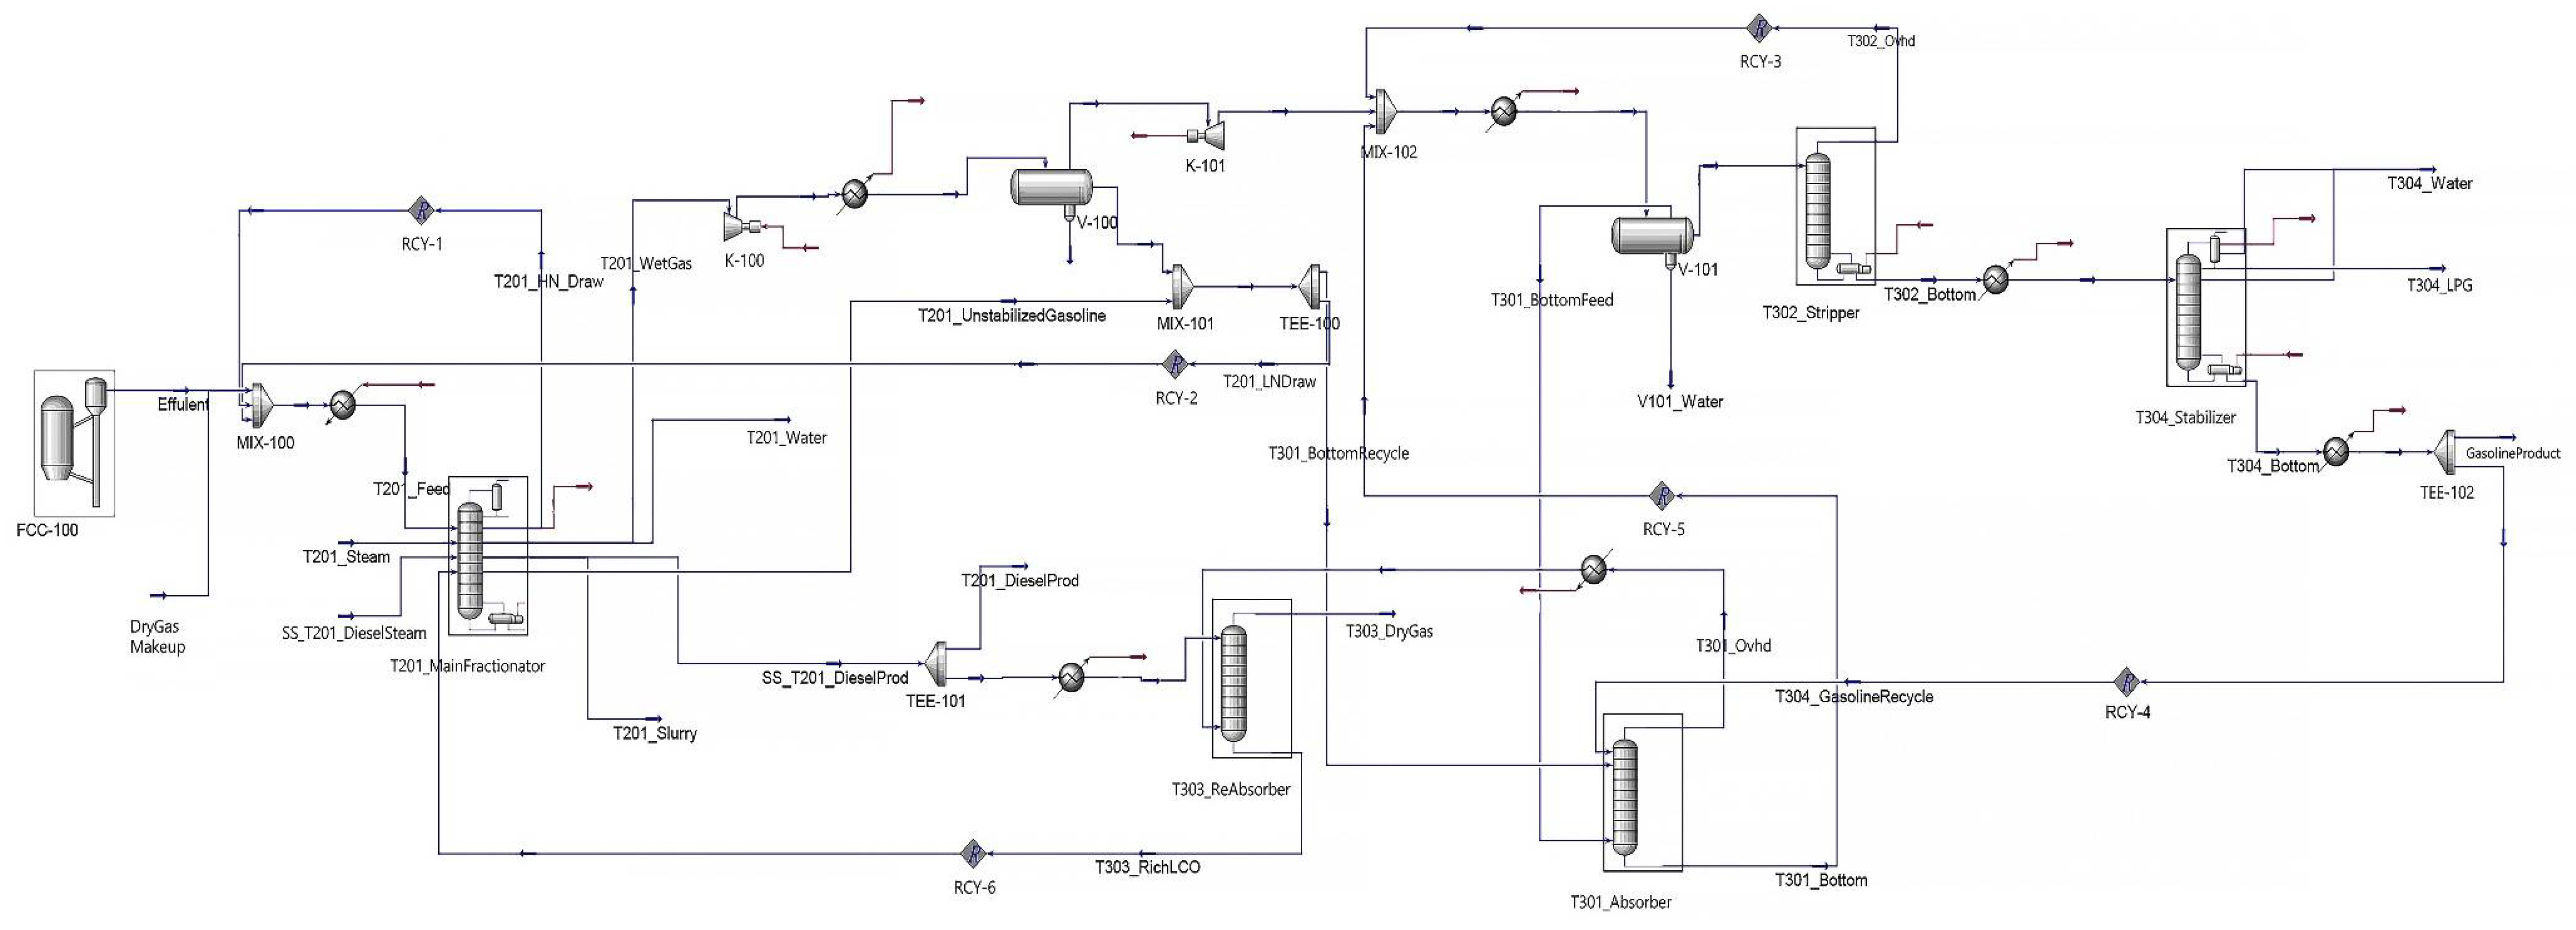
2.2. Simulation Methods

First, we need to develop a strict kinetic model to find the refinery optimization method. This work uses Aspen HYSYS V11 software [15], and the 21-lump kinetic dynamics model [16] developed by AspenTech [17,18] is used to model the process mechanism based on the actual production process data of the refinery. The simulation of the whole process of the FCC unit of the refinery is shown in Figure 2. The model can solve heavy feedstocks (boiling point above 510 °C), which the original 10-lumped model cannot solve. The default component package selected in this simulation is “FCC Components Celsius.cml”. Since most FCC systems are virtual components and light hydrocarbons, the thermodynamic fluid package chooses the “Peng-Robinson” method [19]. For modeling the fluidized bed reactor in the process, we selected the FCC module that comes with the software [20].
First, specify the size of the reactor and the regenerator, then set the heat loss at different positions to be 0, and then use the default correction factor to establish the initial model. Next, we should input feed and catalyst information into the software. Then configure the FCC operating variables to solve the initial model. After the solution is converged, based on the current simulation situation, input the yield and performance of the measurement process and then update the correction factor to achieve the effect of correcting the initial model. Next, simulate the fractionation, absorption, and stabilization systems. The fractionation column selects the absorption column model with top reflux. The stripping column selects the absorption column model with a reboiler. The stabilization column selects the rectification column model. The absorption column and the reabsorption column both select the absorption column model [21].

3. Results and Discussion

3.1. Yield Analysis on the Model

After the previous work, we have obtained the process model and need to verify its accuracy. First, compare the simulation results of the main product yields with the steady-state data of the main product yields under actual operating conditions, as shown in Table 1. We find that the deviation between the simulation yield of the main products (LPG, gasoline, light diesel) and the actual operating conditions is relatively small.

3.2. Comparative Analysis of the Main Operating Parameters of the Model

Next, compare the main operating parameters of the process simulation model with the actual design parameter ranges, as shown in Table 2. We find that most of the simulation parameters are within the design parameters. It is not distinct that individual parameters are beyond the defined range.

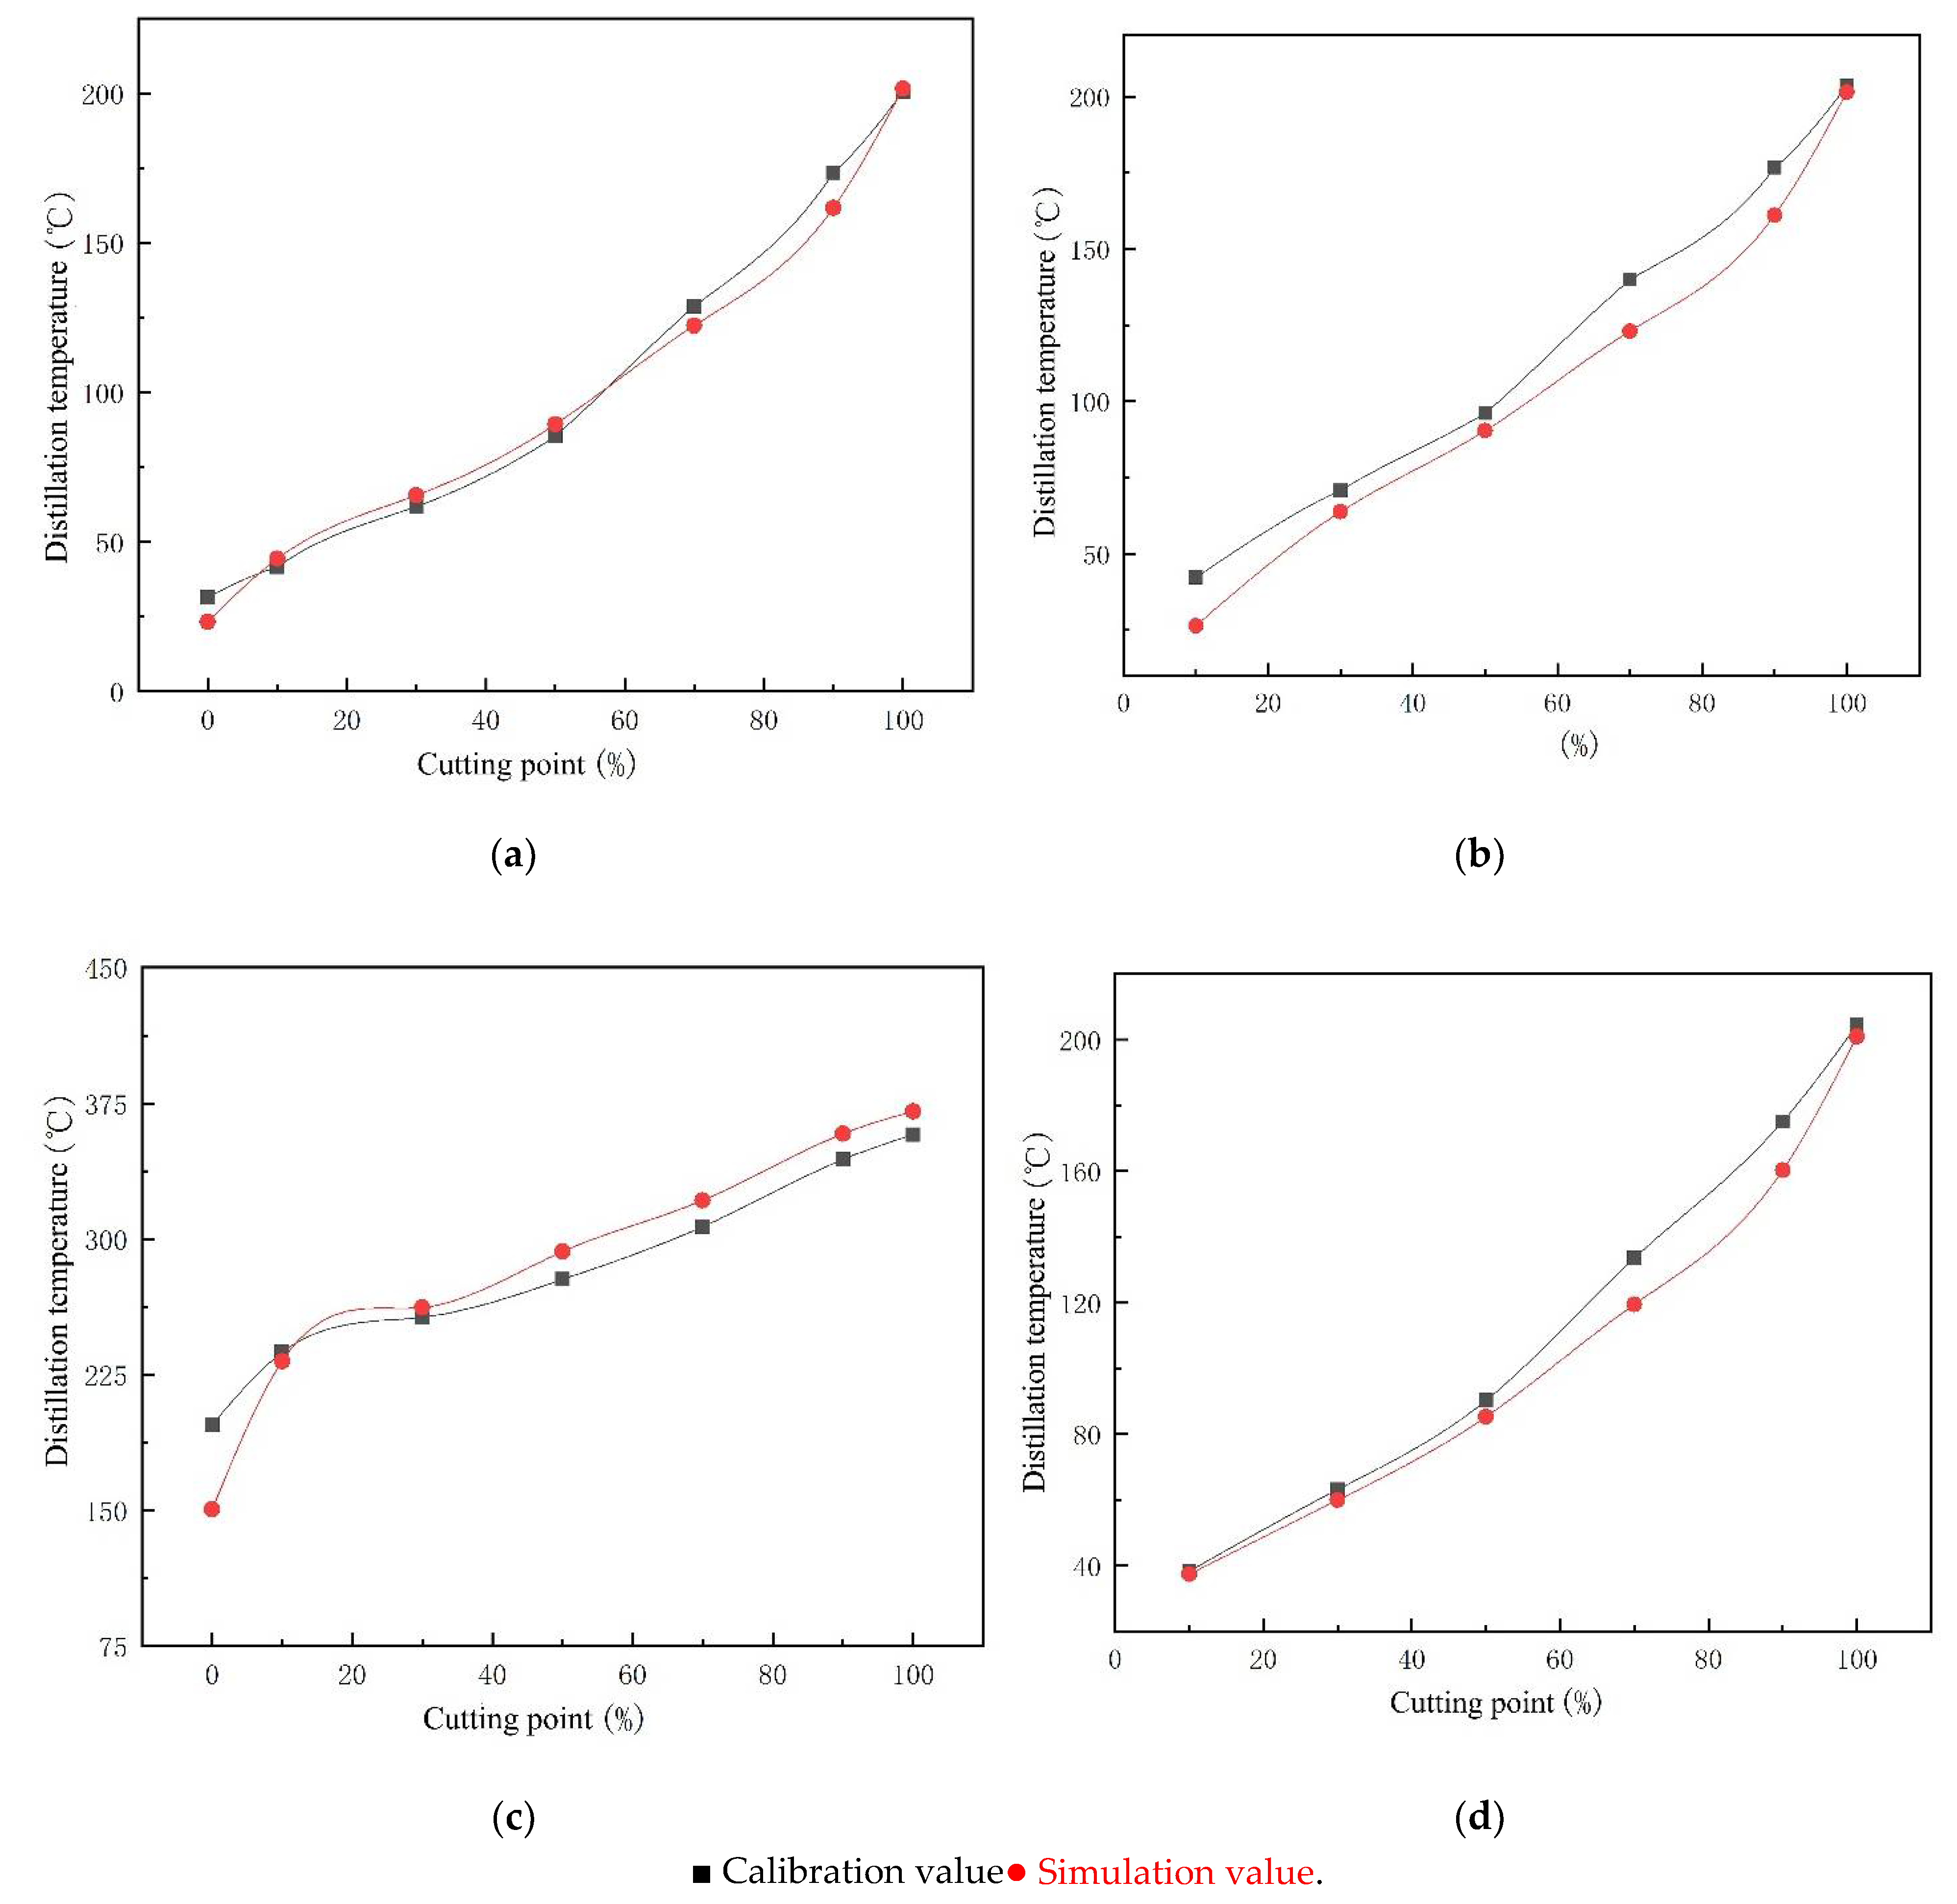
3.3. Comparative Analysis of the Distillation Curves of the Main Products of the Model

Finally, whether we can get qualified products is a significant assessment indicator. It requires oil product evaluation of the products [22]. We compare the product D1160 distillation data obtained by the process simulation with the D1160 distillation data of the actual working condition calibration test, as shown in Figure 3. We can see from the figure that the simulated data is in good agreement with the actual data. It also further confirmed that the process simulation model obtains qualified results.

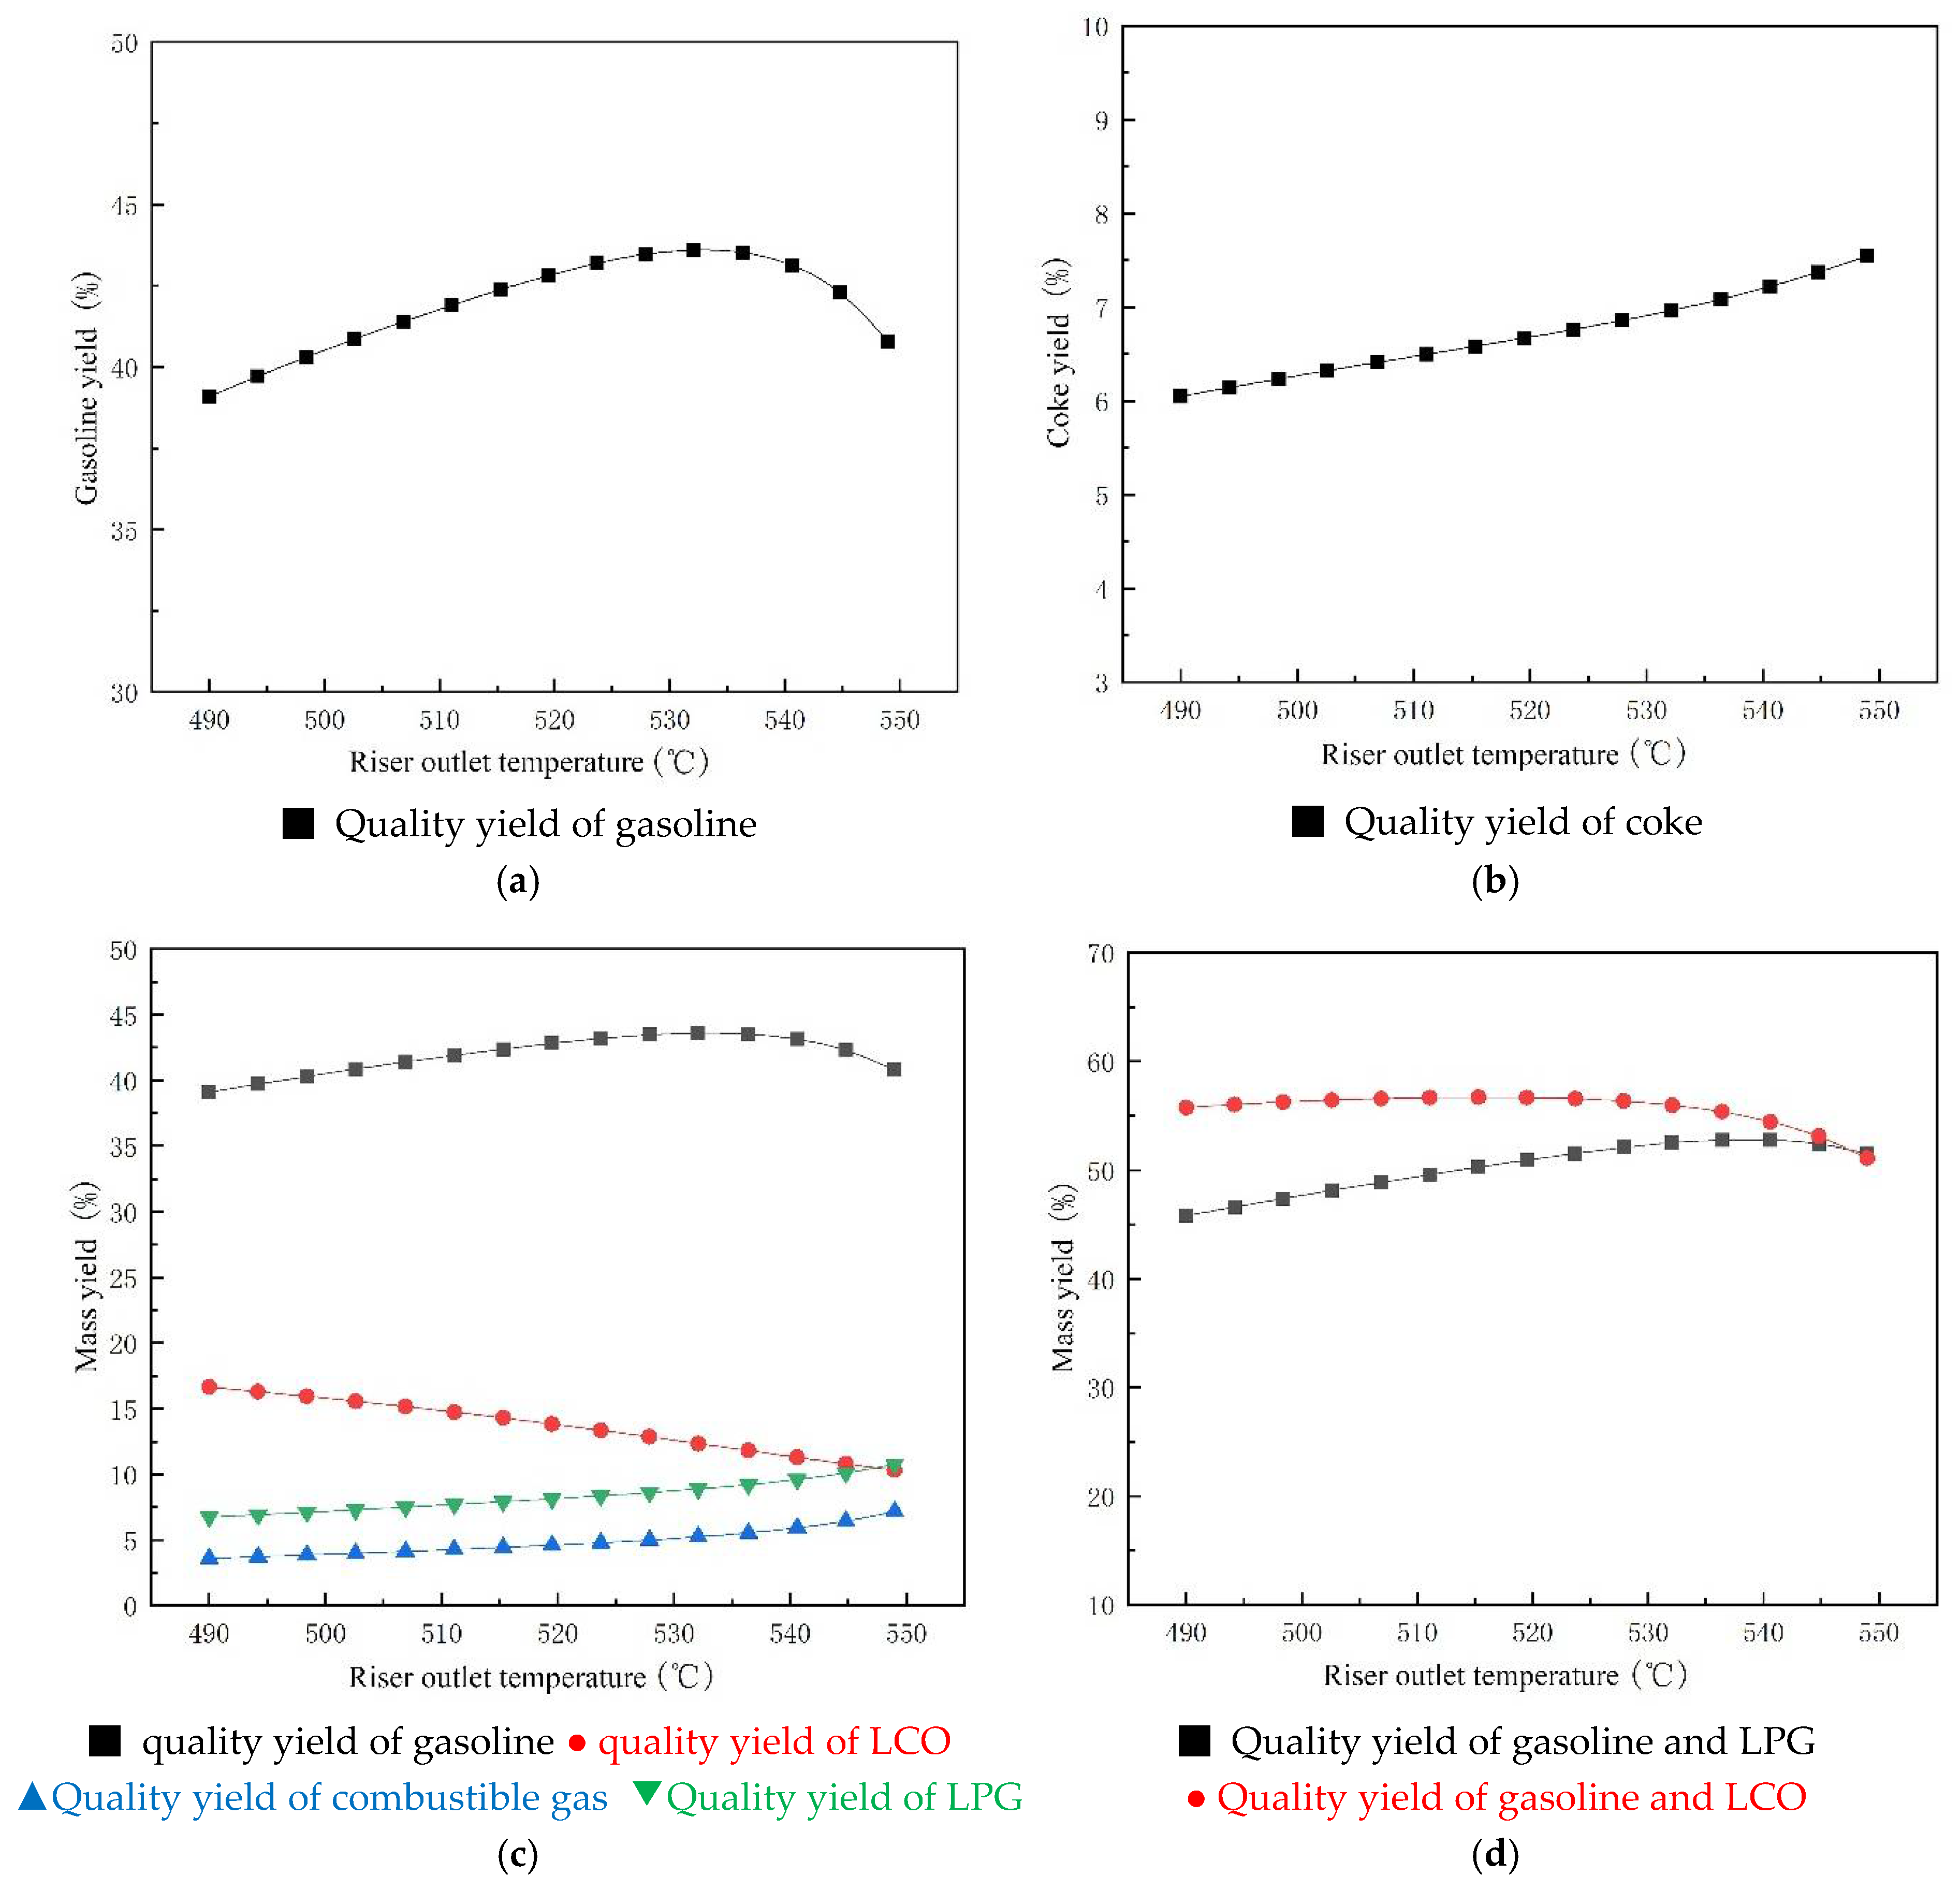
3.4. Optimization of Improving Gasoline Yield

Gasoline yield is a typical complex function related to temperature, pressure, feed quality, and catalyst oil ratio [23]. ROT [24] is an operational variable that is relatively easy to manipulate to keep the unit feed constant. With the increase of ROT, the cracking of the C5+ component and aromatics chain-breaking reaction will increase [1]. So, the yield of gasoline is increased. In this paper, we use the Case Studies tool [25] to calculate the gasoline yield of the unit under different ROT. The results are shown in Figure 4a. The actual operating condition ROT is 518 °C, while the maximum gasoline yield ROT is 533 °C. Nevertheless, there are other valuable products to consider. The yield of other valuable products calculated by the study is shown in Figure 4c.
The diesel yield decreases significantly at ROT of 533 °C. At the same time, the yield of combustible gas (light gas) will increase rapidly, which indicates that the feed is over-cracked [26]. Dry gas and fuel gas are not of great value and tend to overload the gas-rich compressor at the top of the tower [27]. In addition, as shown in Figure 4b, there is a strong correlation between the coke yield of the catalyst leaving the riser and the ROT. The more coke, the more utility consumption of regenerated catalysts will increase, so the above factors narrow the acceptable range of ROT. We conducted a study based on different maximized product production options for the refinery, as shown in Figure 4d. If the refinery maximizes the production of gasoline and LPG, the ROT will be in the range of 535~545 °C. It can increase the yield of gasoline and LPG by up to 5%. If the refinery maximizes the production of gasoline and diesel, the ROT will be in the range of 510~520 °C. It can increase the yield of gasoline and diesel by up to 0.5%.

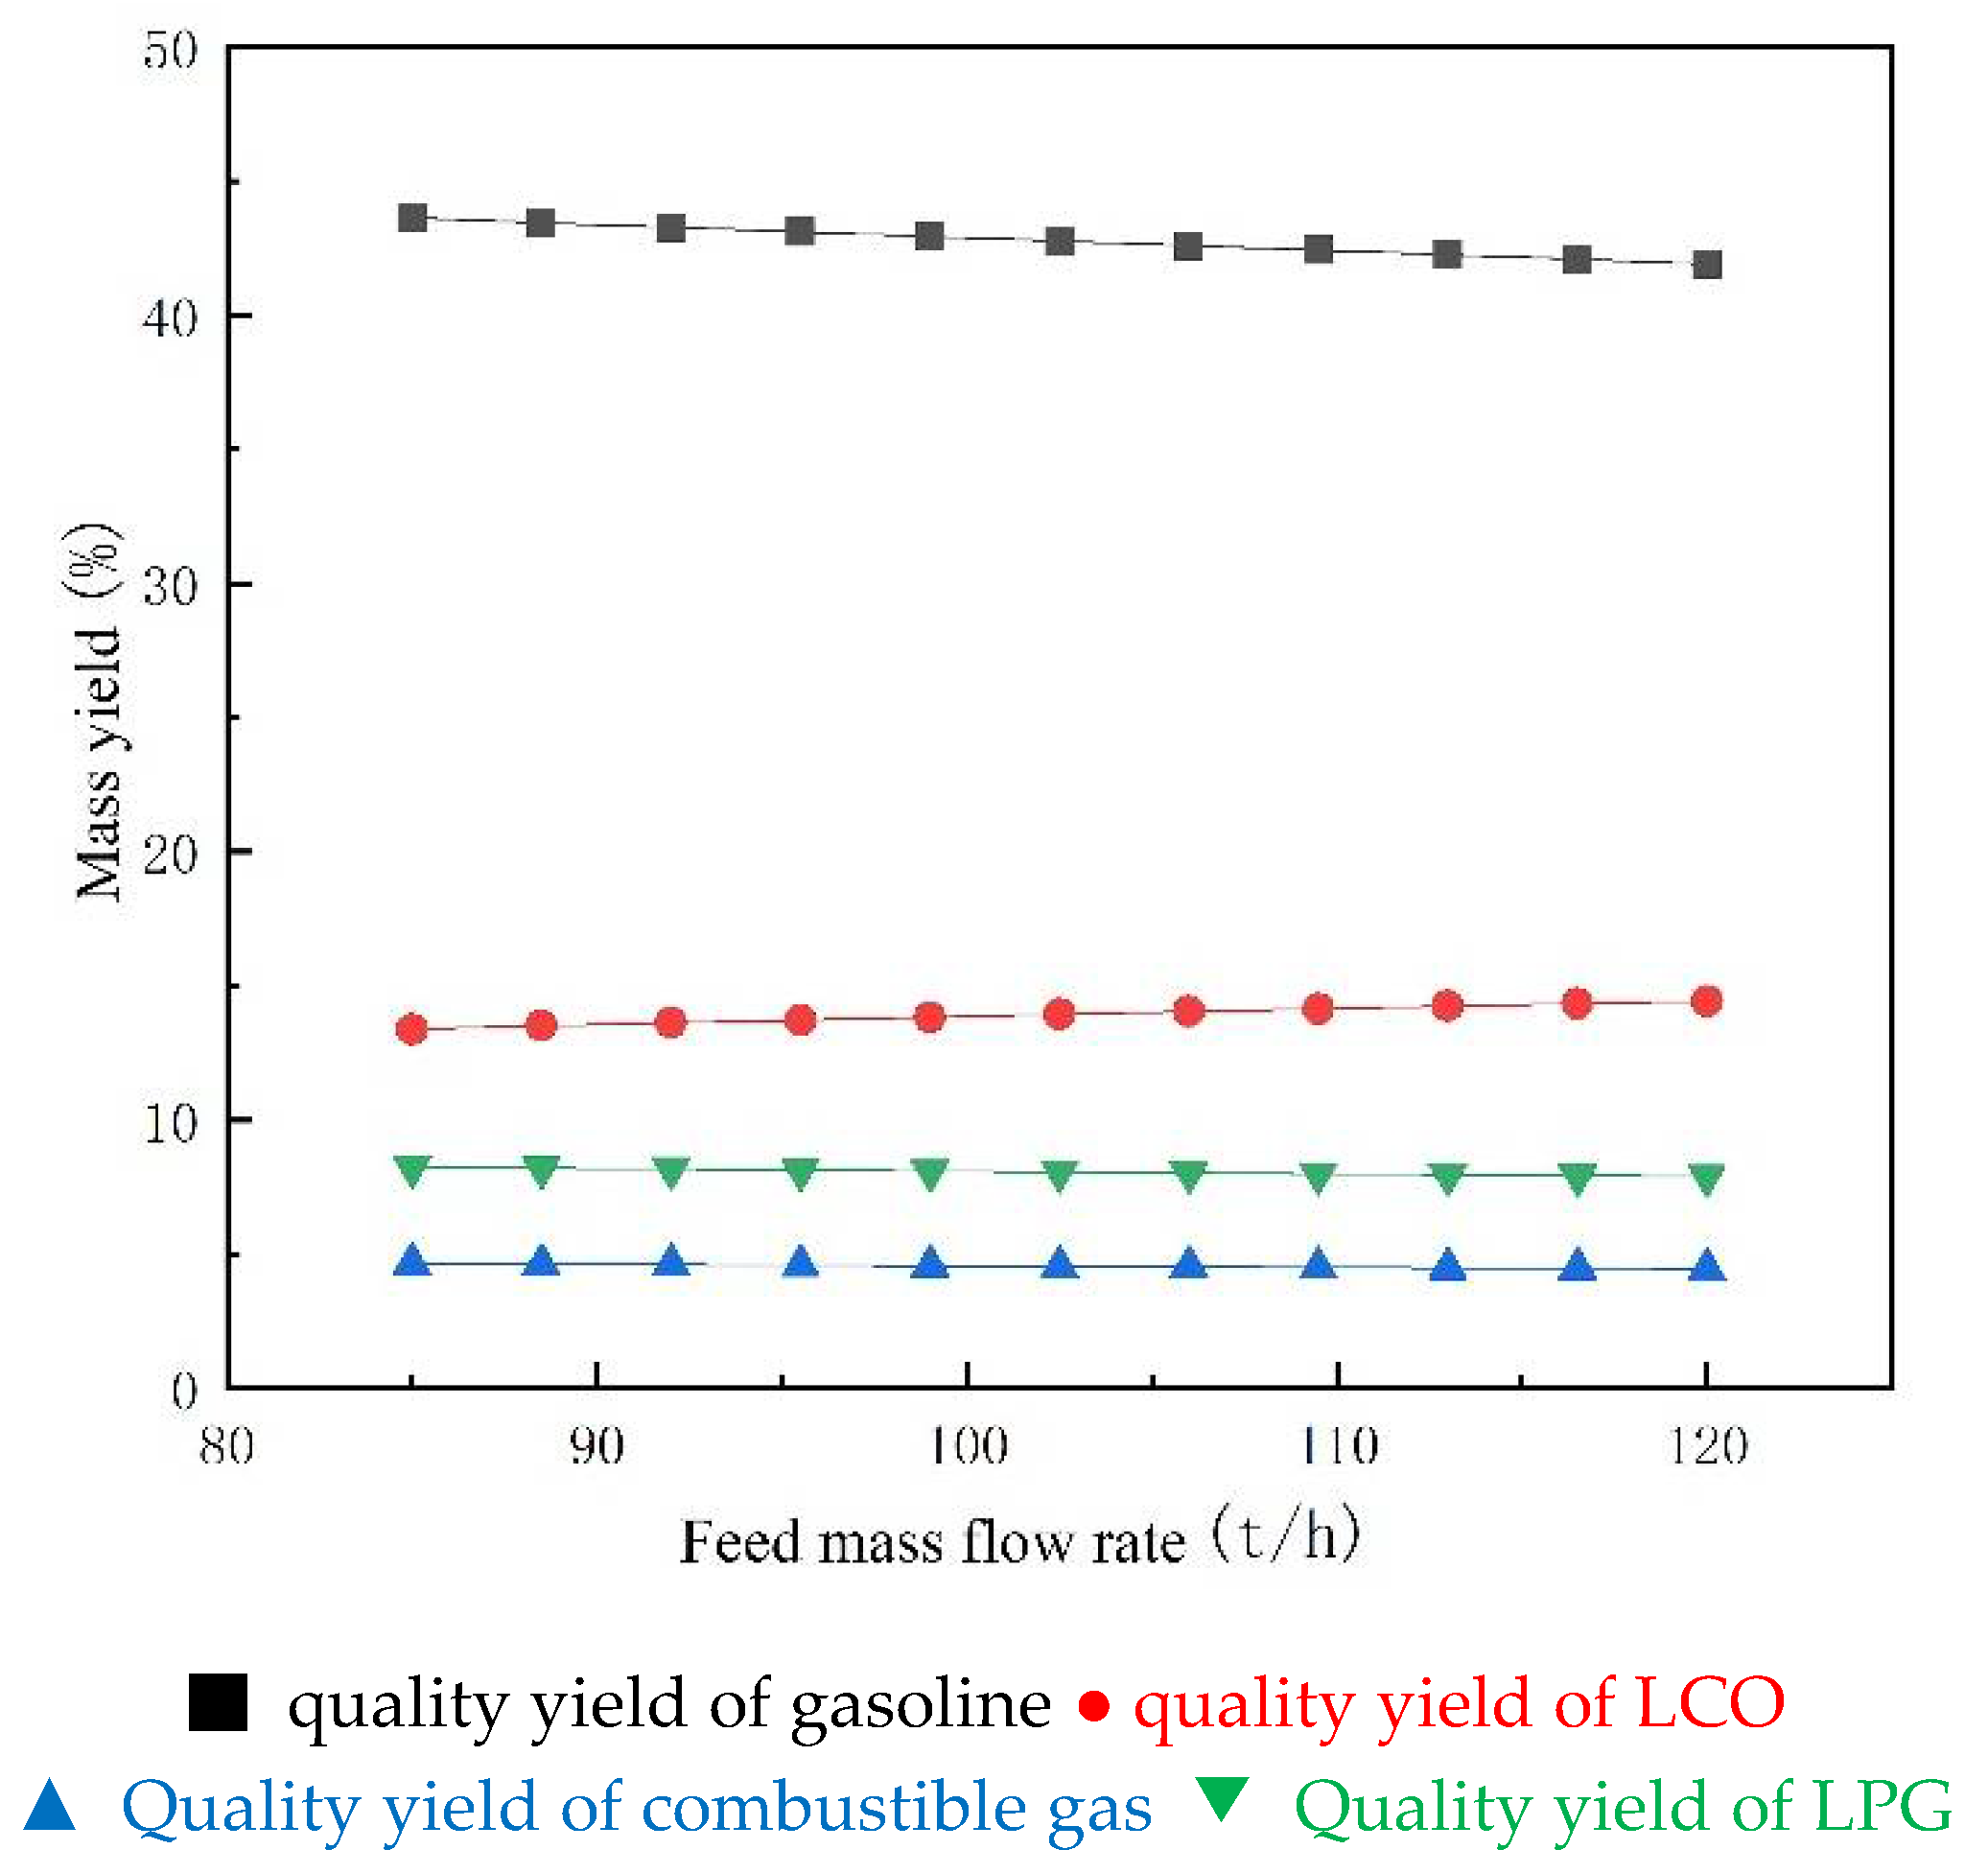
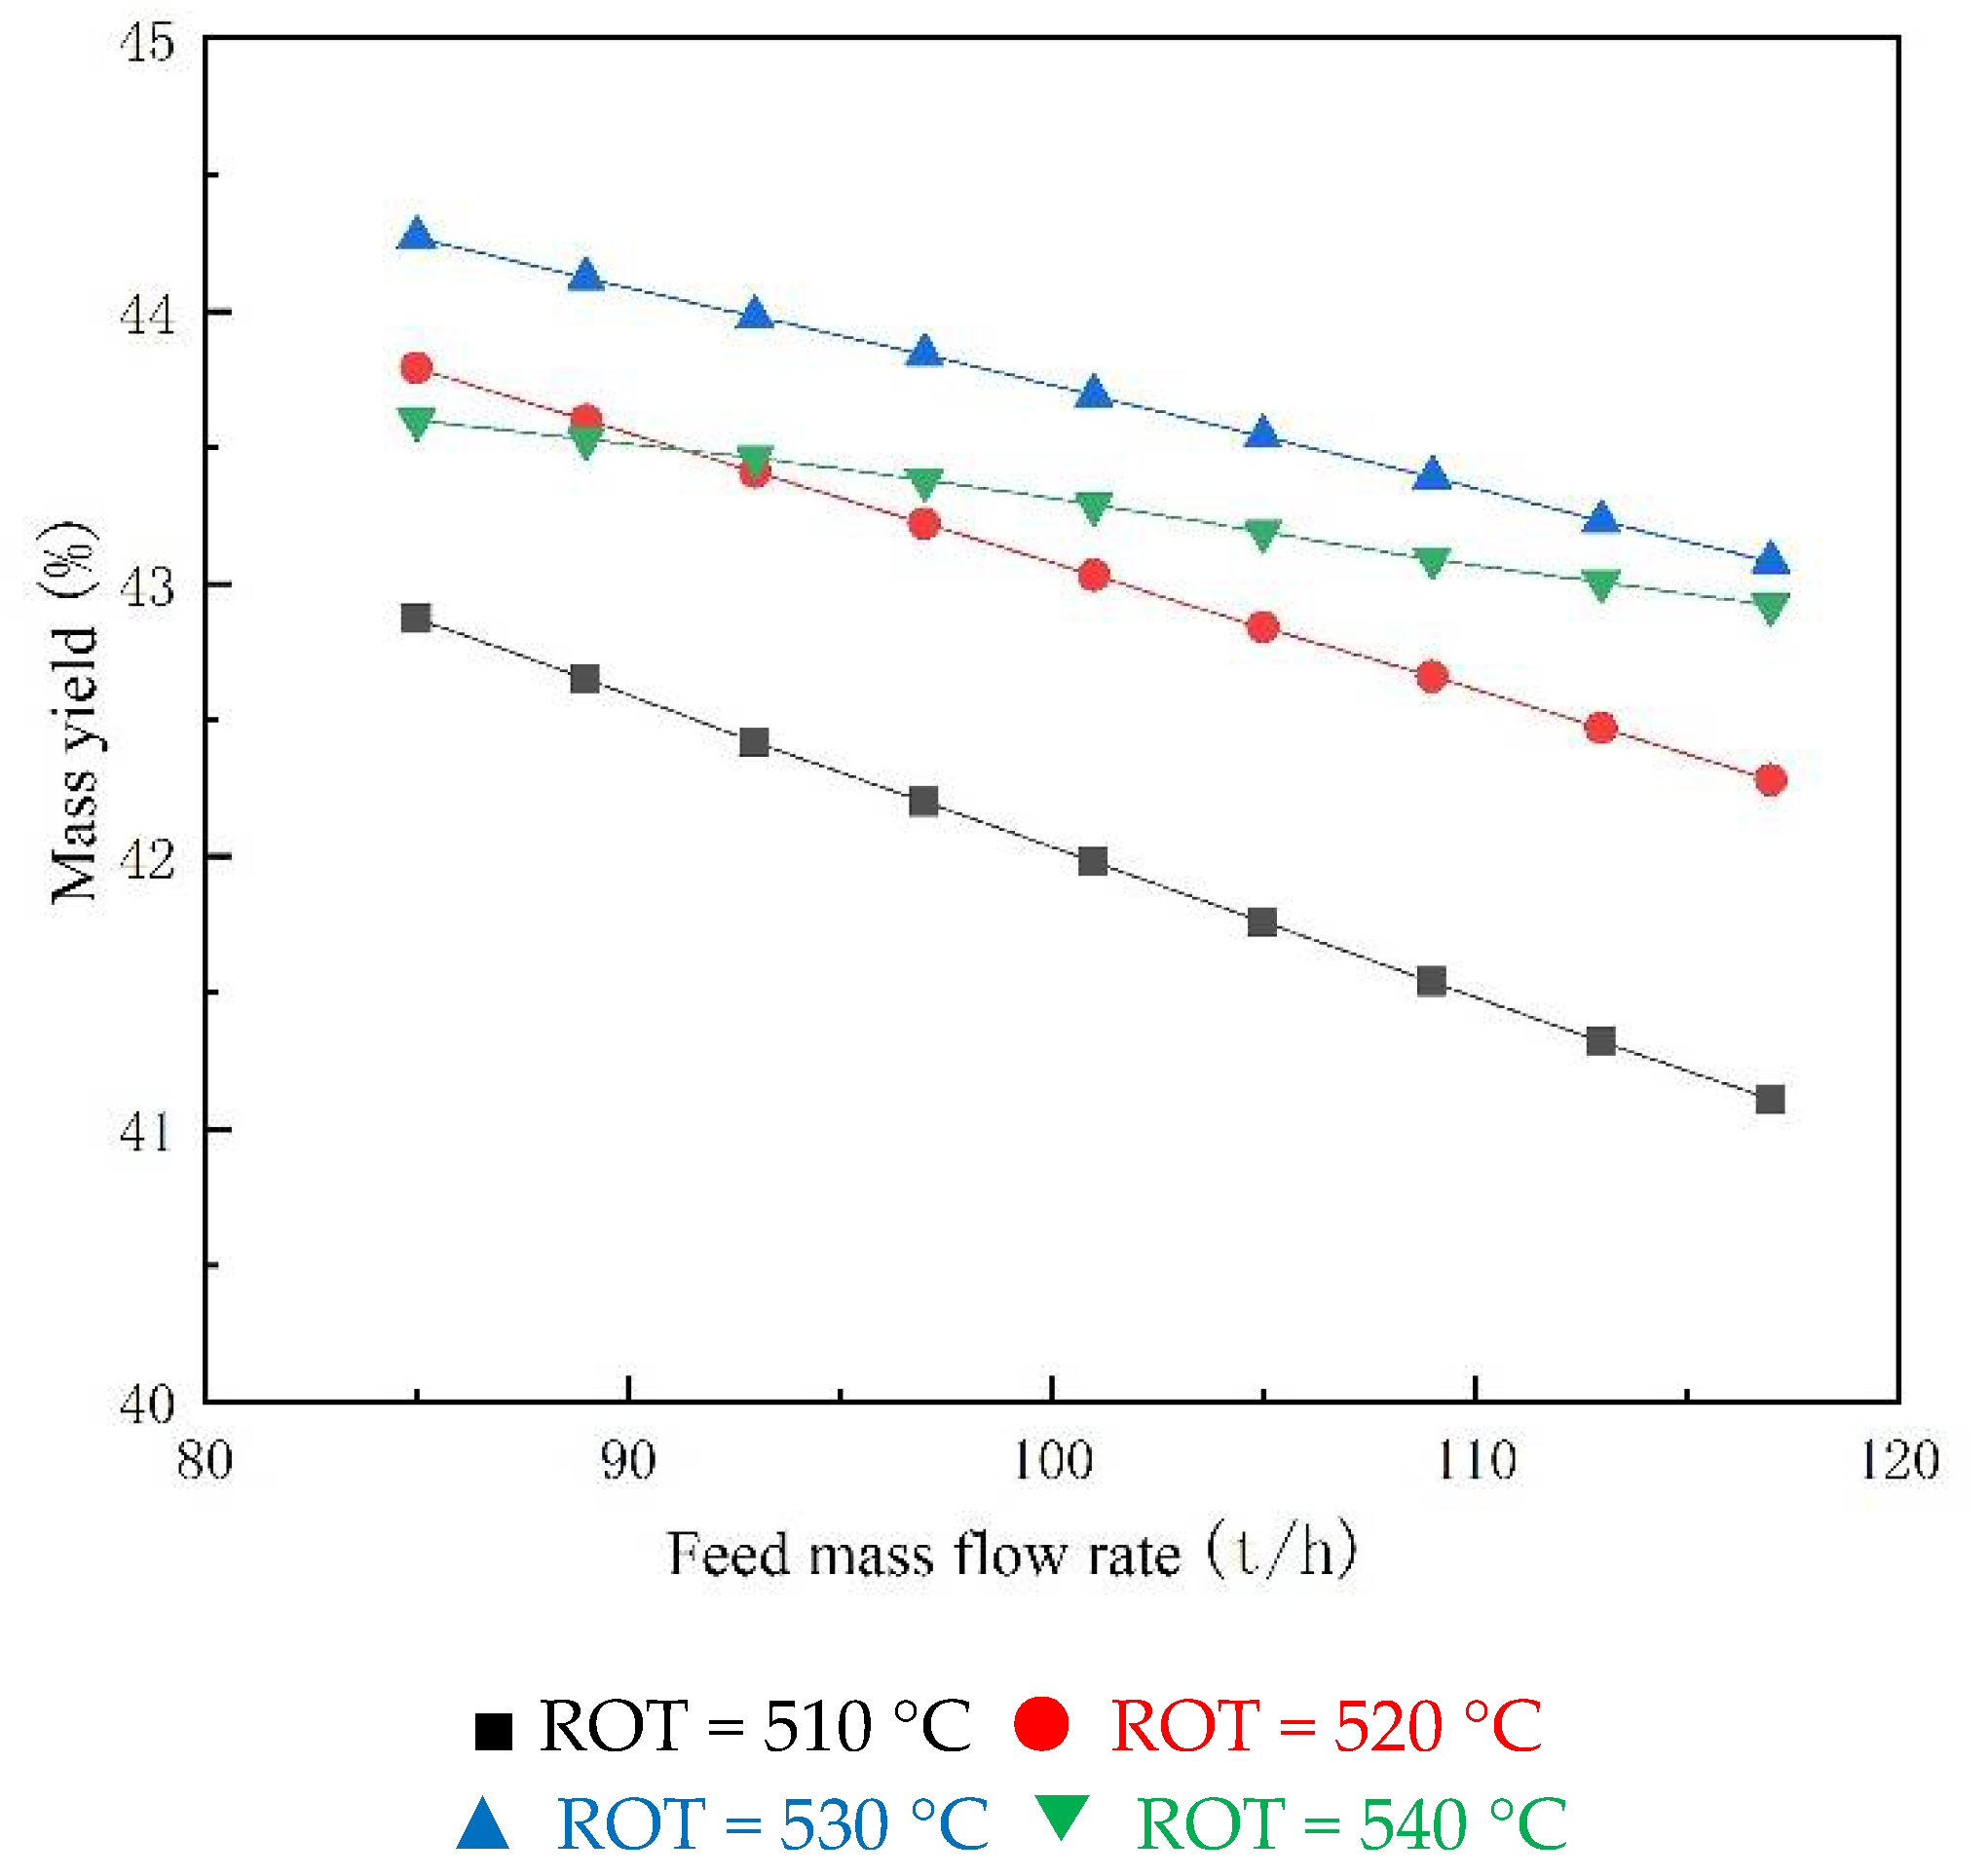
3.5. Optimization of Increasing the Capacity of the Unit

Refineries usually want to process more feedstocks as much as possible. Ideally, they want the quality and yield of high value-added products (such as gasoline) to be stable at a certain level [28]. The relationship between gasoline yield and unit feed is shown in Figure 5. The gasoline yield decreased linearly with the increase of feed. The increase in feed volume leads to a shorter contact time with the catalyst, which reduces the cracking of the components and thus reduces the gasoline yield.
We consider a production plan that can increase or stabilize the gasoline yield relative to the capacity of the basic unit. We increase the ROT and the feed volume of the unit. As shown in Figure 6, we can see that gasoline yield also increases as the ROT increases. However, when the ROT reaches 540 °C, the gasoline yield will decrease rapidly due to over-cracking. When the ROT is 530 °C, we can ensure the gasoline yield and increase the feed rate to achieve a higher gasoline production by up to 14.3%. The refinery can adjust operating parameters according to the pattern shown to achieve a production solution that increases output and improves or stabilizes gasoline yields.

4. Conclusions

In this paper, we use Aspen HYSYS to model the entire process mechanism of a FCC unit and compare actual and simulated data to verify the accuracy of the model. At the same time, we conducted a study on operating parameters optimization to increase the yield of the main products and increase the production capacity. Moreover, we obtained the optimized control range of the ROT with the relevant products as the main output. To increase the total yield of gasoline and LPG, ROT should be within 535~545 °C; for gasoline and diesel, ROT should be within 510~520 °C. To increase gasoline yield and output at the same time, ROT needs to be adjusted to 350 °C. Through this research, a reliable refinery process model has been established and can provide a reliable guiding basis for the actual control and planning of the refinery.

Author Contributions

Conceptualization, Y.Z.; methodology, Q.J.; software, Y.Z.; validation, Z.W., Z.L.; formal analysis, Y.Z.; investigation, Z.L.; resources, Y.Z.; data curation, Z.L.; writing—original draft preparation, Z.L.; writing—review and editing, Z.L.; visualization, Z.W.; supervision, Q.J.; project administration, Q.J. All authors have read and agreed to the published version of the manuscript.

Funding

This research received no external funding.

Institutional Review Board Statement

Not applicable.

Informed Consent Statement

Not applicable.

Data Availability Statement

Not applicable.

Conflicts of Interest

The authors declare no conflict of interest.

References

  1. Sadeghbeigi, R. Fluid Catalytic Cracking Handbook: An Expert Guide to the Practical Operation, Design, and Optimization of FCC Units, 4th ed.; Gulf Publishing Company: Houston, TX, USA, 2020. [Google Scholar] [CrossRef]
  2. Marafi, A.; Albazzaz, H.; Rana, M.S. Hydroprocessing of heavy residual oil: Opportunities and challenges. Catal. Today 2019, 329, 125–134. [Google Scholar] [CrossRef]
  3. Survey: Global Refining Industry Competes to Supply Growing Asian Market. Oil Energy Trends 2017, 42, 10–17. [CrossRef]
  4. Speight, J.G. Catalytic cracking. In The Refinery of the Future, 2nd ed.; Gulf Professional Publishing: Houston, TX, USA, 2020; pp. 197–226. [Google Scholar] [CrossRef]
  5. Gao, J.; Xu, C.; Lu, C.; Yang, C.; Wang, G.; Lan, X.; Zhang, Y. Novel Fluid Catalytic Cracking Processes; John Wiley & Sons Inc.: Hoboken, NJ, USA, 2017. [Google Scholar] [CrossRef]
  6. Fahim, M.A.; Alsahhaf, T.A.; Elkilani, A. Fluidised Catalytic Cracking. In Fundamentals of Petroleum Refining; Elsevier: Amsterdam, The Netherlands, 2010; Chapter 8; pp. 199–235. [Google Scholar] [CrossRef]
  7. Santos, P.; Van Gerven, T. Aspen Hysys—Unity Interconnection. An Approach for Rigorous Computer- Based Chemical Engineering Training. Comput. Aided Chem. Eng. 2020, 48, 2053–2058. [Google Scholar] [CrossRef]
  8. Arbel, A.; Huang, Z.; Rinard, I.H.; Shinnar, R.; Sapre, A.V. Dynamic and Control of Fluidized Catalytic Crackers. 1. Modeling of the Current Generation of FCC’s. Ind. Eng. Chem. Res. 1995, 34, 1228–1243. [Google Scholar] [CrossRef]
  9. McFarlane, R.; Reineman, R.; Bartee, J.; Georgakis, C. Dynamic simulator for a Model IV fluid catalytic cracking unit. Comput. Chem. Eng. 1993, 17, 275–300. [Google Scholar] [CrossRef]
  10. Alshamsi, A.H. Modeling and optimization of fluid catalytic cracking riser. In Proceedings of the 2013 International Conference on Industrial Engineering and Systems Management (IESM), Rabat, Morocco, 28–30 October 2013; pp. 1–5. [Google Scholar]
  11. Stratiev, D.; Argirov, G.; Jelyaskova, M. Effect of Lukoil Neftochim Bourgas FCC Unit Revamp to Vortex Separation System Riser on the Unit Performance. Oil Gas Eur. Mag. 2005, 121, 7–10. [Google Scholar]
  12. Yong, L.; Zhimin, W.; Zhipeng, Q.; Huan, W.; Huaxing, D. Study on getting high gas energy yield by biomass catalytic cracking. In Proceedings of the 2011 International Conference on Electric Information and Control Engineering, Wuhan, China, 15–17 April 2011; pp. 2675–2678. [Google Scholar] [CrossRef]
  13. Wallin, G.; Gilbert, L.; Zhukau, Y.; Diabat, A. A mathematical programming approach to maximizing profit in residual catalytic cracking through altering the use of the catalyst. In Proceedings of the 2013 International Conference on Industrial Engineering and Systems Management (IESM), Rabat, Morocco, 28–30 October 2013; pp. 1–5. [Google Scholar]
  14. Chen, J.W.; Xu, Y.H. Catalytic Cracking Process and Engineering; China Petrochemical Press: Beijing, China, 2005. [Google Scholar]
  15. Hamid, M.K.A. HYSYS: An Introduction to Chemical Engineering Simulation for UTM Degree++ Program. Simulation. 2007. Available online: http://eprints.utm.my/id/eprint/3030/2/HYSYS_for_UTM_Degree++_Program.pdf (accessed on 4 August 2015).
  16. Pashikanti, K.; Liu, Y.A. Predictive Modeling of Large-Scale Integrated Refinery Reaction and Fractionation Systems from Plant Data. Part 2: Fluid Catalytic Cracking (FCC) Process. Energy Fuels 2011, 25, 5298–5319. [Google Scholar] [CrossRef]
  17. AspenTech. Aspen RefSYS Option Guide; AspenTech: Cambridge, MA, USA, 2006. [Google Scholar]
  18. AspenTech. Aspen Plus FCC User’s Guide; AspenTech: Cambridge, MA, USA, 2006. [Google Scholar]
  19. Hanyak, M.E., Jr. Chemical Process Simulation and Aspen HYSYS Software; Department of Chemical Engineering, Bucknell University: Cranbury, NJ, USA, 2012. [Google Scholar]
  20. Iancu, M.; Agachi, P. Optimal Process Control and Operation of an Industrial Heat Integrated Fluid Catalytic Cracking Plant Using Model Predictive Control. Comput. Aided Chem. Eng. 2010, 28, 505–510. [Google Scholar] [CrossRef]
  21. Ahmmed, S.I.; Aref, W. HYSYS Software for Chemical and Petroleum Engineering; LAP LAMBERT Academic Publishing: Saarbrucken, Germany, 2014. [Google Scholar]
  22. Al-Malah, K.I. Aspen Plus: Chemical Engineering Applications; John Wiley & Sons: Hoboken, NJ, USA, 2016. [Google Scholar] [CrossRef]
  23. Raseev, S. Thermal and Catalytic Processes in Petroleum Refining; CRC Press: Boca Raton, FL, USA, 2003. [Google Scholar] [CrossRef]
  24. Habib, E.T.; Zhao, X.; Yaluris, G.; Cheng, W.C.; Boock, L.T.; Gilson, J.P. Advances in Fluid Catalytic Cracking. In Zeolites for Cleaner Technologies; Michel, G., Jean-Pierre, G., Eds.; Imperial College Press: London, UK, 2002; Volume 3, pp. 105–130. [Google Scholar] [CrossRef]
  25. Chang, A.-F.; Pashikanti, K.; Liu, Y.A. Refinery Engineering: Integrated Process Modeling and Optimization. In Refinery Engineering: Integrated Process Modeling and Optimization; John Wiley & Sons: Hoboken, NJ, USA, 2013. [Google Scholar] [CrossRef]
  26. Coker, A.K. Petroleum Refining Design and Applications Handbook Volume 1; Scrivener-Wiley: Beverly, MA, USA, 2018. [Google Scholar]
  27. Zhang, K.W.; Wang, J.J.; Yi, Y.H. Analysis of 100 Typical Faults in Catalytic Cracking; China Petrochemical Press: Beijing, China, 2020. [Google Scholar]
  28. John, Y.M.; Patel, R.; Mujtaba, I.M. Maximization of Gasoline in an Industrial FCC Unit. Energy Fuels 2017, 31, 5645–5661. [Google Scholar] [CrossRef]
Figure 1. The FCC process diagram.
Processes 09 01497 g001
Figure 2. HYSYS process simulation diagram.
Processes 09 01497 g002
Figure 3. Comparison of the product D1160 distillation data (a) Stable gasoline distillation data; (b) Crude gasoline distillation data; (c) Light diesel distillation data; (d) Deethanized gasoline distillation data.
Processes 09 01497 g003
Figure 4. Effect of ROT on product yield (a) Gasoline yield; (b) Coke yield; (c) Important products; (d) Combined important products.
Processes 09 01497 g004
Figure 5. Effect of feed mass flow rate on yield of important products.
Processes 09 01497 g005
Figure 6. Effect of feed rate on gasoline yield at different temperatures.
Processes 09 01497 g006
Table 1. Comparison of calibration yield and simulation yield.
Product NameCalibration Yield (%)Simulation Yield (%)Deviance
LPG22.3180.19
gasoline37.440.60.09
light diesel oil21.3230.08
dry gas3.55.50.57
slurry8.54.60.46
Table 2. Comparison of design value and simulation value of operation parameters.
ProjectUnitDesign Control ScopeSimulation Value
Settler pressureMpa0.218~0.3180.300
Riser outlet temperature°C475~535518
Preheating temperature of feed oil°C170~240175
Regenerator top pressureMpa0.248~0.3480.348
Regeneration dense phase temperature°C660~720680
Regenerator dense reservoirt45~15080
Fractionator bottom temperature°C320~350349.8
Fractionator top temperature°C105~130119.7
Top pressure of stabilizerMpa≯1.051.17
Analysis of tower top pressureMpa1.2~1.51.266
Reabsorber top pressureMpa1.1~1.41.200
Stabilizer bottom temperature°C150~190157.5
Bottom temperature of analytical tower°C95~135115
Absorber top pressureMpa1.1~1.41.3
Publisher’s Note: MDPI stays neutral with regard to jurisdictional claims in published maps and institutional affiliations.

