Article

RSM-Based Preparation and Photoelectrocatalytic Performance Study of RGO/TiO2 NTs Photoelectrode

School of Food Science and Engineering, Harbin University of Commerce, Harbin 150028, China
*
Author to whom correspondence should be addressed.
Processes 2021, 9(9), 1492; https://doi.org/10.3390/pr9091492
Submission received: 28 July 2021 / Revised: 15 August 2021 / Accepted: 16 August 2021 / Published: 25 August 2021
(This article belongs to the Special Issue Functional Nanofibrous Membrane for Environmental Remediation)

Abstract

:
In this paper, reduced graphene oxide (RGO) was prepared by a modified Hummers method and chemical reduction method, and an RGO/TiO2 NTs (RGO/TiO2 nanotubes) photoelectrode was prepared by the electrochemical deposition method. The as-prepared RGO/TiO2 NTs were analyzed by scanning electron microscopy (SEM) and X-ray diffraction (XRD), and their photocatalytic activities were investigated by measuring the degradation of methylene blue (MB) under simulated solar light irradiation. The SEM and XRD results indicated that the original tubular structure of TiO2-NTs was not changed after RGO modification. The surface of the TiO2 NTs photoelectrode was covered with a non-uniform, flake-shaped reduced graphene oxide film. The thickness of the RGO/TiO2 NTs was increased to about 22.60 nm. The impedance of the RGO/TiO2 NTs was smaller than that of the TiO2 NT photoelectrode. The optimal preparation conditions of RGO/TiO2 NT photoelectrodes were investigated by using a single factor method and response surface method. The best preparation conditions were as follows: deposition potential at 1.19 V, deposition time of 10.27 min, and deposition temperature at 24.94 °C.

1. Introduction

In recent years, the discharge of a large amount of dye wastewater has caused a huge threat to the environment, due to the toxicity, mutagenicity and carcinogenicity of dyes [1,2]. Among various dyes, methylene blue is one of the most common pollutants to prevent wastewater [3]. In terms of ecological environment, MB blocks sunlight from penetrating the water body, thereby posing a threat to aquatic life; in terms of public health, MB may burn eyes and cause irreversible damage [4]. Therefore, it is extremely necessary to remove dyes in wastewater. Commonly used methods for removing dyes include biosorption, electrocoagulation, redox, photocatalysis, etc. [5,6,7,8,9]. Photoelectrocatalysis (PEC) is an electrochemical advanced oxidation process (EAOP) combining photocatalysis with electrolysis [10]. Considering the renewable source of solar energy, research on photocatalysis has been rapidly expanding in recent years [11]. However, compared with photocatalysis, PEC can effectively solve the problem of the recombination of photogenerated electron–hole pairs in photocatalysis, so it has been widely used in the removal of pollutants in wastewater in recent years [12,13].
In 1972, Fujishima and Honda et al. [14] found that water could be decomposed into H2 and O2 by the TiO2 photoelectrode under light conditions. Since then, TiO2 has been thought to be an ideal semiconductor close to photocatalysis due to its high stability, low cost, harmlessness, high electron mobility, and excellent photoactivity [15,16,17]. However, TiO2 has a wide band gap (3.0~3.2 eV) [18]. Therefore, it is slightly difficult to use sunlight as an external light source for catalytic titanium dioxide. This limitation can be overcome by changing the form of titanium dioxide or doping with other materials. TiO2 nanotubes have been proven to have great research potential in photoelectric decomposition, optoelectronics, photocatalysis, and sensors [19,20,21,22,23,24]. Compared with all other forms of TiO2, TiO2 nanotubes show higher stability in morphology, structure, and photoelectric degradation performance [25,26]. In order to improve the photoelectric catalytic activity of TiO2, researchers have carried out a large number of modification studies. The main methods include non-metallic element doping, precious metal deposition, and semiconductor compounding. Dandan Cao et al. [27] synthesized Ag-AgBr nanospheres on the tubular surface of TiO2 nanotube arrays (TiO2 NTA/Ag-AgBr). Due to the sensitization of Ag-AgBr nanospheres, the visible light response region was significantly extended and the photoelectric conversion activity was improved. The visible photovoltage and transient photocurrent density of the TiO2 NTA/Ag-AgBr (0.025) photoelectrode were −0.17 volts and 0.12 mA/cm2. Maryline et al. [28] prepared RGO/TiO2 nanofibers as photocatalytic materials and used the degradation rate of methyl orange to observe its catalytic efficiency. The results showed that the reaction rate of RGO/TiO2 (2 wt.%) nanofibers was significantly higher than that of commercial TiO2-P25. Yuyuan Zhang et al. [29] introduced visible light-activated cadmium sulfide flowers onto the titanium dioxide nanotube array film on the titanium foil substrate to effectively separate the photo-excited electron-hole pairs and to improve the photocatalytic efficiency and water splitting in photoelectrochemical conversion, and the yield of hydrogen production. The excellent enhancement effect of graphene oxide nanosheets on the photocatalytic performance of TiO2 was attributed to its thin two-dimensional sheet support, large specific surface area, greatly increased adsorption capacity, and a good electron acceptor favoring the transfer of photo-generated electrons from the conduction band of TiO2 to the graphene oxide sheet [30,31,32]. The above qualities make graphene oxide nanosheets one of the candidate materials in the effort to improve the catalytic activity of titanium dioxide [33].
Response surface methodology (RSM) comprises a set of mathematical and statistical techniques based on polynomial equation fitting with experimental data, which describes the behavior of data sets and aims at statistical prediction. It is suitable for optimizing system performance when one or more responses are affected by several variables [34]. Box and Behnken et al. [35] suggested how to select points from a three-level factorial arrangement, which allows the efficient estimation of the first- and second-order coefficients of the mathematical model. These designs are more efficient and economical, particularly for a large number of variables.
In order to improve the visible light photocatalytic activity of TiO2 NT photoelectrode, RGO was loaded onto the electrode. Due to the strong carrier mobility, optical transparency, and flexibility of sp2 hybrid graphene, it is currently used in many fields, such as photocatalysis, sensors, and solar materials. In this experiment, the response surface experiment was designed. RGO was deposited onto TiO2 NTs by the electrochemical deposition method, and the samples were analyzed by SEM, EDS, XRD, and Raman. The photoelectrocatalytic properties of RGO/TiO2 NTs photoelectrode materials under external light were studied, which can provide a reference for the preparation of high-performance photoelectrocatalytic materials.
The purpose of this study is to deposit RGO onto TiO2 NTs by electrochemical deposition, and to study the effect of active free radicals on the photocatalytic oxidation reaction and the stability of the photoelectrode. The specific objectives are as follows: (1) to prepare TiO2 NTs photoelectrode material by anodizing method; (2) to prepare RGO by a modified Hummers method and chemical reduction method, and prepare an RGO/TiO2 NT photoelectrode by the electrochemical deposition method; (3) to optimize the RGO/TiO2 NT photoelectrode. This achievement is considered to provide a theoretical basis and reference for the preparation of high-performance catalytic materials.

2. Materials and Methods

2.1. Materials

Reagents: C, P2O5, K2S2O8, CH3COOH, KI, K2Cr2O7, KMnO4, NH3·H2O, N2H4·H2O, Na2SO4.
Instruments: Desktop high-speed centrifuge (Shanghai Luxiang Instrument Co., Ltd., Harbin, China), Raman spectrometer (HORIBA Jobin Yvon, Harbin, China).

2.2. Synthesis of RGO/TiO2 NTs

2.2.1. Synthesis of GO

Graphene oxide (GO) was prepared by a modified Hummers method. Firstly, graphite powder (1 g) was treated with 80 mL H2SO4, 1 g K2S2O4, 1 g P2O5 and slowly heated to 80 °C for 5 h. Then, a large amount of deionized water was used to wash repeatedly until it was neutral to obtain pre-graphite oxide, and the pre-oxidized graphite was dried at 6 °C for 12 h. A mixture of 40 mL H2SO4 and graphite was added to the ice water bath in the flask. Secondly, 4 g KMnO4 was slowly added to the solution, heated to 35 °C to react for 2 h. Then, deionized water was added and heated to about 98 °C. After 15 min, deionized water and 10 mL H2O2 were added and then centrifuged when the color of the solution gradually changed into golden yellow. The obtained solid was washed with dilute hydrochloric acid and deionized water to remove residual acid on the surface. Finally, the GO sample was dried by vacuum at 60 °C for 12 h.

2.2.2. Synthesis of RGO

RGO was prepared by the chemical reduction method. Graphene oxide (GO) was added to deionized water and ultrasonically treated for 1 h. Ammonia was added and the pH was adjusted to 10. A total of 250 mL hydrazine hydrate (35%) was added to the treated GO and heated at 95 °C for 4 h. The black solution was filtered, followed by washing with dilute hydrochloric acid and deionized water to remove residual acid on the surface. RGO was obtained by vacuum drying at 70 °C for 12 h.

2.2.3. Fabrication Method of RGO/TiO2 NTs

In this study, a TiO2 NT photoelectrode grown on Ti foils was prepared by the anodic oxidation method, and the synthesis progress and experiment parameters are provided in our previous papers [36]. The RGO/TiO2 NTs photoelectrode was prepared by electrochemical deposition. The electrodeposition solution was a mixture of 100 mg·L−1 RGO solution and 0.5 mol·L−1 Na2SO4. A three-electrode system was adopted with the TiO2 NTs electrode as the anode, Pt as the cathode, and SEC as the reference electrode. Electrodeposition was conducted at a certain voltage for a period of time. After the reaction was completed, the sample was repeatedly rinsed with deionized water and then vacuum dried at 70 °C for 4 h. Finally, the RGO/TiO2 NTs was obtained.

2.3. Photoelectric Catalytic Activity Tests

The photoelectric catalytic property of RGO/TiO2 NT photoelectrode was evaluated by photoelectric catalytic oxidation degradation of 5 mg/L methylene blue aqueous solution. At room temperature, 80 mL methylene blue solution was added to a 100 mL quartz beaker. The mercury lamp was used as the external light source and placed parallel to the Ti sheet, with an interval of 10 cm. The 35 W external light source and the 15 V DC regulated power supply were turned on. At regular intervals of 30 min, a 5 mL sample was taken and the absorbance was checked at 664 nm through a UV–vis spectrophotometer. The degradation efficiency (η) was calculated using the following equation:
η = C 0 C t C 0   ×   100 %
where C0 is the initial concentration of MB (mg/L) and Ct is the instantaneous concentrations (mg/L) in the solution.

2.4. Single Factor Test

Single factor test was used to design the photoelectric catalytic performance experiments of RGO/TiO2 NTs photoelectrodes. The deposition potential, deposition time, and deposition temperature were taken as research targets. The voltages were 0.6, 0.8, 1.0, 1.2, and 1.4 V, the deposition times were 4, 6, 8, 10, and 12 min, and the deposition temperatures were 15, 20, 25, 30, and 35 °C, respectively.

2.5. Response Surface Experimental Design

RSM was used to regulate and control the photoelectric catalytic performance of RGO/TiO2 NTs photoelectrodes. Box–Behnken with the software Design Expert 8.0 was employed to evaluate the combined effects of the three independent variables: deposition potential, deposition time, and deposition temperature. The coded and actual values of the three independent variables together with the responses are shown in Table 1.

3. Results and Discussion

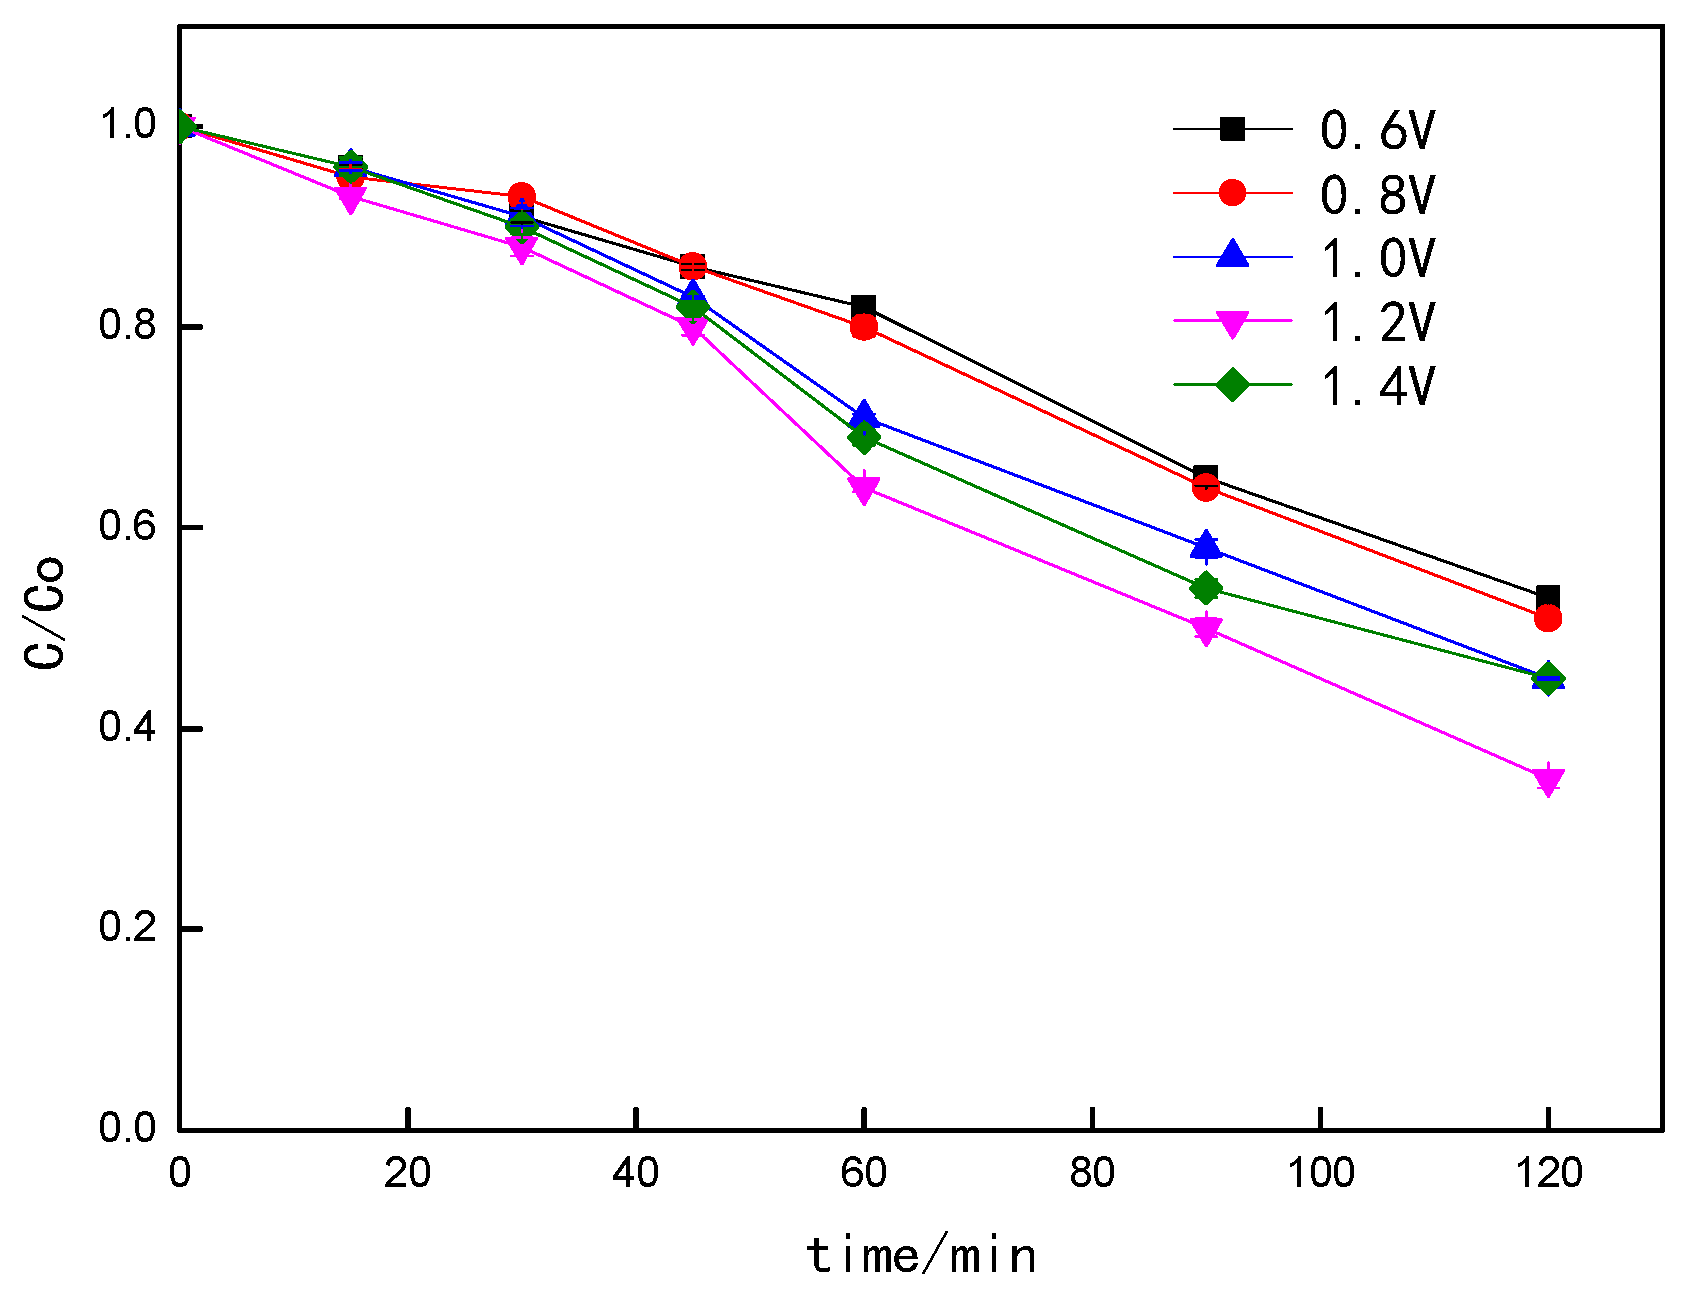
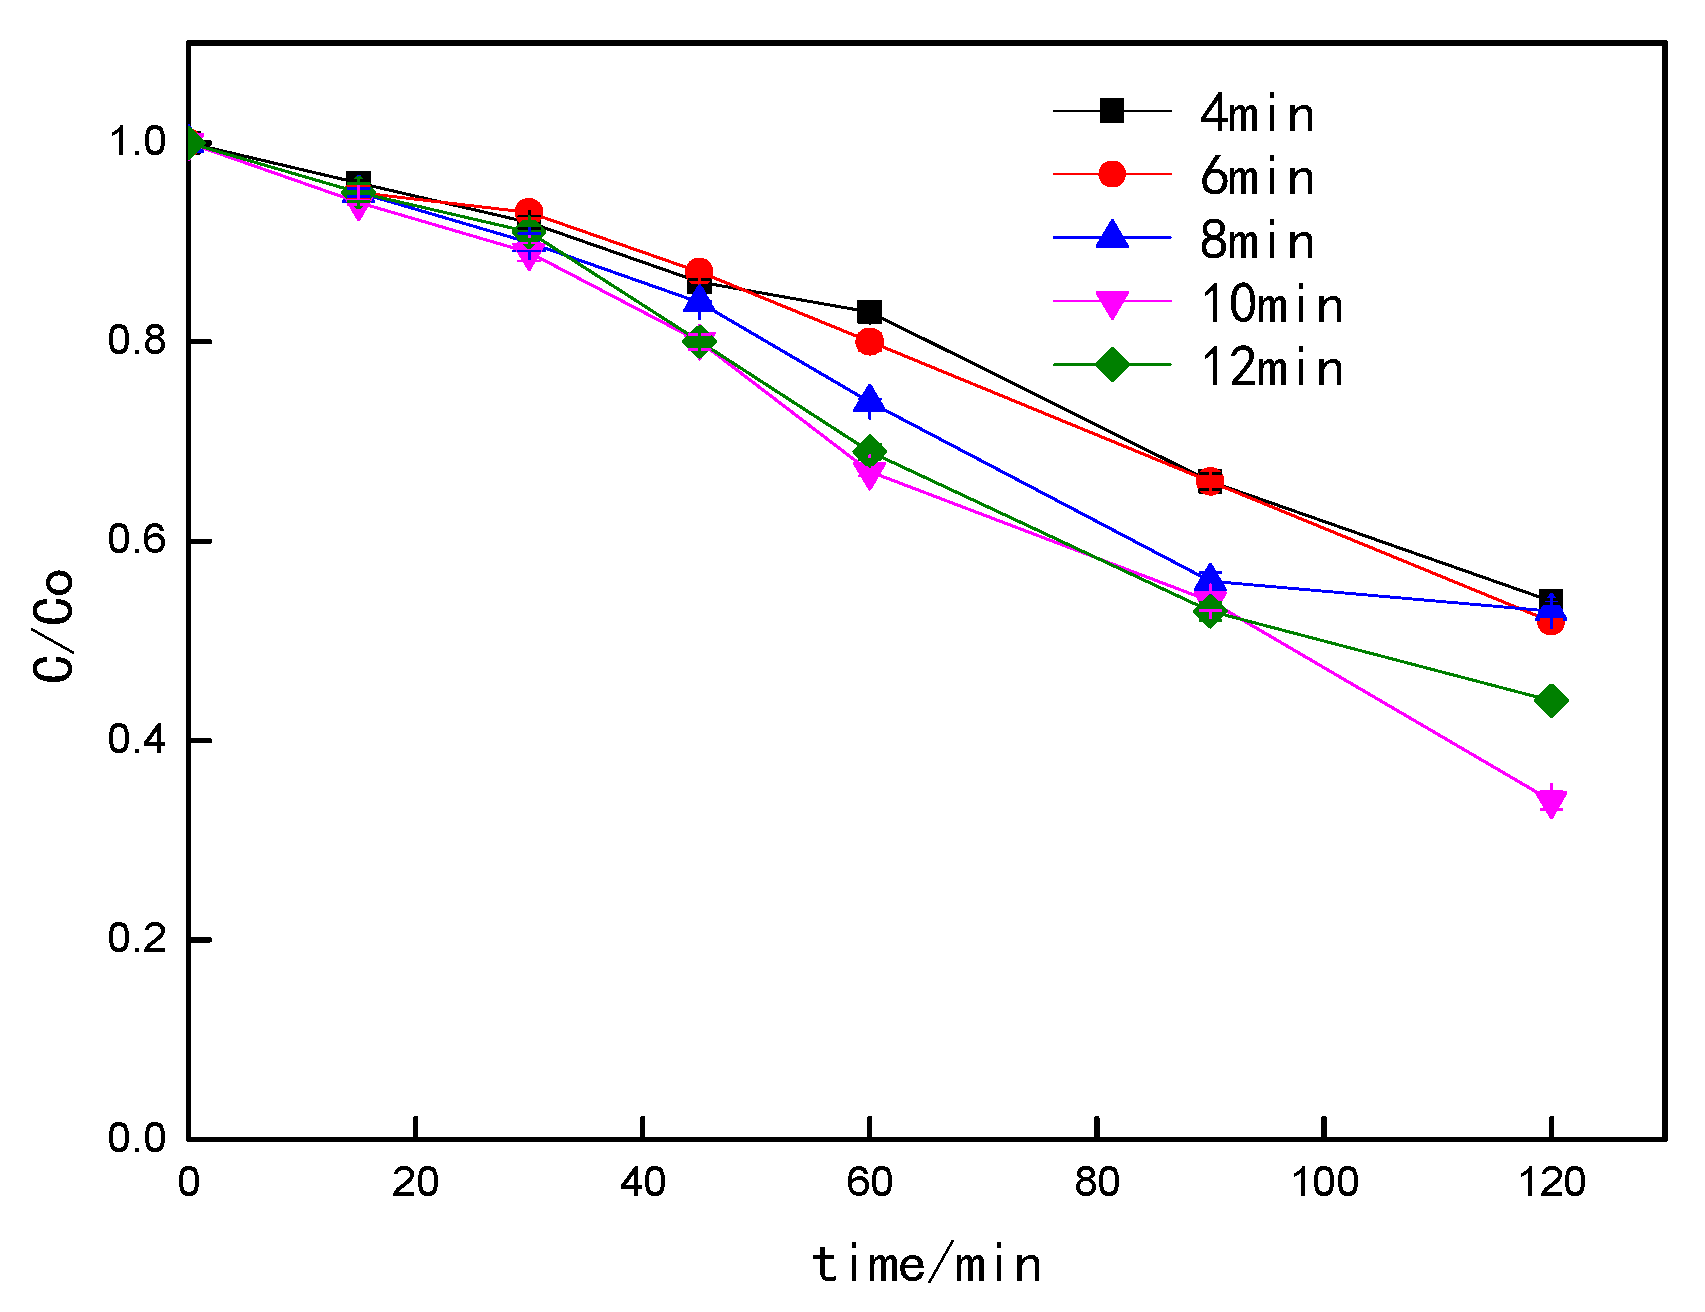
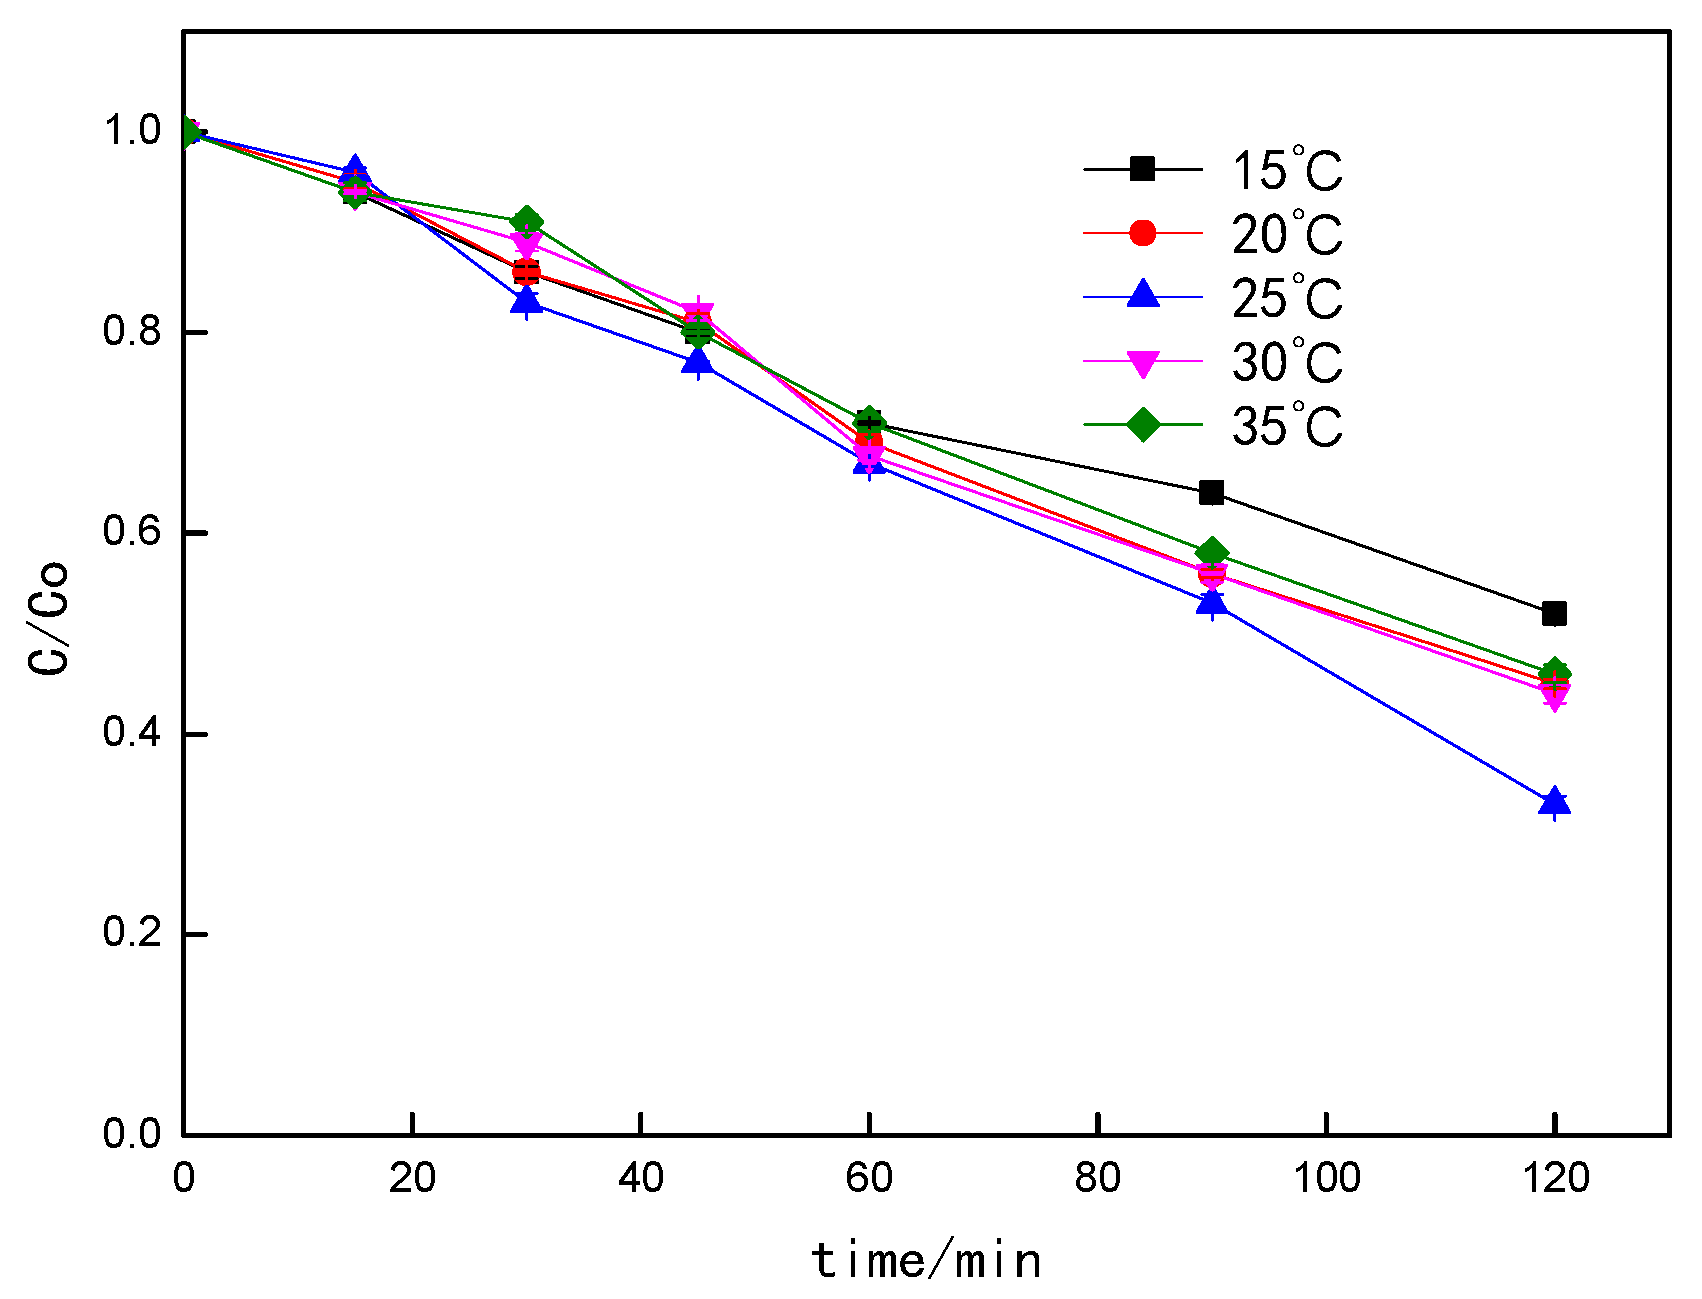
3.1. Analysis of Single Factor Test Results

The RGO/TiO2 NTs photoelectrode was prepared by depositing for 10 min with different deposition potentials and then used for photoelectric catalytic degradation of MB, as shown in Figure 1. It was found that the catalytic effect of the photoelectrode on MB was significantly improved, showing a trend of first increasing and then decreasing. When the voltage was 1.2 V, the photoelectrode had the best degradation effect on MB, and the degradation rate reached 65.7%. This may be due to the high deposition potential and to a large amount of RGO deposited on the surface of the nanotubes, which reduces the light absorption performance (Figure 1).
When the deposition potential is 1.2 V, the photoelectric catalytic degradation effect of RGO/TiO2 NTs photoelectrode on MB is studied under different times. It can be seen from Figure 2 that when the deposition time is 10 min, the photoelectric catalytic degradation effect is the best, and the MB degradation rate reaches 66.1%. However, a longer deposition time causes too much RGO to accumulate on the surface of the nanotubes, which reduces the light absorption performance, resulting in a decrease in the degradation rate of MB (Figure 2).
When the deposition potential was 1.2 V and the deposition time was 10 min, the photoelectrodes were prepared under the conditions of different deposition temperatures. As shown in Figure 3, the photoelectric catalytic performance of the photoelectrode is proportional to the deposition temperature. When the deposition temperature was 25 °C, the photoelectric catalytic performance was at its best, and the degradation rate of MB reached 66.8%. However, when the temperature rises further, the degradation of MB decreases. This may be due to a large amount of RGO accumulated on the surface of the nanotubes caused by the high temperature, which affects the photocatalytic activity (Figure 3).

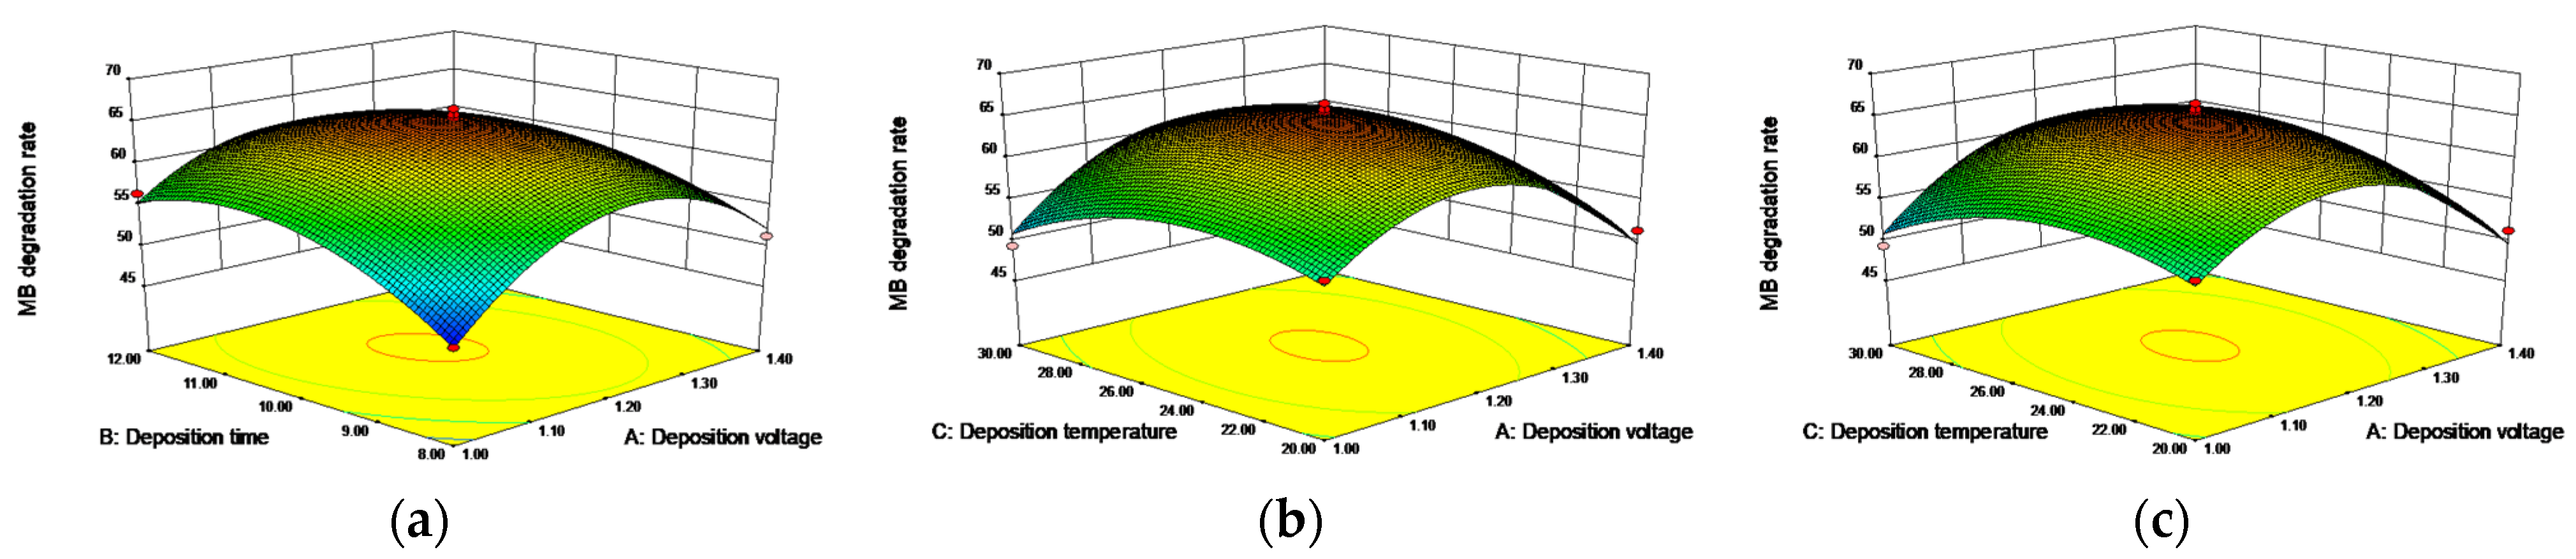
3.2. Optimization Conditions of RGO/TiO2 NTs Production

In the Equation (1), Y is the degradation rate of MB (%), and A, B, C are the code values of deposition potential, deposition time, and deposition temperature. The positive and negative signs before each item represent synergistic and antagonistic effects. The model was evaluated based on the correlation coefficient R2 The R2 of the model is 0.9761, which is close to 1, indicating that the predicted value of the model was similar to the measured value. Table 1 showed the initial conditions of fermentation and the actual and predicted responses.
Y = +65.34 − 0.39 × A + 1.26 × B + 0.20 × C − 2.53 × A × B + 1.85 × A × C − 1.65 × B × C − 8.93 × A2 − 5.13 × B2 − 4.31 × C2
In the ANOVA results of RSM, shown in Table 2, those model terms with a “p-value” less than 0.05 were significant (Table 2). The model p-value was less than 0.0001, which was extremely significant. The lack of fit was 0.0762 (>0.05), which was not significant, indicating that the model fit well within the regression area. As the F-values in Table 2 show, the order of the impact of three conditions on RGO/TiO2 NTs production was: B > A > C. Moreover, the error statistical analysis of the regression equation showed that the R2 value was 0.9454 and Radj2 was 0.6900, indicating that the 69% change in response value could be explained by the model. The precision was 15.193, more than 4, and proved reasonable; the CV was 2.64%, less than 10%, indicating the high reliability and accuracy of the test. The analysis results showed that the regression equation model was in good agreement with the actual test, which can effectively predict the test results. It is recommended to use this model to predict the optimal conditions for the preparation of RGO/TiO2 NTs.
The regression equation can be effectively represented by the response surface three-dimensional graph. The relationship between the response value of each variable and the test value is shown in Figure 4, which further evaluates the relationship between each variable and the best conditions. According to the analysis of Design Expert 8.0 software, the best preparation conditions for loading RGO onto TiO2 NTs photoelectrodes were: deposition potential at 1.19 V, deposition time of 10.27 min, and deposition temperature at 24.94 °C, and the predicted value of MB degradation rate was 65.43%. Considering the actual situation, the optimal preparation conditions were identified as: deposition potential at 1.1 V, deposition time of 10 min, and deposition temperature at 25 °C (Figure 4).
Figure 5 is the SEM image of the RGO/TiO2 NT photoelectrode under the conditions of deposition potential of 1.1 V, deposition time of 10 min, and deposition temperature of 25 °C. It can be seen from the figure that after RGO modification, the surface of the TiO2 NTs photoelectrode was covered with a sheet of RGO film, which covered most of the nanotube surface. Part of the wall of the RGO/TiO2 nanotube became thicker: measured by nano measurer 1.2.5, the wall was 22.60 nm. Therefore, the RGO/TiO2 NTs photoelectrode had a better photoelectrocatalytic performance with RGO than without it (Figure 5).
Figure 6a is the XRD diffractogram of the photoelectrode prepared under the optimal preparation conditions. Cu Kα rays (λ was 0.15418 nm), the characteristic diffraction peak of anatase phase A (101), appeared when 2θ = 25.3°, and the characteristic diffraction peak of rutile phase R (101) appeared when 2θ = 27.4°. It can be seen from the figure that there were three crystal phases at the same time, and the diffraction peak position was the same as that of TiO2 NTs. After RGO modification, the characteristic diffraction peak of graphene (002) appeared at 2θ = 24.9°, indicating that RGO had been successfully modified [37]. In order to further test whether RGO was successfully modified on the surface of the TiO2 NTs photoelectrode, Raman spectroscopy was used. In the Raman spectrum of TiO2, the Raman peaks at 148, 198, 397, 515, and 638 cm−1 correspond to the anatase-induced A1g+2B1g+3Eg mode [38]. As shown in Figure 6b, the four Raman peaks caused by RGO are located at 1365, 1585, 2749, and 2938 cm−1. This was caused by the D band related to the defects in the hexagonal graphite sheet and the G band related to the E2g mode. In addition, the G band was also related to the sp2 hybridized carbon atoms [39]. Therefore, it is further proved that RGO has been successfully modified on TiO2 NTs (Figure 6).
In order to study the performance of RGO/TiO2 NT photoelectrodes prepared under the best conditions, the photoelectrocatalytic MB (80 mL, 5 mg/L) degradation test was carried out under three different conditions, and the reaction time was 120 min. As shown in Figure 7, when the electrode was illuminated by a 35 W mercury lamp, the photocatalytic degradation rate of MB was 17.2%; when the electrode was protected from light under a 15 V bias voltage, the photocatalytic degradation efficiency of MB was 32%; when the electrode was irradiated by a 35 W mercury lamp and a 15 V bias voltage was applied, the MB degradation efficiency was significantly increased to 64% (Figure 7).
It can be seen from Figure 8 that the MB degradation rate of TiO2 NTs photoelectrode under mercury lamp irradiation is 54%, and the MB degradation rate under the catalysis of RGO/TiO2 NTs photoelectrode is 63%, indicating that the degradation efficiency of the RGO modified TiO2 NTs photoelectrode has been significantly improved (Figure 8).

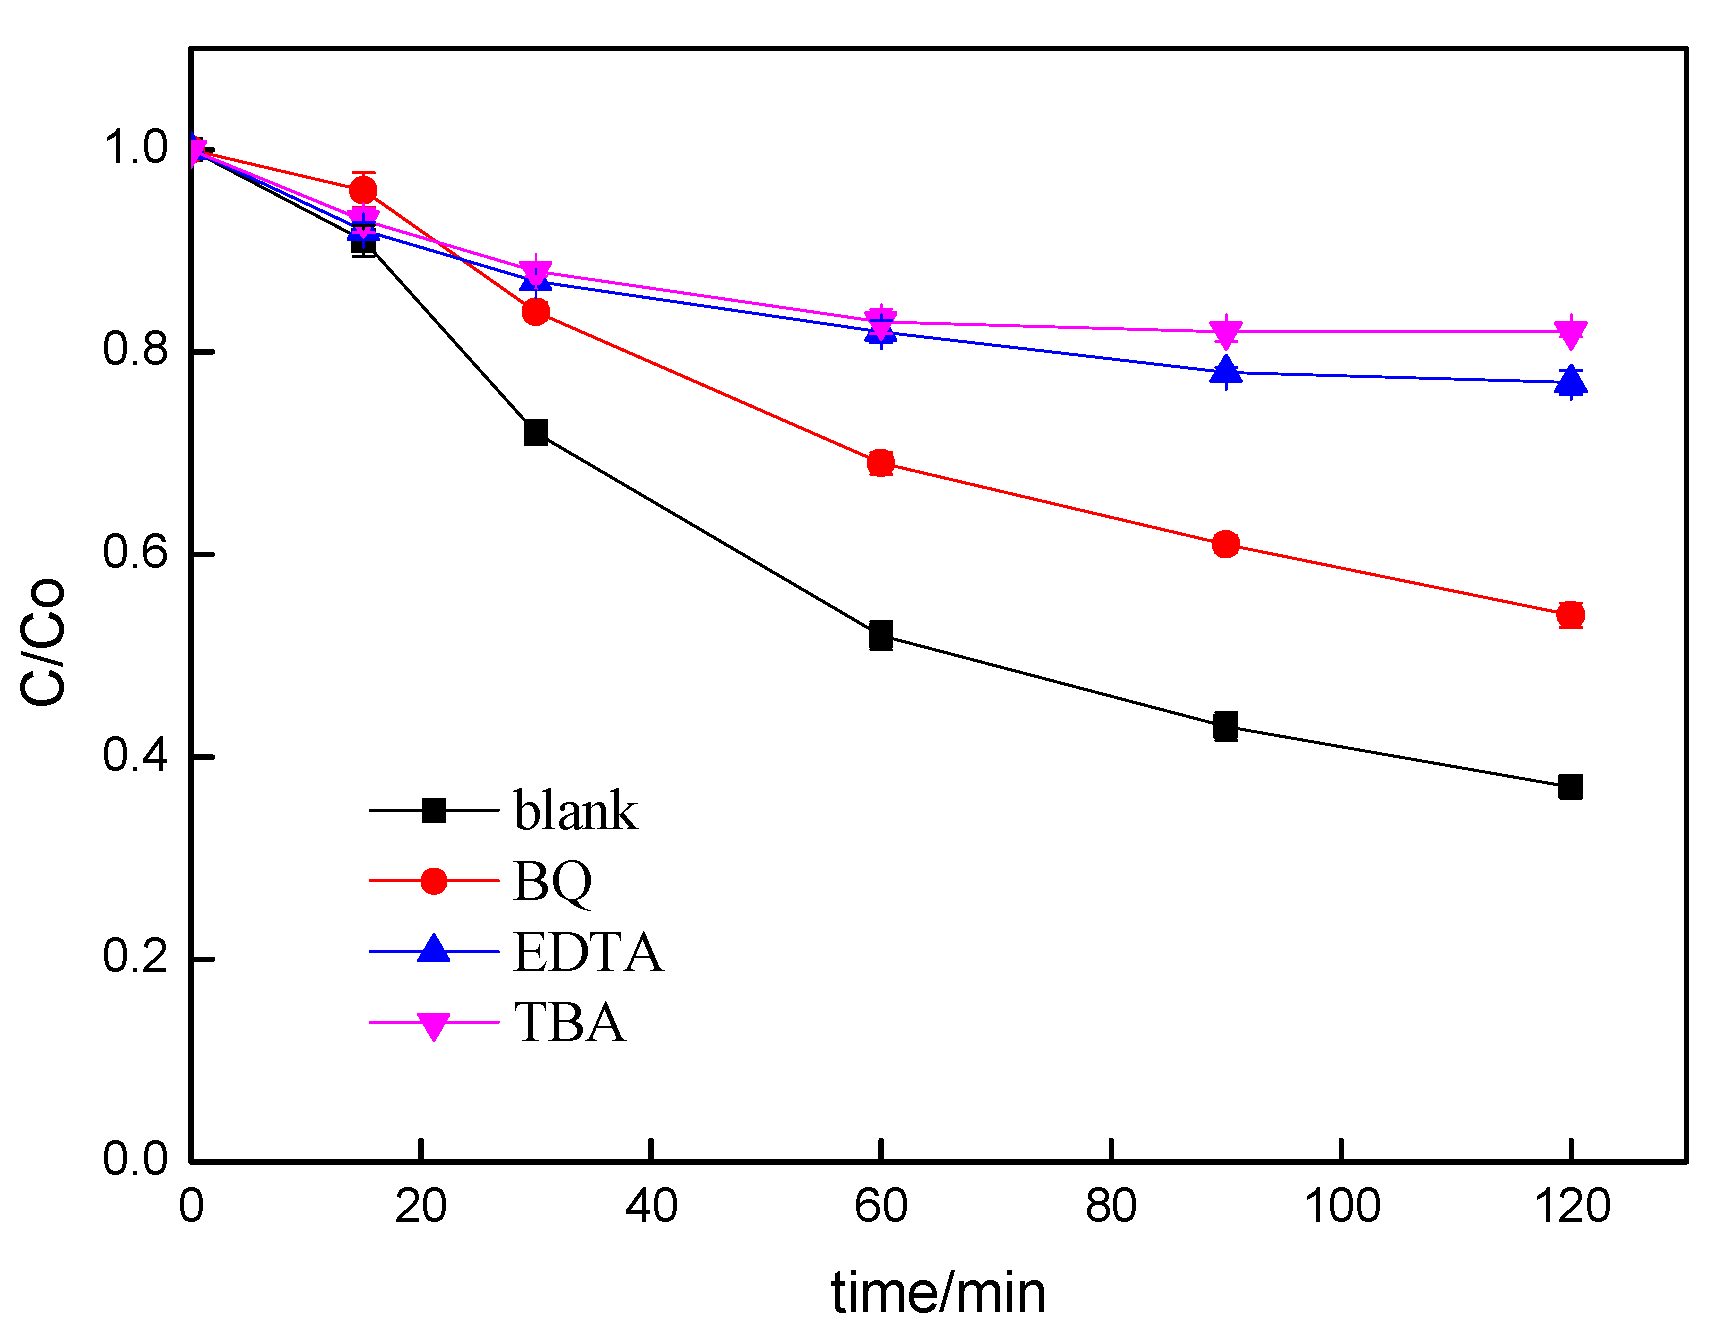
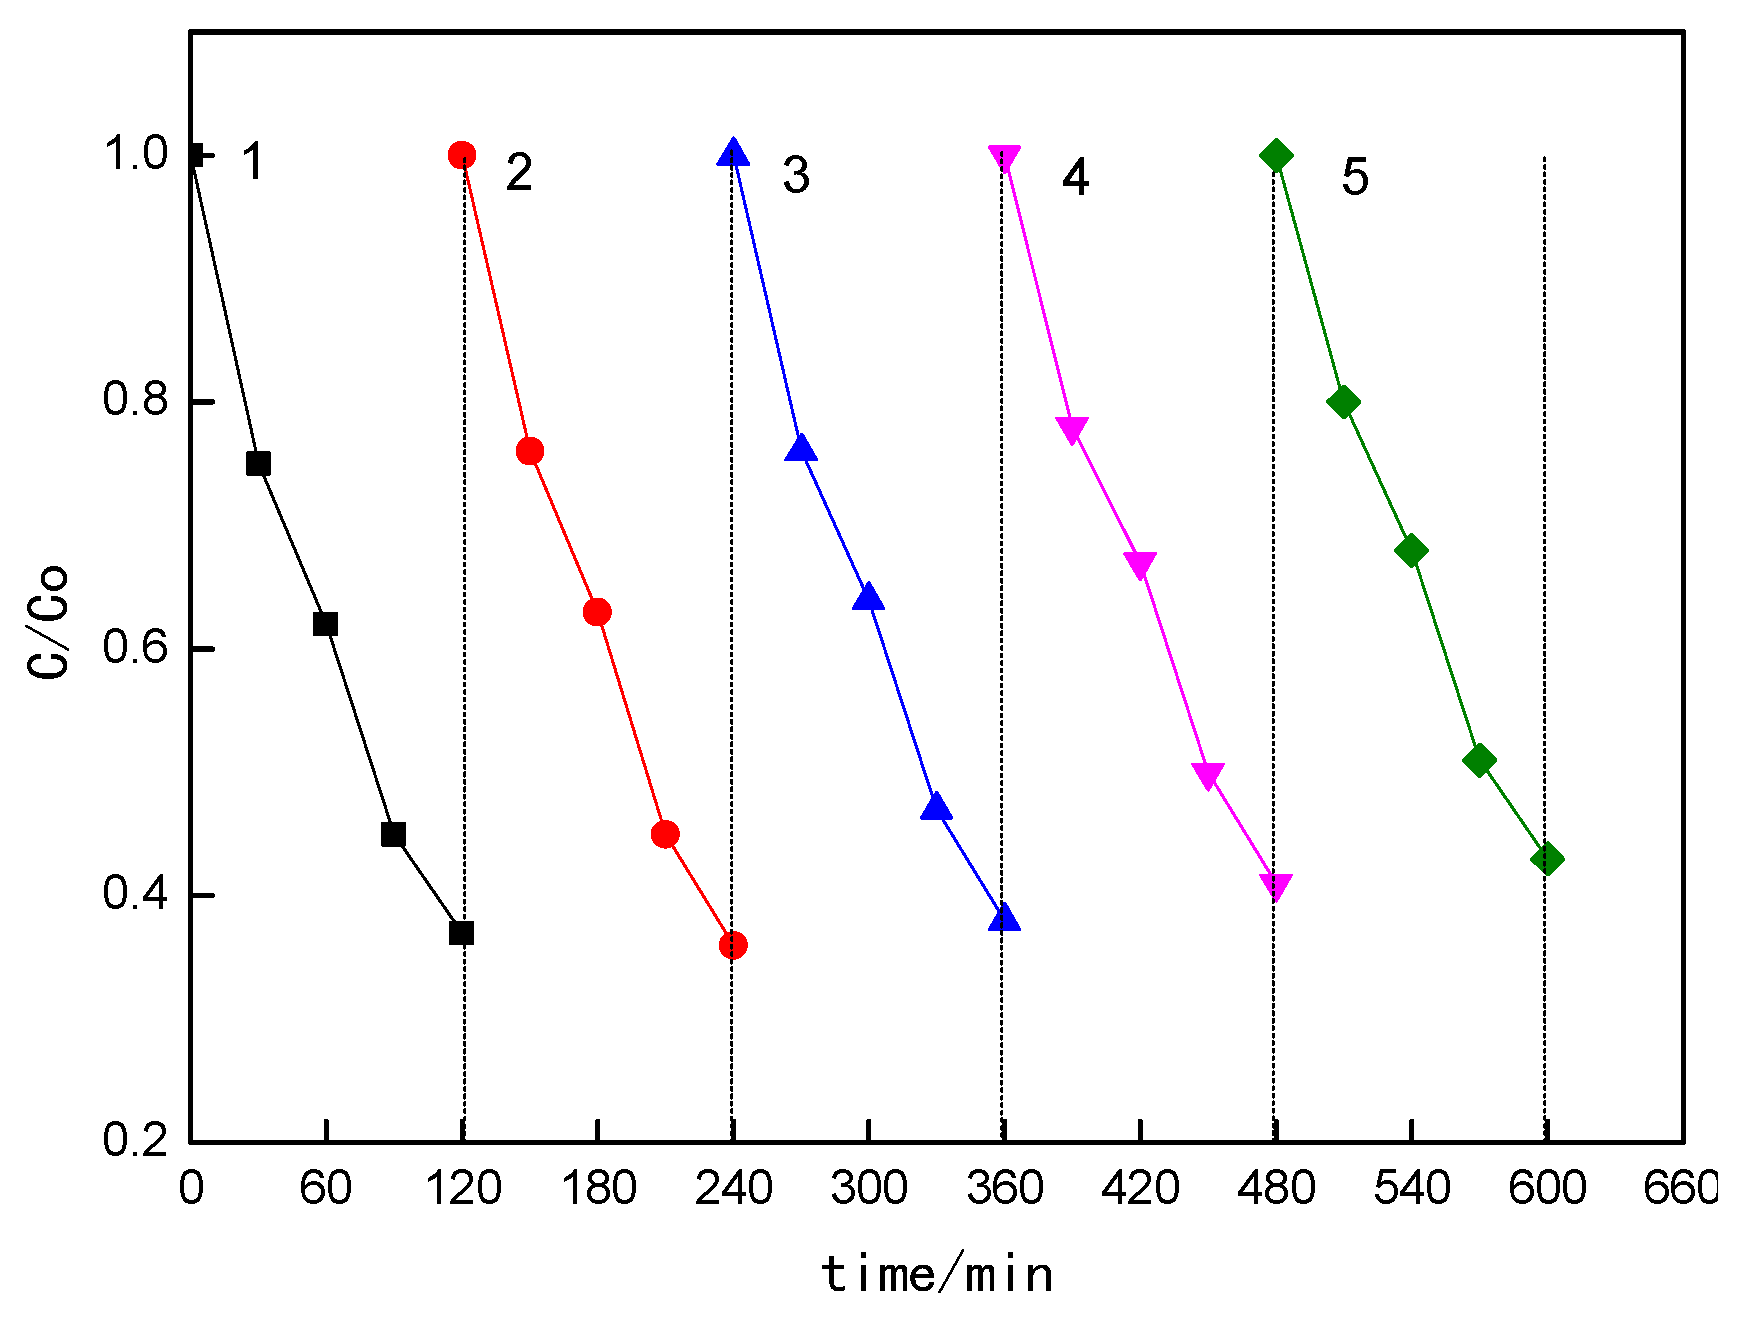
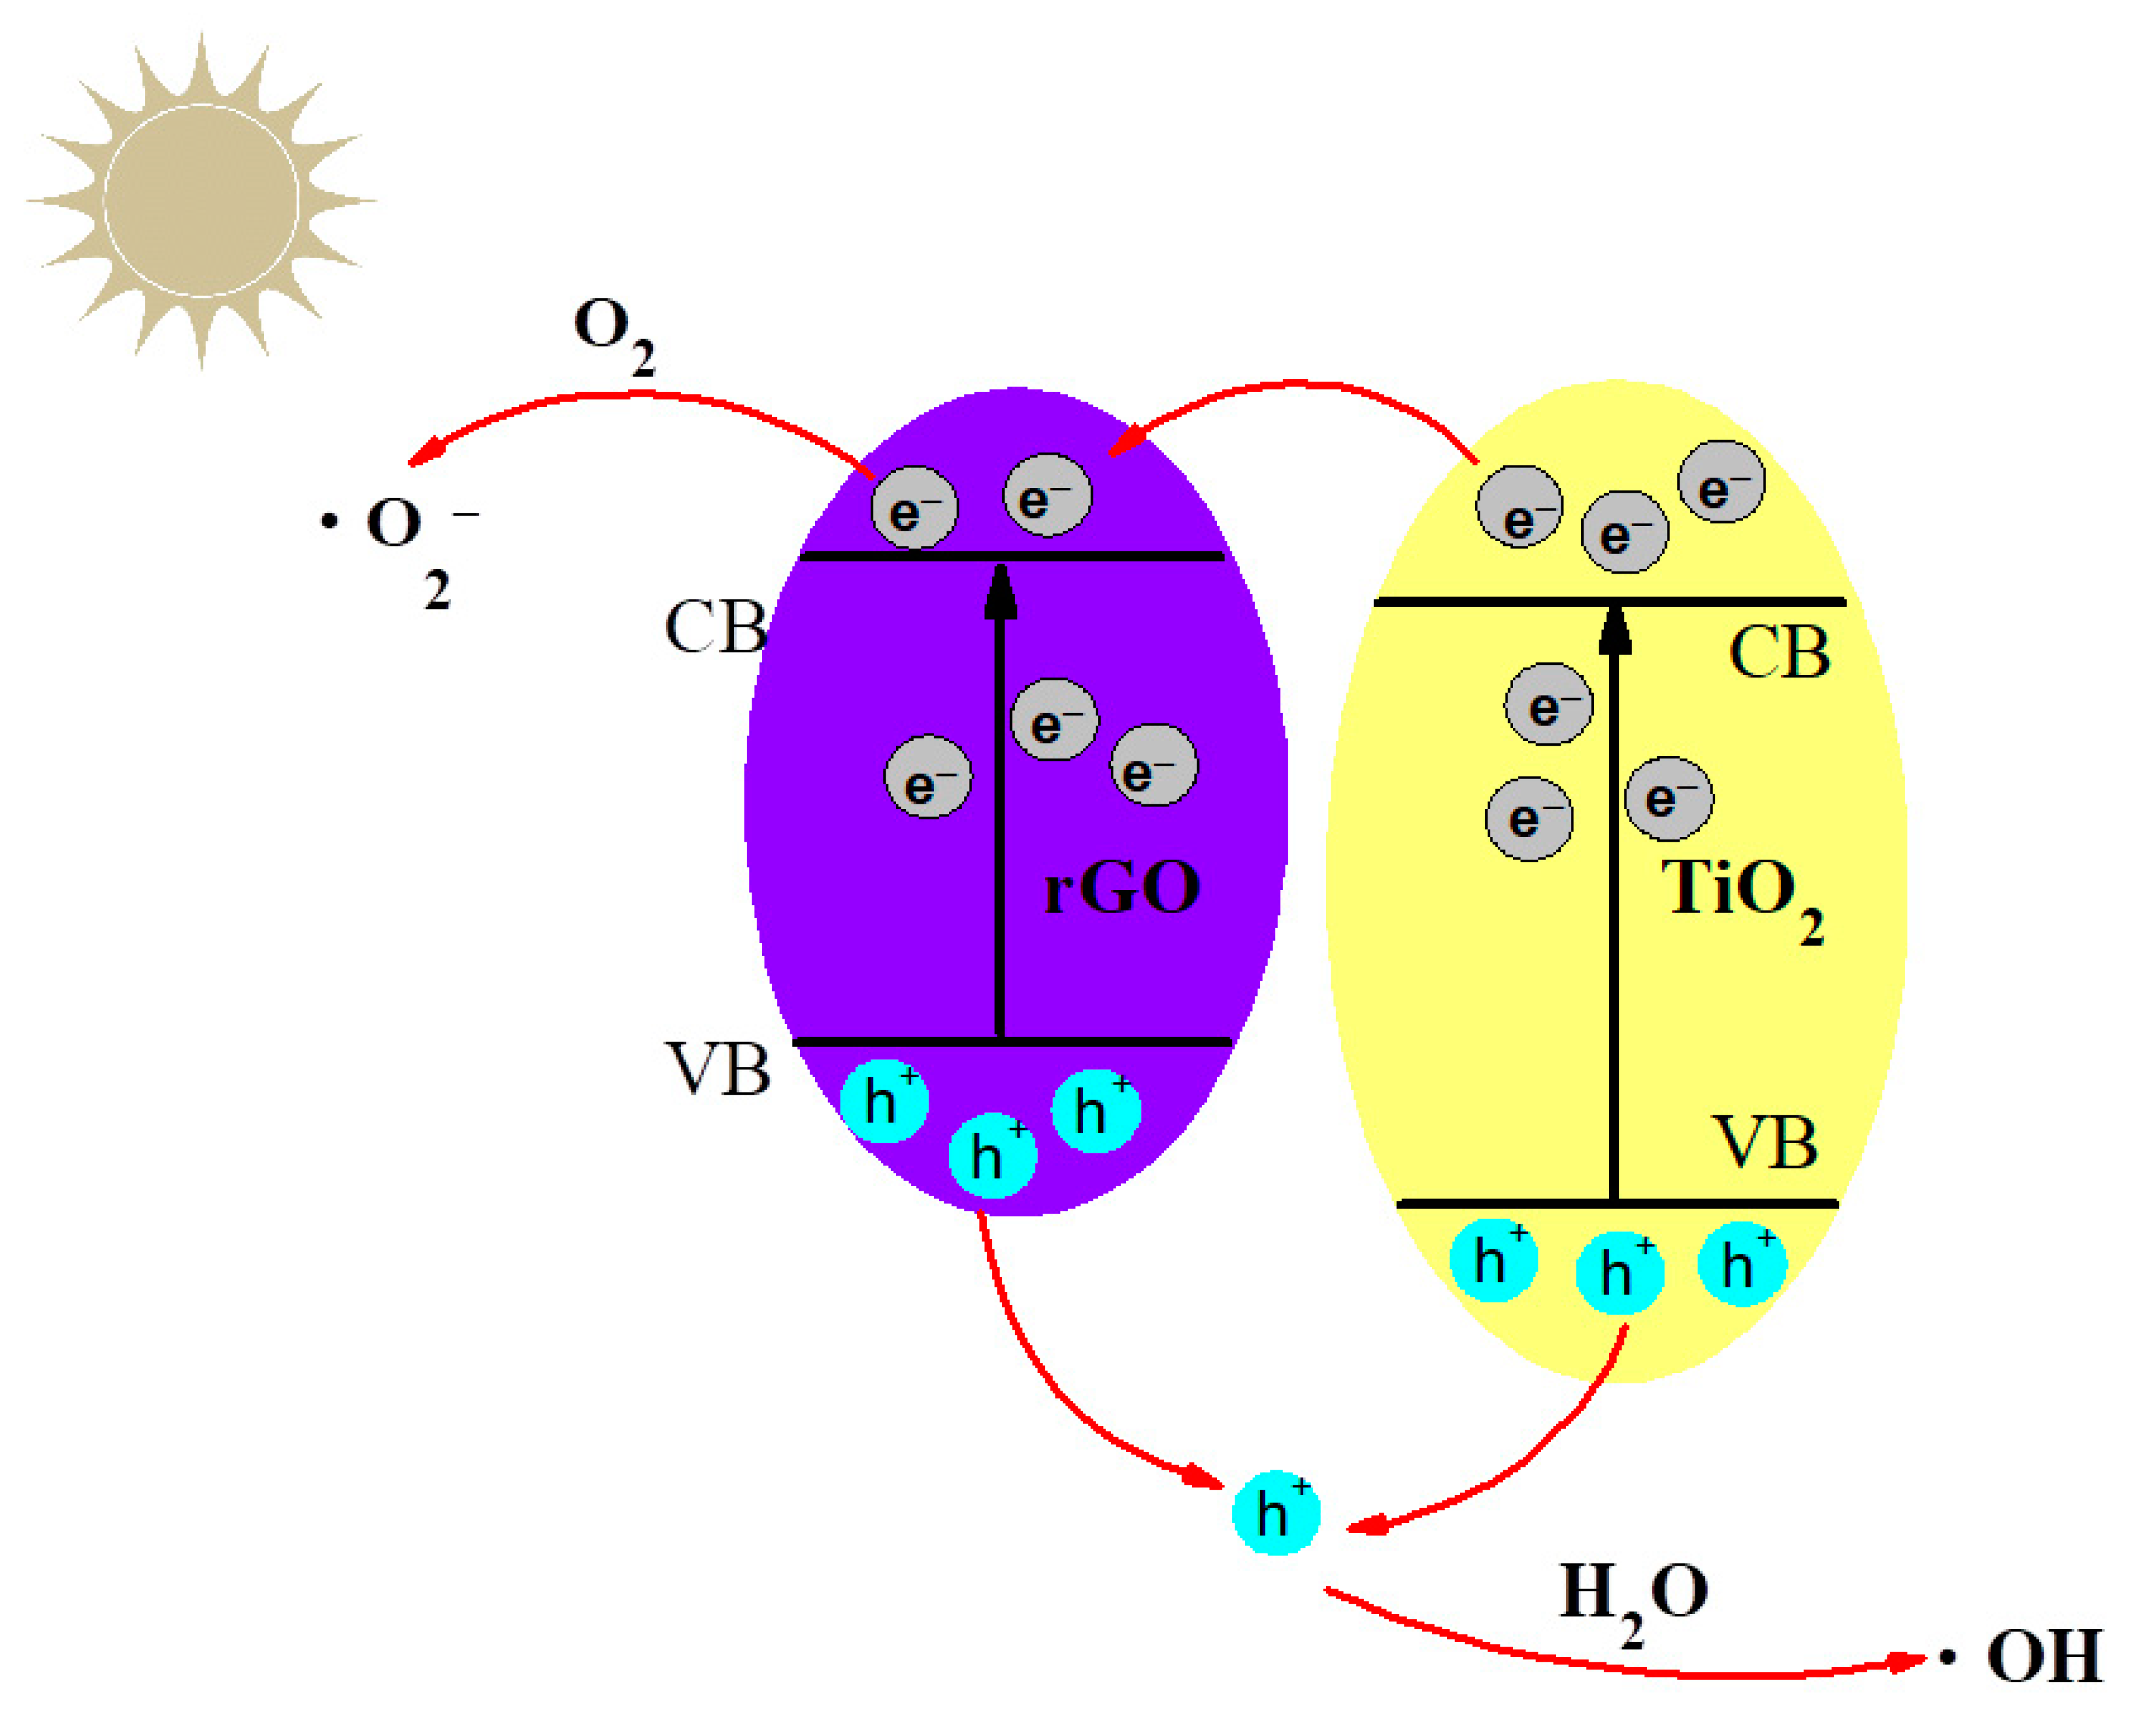
3.3. Analysis of Photoelectrocatalytic Mechanism

In the process of RGO/TiO2 NTs photoelectrode photoelectrocatalysis of MB, the active intermediates participating in the reaction mainly include ·OH, h+ and ·O2 To study the catalytic mechanism of RGO/TiO2 NTs photoelectrode to MB, we conducted free radical scavenging experiments. It can be seen from Figure 9 that ·OH and h+ are the main active substances in the photoelectric catalytic reaction.
In order to study the stability of RGO/TiO2 NTs photoelectrode photoelectrocatalysis, a series of cyclic experiments were carried out. The result, as shown in Figure 10, was that the RGO/TiO2 NTs photoelectrode has excellent stability: after repeated use for five times, the degradation efficiency of MB was still above 58%.
Figure 11 shows the catalytic activity mechanism of RGO/TiO2 NTs photoelectrodes. When light is irradiated, electrons in the valence band of TiO2 are excited to transition to the conduction band, leaving a hole in the valence band. At the same time, electrons in the valence band of RGO are excited to transition to the conduction band, also leaving holes in the valence band. Due to its good conductivity of RGO, it can promote the flow of photogenerated electrons from the conduction band of TiO2 to the conduction band of RGO. These electrons can react with O2 to produce ·O2. In addition, the holes in the conduction band of TiO2 and RGO can react with H2O to generate ·OH. In this way, electrons are transferred to the conduction band of RGO to react with O2, and holes react with H2O, effectively inhibiting the recombination of electrons and holes. Moreover, the applied voltage accelerates the migration rate of photo-generated electrons in the system, which greatly improves the photocatalytic effect. In addition, this method not only has excellent degradation effects but also has a simple process and is easy to characterize compared with photocatalytic oxidation reactions.

4. Conclusions

Through single factor experiments, the optimal preparation conditions for RGO/TiO2 NTs were found to be: deposition voltage at 1.1 V, deposition time of 10 min, and deposition temperature at 25 °C. According to the analysis and optimization of the response surface experiment design, the significance of the catalytic activity of RGO/TiO2 NTs photoelectrode was in the order of deposition time > deposition voltage > deposition temperature. The optimal preparation conditions obtained by optimization were: deposition voltage at 1.19 V, deposition time of 10.27 min, and deposition temperature at 24.94 °C. The predicted value of MB degradation rate was 65.43%. Compared with the actual value (63%), the error value was 2.43%, indicating that the preparation parameters optimized by RSM have practical application value. The results provide a reference for the large-scale application of RGO/TiO2 NTs photoelectrodes in engineering. Through SEM and XRD characterization analysis, it can be seen that after RGO modification, the original tubular structure of TiO2 nanotubes was not changed. The surface of the TiO2 NTs photoelectrode was covered with a non-uniform flake-shaped reduced graphene oxide film. The impedance of RGO/TiO2 NTs was smaller than that of TiO2 NTs photoelectrode.

Author Contributions

Conceptualization, J.Z. and Y.L.; software, Z.X. and S.Y. (Shaodong Yang); formal analysis, Y.L.; investigation, S.Y. (Shaodong Yang); data curation, S.Y. (Shiyou Yu); methodology and writing—original draft preparation, S.Y. (Siying Yuan); writing—review and editing, C.T.; supervision, J.L.; resources, validation, project administration, and funding acquisition, J.Z. All authors have read and agreed to the published version of the manuscript.

Funding

This research was funded by Support Program for Young Innovative Talents in Colleges and Universities of Heilongjiang Province, grant number UNPYSCT-2018136.

Informed Consent Statement

Informed consent was obtained from all subjects involved in the study.

Conflicts of Interest

The funders had no role in the design of the study; in the collection, analyses, or interpretation of data; in the writing of the manuscript; or in the decision to publish the results.

References

  1. King, T.C. Azo Dyes and Human Health: A Review; Taylor & Francis: Washington, DC, USA, 2016; pp. 233–261. [Google Scholar]
  2. Wang, X.L.; Rong, X.; Lin, H.Y.; Liu, D.N.; Wang, X.; Liu, G.C.; Song, G. A series of novel polyoxometalate-based Ag I -complexes constructed from asymmetric pyridyl-monoamide ligand: Synthesis, structures and selective separation of cationic dyes. Inorg. Chim. Acta 2017, 461, 279–289. [Google Scholar] [CrossRef]
  3. Zhu, M.T.; Kurniawan, T.A.; Song, F.; Ouyang, T.; Othman, M.H.D.; Rezakazemi, M.; Shirazian, S. Applicability of BaTiO3/graphene oxide (GO) composite for enhanced photodegradation of methylene blue (MB) in synthetic wastewater under UV–vis irradiation. Environ. Pollut. 2019, 255, 113182. [Google Scholar]
  4. Reddy, B.S.; Ramana, K.V.; Ravindhranath, K. Extraction of methylene blue dye from polluted waters using some bio-adsorbents. Int. J. Appl. Biol. Pharm. Technol. 2012, 3, 215–224. [Google Scholar]
  5. Bhattacharjee, C.; Dutta, S.; Saxena, V.K. A review on biosorptive removal of dyes and heavy metals from wastewater using watermelon rind as biosorbent. Environ. Adv. 2020, 2, 100007. [Google Scholar] [CrossRef]
  6. Hussein, T.K.; Jasim, N.A. A comparison study between chemical coagulation and electro-coagulation processes for the treatment of wastewater containing reactive blue dye. Mater. Today Proc. 2021, 42, 1946–1950. [Google Scholar]
  7. Khandelwal, N.; Tiwari, E.; Singh, N.; Marsac, R.; Schäfer, T.; Monikh, F.A.; Darbha, G.K. Impact of long-term storage of various redox-sensitive supported nanocomposites on their application in removal of dyes from wastewater: Mechanisms delineation through spectroscopic investigations. J. Hazard. Mater. 2021, 401, 123375. [Google Scholar] [CrossRef] [PubMed]
  8. Anantha, M.S.; Jayanth, V.; Olivera, S.; Anarghya, D.; Venkatesh, K.; Jayanna, B.K.; Sachin, H.P.; Muralidhara, H.B. Microwave treated Bermuda grass as a novel photocatalyst for the treatment of methylene blue dye from wastewater. Environ. Nanotechnol. Monit. Manag. 2021, 15, 100447. [Google Scholar]
  9. Espinola-Portilla, F.; Navarro-Mendoza, R.; Gutiérrez-Granados, S.; Morales-Muñoz, U.; Brillas-Coso, E.; Peralta-Hernández, J.M. A simple process for the deposition of TiO2 onto BDD by electrophoresis and its application to the photoelectrocatalysis of Acid Blue 80 dye. J. Electroanal. Chem. 2017, 802, 57–63. [Google Scholar] [CrossRef]
  10. Garcia-Segura, S.; Brillas, E. Applied photoelectrocatalysis on the degradation of organic pollutants in wastewaters. J. Photochem. Photobiol. C Photochem. Rev. 2017, 31, 1–35. [Google Scholar] [CrossRef]
  11. Licht, S.; Wang, B.; Mukerji, S.; Soga, T.; Umeno, M.; Tributsch, H. ChemInform Abstract: Efficient Solar Water Splitting, Exemplified by RuO2-Catalyzed AlGaAs/Si Photoelectrolysis. Chem. Inform. 2001, 104, 8920–8924. [Google Scholar] [CrossRef]
  12. Zhang, Y.; Xiong, X.; Han, Y.; Zhang, X.; Shen, F.; Deng, S.; Xiao, H.; Yang, X.; Yang, G.; Peng, H. Photoelectrocatalytic degradation of recalcitrant organic pollutants using TiO2 film electrodes: An overview. Chemosphere 2012, 88, 145–154. [Google Scholar] [CrossRef]
  13. Ye, S.; Chen, Y.; Yao, X.; Zhang, J. Simultaneous removal of organic pollutants and heavy metals in wastewater by photoelectrocatalysis: A review. Chemosphere 2021, 273, 128503. [Google Scholar] [CrossRef] [PubMed]
  14. Fujishima, A.; Honda, K. Electrochemical photolysis of water at a semiconductor electrode. Nature 1972, 238, 37–38. [Google Scholar] [CrossRef]
  15. Gupta, S.M.; Tripathi, M. A review of TiO2 nanoparticles. Chin. Sci. Bull. 2011, 56, 1639. [Google Scholar] [CrossRef] [Green Version]
  16. Sun, C.; Wu, Y.; Zhang, W.; Jiang, N.; Jiu, T.; Fang, J. Improving Efficiency by Hybrid TiO2 Nanorods with 1,10-Phenanthroline as A Cathode Buffer Layer for Inverted Organic Solar Cells. ACS Appl. Mater. Interfaces 2013, 6, 739–744. [Google Scholar] [CrossRef] [PubMed]
  17. Yang, H.G.; Sun, C.H.; Qiao, S.Z.; Zou, J.; Liu, G.; Smith, S.C.; Cheng, H.M.; Lu, G.Q. Anatase TiO2 single crystals with a large percentage of reactive facets. Nature 2008, 453, 638. [Google Scholar] [CrossRef] [PubMed] [Green Version]
  18. Mena, E.; José, M.D.V.M.; Mesones, S.; Marugán, J. Influence of anodization mode on the morphology and photocatalytic activity of TiO2-NTs array large size electrodes. Catal. Today 2017, 313, 33–39. [Google Scholar] [CrossRef]
  19. Adachi, M.; Murata, Y.; Harada, M.; Yoshikawa, S. ChemInform Abstract: Formation of Titania Nanotubes with High Photo-Catalytic Activity. Chem. Inform. 2000, 31, 942–943. [Google Scholar] [CrossRef]
  20. Chu, S.Z.; Inoue, S.; Wada, K.; Li, D.; Awatsu, S. Highly Porous (TiO2–SiO2–TeO2)/Al2O3/TiO2 Composite Nanostructures on Glass with Enhanced Photocatalysis Fabricated by Anodization and Sol–Gel Process. Chem. Inform. 2003, 107, 6586–6589. [Google Scholar] [CrossRef]
  21. Zhang, Z.; Yuan, Y.; Fang, Y.; Liang, L.; Ding, H.; Shi, G.; Jin, L. Photoelectrochemical oxidation behavior of methanol on highly ordered TiO2 nanotube array electrodes. J. Electroanal. Chem. 2007, 610, 179–185. [Google Scholar] [CrossRef]
  22. Jeon, M.S.; Chun, Y.G.; Chang, S.J.; Kim, J.H.; Kang, B. Formation of Titania Nanotubes and Application for Dye-Sensitized Solar Cell. J. Electrochem. Soc. 2003, 150, G488. [Google Scholar]
  23. Mor, G.; Shankar, K.; Varghese, O.; Grimes, C. Photoelectrochemical properties of titania nanotubes. J. Mater. Res. 2004, 19, 2989–2996. [Google Scholar] [CrossRef]
  24. Chakraborty, I.; Chatterjee, S.; Ayyub, P. Field emission from hydrogen titanate nanotubes. Appl. Phys. Lett. 2011, 99, 1179. [Google Scholar] [CrossRef]
  25. Mor, G.K.; Varghese, O.K.; Paulose, M.; Shankar, K.; Grimes, C.A. A Review on Highly Ordered, Vertically Oriented TiO2 Nanotube Arrays: Fabrication, Material Properties, and Solar Energy Applications. Sol. Energy Mater. Sol. Cells 2006, 90, 2011–2075. [Google Scholar] [CrossRef]
  26. Li, L.; Zhou, Z.; Lei, J.; He, J.; Zhang, S.; Pan, F. Highly ordered anodic TiO2 nanotube arrays and their stabilities as photo(electro)catalysts. Appl. Surf. Sci. 2012, 258, 3647–3651. [Google Scholar] [CrossRef]
  27. Cao, D.; Wang, Q.; Liu, Z.; Zhang, H.; Gao, S. Enhanced the photoelectrocatalytic performance of TiO2 nanotube arrays by the synergistic sensitization of Ag–AgBr nanospheres. Spectrochim. Acta Part A Mol. Biomol. Spectrosc. 2019, 227, 117674. [Google Scholar] [CrossRef]
  28. Maryline, N.; Sébastien, B.; Cynthia, E.; Roland, H.; Philippe, M.; Mikhael, B. Enhanced Visible-Light Photocatalytic Performance of Electrospun rGO/TiO2 Composite Nanofibers. J. Phys. Chem. C 2017, 121, 261–269. [Google Scholar]
  29. Zhang, Y.; Hu, H.; Kang, W.; Qiu, G.; Liang, R.; Deng, L.; Yuan, H. Enhancing hydrogen evolution by photoelectrocatalysis of water splitting over a CdS flowers-loaded TiO2 nanotube array film on the Ti foil substrate. Ceram. Int. 2020, 46, 17606–17613. [Google Scholar] [CrossRef]
  30. Lavanya, T.; Satheesh, K.; Dutta, M.; Victor Jaya, N.; Fukata, N. Superior photocatalytic performance of reduced graphene oxide wrapped electrospun anatase mesoporous TiO2 nanofibers. J. Alloys Compd. 2014, 615, 643–650. [Google Scholar] [CrossRef]
  31. Nainani, R.K.; Thakur, P. Facile synthesis of TiO2-RGO composite with enhanced performance for the photocatalytic mineralization of organic pollutants. Water Sci. Technol. 2016, 73, 1927–1936. [Google Scholar] [CrossRef]
  32. Fan, W.; Lai, Q.; Zhang, Q.; Wang, Y. Nanocomposites of TiO(2) and Reduced Graphene Oxide as Efficient Photocatalysts for Hydrogen Evolution. J. Phys. Chem. C 2011, 115, 10694–10701. [Google Scholar] [CrossRef]
  33. Jiang, G.; Lin, Z.; Chen, C.; Zhu, L.; Chang, Q.; Wang, N.; Wei, W.; Tang, H. TiO2 nanoparticles assembled on graphene oxide nanosheets with high photocatalytic activity for removal of pollutants. Carbon 2011, 49, 2693–2701. [Google Scholar] [CrossRef]
  34. Bezerra, M.A.; Santelli, R.E.; Oliveira, E.P.; Villar, L.S.; Escaleira, L.A. Response surface methodology (RSM) as a tool for optimization in analytical chemistry. Talanta 2008, 76, 965–977. [Google Scholar] [CrossRef]
  35. Box, G.; Behnken, D.W. Some New Three Level Designs for the Study of Quantitative Variables. Technometrics 1960, 2, 455–475. [Google Scholar] [CrossRef]
  36. Zuo, J.L.; Li, Y.W.; Li, J.S.; Xia, Z.; Tan, C.; Jiang, L.M.; Sun, Y.Q.; Tian, S.L. Optimizedpreparation of TiO2-NTs photoelectrode by response surface method and its property of photocatalytic degradation. Res. Environ. Sci. 2020, 33, 677–684. [Google Scholar]
  37. Gao, G.Y.; Guo, D.J.; Li, H.L. Electrocatalytic oxidation of formaldehyde on palladium nanoparticles supported on multi-walled carbon nanotubes—ScienceDirect. J. Power Sources 2006, 162, 1094–1098. [Google Scholar] [CrossRef]
  38. Tian, G.; Fu, H.; Jing, L.; Xin, B.; Pan, K. Preparation and Characterization of Stable Biphase TiO2 Photocatalyst with High Crystallinity, Large Surface Area, and Enhanced Photoactivity. J. Phys. Chem. C 2008, 112, 3083–3089. [Google Scholar] [CrossRef]
  39. Zickler, G.A.; Smarsly, B.; Gierlinger, N.; Peterlik, H.; Paris, O. A reconsideration of the relationship between the crystallite size La of carbons determined by X-ray diffraction and Raman spectroscopy. Carbon 2006, 44, 3239–3246. [Google Scholar] [CrossRef]
Figure 1. Effect of deposition voltages on the methylene blue degradation.
Processes 09 01492 g001
Figure 2. Effect of deposition time on the methylene blue degradation.
Processes 09 01492 g002
Figure 3. Effect of deposition temperature on the methylene blue degradation.
Processes 09 01492 g003
Figure 4. (a) Response Surface of deposition potential and deposition time to methylene blue degradation rate; (b) response surface of deposition potential and deposition temperature to methylene blue degradation rate; (c) response surface of deposition potential and deposition temperature to methylene blue degradation rate.
Processes 09 01492 g004
Figure 5. The SEM pattern of RGO/TiO2 NT photoelectrode.
Processes 09 01492 g005
Figure 6. (a) XRD diffractogram of RGO/TiO2 NTs photoelectrode; (b) XRD diffractogram and Raman spectrum of RGO/TiO2 NTs photoelectrode.
Processes 09 01492 g006
Figure 7. Degradation of methylene blue by RGO/TiO2 NT photoelectrode.
Processes 09 01492 g007
Figure 8. Photocatalytic degradation of methylene blue on RGO/TiO2 NTs and TiO2 NT photoelectrode.
Processes 09 01492 g008
Figure 9. Effects of free radical scavengers on the degradation efficiency of methylene blue.
Processes 09 01492 g009
Figure 10. Stability study on RGO/TiO2 NT photoelectrode.
Processes 09 01492 g010
Figure 11. Photoelectric catalytic mechanism diagram.
Processes 09 01492 g011
Table 1. The design of RSM and the corresponding experimental and predicted values.
RunDeposition Potential/VDeposition Time/minDeposition Temperature/°CMB Degradation Rate (%)
ACodeBCodeCCodeExperimentalPredicted
11.4110020−151.246.87
21.418−125051.252.15
31−18−125047.955.45
41.2010025065.849.63
51.2010025064.154.14
61.2010025066.549.66
71−110020−154.750.84
81.2010025064.953.76
91.4110030153.252.79
101−112125056.458.61
111.2010025065.456.49
121.208−13015855.71
131.208−120−152.265.34
141.4112125049.665.34
151−110030149.365.34
161.2012120−157.165.34
171.2012130156.365.34
Table 2. ANOVA results of RSM.
SourceSum of SquaresDegree of FreedomMean of SquareF-Valuep-Value Prob > FSignificant
Model642.52971.3931.78<0.0001Significant
A1.211.20.530.4884
B12.75112.755.680.0487
C0.3210.320.140.7170
AB25.5125.511.350.0119
AC13.69113.696.090.0429
BC10.89110.894.850.0436
A2335.961335.96149.56<0.0001
B2110.921110.9249.380.0002
C278.12178.1234.780.0006
Residual15.7272.25
Lack of Fit12.4334.145.040.0762Not significant
Pure Error3.2940.82
Cor Total658.2516
Publisher’s Note: MDPI stays neutral with regard to jurisdictional claims in published maps and institutional affiliations.

