Article

Experimental Study on Axial Temperature Profile of Jet Fire of Oil-Filled Equipment in Substation

1
School of Emergency Management and Safety Engineering, China University of Mining and Technology, Beijing 100083, China
2
State Key Laboratory of Coal Resources and Safety Mining, China University of Mining and Technology, Beijing 100083, China
3
State Grid Electric Power Research Institute Co., Ltd., Nanjing 211106, China
*
Authors to whom correspondence should be addressed.
Processes 2021, 9(8), 1460; https://doi.org/10.3390/pr9081460
Submission received: 1 August 2021 / Revised: 14 August 2021 / Accepted: 19 August 2021 / Published: 21 August 2021

Abstract

:
With the widespread use of substations around the world, oil jet fire accidents from transformer oil-filled equipment in substations caused by faults have occurred from time to time. In this paper, a series of transformer oil jet fire experiments are carried out by changing the external heat source (30 cm and 40 cm) and the inner diameter of the container (5 cm, 8 cm and 10 cm) to study the axial centerline temperature distribution of the transformer oil jet fire plume of the transformer oil-filled equipment in the substation. The experiment uses K-type thermocouple, electronic balance and CCD to measure and assess the temperature distribution of the axial centerline of the fire plume of the transformer oil jet. The result demonstrates that the axial centerline temperature of the fire plume increases with the external heat release rate and the inner diameter of the container. In addition, a novel axial temperature distribution prediction model of the transformer oil jet fire plume is established. This model can effectively predict the oil jet fire plume temperature of transformer oil- filling equipment in substations, and provide help for substation fire control.

1. Introduction

With global warming, the world’s energy structure is developing towards low carbon. “Zero emission” of carbon dioxide has become a goal that all countries are striving to achieve. Under this circumstance, electricity can be favored by all countries as a kind of green energy. However, there are a lot of oil-filled equipment in the substation. Due to equipment aging, corrosion or misoperation, a large amount of high-temperature transformer oil may spread out quickly, encounter open flames or discharge the spark which will form a gas-liquid two-phase flow jet fire [1,2,3,4,5,6,7,8].
Jet fires often cause catastrophic fire accidents due to their strong flame impact and violent thermal radiation hazards [9]. In order to clearly grasp the combustion characteristics of jet fires, scholars at home and abroad have carried out a large number of experimental studies on jet fire combustion characteristics. The research scope includes flame geometry [10,11,12,13,14,15,16], flame radiation [17,18,19,20,21,22] and flame temperature distribution [23,24,25,26,27], etc. Through literature research, it can be found that due to the very turbulent jet flame, the flame generation and development process is rapid and difficult to stabilize. These factors have led to few scholars on flame temperature. However, Axial temperature profile in buoyant plume is one of the basic and important parameters of fuel jet fires. Studying the temperature of the axial fire plume helps to understand the state and structure of the flow field [28]. Therefore, there are still scholars carrying out such research. McCaffrey [29] put forward the classic three-zone theory of vertical temperature distribution of the fire plume of carrying out methane combustion experiments and established a vertical temperature distribution prediction model:
2 g T T 0 = Κ ( Ζ Q ˙ 2 / 5 ) 2 η 1
where T   is flame temperature rise (°C); T 0   is the ambient temperature (°C) ;   K   is a constant; Κ = ( κ C ) 2 , η and κ are all coefficients; g   is the acceleration of gravity (m·s−2); Z   is the height of the thermocouple (m); Q   is the heat release rate, (kW). See Table 1 for specific values.
It can be seen that the temperature prediction model proposed by McCaffrey has great limitations, so Zukoski [30] conducted a series of methane diffusion combustion experiments to study the entrainment effect of the fire plume, and with further improvement, the temperature forecast equation in the vertical direction of the flame. The above research results have been extensively verified in experiments. However, the initial momentum of the jet flame cannot be ignored. Therefore, the above research results still have certain limitations. Heskestad [27] proposed the concept of a virtual point source to modify the height of the fire plume to further improve fire plume temperature rise equation. In recent years, scholars at home and abroad have carried out further studies on the jet fire plume temperature based on previous studies. Gomez-Mares [23] carried out a vertical propane jet fire experiment and established the fire plume temperature and the axial distance, as well as the fire plume temperature. A quadratic polynomial related to the heat release rate, Hu [24] established a jet fire plume temperature distribution model under different ambient pressures. Zhang [26] carried out a study on the rectangular fire source jet fire plume temperature distribution. Tao [25] studied the temperature distribution law of jet fire plume under inclined conditions. Z.H. Gao [31] studied the longitudinal and transverse temperature distribution of jet fire plume of turbulent porous gas burner.
Literature research found that previous studies mainly focused on the vertical temperature distribution of gas or liquefied gas fuel jets. However, the temperature distribution of the jet fire generated by the oil-filled equipment in the transformer substation is always ignored. The purpose of this paper is to study the distribution law of the centerline axial temperature distribution of the oil jet fire plume of the transformer oil-filled equipment in the substation. This paper carries out a series of experiments on the transformer oil jet fire of the transformer oil-filled equipment in the substation by changing the external heat release rate and the inner diameter of the container. The source corrects the height of the fire plume. Based on the classic fire plume temperature distribution model, a new prediction model for the temperature distribution of the fire plume axial centerline of the transformer oil jet in the substation oil-filled equipment is established.

2. Experimental

2.1. Experimental Facility

All experiments in this study were carried out in the same tunnel, and the tunnel door was closed but not sealed before each experiment to ensure that the experiment was completed in a still air environment. Figure 1 shows a schematic diagram of the experimental device. The experimental device shown in Figure 1 consists of a fuel supply system, a measurement system and a data acquisition system.
The fuel supply system consists of an oil storage tank and an oil sump. The oil storage tank is a cylindrical stainless steel tank with a 15 mm diameter circular opening at the center of the top for installation of nozzles. The bottom of the storage tank is welded with three cylindrical stainless steel brackets to ensure the direction of jet fire is vertically upward. The oil storage tank is placed in the center of the oil sump and the side wall of the oil sump is 10 cm high; the measuring system consists of a thermocouple tree composed of 8 K-type thermocouples (OMEGA) with a diameter of 1 mm (the measurement error is less than 1 °C or 3%), electronic balance (AND GP-61ks, accuracy: ±0.1 g, range: 0~60 kg) and a CCD camera (SONY NEX-FS700, pixel: 1280 × 720, frame rate: 25 fps). Among them, readings measured by the thermocouple has been corrected with the radiation loss according to the diameter of the thermocouple. The axial position of thermocouple (T1~T8) is given in Figure 1. T1 is located at 0 m above the nozzle (that is, at the nozzle), and the remaining thermocouples are evenly arranged vertically upwards along the centerline of the flame axis at 0.3 m intervals to measure the transformer oil jet fire plume axis to the centerline temperature; the thermocouple numbers are: T1, T2, T3, T4, T5, T6, T7, T8. The electronic balance is placed in the lower part of the fuel supply system to record fuel combustion in real time, and a fireproof board is placed between the fuel supply system and the electronic balance to avoid accidental damage to the electronic balance during the experiment. The CCD camera is utilized to record the visual flame image. The camera shooting direction is perpendicular to the flame direction to record the flame’s geometric characteristic image. To effectively record the geometric image of the flame and reduce the image noise, the experiment needs to always keep a dark background around the flame. Therefore, all experiments are carried out at night and in the tunnel. The specific processing of the flame visualization image is as follows: First, the occurrence and development video of jet fire from the video according to each working condition is intercepted; then, with the intercepted video into frames, convert the video images into grayscale images in order to be decompressed; finally, based on the OTSU [32] method, the image brightness threshold (representing the difference in brightness between the flame and the surrounding environment) is dynamically determined (the improper selection of the threshold directly leads to the distortion of the flame shape information), and the grayscale image is converted into a binary image (the flame area is white; non-flame area is black) to obtain the geometric characteristic parameters of the visible flame. The data acquisition system consists of a data acquisition instrument (HIOKI·LR840-21, acquisition frequency 100 Hz), and a laptop computer.

2.2. Experimental Steps

The detailed experimental research steps of the time and space evolution law of transformer oil jet fire temperature are as follows:
(i)
Check the test system and data acquisition system before the experiment to ensure its normal operation;
(ii)
After the first step of inspection, start to fill the oil storage tank and the oil pool with transformer oil, and turn on the electronic balance to record the fuel quality. Fill the oil tank with 100% liquid level transformer oil and fill it into the oil pool; transformer oil with a thickness of 3 cm. When everything is ready, add 10 mL of n-heptane to the surface of the oil pool, turn on the test system and data acquisition system, use the electronic igniter to trigger the fuel supply system, and start the jet fire experiment;
(iii)
After the experiment is over, close the test system and data acquisition system, save the collected data to the computer, and wait for the experimental device to cool to room temperature to start the next experiment preparation. It should be noted that due to the extremely high flame temperature of the jet fire, the temperature measuring probe at the flame needs to check whether it is burned out after many experiments. Once it is found that it is damaged, it is necessary to replace new thermocouples in time.

2.3. Experimental Conditions

Table 1 summarizes the experimental conditions. The experiment designed two oil pools with diameters (0.3 m and 0.4 m) and three oil storage tanks with inner diameters (5 cm, 8 cm and 10 cm) to study the axial center of the transformer oil jet fire plume. The experiment designed two oil pools with diameters (0.3 m and 0.4 m) and three oil storage tanks with inner diameters (5 cm, 8 cm and 10 cm) to study the axial temperature distribution of the transformer oil jet fire.. The nozzle employed in the experiment has a diameter of 5 mm, a height of 3 cm, and a thickness of 2 mm. In order to ensure repeatability, three experiments are performed in each experimental condition, and the average of the three sets of experimental data is used as the experimental result. The fuel used in the experiment is KI25X transformer oil, and the effective heat of combustion is 40 MJ·kg−1 [33]. Table 2 displays the parameters of the three oil storage tanks. During the experiment, the weather station measured the environmental temperature, environmental pressure, relative humidity, wind speed, wind direction and rainfall. The specific environmental conditions are shown in Table 3.

2.4. Reliability Analysis of Experimental Data

The data involved in this paper include temperature data, balance data and CCD data.
The temperature data are measured by K-type thermocouple with a diameter of 1 mm. Before the experiment, the reading measured by the thermocouple has been corrected with the radiation loss according to the diameter of the thermocouple. Due to the extremely high flame temperature of the jet fire, the temperature measuring probe at the flame needs to check whether it is burned out after many experiments. Once it is found that it is damaged, it is necessary to replace new thermocouples in time.
The balance data are measured by an electronic balance (GP-61ks, accuracy: ±0.1 g, measuring range: 0~60 kg). Calibrate the balance before each experiment: The balance should be preheated for about 2–3 h; if it is not to be adjusted, the balance should be horizontal. When there is no weighing object on the scale plate of the balance, it shall be stably displayed as zero. Press the “Cal” key to start the internal calibration function of the balance. Later, electronic balance displays “C”, indicating that internal calibration is in progress; when the electronic balance display shows zero position, it indicates that the electronic balance has been calibrated.
CCD data are captured by CCD (SONY NEX-FS700, Pixel: 1280 × 720, frame rate: 25 fps). The images recorded by a CCD record not only the flame, but also all objects in the flame environment and the reflection of the flame on the ground. All this information is not important for the calculation of the geometric characteristics of the flame as they will bring noise to the image processing and should be removed as much as possible. To effectively record the geometric image of the flame and reduce the image noise, the experiment needs to always keep a dark background around the flame. Therefore, all experiments are carried out at night and in the tunnel. The CCD camera is equipped with Exmor image sensor with high sensitivity, which can effectively record the flame geometric image and reduce the image noise in the dark environment. In order to obtain reliable geometric characteristic parameters of flame, this study uses imaging algorithm to process the visual image and infrared image. The specific processing of the flame visualization image is as follows: First, the occurrence and development video of jet fire from the video according to each working condition is intercepted; then, with the intercepted video into frames, convert the video images into grayscale images in order to be decompressed; finally, based on the OTSU method, the image brightness threshold (representing the difference in brightness between the flame and the surrounding environment) is dynamically determined (the improper selection of the threshold directly leads to the distortion of the flame shape information), and the grayscale image is converted into a binary image (the flame area is white; non-flame area is black) to obtain the geometric characteristic parameters of the visible flame.
In order to ensure repeatability and reduce the uncertainty of the data obtained, three experiments were performed in each experimental condition, and the average value of three groups of experimental data was taken as the experimental result.

3. Results and Discussion

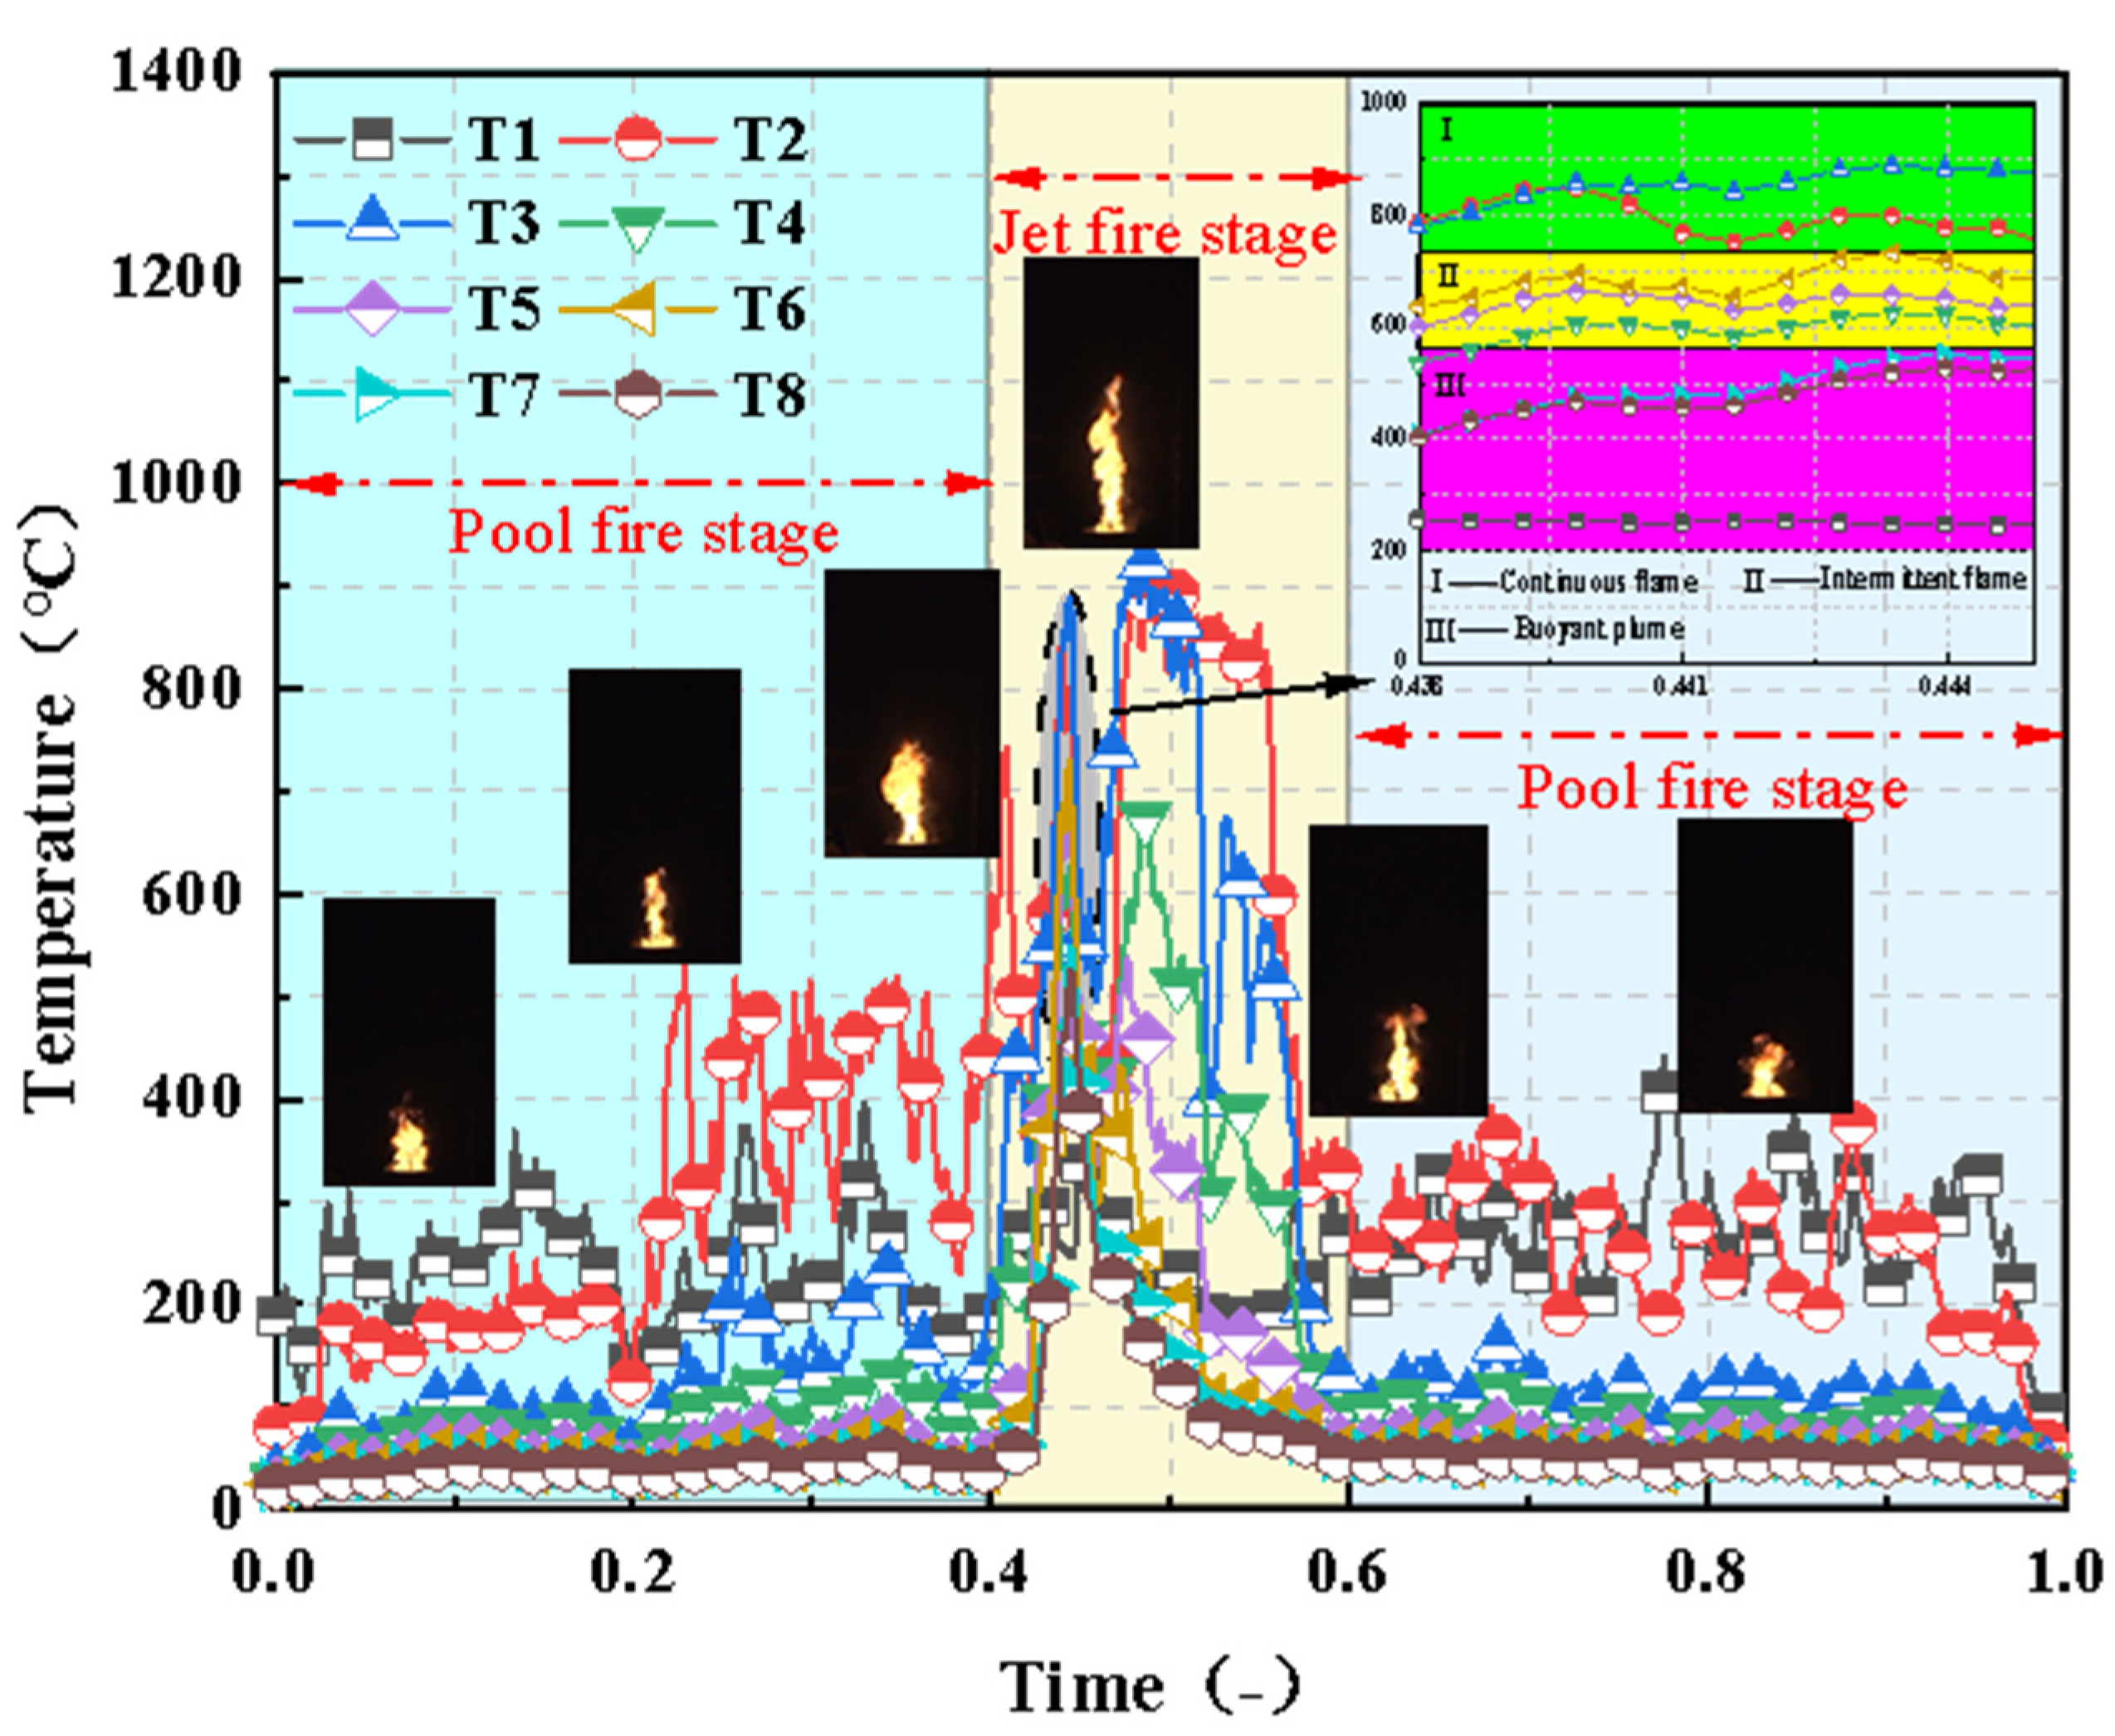
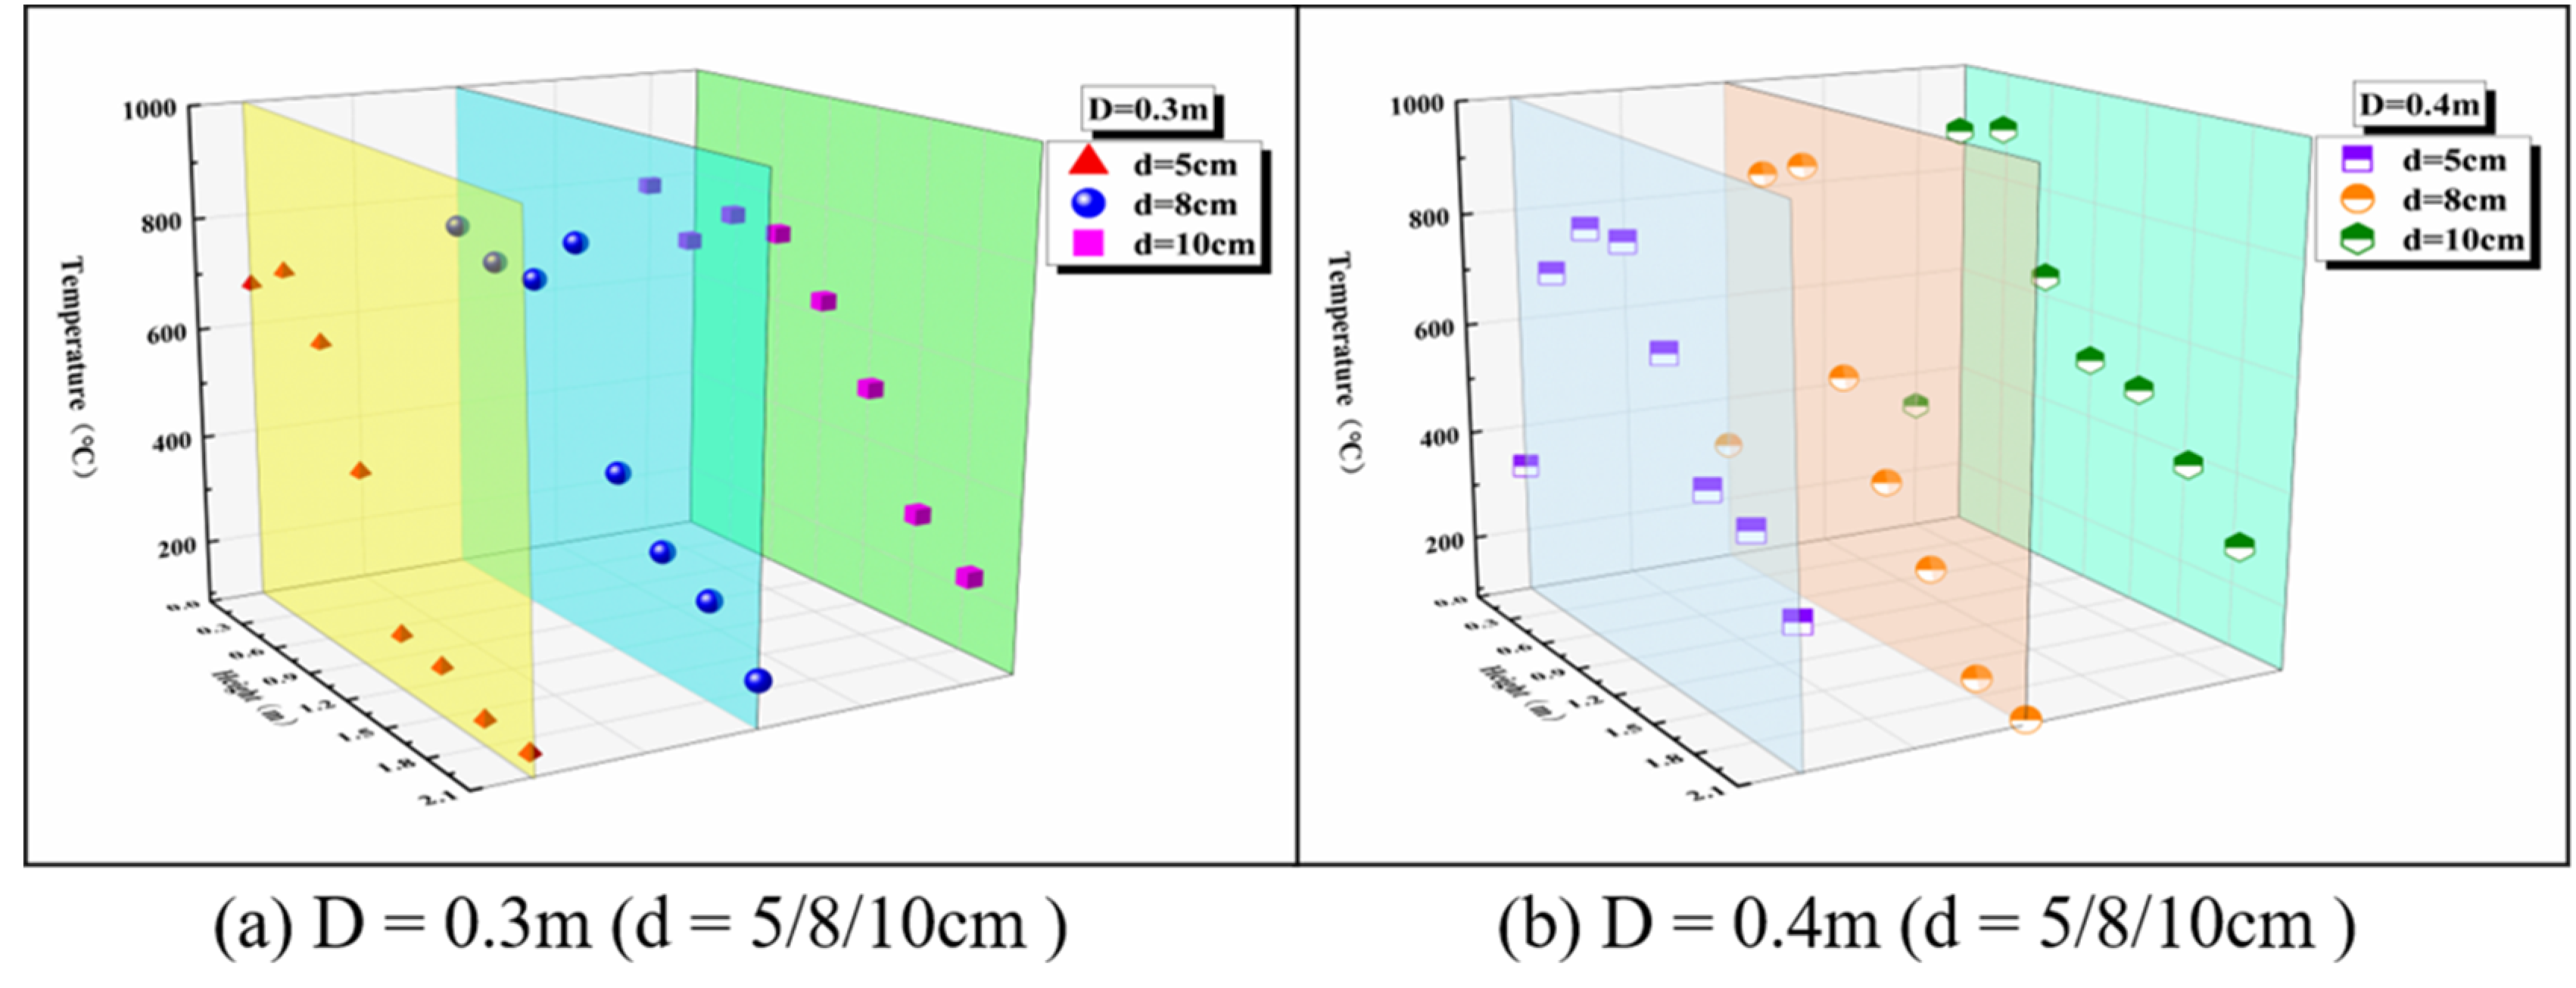
3.1. Axial Temperature Profile
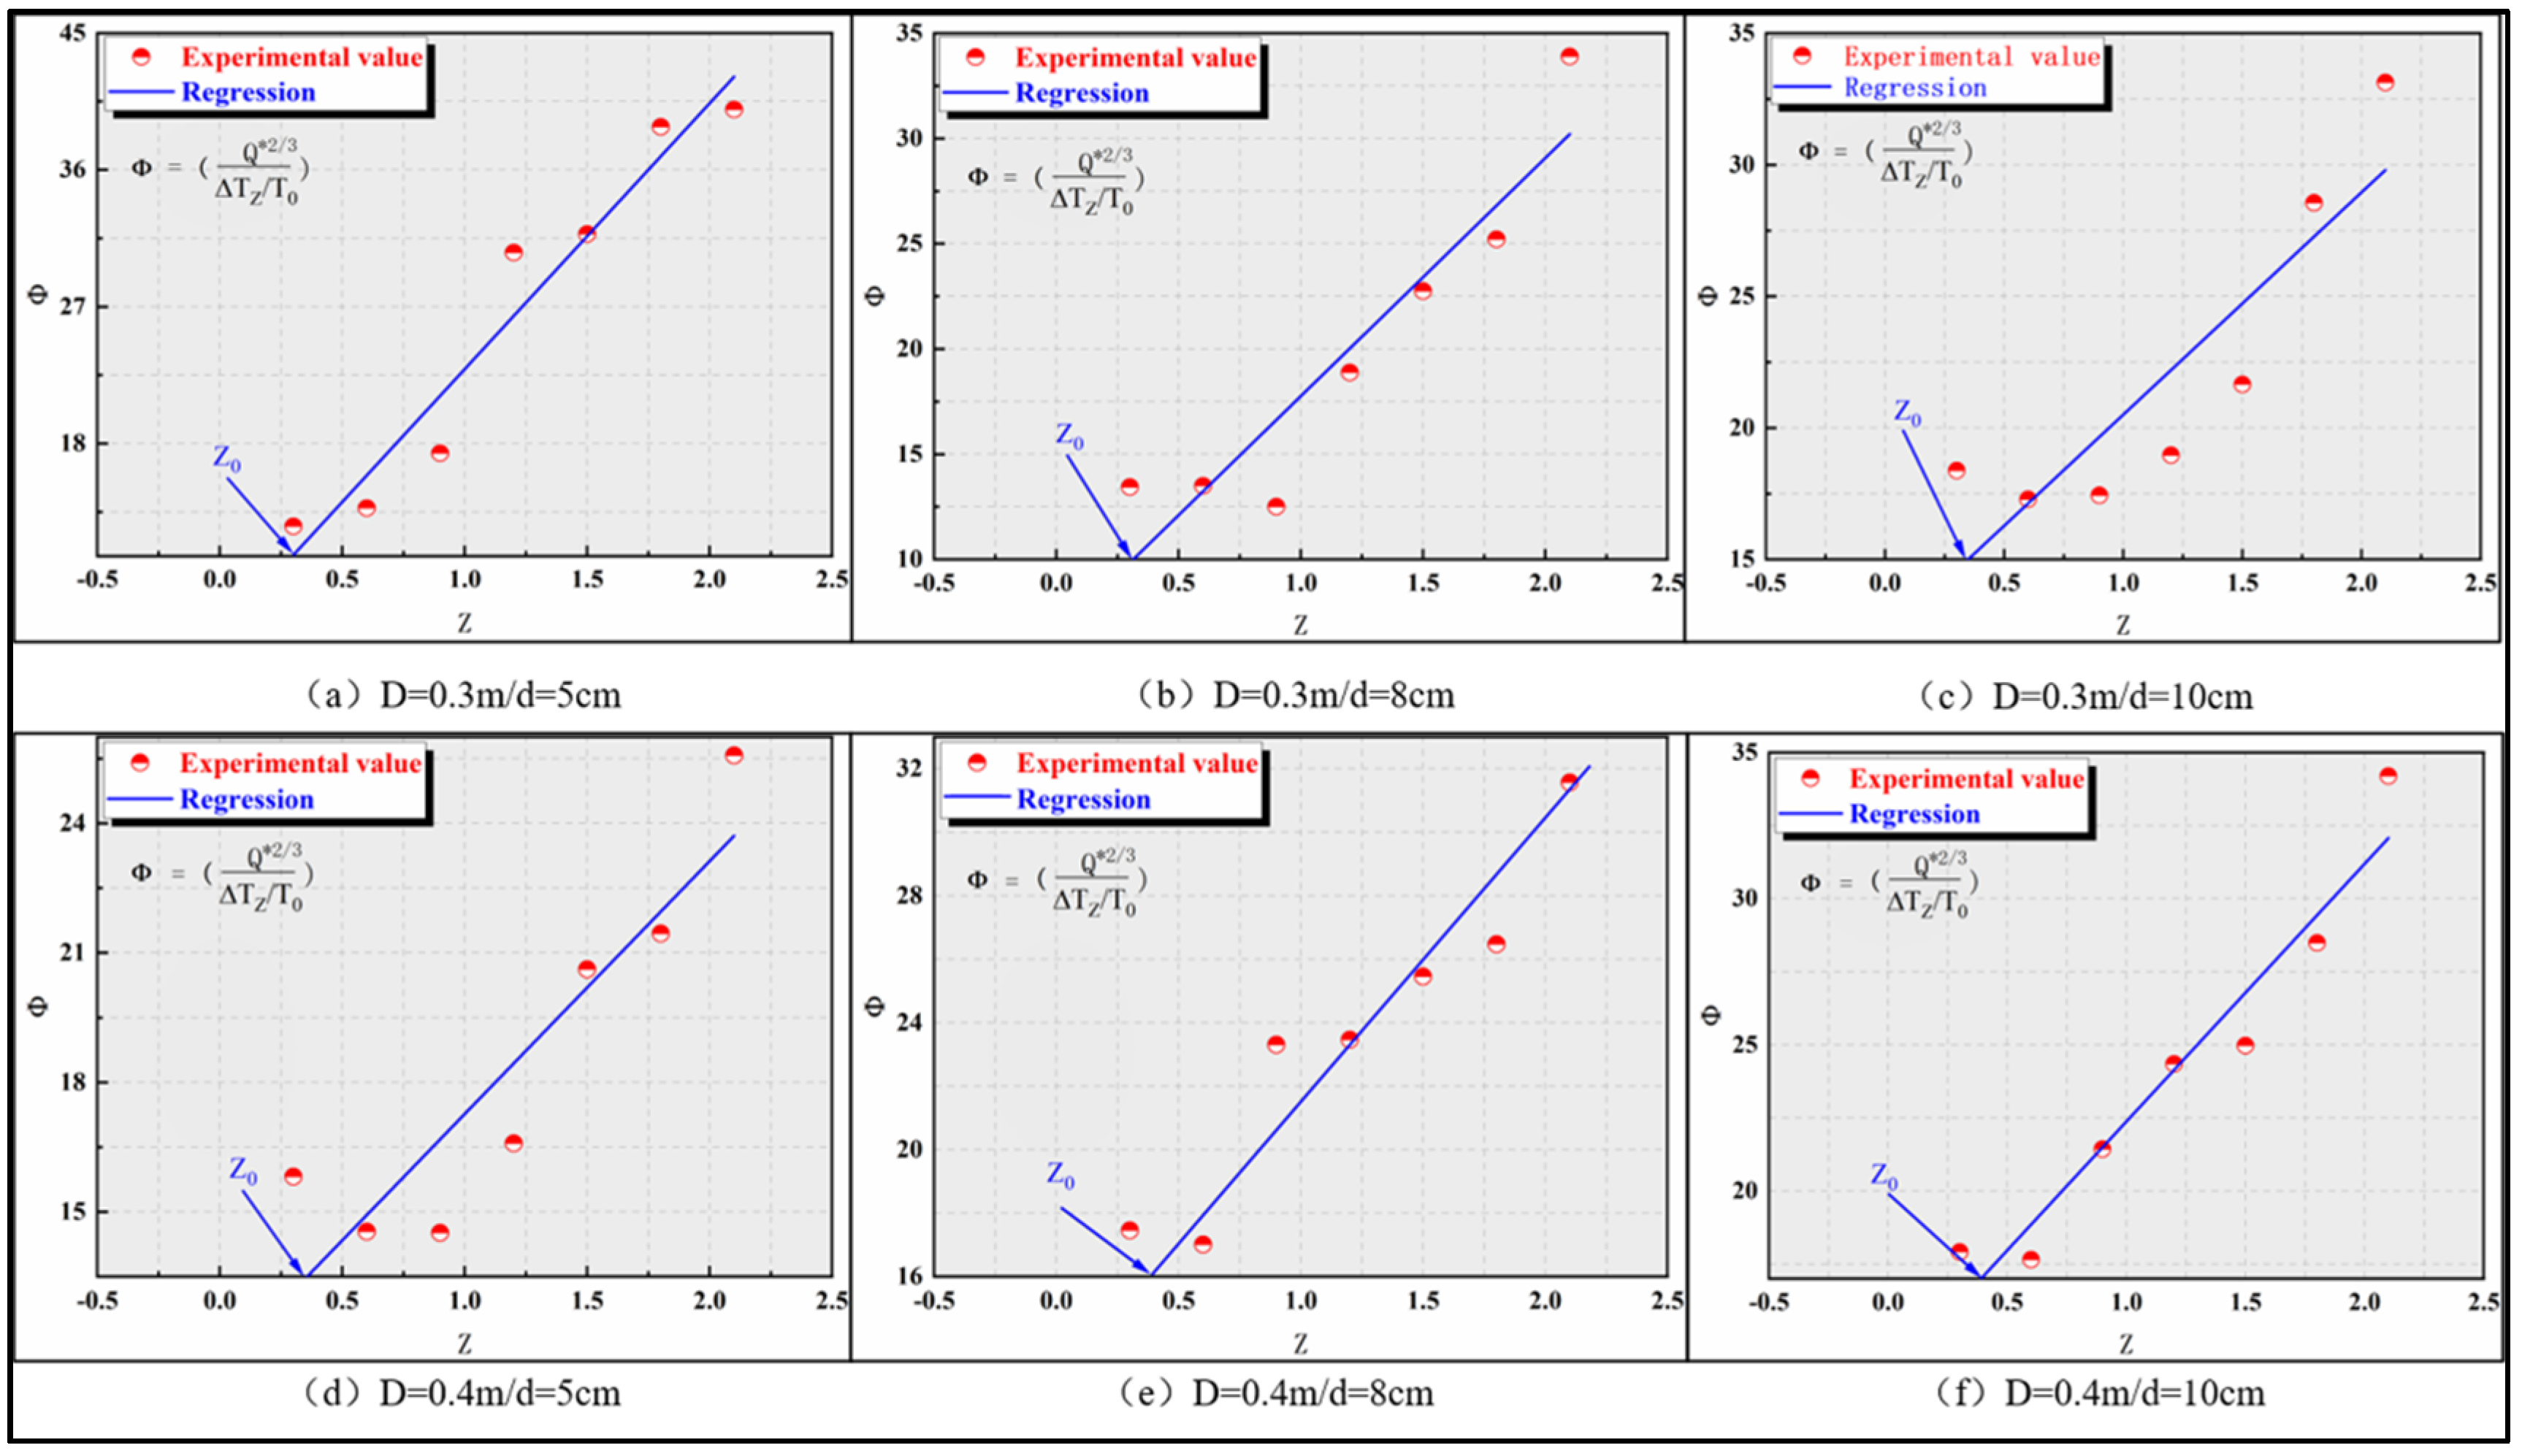
Figure 2 shows the changes in the axial temperature of the fire plume under various operating conditions. According to Figure 2, it can be seen that: (i) The flame temperature changes in all operating conditions are similar, and the temperature is roughly in the range of 320 °C to 950 °C; inside and outside, the heat source is ignited, a jet fire appears near t = 0.4, and then the temperature shows a significant increase and then a slow decrease trend. The flame temperature rise under all working conditions gradually decreases with the increase of height, but there are significant differences in the maximum temperature of jet fire under different working conditions; (ii) When the external heat source is given, the peak jet flame temperature increases with the increase of the inner diameter of the container, and the axial position corresponding to the temperature peak gradually increases. There is a certain impact, but the impact is not as significant as the external heat source; (iii) When the inner diameter of the vessel is given, the peak jet flame temperature increases significantly with the increase of the external heat source, and the height of the flame’s continuous zone and intermittent zone increases accordingly. The flame temperature is mainly affected by three factors: oxygen concentration, combustion reaction rate and carbon black concentration. From the perspective of chemical reaction, jet fire is caused by the combustion reaction between fuel ejected from the nozzle and entrained surrounding oxygen and fuel. When the external heat source and the inner diameter of the container increase, the fuel ejection velocity at the nozzle increases, resulting in a relatively small air-fuel ratio. Oxygen-lean state is not enough to support the complete combustion of the fuel. Under the action of thermal buoyancy and initial momentum, the flame front moves upward. During the upward movement, the fuel reacts with a large amount of entrained oxidant. In this process, the flame height and heat release rate increase with the increase of oxygen concentration and reaction rate. Therefore, the temperature of the fire plume has increased significantly. It can be seen from Figure 2 that the external heat source has a more significant impact on the temperature than the inner diameter of the vessel.
Figure 3 shows the temperature distribution on the axial centerline of the jet fire plume under the condition that the oil pool diameter is 0.4 m and the container inner diameter is 10 cm. After the jet flame becomes the quasi-steady state, it can be seen that the temperature distribution of the centerline of the jet fire plume present an obvious layered state. Audouin [34] uses the flame height to divide the flame area into a continuous flame area, an intermittent flame area and a buoyancy plume area. Combining flame height data of Figure 3 and Figure 4, it shows that the temperature distribution of the centerline of the jet fire plume conforms to the three-zone flame distribution theory.
Flame impact is one of the main hazards of jet flames to personnel and equipment. Flame influence mainly refers to high-temperature flames that directly contact personnel and equipment to cause convective heat transfer and cause thermal hazards [35]. Therefore, a clear understanding of the relationship between the axial centerline temperature of the fire plume and the axial distance can provide important help in reducing fire hazards.
Figure 5 shows the relationship between the axial centerline temperature of the fire plume and the axial position under various operating conditions. It can be seen from Figure 5 that the evolution of the fire plume temperature under various operating conditions is basically the same and the temperature peak appears at the axial position 0.6~0.9 m. However, when comparing the effects of different external heat release rates, it can be clearly found that when the axial position is low, the high external heat release rate is lower and the temperature peak is large. This phenomenon can be attributed to the mixing degree of air and fuel and the heat balance. When the transformer oil two-phase flow fuel is injected into the air environment from the nozzle, the liquid phase needs to be further vaporized and then mixed with oxygen in the environment for combustion. As the external heat release rate increases, the initial momentum of the two-phase flow increases, causing the fuel to take longer to vaporize. Therefore, under the condition of high external heat release rate, the flame temperature is lower at the lower axial position. The mixing mode of air and fuel can be divided into two types: molecular diffusion and air entrainment, while the transformer oil jet fire combustion is turbulent combustion air. Entrainment dominates and air entrainment is the physical basis of vertical temperature attenuation. As the axial position moves up, the high initial momentum increases the air entrainment volume, and the increase in combustion efficiency means the release of more heat. Axial temperature significantly increased. The flame front moves up to a higher position. After the flame rises to a certain height, the fuel flow is cut off by the strong annular vortex and air entrainment cooling. The fuel falls off from the upper part and burns out quickly, causing the flame body to cool, and the fire plume is axially centered. The wire temperature drops.

3.2. Correlations

The axial temperature distribution of the fire plume is affected by many factors. Predecessors obtained the vertical temperature distribution formula by solving the equations of conservation of mass, conservation of momentum and conservation of energy [24]:
T Z T 0 T 0 = K α Q * 2 / 3 D o r 5 / 3 Z 5 / 3
where T Z   is the temperature at the height Z from the nozzle (°C);   T 0 is the ambient temperature (°C);   K   is a constant,   α   is the air entrainment coefficient;   Q *   is the dimensionless fire source power;   D o r   is the nozzle diameter (m); Z   is the height of the thermocouple (m).
Q * = Q ρ C p T 0 ( g D o r ) 1 2 D o r 2
where Q   is the heat release rate; kW,   ρ   is the ambient air density; kg·m−3,   c p   is the specific heat capacity at constant pressure; kJ·kg−1·K−1,   T 0   is the ambient temperature (°C);   g   is the acceleration of gravity, 9.8 m·s−2 [36].
Q = m ˙ × H c
where m ˙   is the mass flow rate (g·s−1);   H c   is the heating value of the fuel, MJ·kg−1.
Due to the initial momentum of jet fire being different from that of oil pool fire, the dimensionless temperature distribution model cannot be directly based on the classic three-stage distribution model of the fire plume. It is necessary to introduce a virtual point source [27] to correct the temperature of the fire plume. The axial height is in the model. The virtual point source is used to illustrate the different buoyancy flux of the fire source. The virtual point source will change with the change of the buoyancy flux. Therefore, the virtual point source is used to correct the axial height, and the corrected height (ZZ0) is brought into the Formula (2) to obtain the Formula (5).
T Z / T 0 Q * 2 / 3 = f u n c t i o n ( Z Z 0 D o r )
where T Z   is the temperature at the height Z from the nozzle (°C); T 0   is the ambient temperature (°C); Q *   is the dimensionless fire source power; D o r is the nozzle diameter (m); Z   is the height of the thermocouple (m); Z 0 is the height of the virtual point source (m).
On the surface of previous studies, the temperature distribution of the axial centerline of the axisymmetric fire source satisfies:
ϕ = Θ 3 / 5 = ( T Z / T 0 Q * 2 / 3 ) 3 / 5 Z Z 0
where T Z   is the temperature at the height Z from the nozzle (°C); T 0   is the ambient temperature (°C); Q *   is the dimensionless fire source power; D o r   is the nozzle diameter (m); Z   is the height of the thermocouple (m); Z 0 is the height of the virtual point source (m).
Figure 6 indicates the value of the virtual point source obtained under various working conditions. By linearly fitting Φ and Z, the intercept between the fitted line and the horizontal axis is the value of the virtual point source (Z0). According to Figure 6, it can be seen that the virtual point source values of the transformer oil jet fire are all on the positive semi-axis of the horizontal axis, indicating that the virtual point source is located above the nozzle in space. When the jet fiery heat release rate increases, the buoyancy of the flame at the flux increases, and the value of the virtual point source increases accordingly.
Using the value of the virtual point source of each working condition, based on the temperature distribution prediction model, a prediction model of the axial centerline temperature distribution of the transformer oil jet fire plume is established [29]:
T Z T 0 T 0 = κ ( ( Z Z 0 ) / D o r Q * 2 / 5 ) η
where T Z   is the temperature at the height Z from the nozzle (°C); T 0   is the ambient temperature (°C); Q *   is the dimensionless fire source power; D o r   is the nozzle diameter (m); Z   is the height of the thermocouple (m); Z 0 is the height of the virtual point source (m); κ is a parameter constant; η is a parameter constant.
Figure 7 shows the dimensionless temperature fitting curve of the jet fire axial centerline. From Figure 7, we can see:
(i)
The temperature data converges well on the fitting curve, and the axial centerline temperature of the jet fire plume presents an obvious three-stage distribution;
(ii)
The continuous flame zone and the intermittent flame zone are narrow, and the temperature in the buoyancy plume zone drops very quickly because of the cooling effect of the entrained air and generated soot on the temperature. Among them, in the intermittent flame zone, the dimensionless temperature and the dimensionless height are in the form of −0.24 power law, and in the intermittent flame zone, the dimensionless temperature and the dimensionless height are in the form of −2 power law. There are deviations in the classic model, which can be attributed to the difference in fuel type. However, the model in this paper can provide a more accurate prediction of the temperature distribution of the transformer oil jet fire. Table 4 shows the fitting results of the centerline axial temperature distribution of the transformer oil jet fire plume.

4. Conclusions

In this paper, a series of transformer jet fire experiments with different external heat sources and different container inner diameters are carried out to study centerline axial temperature distribution of transformer oil jet fire plumes of oil-filled equipment in substations. The axial centerline temperature of the fire plume, the flame visualization image, and the heat release rate under each working condition are measured and analyzed. The main findings are as follows:
(i)
It is found that the fire plume temperature evolution law is basically the same and the temperature peak appears at the axial position 0.6~0.9 m, and the temperature is roughly in the range of 320~950 °C. Under the conditions of high external heat release rate and large container inner diameter, the axial centerline temperature of the fire plume shows an increasing trend, and the influence of the external heat release rate on temperature is more significant than that of the inner diameter of the container, which can be attributed to the degree of fuel mixing and the heat balance of the combustion reaction.
(ii)
The flame height is corrected by the virtual point source, the experimental data of the dimensionless temperature and the dimensionless height are fitted, and the virtual point source of the transformer oil jet fire is located above the nozzle in space. With the increase of fuel mass flow, more fuel participates in chemical combustion reaction, and the position of the virtual point source moves upward along the nozzle under the influence of thermal buoyancy.
(iii)
After the jet flame enters the quasi-steady state, the temperature distribution of the centerline of the fire plume presents an obvious layered state, and the three-stage distribution law of the dimensionless temperature maintenance of the axial centerline of the fire plume is obtained consistent with the classical temperature distribution prediction model. Based on the classic temperature distribution prediction model, a prediction model for the axial temperature distribution of the transformer oil jet fire plume is established.
The research on oil jet fire of transformer oil-filled equipment in substation is of great significance for substation fire prevention and control. However, some conclusions of this paper are only based on different external heat release rates and inner diameter of oil storage tank, and there is a lack of research on other variables, especially the change of pressure at the nozzle having a significant impact on the flame. Therefore, the change of pressure at the nozzle will be the focus of our next research.

Author Contributions

Conceptualization, R.S. and P.C.; methodology, R.S.; software, J.W.; validation, R.S., P.C. and L.W.; formal analysis, X.Y.; investigation, X.Y.; resources, P.C.; data curation, R.S.; writing—original draft preparation, R.S.; writing—review and editing, P.C.; visualization, P.C.; supervision, P.C.; project administration, P.C.; funding acquisition, P.C. All authors have read and agreed to the published version of the manuscript.

Funding

This research was funded by STATE GRID CORPORATION OF CHINA, grant number 8000-201918445A-0-0-00.

Institutional Review Board Statement

Not applicable.

Informed Consent Statement

Not applicable.

Data Availability Statement

The data presented in this study are available on request from the corresponding author. The data are not publicly available due to the original data is used in a complex process.

Acknowledgments

The authors would like to thank the editors and anonymous reviewers for their careful review on the paper.

Conflicts of Interest

The authors declare no conflict of interest.

References

  1. Cannone, N.; Piccinelli, S. Changes of rock glacier vegetation in 25 years of climate warming in the Italian Alps. Catena 2021, 206, 105562. [Google Scholar] [CrossRef]
  2. Christina, A.J.; Salam, M.A.; Rahman, Q.M.; Islam, M.A.; Wen, F.; Ang, S.P.; Hasan, S.; Voon, W. Investigation of failure of high voltage bushing at power transformer. J. Electrost. 2018, 96, 49–56. [Google Scholar] [CrossRef]
  3. Ding, Y.; Mu, C.; Wu, T.; Hu, G.; Zou, D.; Wang, D.; Li, W.; Wu, X. Increasing cryospheric hazards in a warming climate. Earth-Sci. Rev. 2021, 213, 103500. [Google Scholar] [CrossRef]
  4. Rouabeh, J.; M’Barki, L.; Hammami, A.; Jallouli, I.; Driss, A. Studies of different types of insulating oils and their mixtures as an alternative to mineral oil for cooling power transformers. Heliyon 2019, 5, e01159. [Google Scholar] [CrossRef] [Green Version]
  5. Salama, M.M.M.; Mansour, D.-E.A.; Daghrah, M.; Abdelkasoud, S.M.; Abbas, A.A. Thermal performance of transformers filled with environmentally friendly oils under various loading conditions. Int. J. Electr. Power Energy Syst. 2020, 118, 105743. [Google Scholar] [CrossRef]
  6. Shi, S.; Liu, G.; Li, Z.; Ye, X. Elevation-dependent growth trends of forests as affected by climate warming in the southeastern Tibetan Plateau. For. Ecol. Manag. 2021, 498, 119551. [Google Scholar] [CrossRef]
  7. Zeng, J.; Tong, W.; Tang, T. How do energy policies affect industrial green development in China: Renewable energy, energy conservation, or industrial upgrading? Chin. J. Popul. Resour. Environ. 2020, 18, 79–86. [Google Scholar] [CrossRef]
  8. Zhang, G.; Nan, Z.; Zhao, L.; Liang, Y.; Cheng, G. Qinghai-Tibet Plateau wetting reduces permafrost thermal responses to climate warming. Earth Planet. Sci. Lett. 2021, 562, 116858. [Google Scholar] [CrossRef]
  9. Gómez-Mares, M.; Zárate, L.; Casal, J. Jet fires and the domino effect. Fire Saf. J. 2008, 43, 583–588. [Google Scholar] [CrossRef]
  10. Bradley, D.; Gaskell, P.H.; Gu, X.; Palacios, A. Jet flame heights, lift-off distances, and mean flame surface density for extensive ranges of fuels and flow rates. Combust. Flame 2016, 164, 400–409. [Google Scholar] [CrossRef]
  11. Liu, J.; Zhang, X.; Xie, Q. Flame geometrical characteristics of downward sloping buoyant turbulent jet fires. Fuel 2019, 257, 116112. [Google Scholar] [CrossRef]
  12. Palacios, A.; Casal, J. Assessment of the shape of vertical jet fires. Fuel 2011, 90, 824–833. [Google Scholar] [CrossRef]
  13. Palacios, A.; García, W.; Rengel, B. Flame shapes and thermal fluxes for an extensive range of horizontal jet flames. Fuel 2020, 279, 118328. [Google Scholar] [CrossRef]
  14. Palacios, A.; Rengel, B. Flame shapes and thermal flux of vertical hydrocarbon flames. Fuel 2020, 276, 118046. [Google Scholar] [CrossRef]
  15. Wang, Z.; Jiang, K.; Zhao, K.; Guo, P. Macroscopic characteristics and prediction model of horizontal extension length for syngas jet flame under inclined conditions. Int. J. Hydrogen Energy 2021, 46, 23091–23099. [Google Scholar] [CrossRef]
  16. Zhou, K.; Wang, Y.; Zhang, L.; Wu, Y.; Nie, X.; Jiang, J. Effect of nozzle exit shape on the geometrical features of horizontal turbulent jet flame. Fuel 2020, 260, 116356. [Google Scholar] [CrossRef]
  17. Gómez-Mares, M.; Muñoz, M.; Casal, J. Radiant heat from propane jet fires. Exp. Therm. Fluid Sci. 2010, 34, 323–329. [Google Scholar] [CrossRef] [Green Version]
  18. Hu, L.; Wang, Q.; Delichatsios, M.; Lu, S.; Tang, F. Flame radiation fraction behaviors of sooty buoyant turbulent jet diffusion flames in reduced- and normal atmospheric pressures and a global correlation with Reynolds number. Fuel 2014, 116, 781–786. [Google Scholar] [CrossRef]
  19. Kozanoglu, B.; Zarate, L.; Gomez-Mares, M.; Casal, J. Convective heat transfer around vertical jet fires: An experimental study. J. Hazard. Mater. 2011, 197, 104–108. [Google Scholar] [CrossRef]
  20. Lowesmith, B.J.; Hankinson, G. Large scale high pressure jet fires involving natural gas and natural gas/hydrogen mixtures. Process. Saf. Environ. Prot. 2012, 90, 108–120. [Google Scholar] [CrossRef]
  21. Palacios, A.; Muñoz, M.; Darbra, R.M.; Casal, J. Thermal radiation from vertical jet fires. Fire Saf. J. 2012, 51, 93–101. [Google Scholar] [CrossRef]
  22. Zhang, B.; Liu, Y.; Laboureur, D.; Mannan, M.S. Experimental Study on Propane Jet Fire Hazards: Thermal Radiation. Ind. Eng. Chem. Res. 2015, 54, 9251–9256. [Google Scholar] [CrossRef]
  23. Gomez-Mares, M.; Munoz, M.; Casal, J. Axial temperature distribution in vertical jet fires. J. Hazard. Mater. 2009, 172, 54–60. [Google Scholar] [CrossRef]
  24. Hu, L.; Wang, Q.; Tang, F.; Delichatsios, M.; Zhang, X. Axial temperature profile in vertical buoyant turbulent jet fire in a reduced pressure atmosphere. Fuel 2013, 106, 779–786. [Google Scholar] [CrossRef]
  25. Tao, C.; Qian, Y.; Tang, F.; Wang, Q. Experimental investigations on temperature profile and air entrainment of buoyancy-controlled jet flame from inclined nozzle bounded the wall. Appl. Therm. Eng. 2017, 111, 510–515. [Google Scholar] [CrossRef]
  26. Zhang, X.; Hu, L.; Zhu, W.; Zhang, X.; Yang, L. Axial temperature profile in buoyant plume of rectangular source fuel jet fire in normal- and a sub-atmospheric pressure. Fuel 2014, 134, 455–459. [Google Scholar] [CrossRef]
  27. Heskestad, G. Virtual Origins of Fire Plumes. Fire Saf. J. 1983, 5, 109–114. [Google Scholar] [CrossRef]
  28. Wang, Z.; Zhou, K.; Zhang, L.; Nie, X.; Wu, Y.; Jiang, J.; Dederichs, A.S.; He, L. Flame extension area and temperature profile of horizontal jet fire impinging on a vertical plate. Process. Saf. Environ. Prot. 2021, 147, 547–558. [Google Scholar] [CrossRef]
  29. McCaffrey, B.J. Purely Buoyant Diffusion Flames Some Experimental Results National Bureau of Standards. NBSIR 1979, 79–1910. [Google Scholar]
  30. Zukoski, E.; Kubota, T.; Cetegen, B. Entrainment in fire plumes. Fire Saf. J. 1981, 3, 107–121. [Google Scholar] [CrossRef]
  31. Gao, Z.H.; Liu, Z.X.; Wan, H.X.; Zhu, J.P. Experimental study on longitudinal and transverse temperature distribution of sidewall confined ceiling jet plume. Appl. Therm. Eng. 2016, 107, 583–590. [Google Scholar] [CrossRef]
  32. Otsu, N. A Threshold Selection Method from Gray-level Histograms. IEEE Trans. Syst. Man Cybern. 1975, 1, 62–66. [Google Scholar] [CrossRef] [Green Version]
  33. Zhao, J.; Wang, S.; Zhang, J.; Zhou, R.; Yang, R. Experimental Study on the Burning Characteristics of Transformer Oil Pool Fires. Energy Fuels 2020, 34, 4967–4976. [Google Scholar] [CrossRef]
  34. Audouin, L.; Kolb, G.; Torero, J.L.; Most, J.M. Average centerline temperatures of a buoyant pool fire obtained by image processing of video recordings. Fire Saf. J. 1995, 24, 167–187. [Google Scholar] [CrossRef]
  35. Zhang, Q.; Liang, D.; Wen, J. Experimental study of flashing LNG jet fires following horizontal releases. J. Loss Prev. Process. Ind. 2019, 57, 245–253. [Google Scholar] [CrossRef] [Green Version]
  36. Heskestad, G. On Q* and the Dynamics of Turbulent Diffusion Flames. Fire Saf. J. 1998, 30, 215–227. [Google Scholar] [CrossRef]
Figure 1. Schematic diagram of the experimental system.
Processes 09 01460 g001
Figure 2. Axial temperature variation of fire plume under different working conditions (Time (-) = Treal/Ttotal).
Processes 09 01460 g002
Figure 3. Temperature distribution measured along the central axis of the jet fire (D = 0.4 m/d = 10 cm).
Processes 09 01460 g003
Figure 4. Flame height evolution of the jet fire (D = 0.4 m/d = 10 cm).
Processes 09 01460 g004
Figure 5. Relationship between axial flame plume temperature and axial position under various conditions.
Processes 09 01460 g005
Figure 6. Location of virtual point source under various working conditions.
Processes 09 01460 g006
Figure 7. Correlation of dimensionless axial temperature profile for jet fires.
Processes 09 01460 g007
Table 1. Summary of the experimental conditions.
EXP. IDInternal Diameter (cm)Pool Diameter (m)Nozzle Diameter (mm)
150.35
250.35
350.35
480.35
580.35
680.35
7100.35
8100.35
9100.35
1050.4
1150.45
1250.45
1380.45
1480.45
1580.45
16100.45
17100.45
18100.45
Table 2. Parameters of oil storage tank.
TankHeight (cm)Internal Diameter (cm)Thickness (cm)Bracket Height (cm)Bracket Diameter (cm)
No.1/2/38/12.8/165/8/100.521.5
Table 3. Environment conditions.
PropertiesValue
Air temperature (°C)25 ± 3
Relative humidity (%)70 ± 10
Wind speed (m·s−1)0
Wind direction/
Rain (mm)0
Air pressure (kPa)101 ± 5
Table 4. Correlation results of the constants.
Constantsκη
Continuous flame310
Intermittent flame44.1−0.24
Buoyant plume182−2
Note: Parameter constant (κ); parameter constant (η).
Publisher’s Note: MDPI stays neutral with regard to jurisdictional claims in published maps and institutional affiliations.

