Article

Characterizations of Polypropylene/Single-Walled Carbon Nanotube Nanocomposites Prepared by the Novel Melt Processing Technique with a Controlled Residence Time

1
Korea Packaging Center, Korea Institute of Industrial Technology, Bucheon 14449, Korea
2
Department of Chemical Engineering, Keimyung University, Daegu 42601, Korea
3
Department of Chemical and Biological Engineering, Korea University, Seoul 02841, Korea
*
Author to whom correspondence should be addressed.
This author contributes equally to this work.
Processes 2021, 9(8), 1395; https://doi.org/10.3390/pr9081395
Submission received: 7 July 2021 / Revised: 9 August 2021 / Accepted: 9 August 2021 / Published: 12 August 2021

Abstract

:
Melt processing is considered one of the favored techniques to produce polymer nanocomposites with various inorganic fillers such as graphene and carbon nanotubes (CNTs). Due to their superior conductivity and tensile properties, among others, CNTs have been applied in broad applications. When a low filler fraction is desired, a high degree of dispersion is required in order to benefit from the intrinsic properties of CNTs. However, due to their high cohesive energy, dispersing CNTs in polymer melts is a difficult task. This study employed the melt mixing technique with a controlled residence time of 20 min to disperse single-walled carbon nanotubes (SWNTs) into a polypropylene matrix. The composites were prepared by using a corotating twin-screw extruder equipped with a back-conveying element with varying amounts of SWNTs from 0.29 to 6.56 wt.%. Mechanical, electrical, morphological, and rheological properties were evaluated. Due to the filler effect, storage, loss modulus, and complex viscosity increased with the SWNT content. Based on the van Gurp–Palmen plot, 0.29 wt.% SWNTs was the rheological percolation threshold, and the electrical property measurement revealed a 1.4 wt.% SWNT electrical percolation threshold based on the statistical percolation theory. Relatively large agglomerates were found when the SWNT content increased more than 1.28 wt.%.

1. Introduction

The development of new functional polymer materials is often accomplished by several strategies, such as the mixing of a conventional matrix polymer with other polymer components (polymer blends) and/or solid fillers (composites). The advantage of this method and such composites has resulted in better conditions for market launch and higher customer satisfaction compared to homopolymers [1].
Carbon nanotubes (CNTs) are prominent fillers. Following their first detailed description in the scientific literature in 1991, these “coaxial tubes of graphitic sheets” [2] attracted the attention of the wider scientific community and found practical application due to their outstanding performance, especially their electrical [3,4,5,6,7,8], thermal [9,10,11,12], and mechanical properties [12,13,14,15,16,17,18,19].
Because of these excellent properties, CNTs are utilized in a variety of technologically important applications, such as automotive and aerospace engineering, defense, electronics, energy, and sporting goods [20]. With their popularity, the global production of CNTs has already exceeded the kiloton level and is expected to more than double in the next 4 years due to the increasing production of existing manufacturers and the emergence of new manufacturers [21].
As CNTs tend to form strong agglomerates caused by physical interactions such as van der Waals forces, several methods have been applied to disperse and distribute these primary agglomerates in order to utilize the benefits of the properties of individual CNTs. Depending on the nature of the polymer, various processing techniques, such as high-shear mixing [22], electrospinning [23], surfactant-assisted processing [24], in situ polymerization [25], latex fabrication [26], and melt processing [1,27,28,29], can be found in the literature. Among these, melt processing is the preferred method for the processing of thermoplastic-based composites and is highly relevant for industrial applications.
For industrial applications of the melt mixing process, two-step masterbatch (MB) dilution is considered a favorable option over direct nanotube incorporation. In order to create electrically percolated networks within CNT composites, the secondary agglomeration of individualized CNTs is important and has been explained in many studies [27,28,29,30,31]. Secondary agglomeration, however, requires well-dispersed CNT masterbatches, which should be generated from the masterbatch production step.
When it comes to the melt mixing process of masterbatches, processing conditions need to be considered, namely rotation speed, residence time, and temperature profile. Among these factors, it is often reported that rotation speed (shear stress) is highly significant for better dispersion of CNTs in polymer matrices [1,22,27,32]. Kasaliwal et al. [27] applied the response surface methodology to investigate the effect of temperature and rotation speed on the dispersion of multiwalled CNTs (MWNTs) in polycarbonate (PC). It was found that the dispersion of MWNTs improved linearly with increasing rotation speed, whereas temperature was not significant. Villmow et al. [1] discussed the influence of extrusion conditions, screw configuration, throughput, and rotation speed. It was revealed that rotation speed has a high influence on the macrodispersion of MWNTs in polycaprolactone (PCL). Verma et al. [33] applied the melt recirculation approach to prepare MCNT/PPC composites containing up to 15 wt.% of two different aspect ratios of MCNTs. It was found that these composites display a very low percolation threshold and an improvement in tensile strength.
Polypropylene (PP) homopolymer is a nonpolar partial crystalline polymer that has a lower density, higher melting temperature, higher heat resistance, and higher stiffness than low- and high-density polyethylene (LDPE and HDPE, respectively) [34]. Thus, PP has been popularly used as a matrix to reinforce both single-walled CNTs (SWNTs) [35,36,37] and MWNTs [38,39,40], whereas, due to their high interfacial energy with CNTs (≈10 mJ/m2) compared to polar polymers such as polycarbonate (≈2.4 mJ/m2) [41], CNTs are difficult to disperse in PP, resulting in the further physical or chemical modification of CNTs or PP. Chemical or physical modifications of CNTs and PP, however, are not suitable for industrial applications.
According to the aforementioned studies, it is well known that the most important factors for achieving good dispersion of CNTs are high mixing energy and long residence time, resulting in two dominant dispersion mechanisms: rupture and erosion [42,43]. In particular, the long residence time induces an erosion mechanism toward the agglomeration of CNTs. In order to utilize the benefits of the long residence time, in this study, a specially designed corotating twin-screw compounder with a back-conveying element and a closed plate is used. With a controlled residence time of 20 min, PP/SWNT composites with varying amounts of SWNTs (0.29, 0.43, 0.62, 1.28, 2.94, 3.66, 4.29, 4.90, and 6.56 wt.%) were prepared. To evaluate the dispersion state of SWNTs, rheological, morphological, electrical, and mechanical properties were measured.

2. Materials and Methods
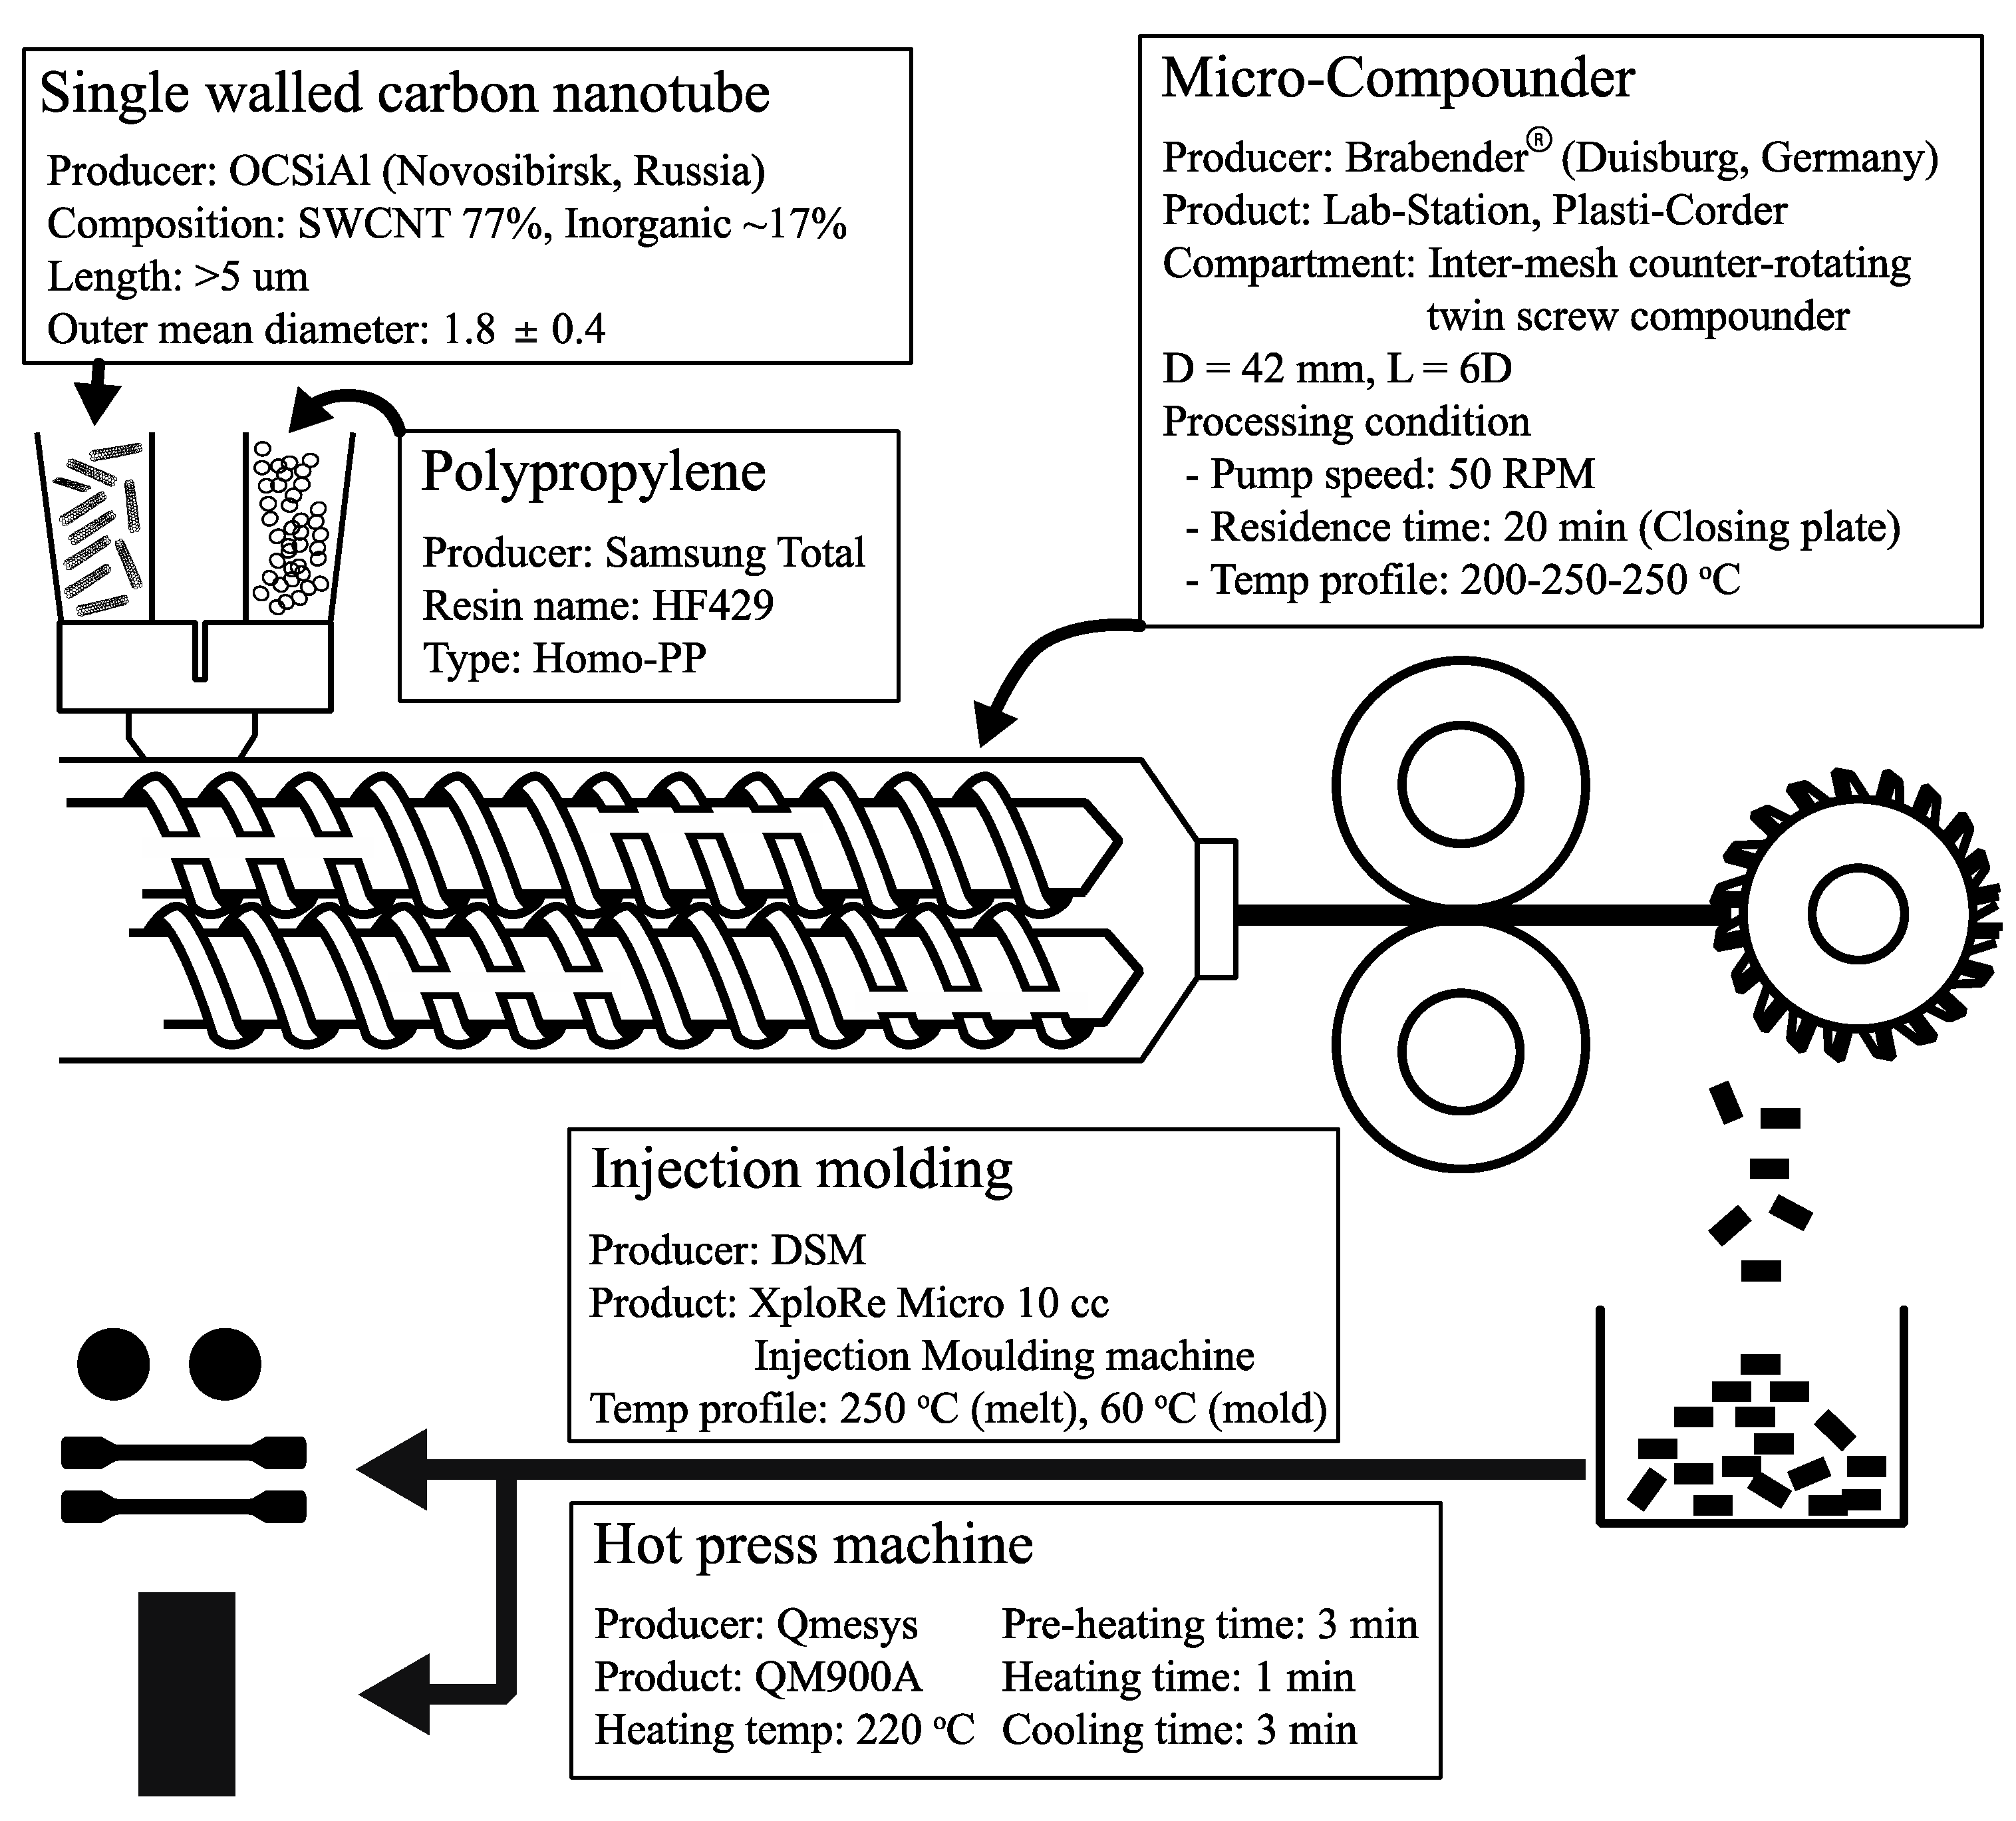
2.1. Materials

PP (HF 429, Samsung Total, Daesan, Korea) with a melt flow index of 8 g/10 min at 240 °C and a melting temperature of 239.4 ± 0.23 °C was used as the matrix. Nonfunctionalized, commercially available single-walled carbon nanotubes (TUBALLTM; OCSiAl Korea, Incheon, Korea) were used without further purification. According to the specifications provided by the manufacturer, TUBALLTM has more than 85% carbon purity. The outer mean nanotube diameter is 1.8 ± 0.4 nm and longer than the 5 µm length of the nanotube.

2.2. Sample Preparation

A schematic diagram of the sample preparation is illustrated in Figure 1. A Brabender microcompounder TSC 42/6 (Brabender®, Duisburg, Germany), designed with a small-scale, conical, counter-rotating twin-screw compounder with a barrel capacity of 50 g and a screw diameter of 42 mm (L/D = 6), was used. Based on the PP specifications provided by the manufacturer and preliminary experiments, PP/SWNT composites were produced under a barrel temperature of 250 °C, a rotation speed of 50 rpm, and a residence time of 20 min. The concentrations of SWNTs in the PP matrix were 0.3, 0.5, 0.8, 1.2, 3, 3.5, 4, 5, and 7 wt.%.
In order to estimate the shear stress of the composite melt inside the barrel, the specific mechanical energy (SME) was calculated using Equation (1), where the drive torque τ (kJ), rotation speed N (min−1), and throughput m ˙ (kg/min) are involved. This parameter is considered to explain the good characterization of the extrusion process.
SME = τ N m ˙ ( k J / k g )
In this study, drive torque τ was obtained from the compounder, throughput m ˙ was averaged at 0.0017 ± 0.0002 kg/min, and rotation speed N was fixed at 50 min−1.
After pelletizing, the amount of CNTs in the composite granules was analyzed using a thermogravimetric analyzer (TGA) (Model: TGA Q500, TA Instrument, New Castle, DE, USA)). Pelletized granules were cryofractured to observe the dispersion state of SWNTs.
After that, the composite granules were compression molded to measure morphological and electrical properties and injection molded to measure mechanical and rheological properties. Compression molding was performed using a QMESYS hot press (Model: QM900A, Quality & Measurement System, Uiwang, Korea). Molding was carried out at 220 °C with a preheating time of 3 min, a pressing time of 1 min, and a cooling time of 3 min. For accurate characteristic measurement, it was necessary to prepare specimens with a consistent shape and size. Thus, the composite granules were also injection molded at 250 °C using the Xplore Micro 10cc Injection Molding Machine (Xplore Instruments, Geleen, The Netherlands) into test samples with a disk shape diameter of 25.4 mm, a 1 mm thickness, and a “dogbone” shape with size in accordance with ASTM D638.

2.3. Characterization

2.3.1. Rheological Measurements

Oscillatory shear measurements and stress relaxation in the linear viscoelastic (LVE) region were carried out on an Anton Paar oscillation rheometer (Model: Physica MCR 302, Anton Paar GmbH, Graz, Austria) using a parallel plate geometry (diameter = 25 mm, gap = 1 mm) at 200 °C on samples previously compression molded into a disk shape. Frequency sweeps were performed after approximately 3 min of temperature equilibration with decreasing frequency from 100 to 0.1 rad/s and strains at 1%. According to Kasaliwal et al. [44], it was observed that increasing the matrix molecular weight produced larger undispersed agglomerates. Thus, different residence times were tested to lower the molecular weight of PP, which was evaluated using the stress relaxation spectrum. The conversion of the stress relaxation spectrum to MWD was performed using RheoCompassTM software (v1.30.1064, Anton Paar GmbH, Graz, Austria). Specifically, it used one of the modulus models, which can be expressed in terms of the relaxation modulus G(t). This model converts the relaxation spectrum from the time domain to the molecular weight domain to recover the MWD curve using a regularized integral inversion, as shown in Equation (2).
G ( t ) G N 0 = ( ln ( M e ) F 1 / β ( t , M ) w ( M ) d ( ln M ) ) β
where G N 0 is the plateau modulus to normalize G(t), F(t,M) is a kernel function describing the relaxation behavior of molecular weight M, and w(M) is the weight fraction of the MWD function. The exponent β is a parameter that corresponds to the mixing behavior of the chains. Me is the average molecular weight between entanglements. Based on material and calculation parameters incorporated in the software, kernel functions β and Me of PP were single exponentials, 2.5 and 3500 g/mol, respectively.

2.3.2. Morphological Measurements

The state of the macrodispersion of the compression-molded sample was analyzed by optical microscopy. Light transmission microscopy (Model: KYENCE VK-X200K, KEYENCE, Itasca, IL, USA) was performed using a 10× objective magnification and an optical laser with a 408 nm violet laser. Particle analysis using the incorporated software developed by KYENCE was performed in order to quantify the area fraction AA of undispersed primary SWNT agglomerates according to Equation (3) [1].
A A ( % ) = A C N T A 0 × 100
where ACNT is the area of primary SWNT agglomerates, and A0 is the overall micrograph area. According to ISO 18553, agglomerates with diameters smaller than 5 µm were neglected. In order to increase the analyzed size of the micrograph area, 3 different areas of each sample were captured.
Additionally, field emission scanning electron microscopy (Model: HITACHI-SU8020, Hitachi, Ltd., Tokyo, Japan) was used for the direct observation of PP/SWNT composites. Palletized composite granules were cryofractured after freezing in liquid nitrogen. A thin layer of carbon was sputter deposited onto the sample. Measurement was performed under high vacuum with an acceleration voltage of 2 kV.

2.3.3. Mechanical Measurements

Dog-bone-shaped samples were injection molded (50 mm in length, 4 mm in width, and 2 mm in thickness) and were tested on an INSTRON 3367 (INSTRON, Norwood, MA, USA) equipped with a 1 kN cell force, measuring force over displacement for each sample at 10 mm/min. At least 3 samples were tested for each composite and tensile stress and strain at yield point obtained from the raw data. One-way ANOVA and Tukey’s honestly significant difference (HSD) test were performed to conduct the multiple comparisons of each experimental data set (α = 0.05) with R software (version 3.0.2).

2.3.4. Electrical Measurements

In-plane electrical conductivity measurements were made on compression-molded square plates in accordance with ASTM D4496-13. At least 10 measurements were made on samples to obtain the geometric mean value with the associated standard deviation of resistivity. The AiT resistivity measurement system (Model: CMT-SR1000N, Advanced Instrument Technology, Suwon, Korea), equipped with a 4-point probe with a sheet resistance measurement range between 1 m Ω/square and 2 M Ω/square and pin spacing of 20–50 mm, was used. The statistical percolation theory predicts the relationship between the electrical resistivity of the composite and the filler concentration using Equation (4) [45]:
σ = σ 0 ( Φ Φ C ) t
where σ is the composite volume resistivity, σ 0 is the volume resistivity of the filler, and Φ , Φ C , and t are the fraction of filler, percolation threshold, and critical exponent, respectively. The critical exponent t is expected to depend on the system dimensionality with calculated values of t ≈ 1.33 in two and t ≈ 2 in three dimensions [46,47]. By fitting the experimental results in the linear regression of log σ and log ( Φ Φ C ) , the percolation threshold and the critical exponent were calculated. In this study, the final critical exponent t was calculated as 2.05, representing the three dimensions of the SWNT percolation network.

3. Results and Discussion

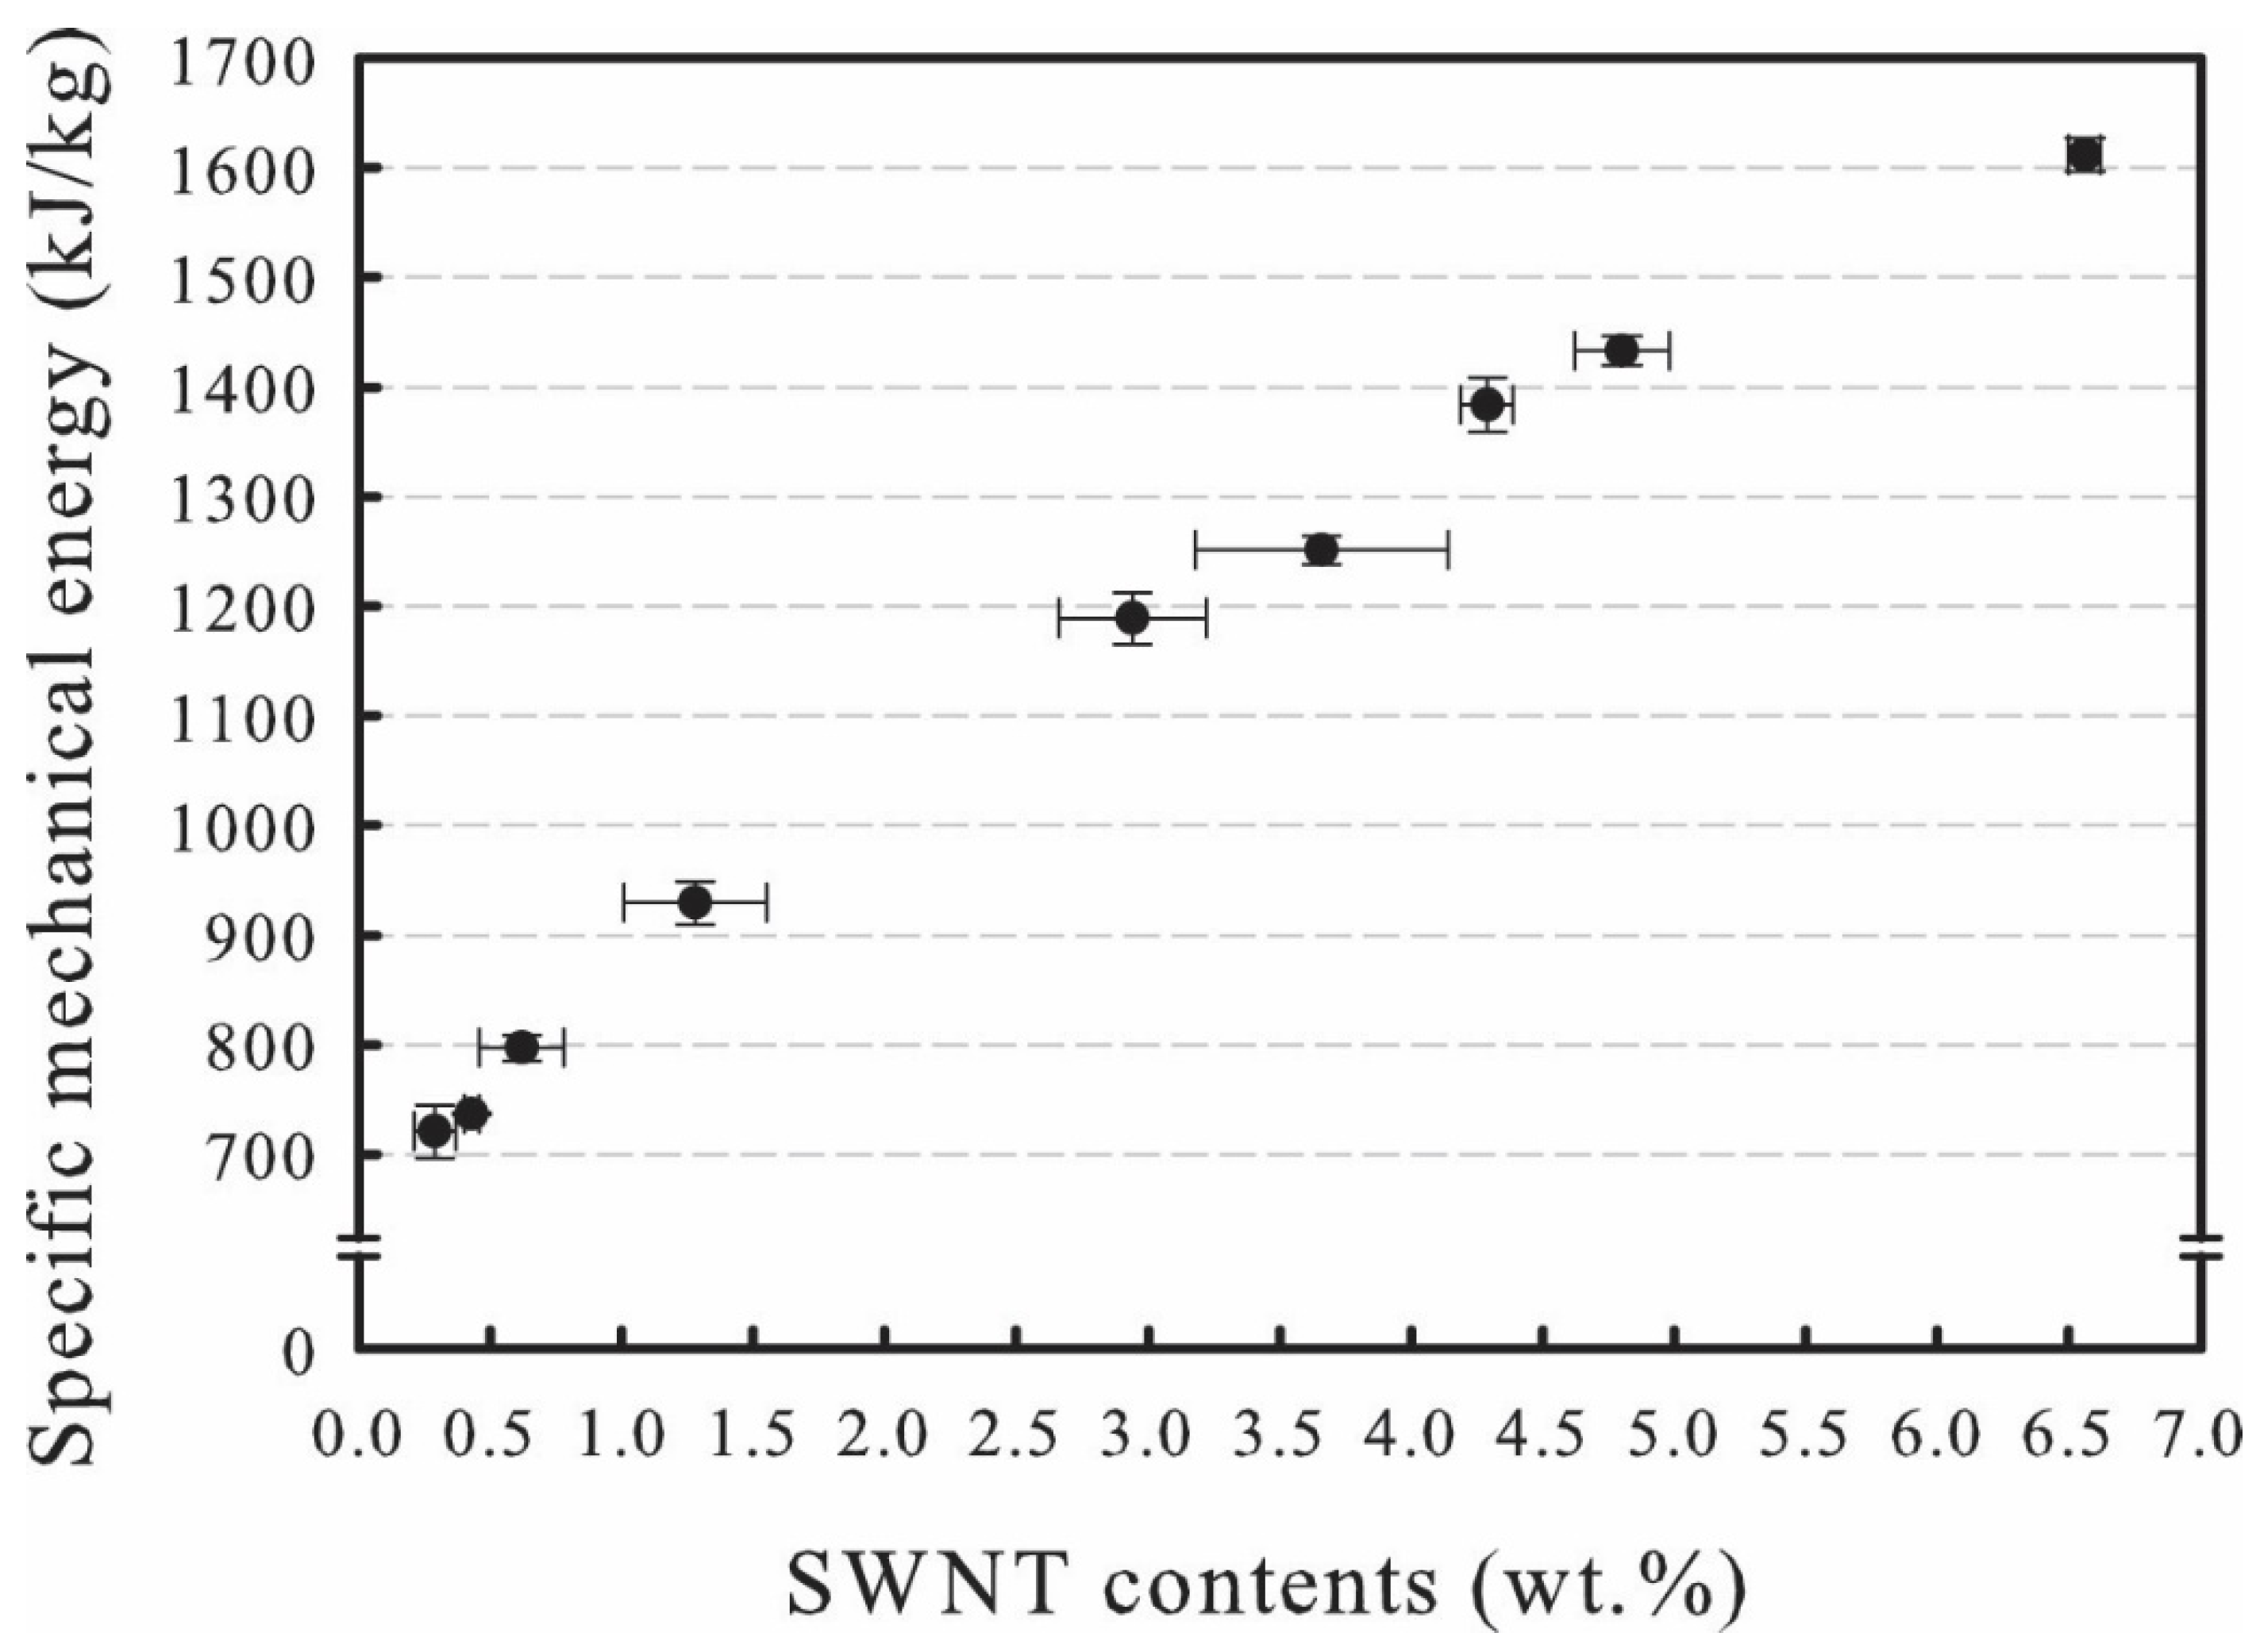
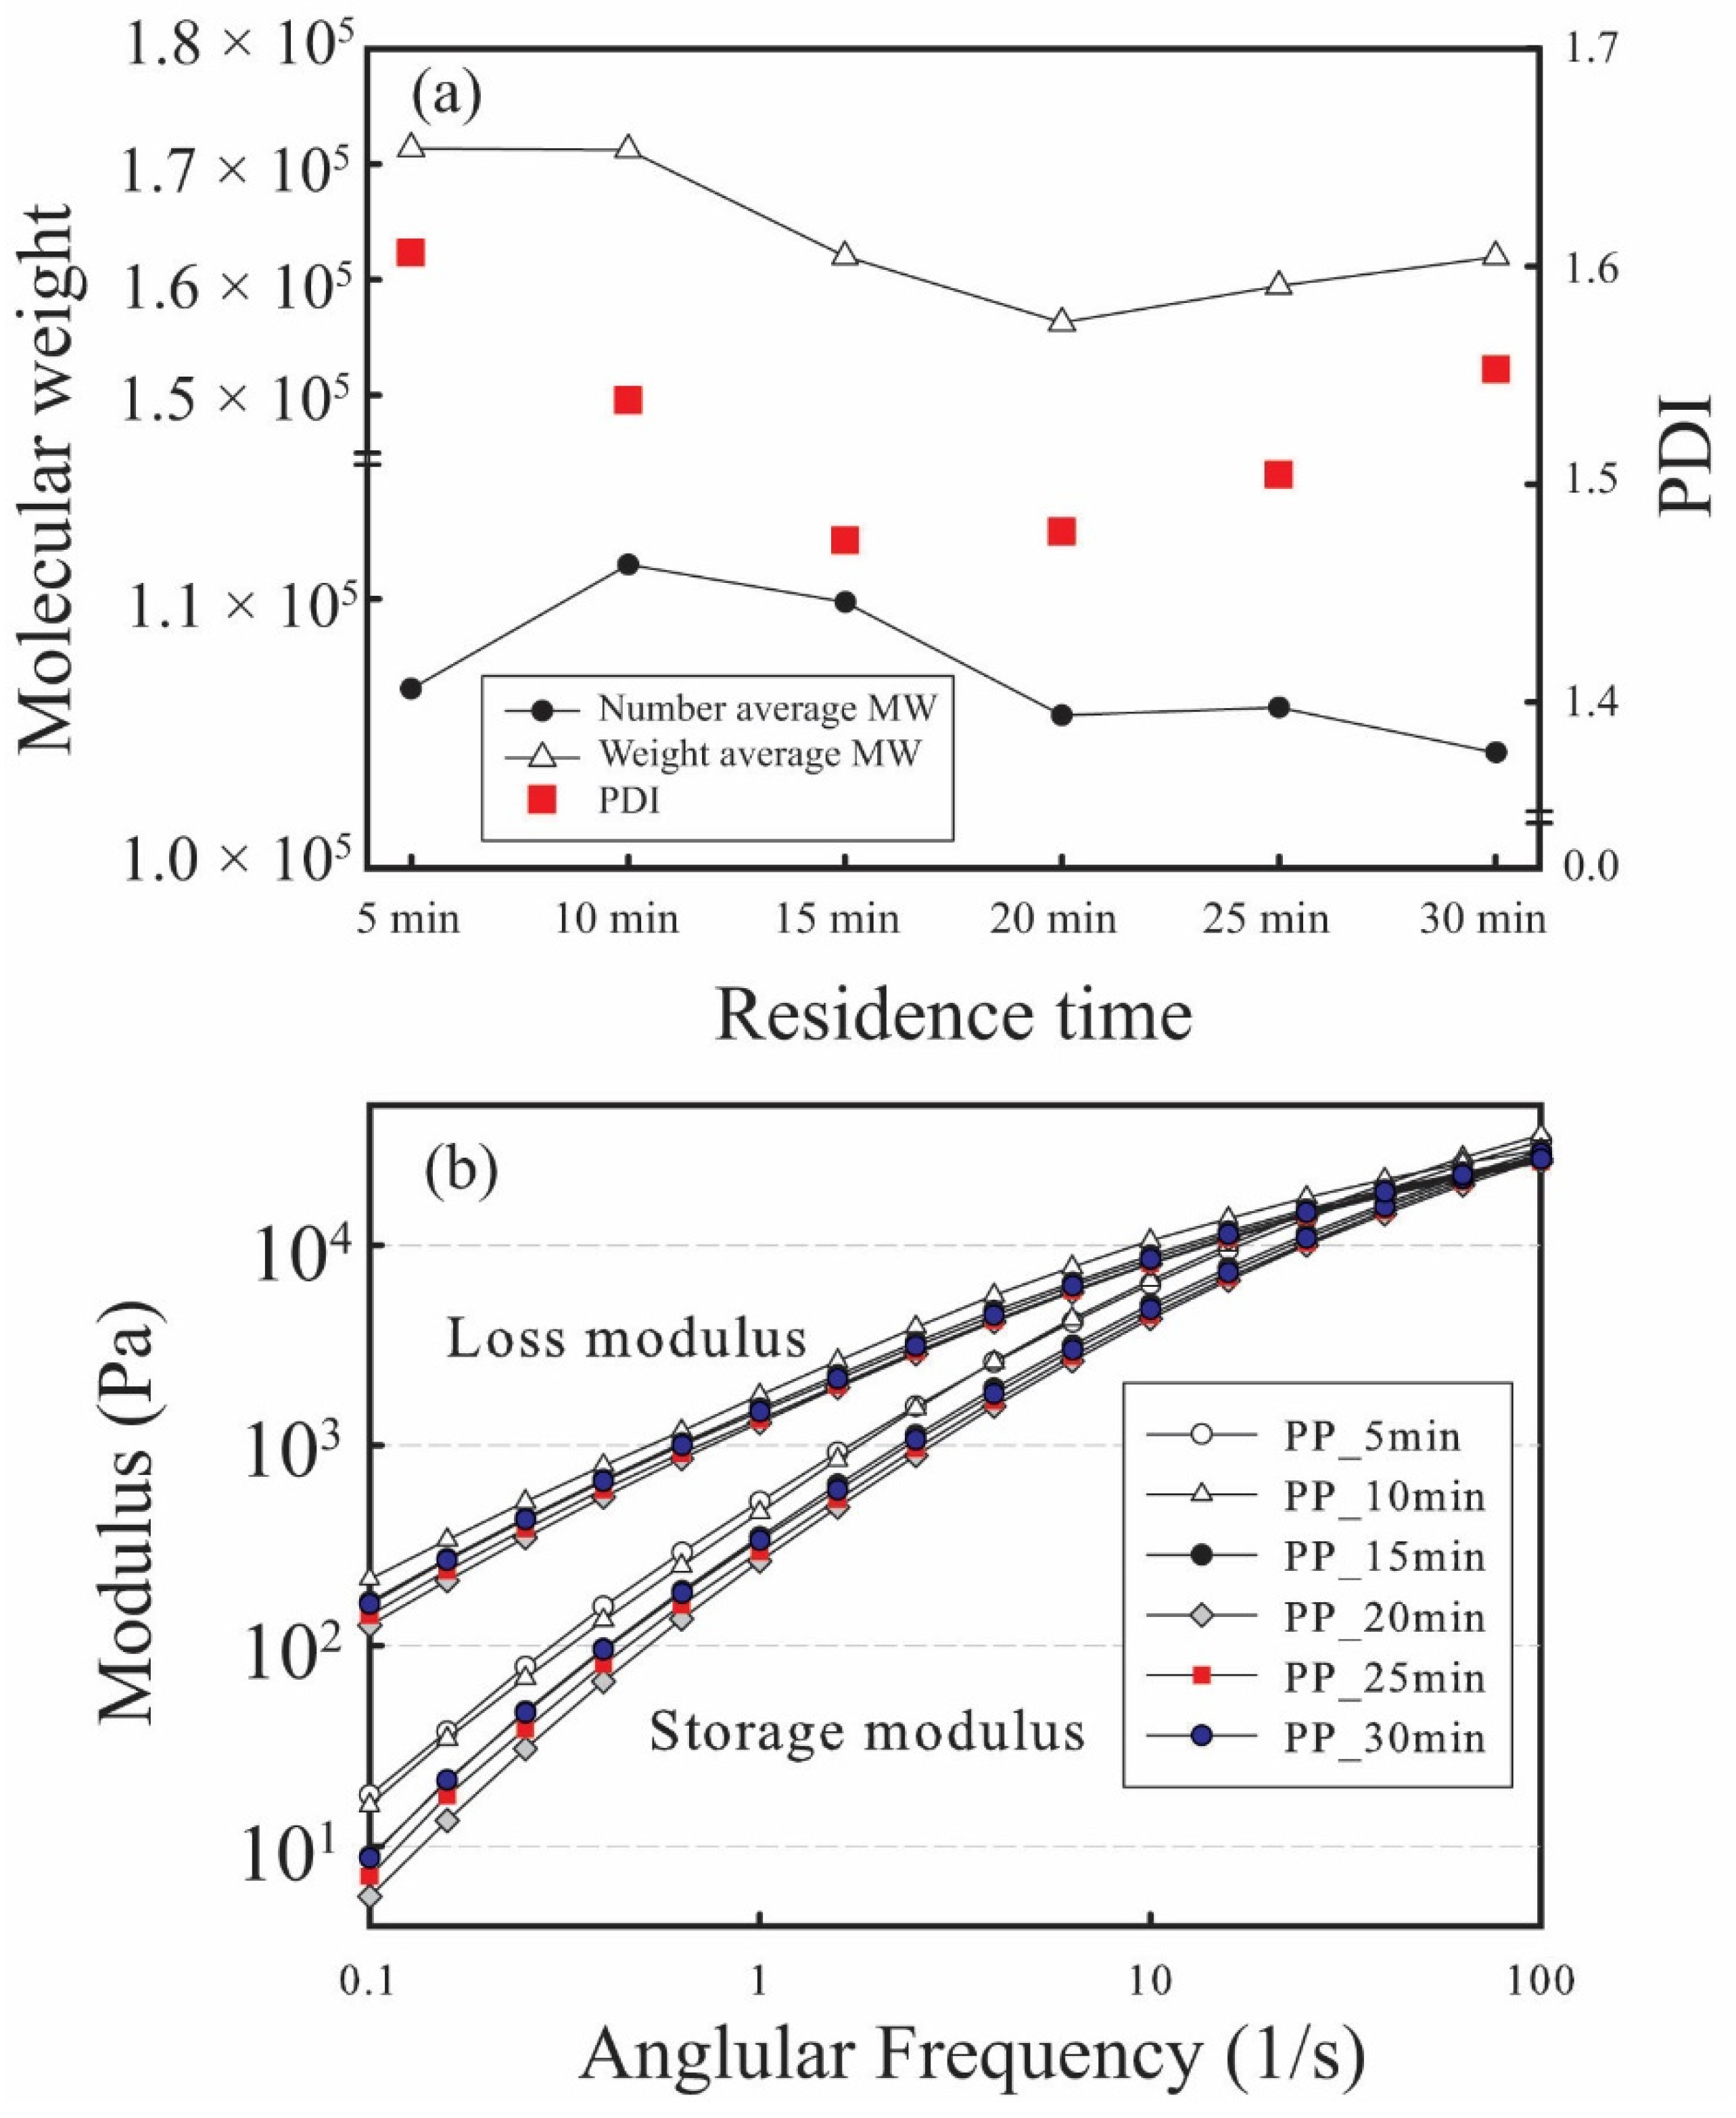
3.1. Processing Properties

Figure 2 explains the specific mechanical energy applied during the melt mixing process to produce composite materials with different SWNT content. Due to the residue of SWNTs in the compounder, after TGA analysis, the final amount of SWNTs in the PP/SWNT nanocomposites was 0.29, 0.43, 0.62, 1.28, 2.94, 3.66, 4.29, 4.80, and 6.56 wt.%.
As the SWNT content increases in this composite system, the SME increases, possibly due to the dominance of nanotube–nanotube interactions, which may affect the dispersion of SWNTs in the composites. Adding more SWNTs results in higher shear stress for the composites during melt mixing. This trend can be also found in the rheological properties of the composites.

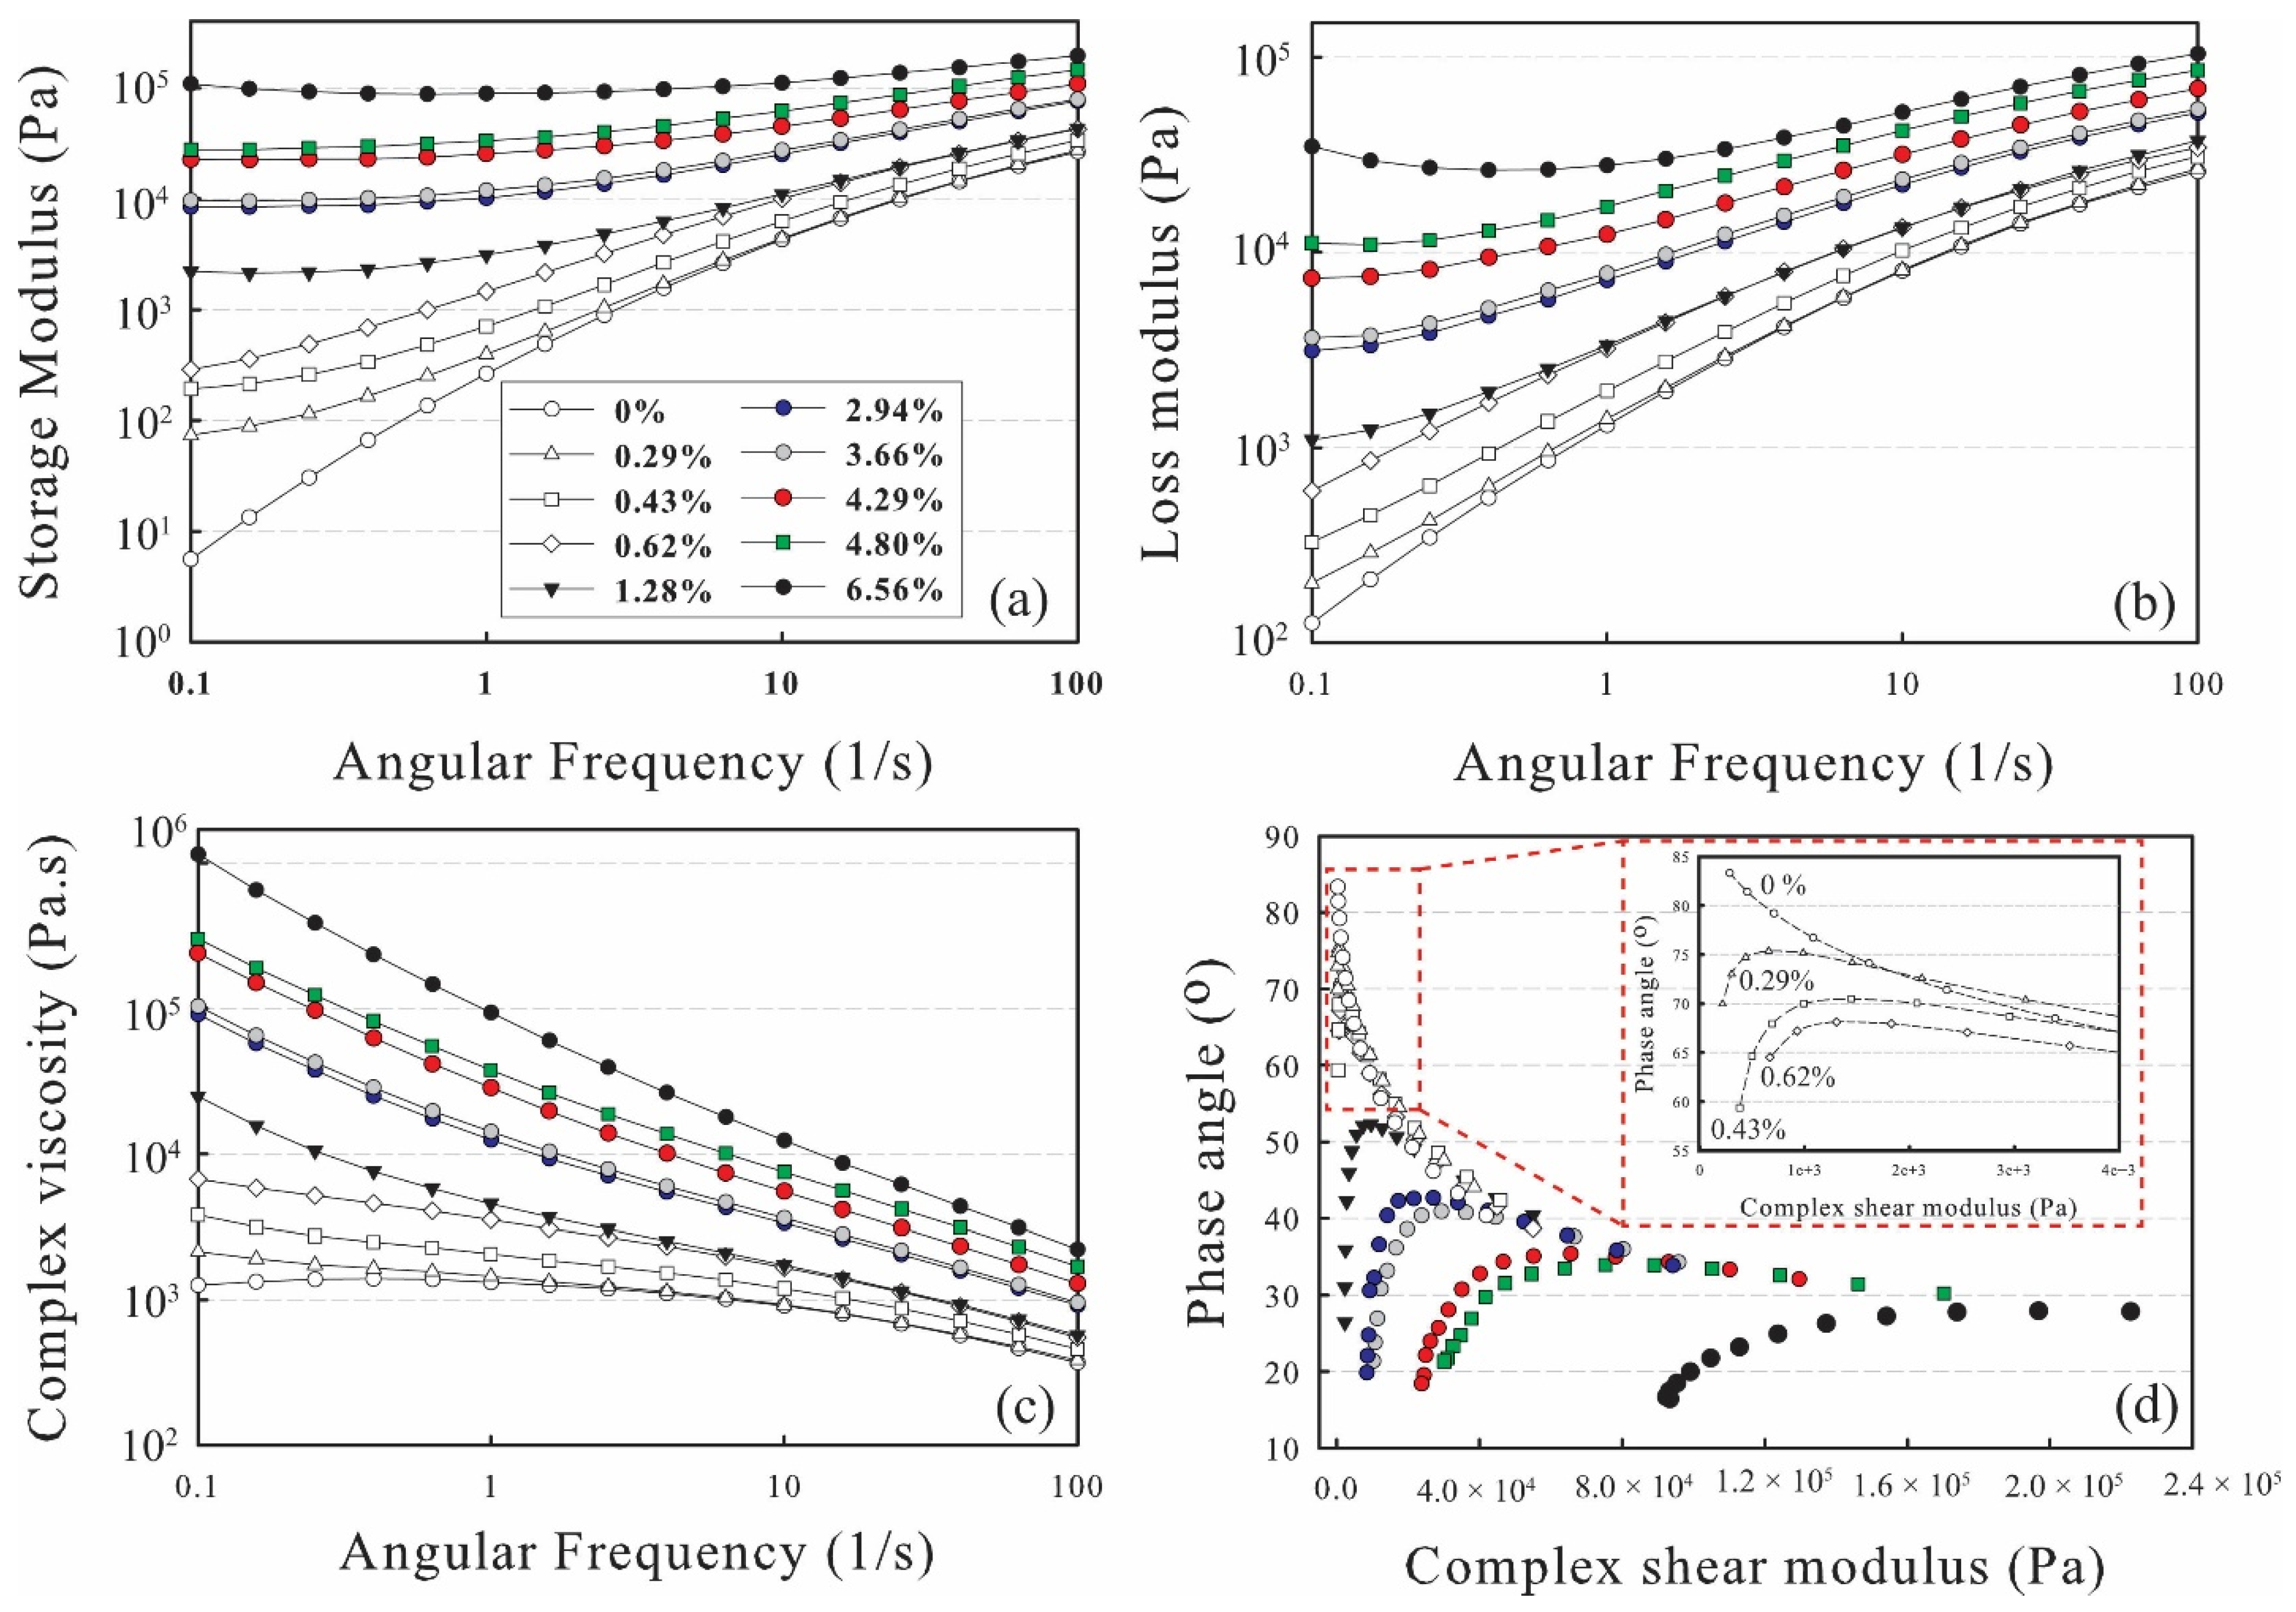
3.2. Rheological Properties of the Composites

As discussed earlier, polymers with a high molecular weight result in large agglomerates of composites. It is also known that a long residence time during the melt mixing process may cause a polymer backbone scission resulting in reduced molecular weight. As shown in Figure 3a, the molecular weight (MW) of PP decreased from a residence time to 10 min from 20 min. The weight-average MW, which is more sensitive to molecular size than the number-average MW, reached a low level at a residence time of 20 min, indicating a low polydispersity index. In other words, not only is the length of the molecule reduced, but it can also be evenly distributed at a residence time of 20 min. Thus, the polymer melt infiltration into the primary agglomerates can be enhanced with lower viscosity and molecular weight [42]. Figure 3b shows the storage and loss modulus of PP as a function of residence time at 200 °C.
At low frequencies, PP without SWNT loading exhibits typical homopolymer-like terminal behavior by full relaxation of the PP chain. PP chains have sufficient time to free themselves from the constraints of entanglement. However, when the nanotube loading reaches 0.29 wt.%, the terminal behavior becomes weak, and the dependence of G and G on ω is limited. As shown in Figure 4a, G begins to show a plateau at low frequencies of 0.29 wt.% SWNT loading, which indicates a transition from liquid-like to solid-like viscoelastic behavior [48]. As the SWNT content increases in the composite, G at low frequencies is increased and becomes independent of frequency. This behavior can be explained by the formation of interconnected nanotube networks in the polymer. While the low frequency dependency of G shows a similar trend, as shown in Figure 4b, the corresponding increase in the loss modulus G is lower than the storage modulus G . According to Potschke et al. [49], this limited increase in the loss modulus as the SWNT content increases is due to the insensitivity of the interfacial energy or compatibility between the polymer and the SWNTs. Increasing the SWNT content also leads to an increase in the complex viscosity. From 0.29 wt.%, a transition from liquid-like to solid-like behavior appeared, which can be considered as the rheological percolation threshold, as supported by the van Gurp–Palmen plot (Figure 4d). As shown in Figure 4d, the curves approach a phase angle of 90° at 0 wt.%, indicating a viscous behavior, whereas from 0.29 wt.%, the rheological behavior changes from a viscous fluid to an elastic solid, indicating a percolation threshold [50].

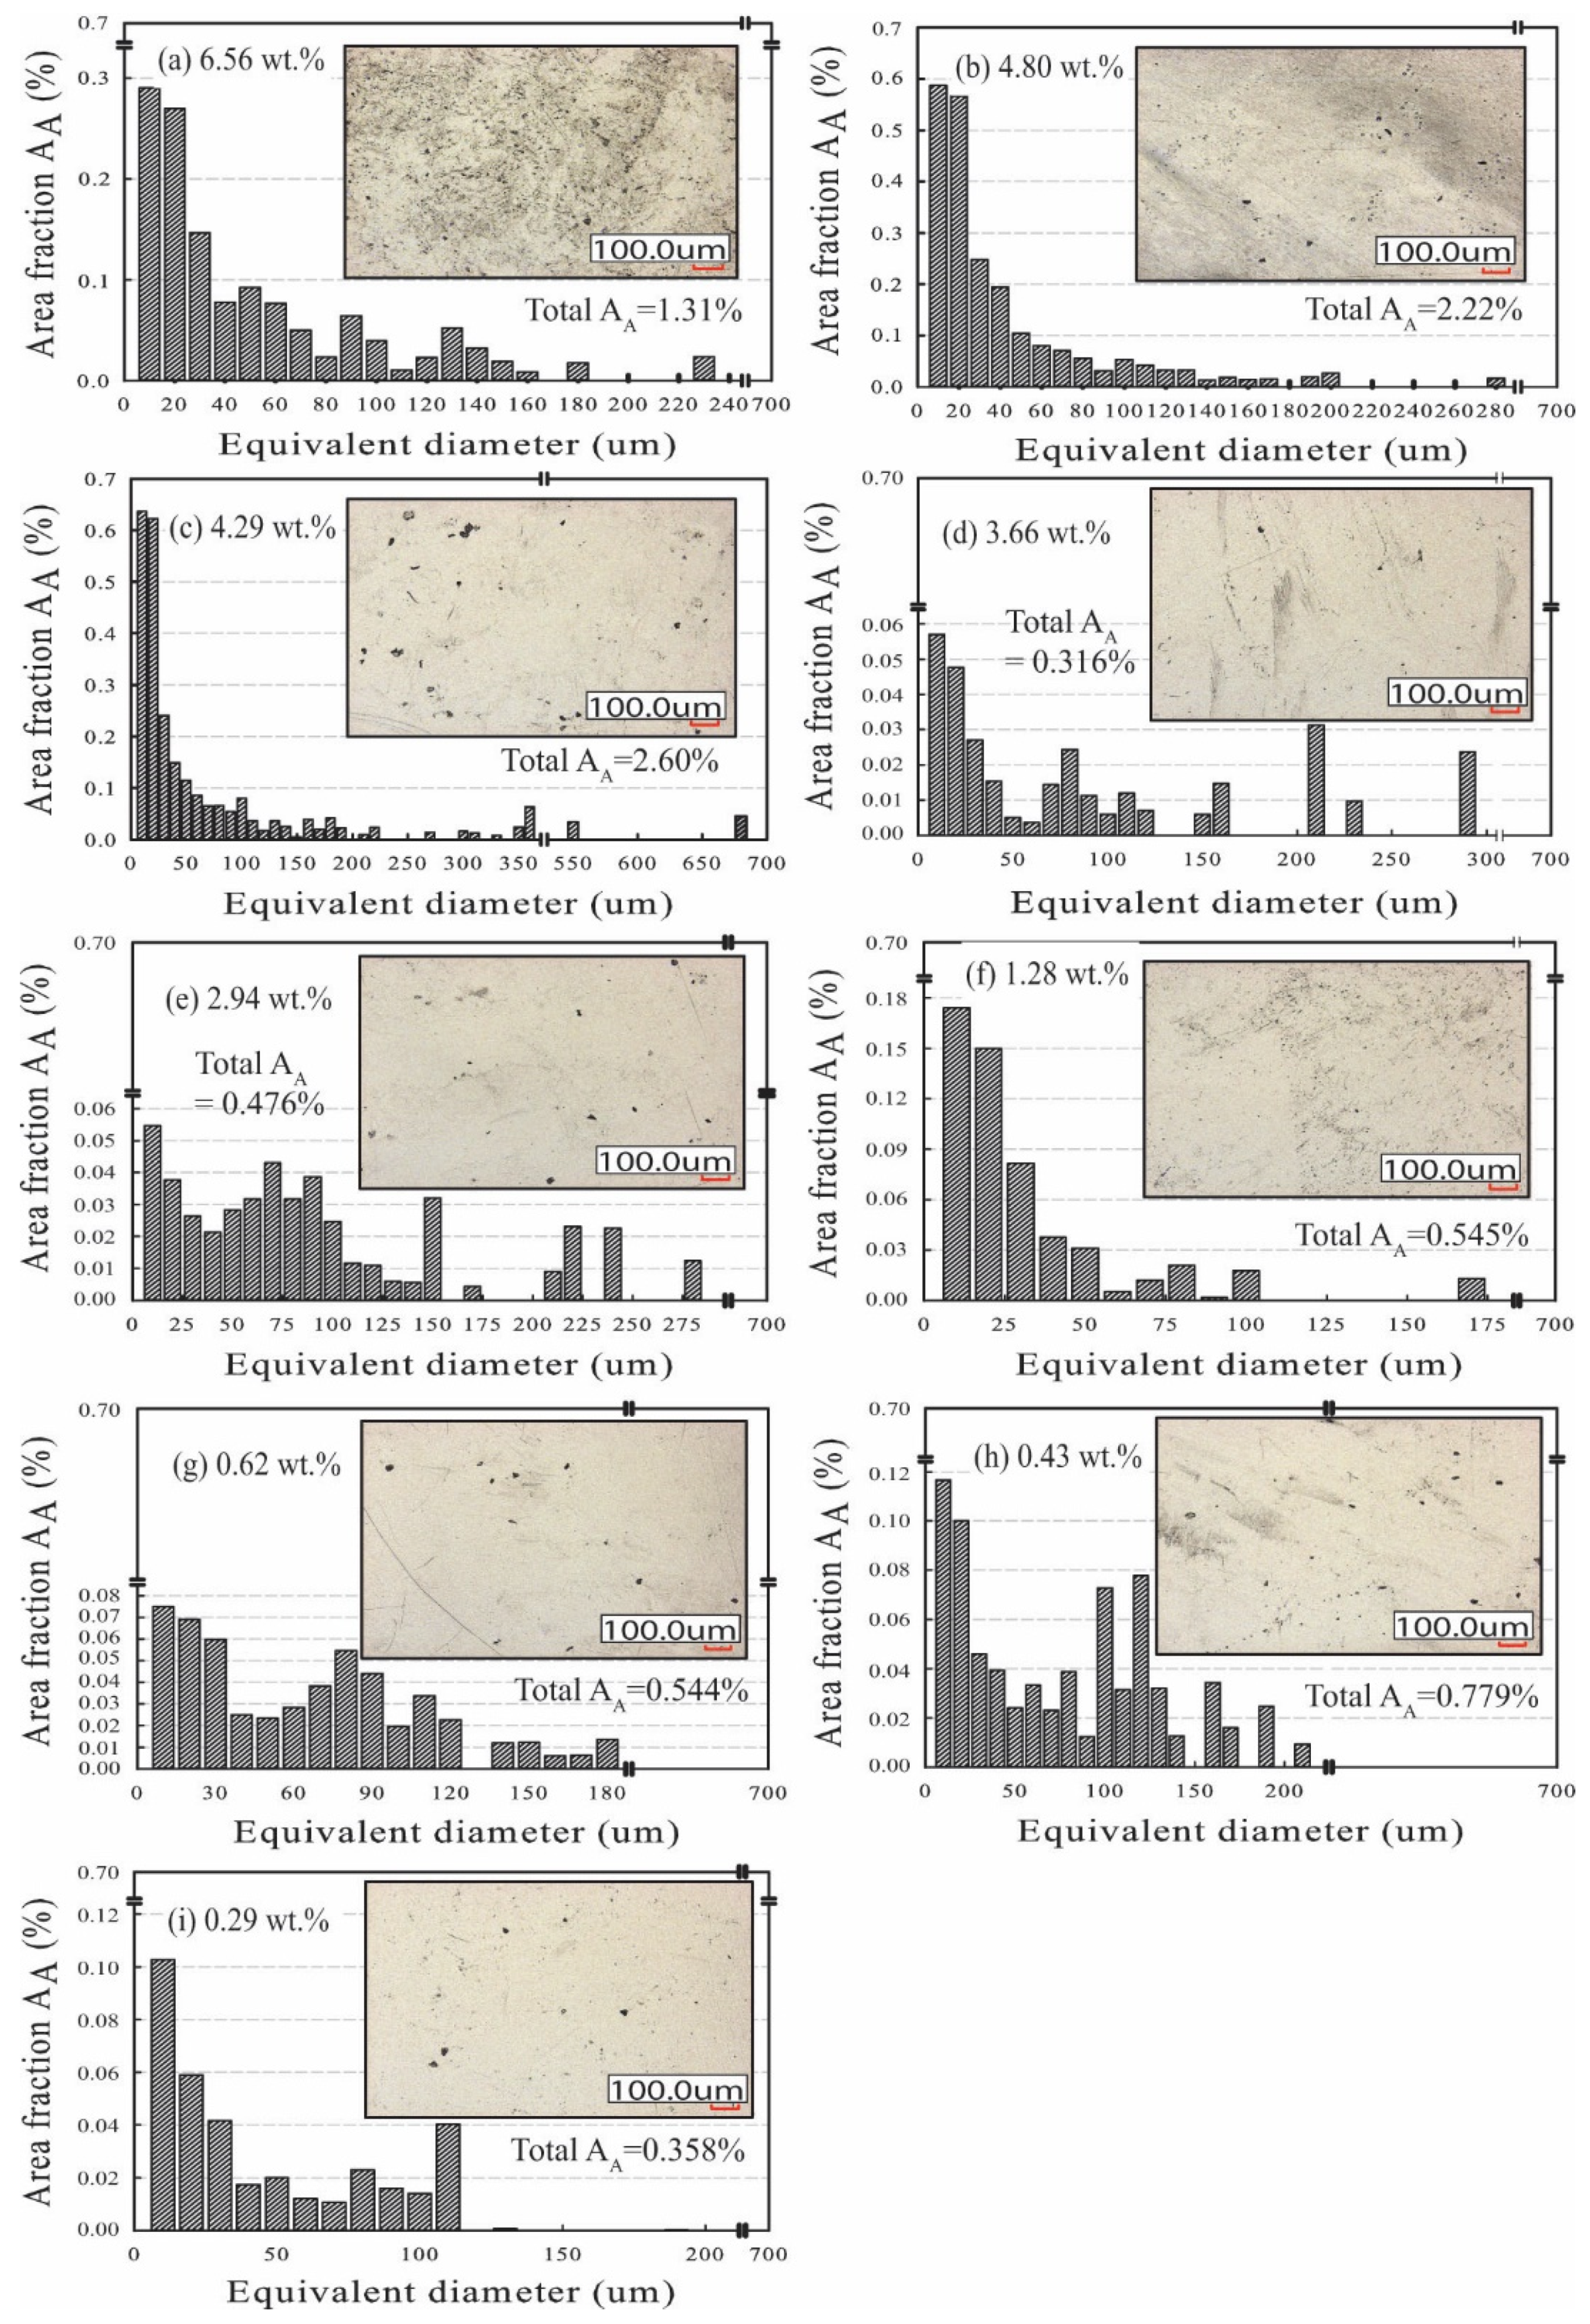
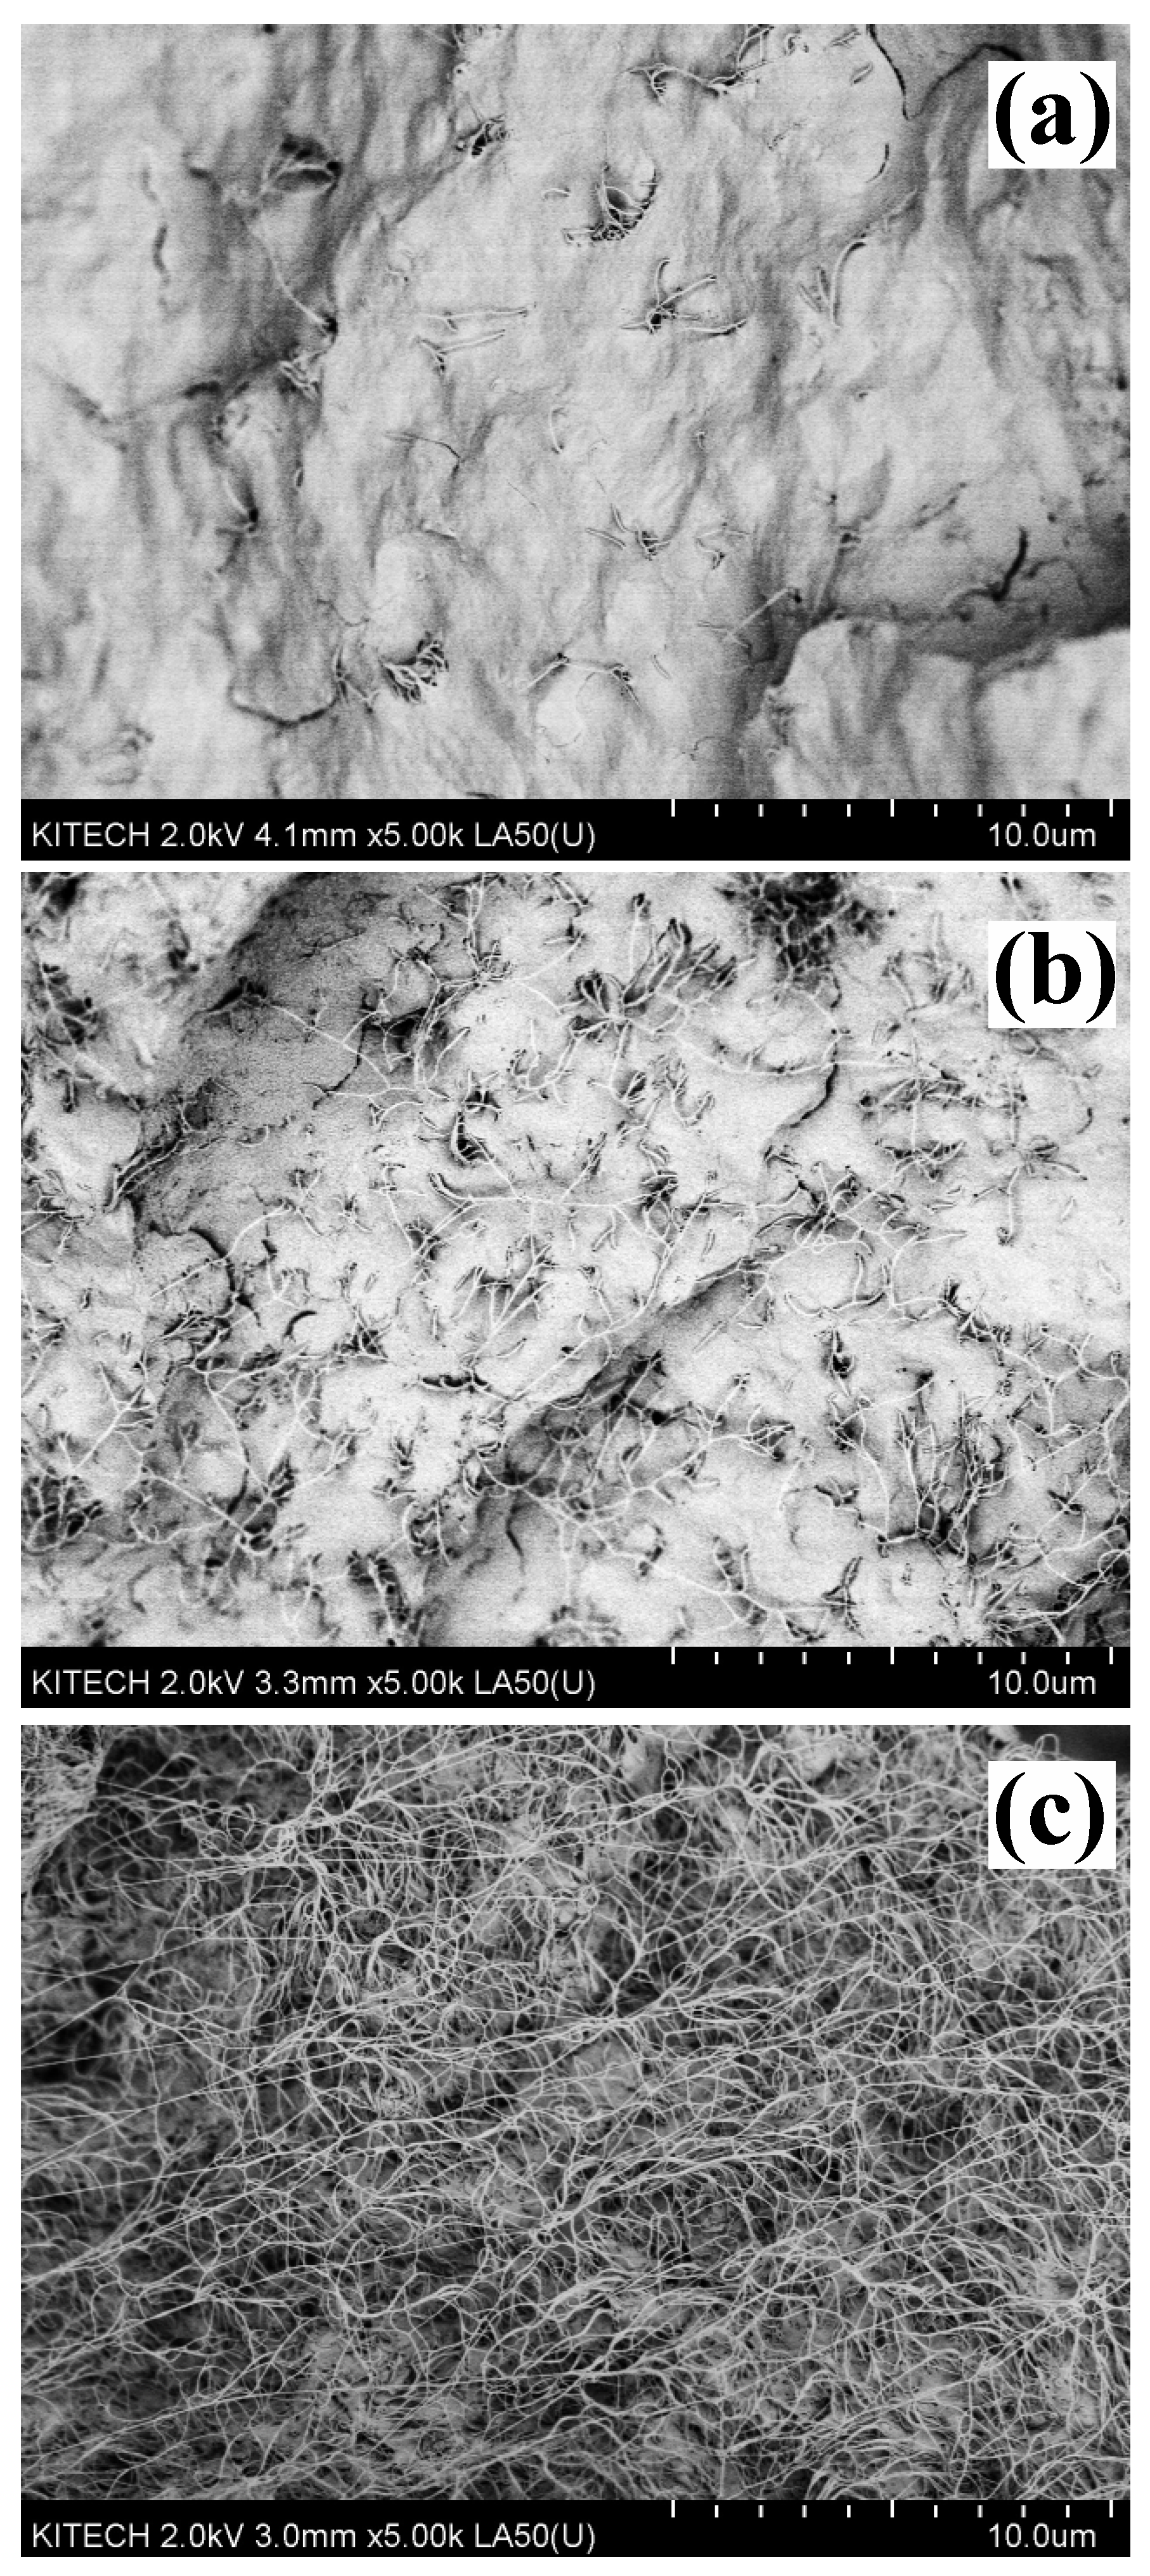
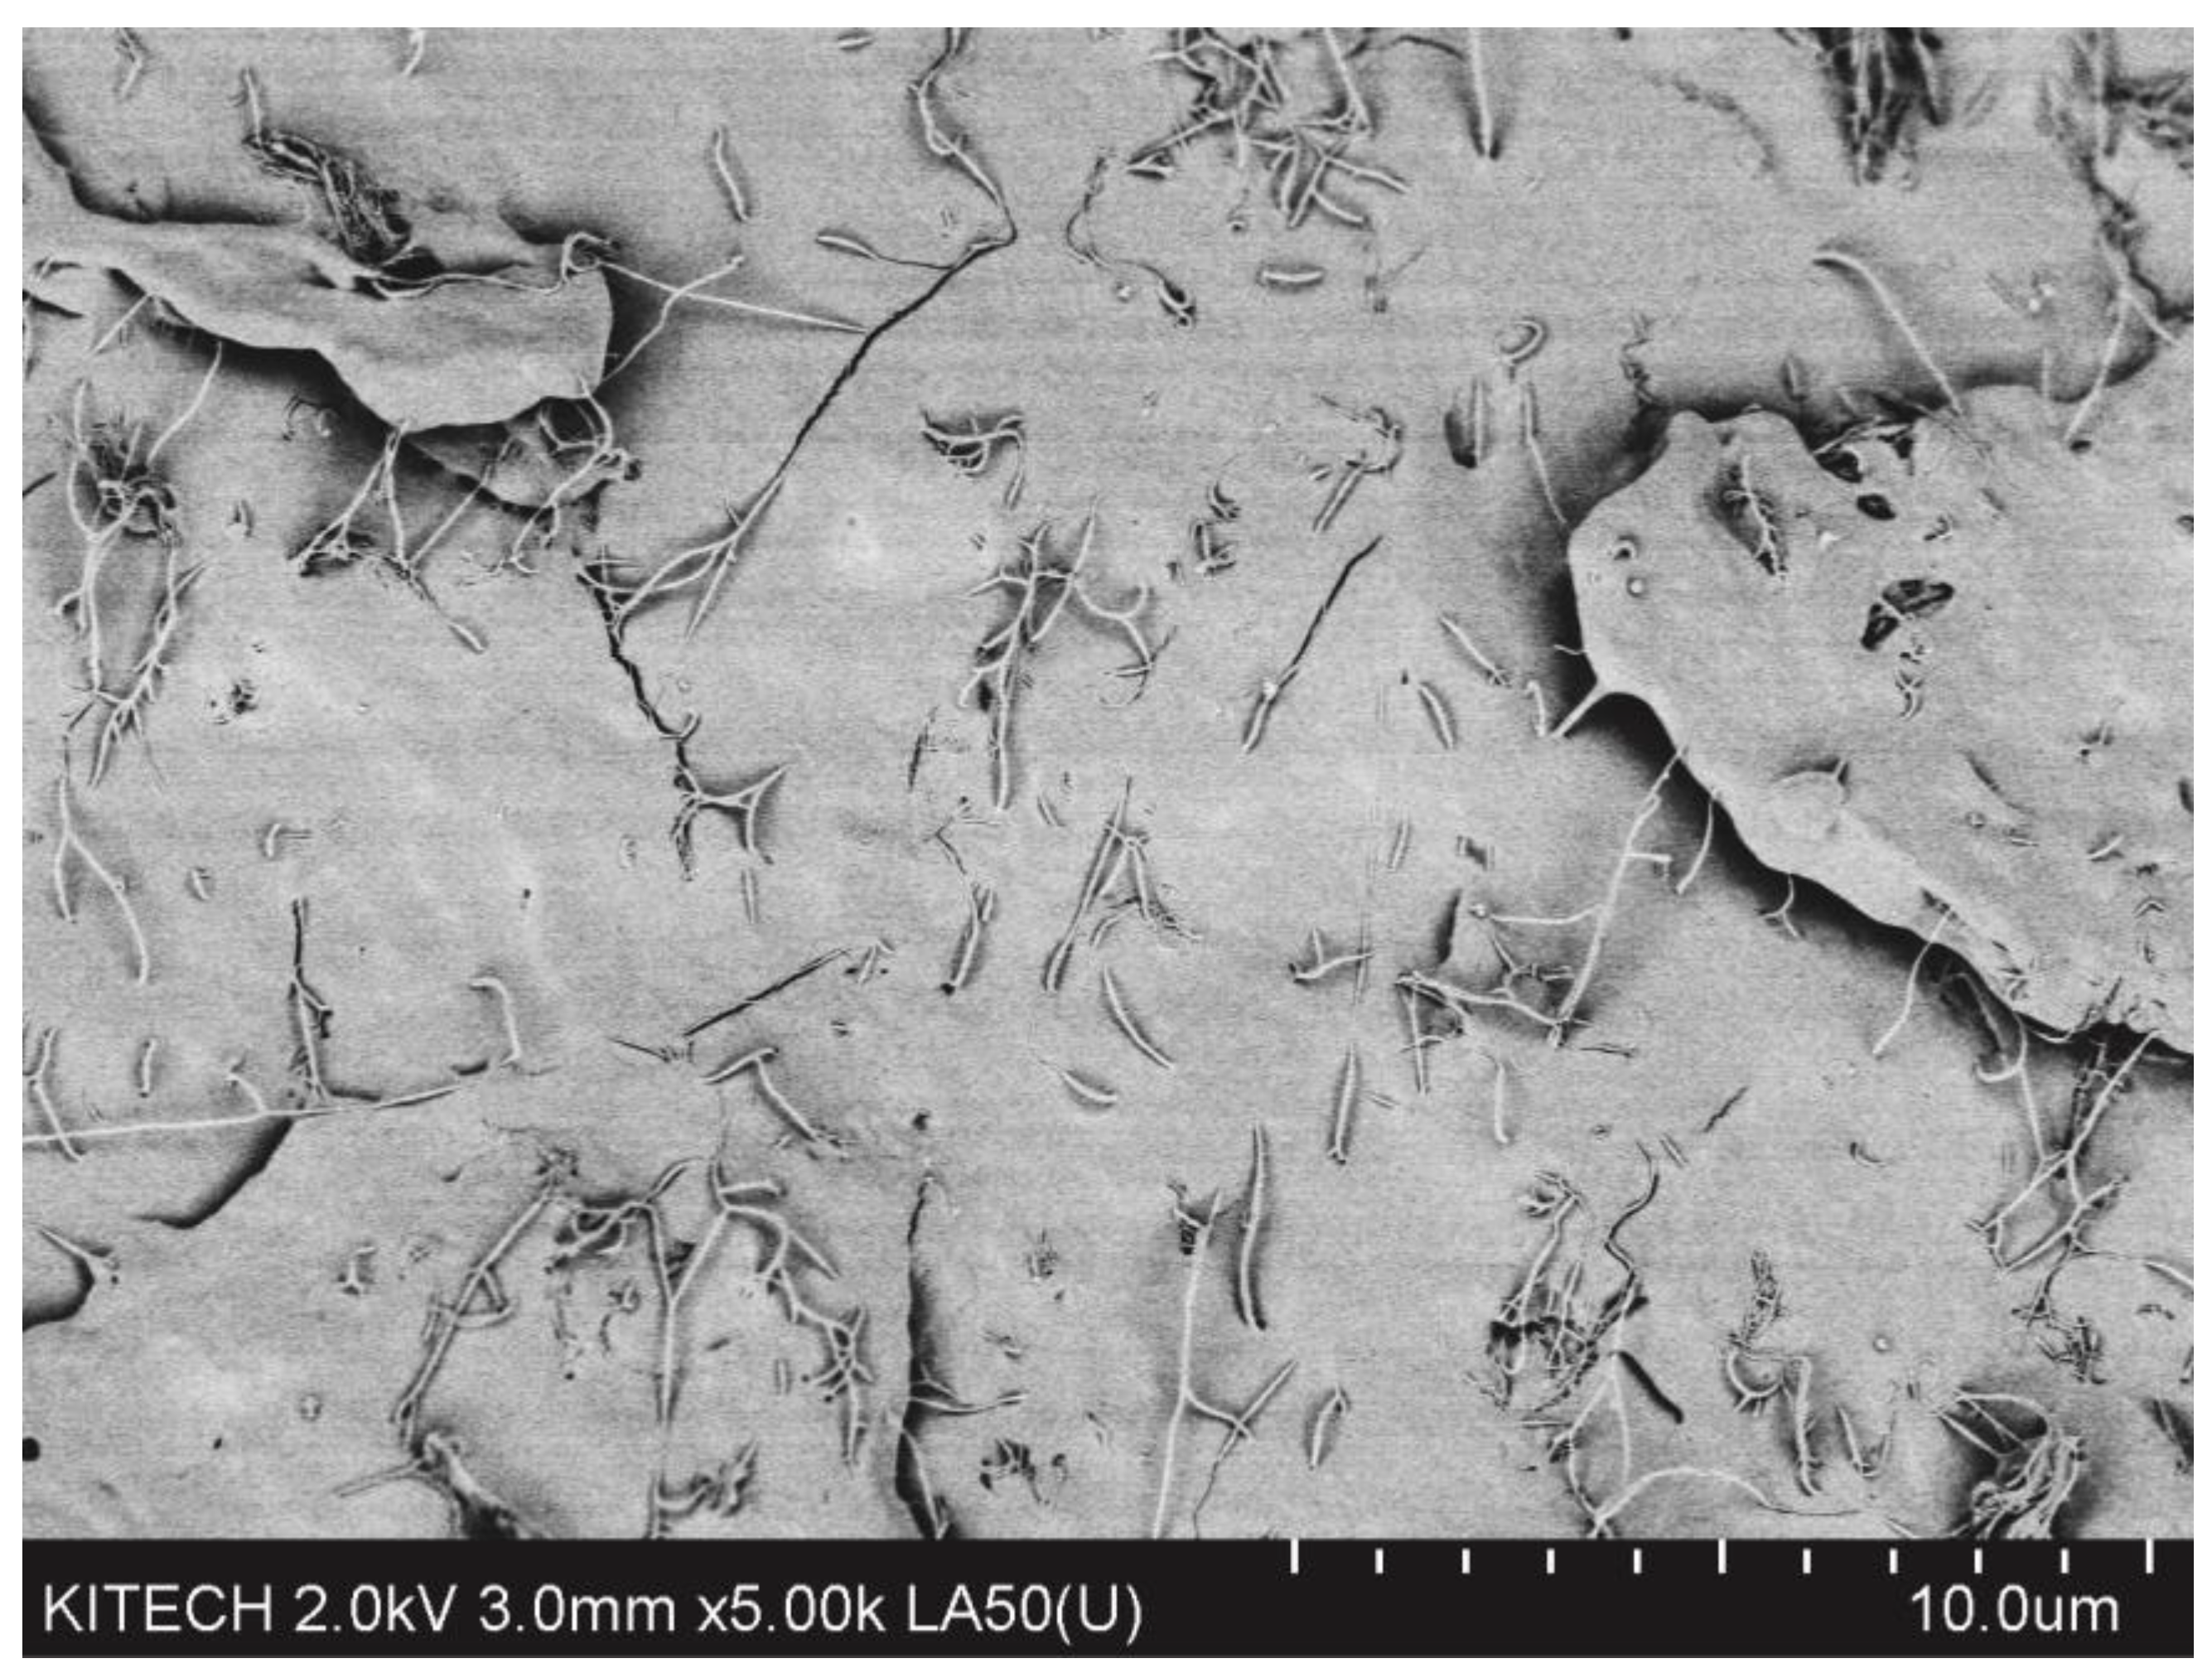
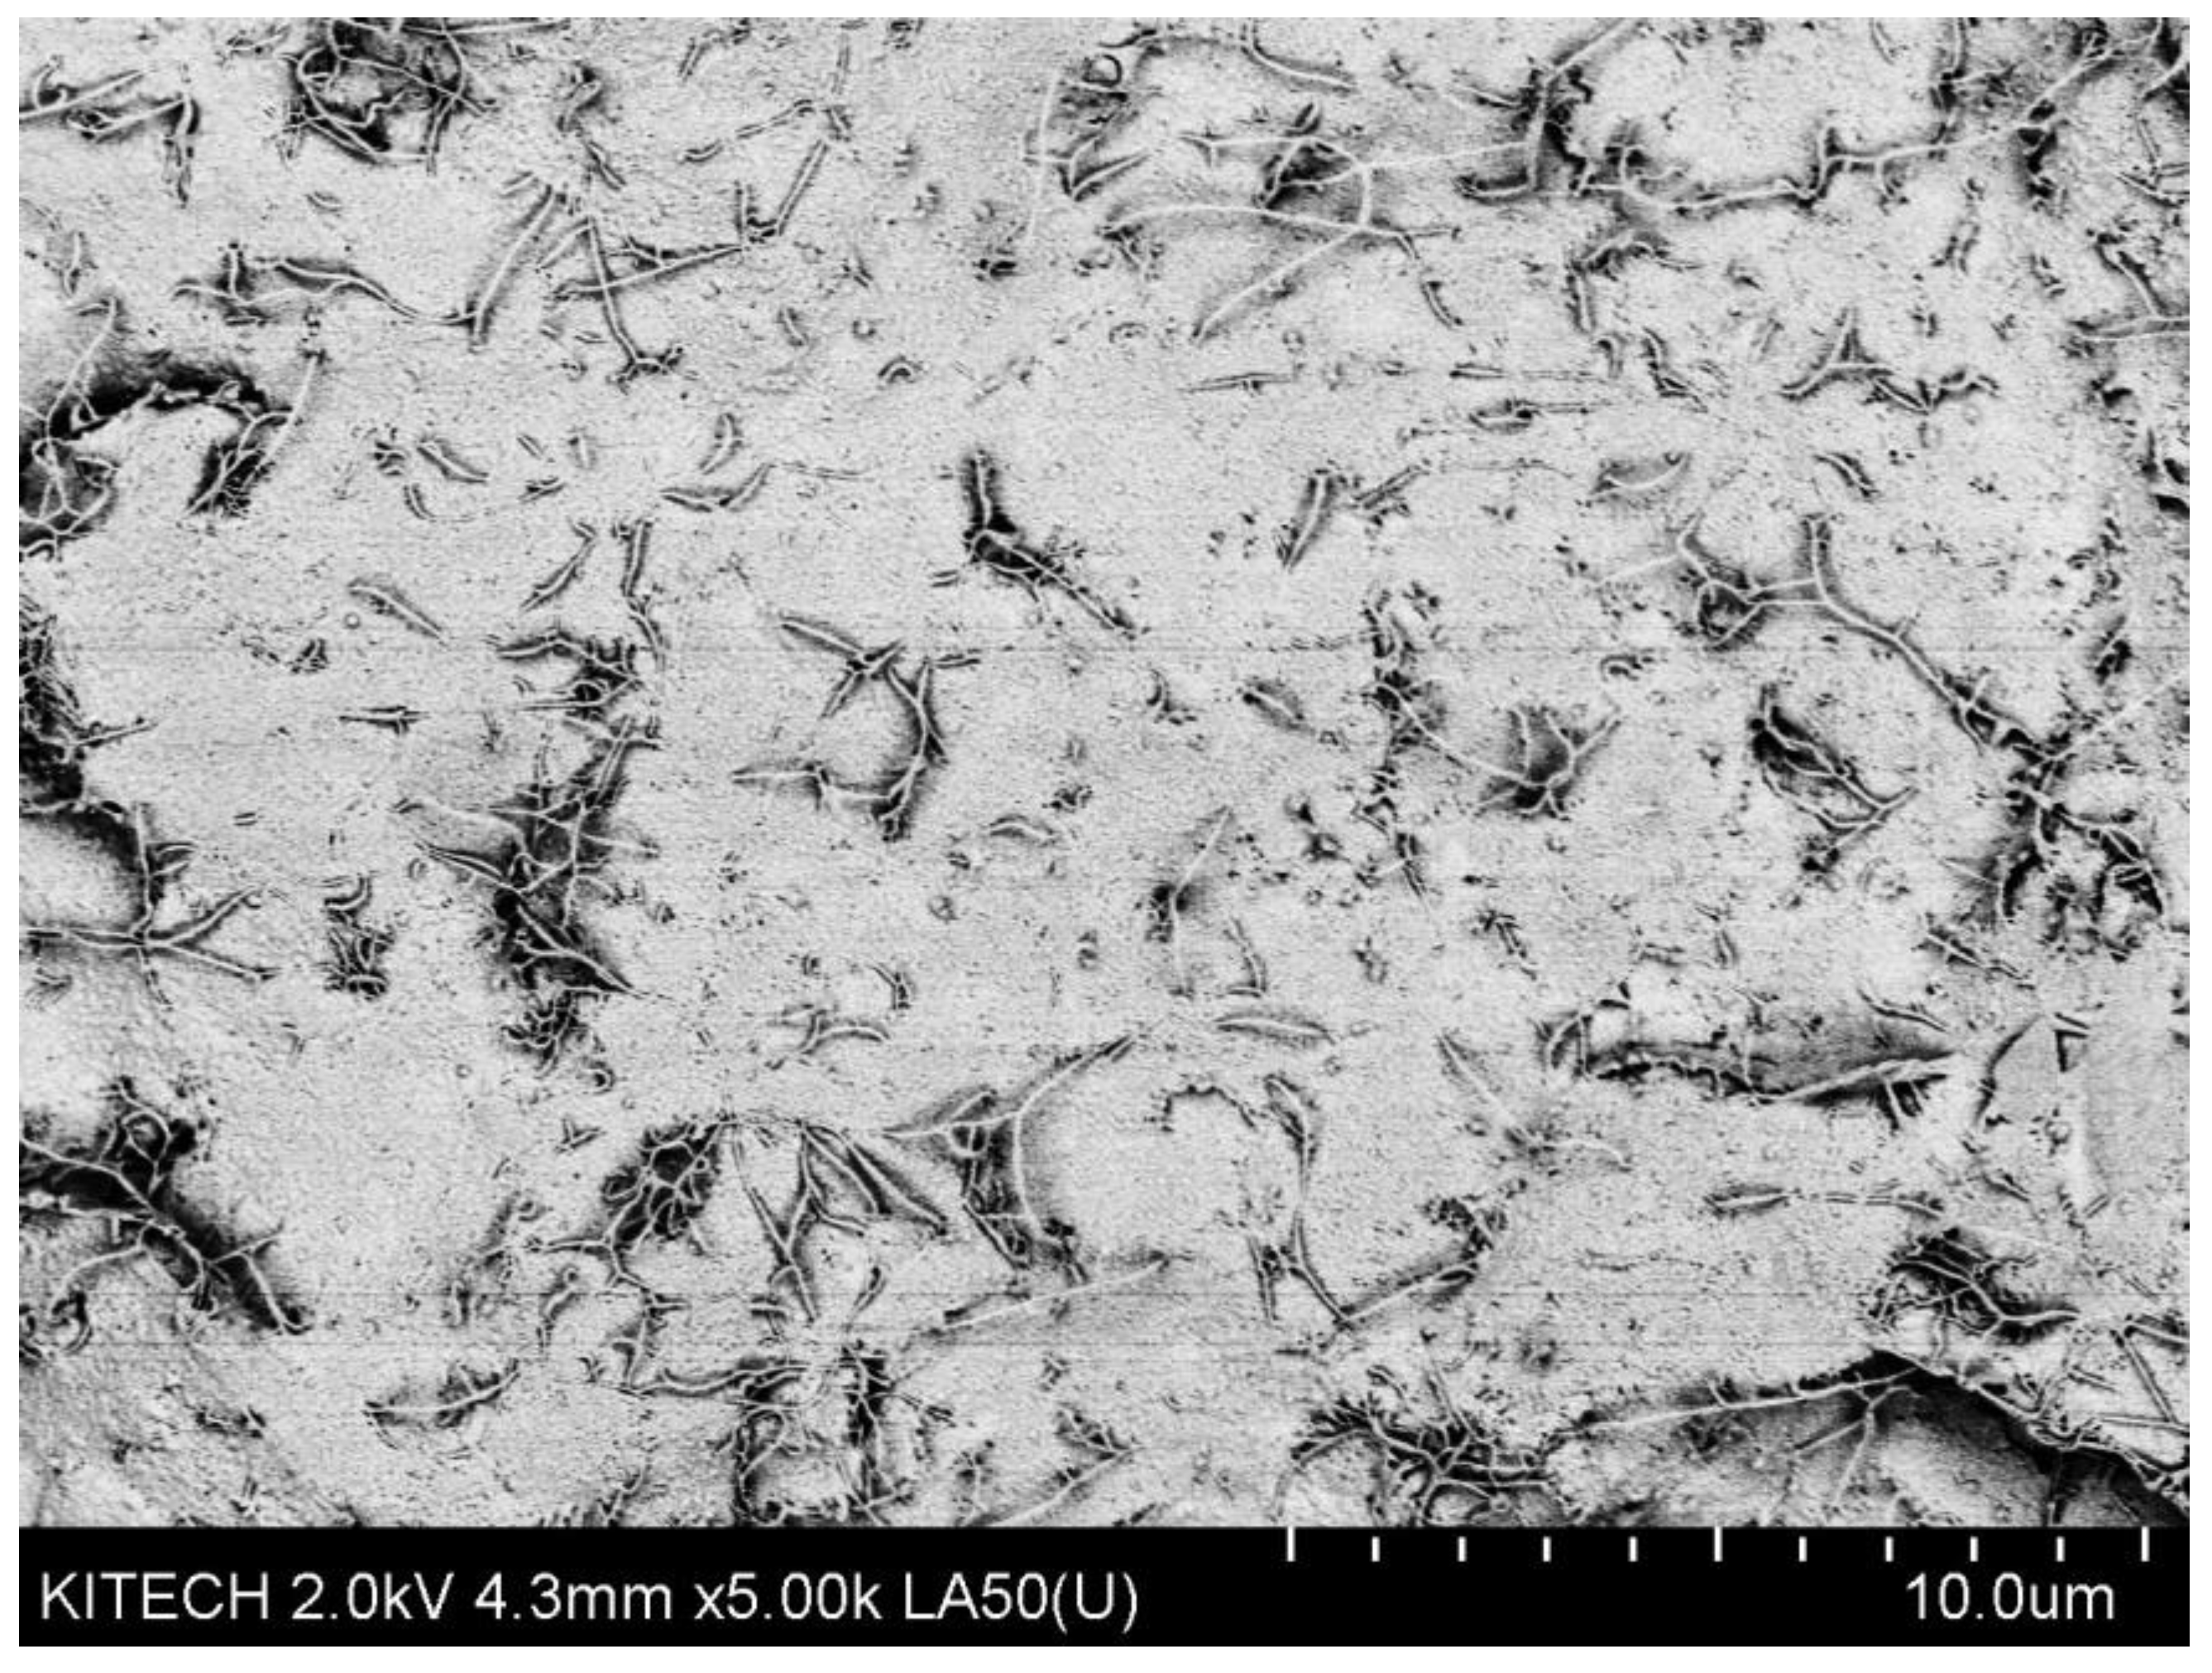
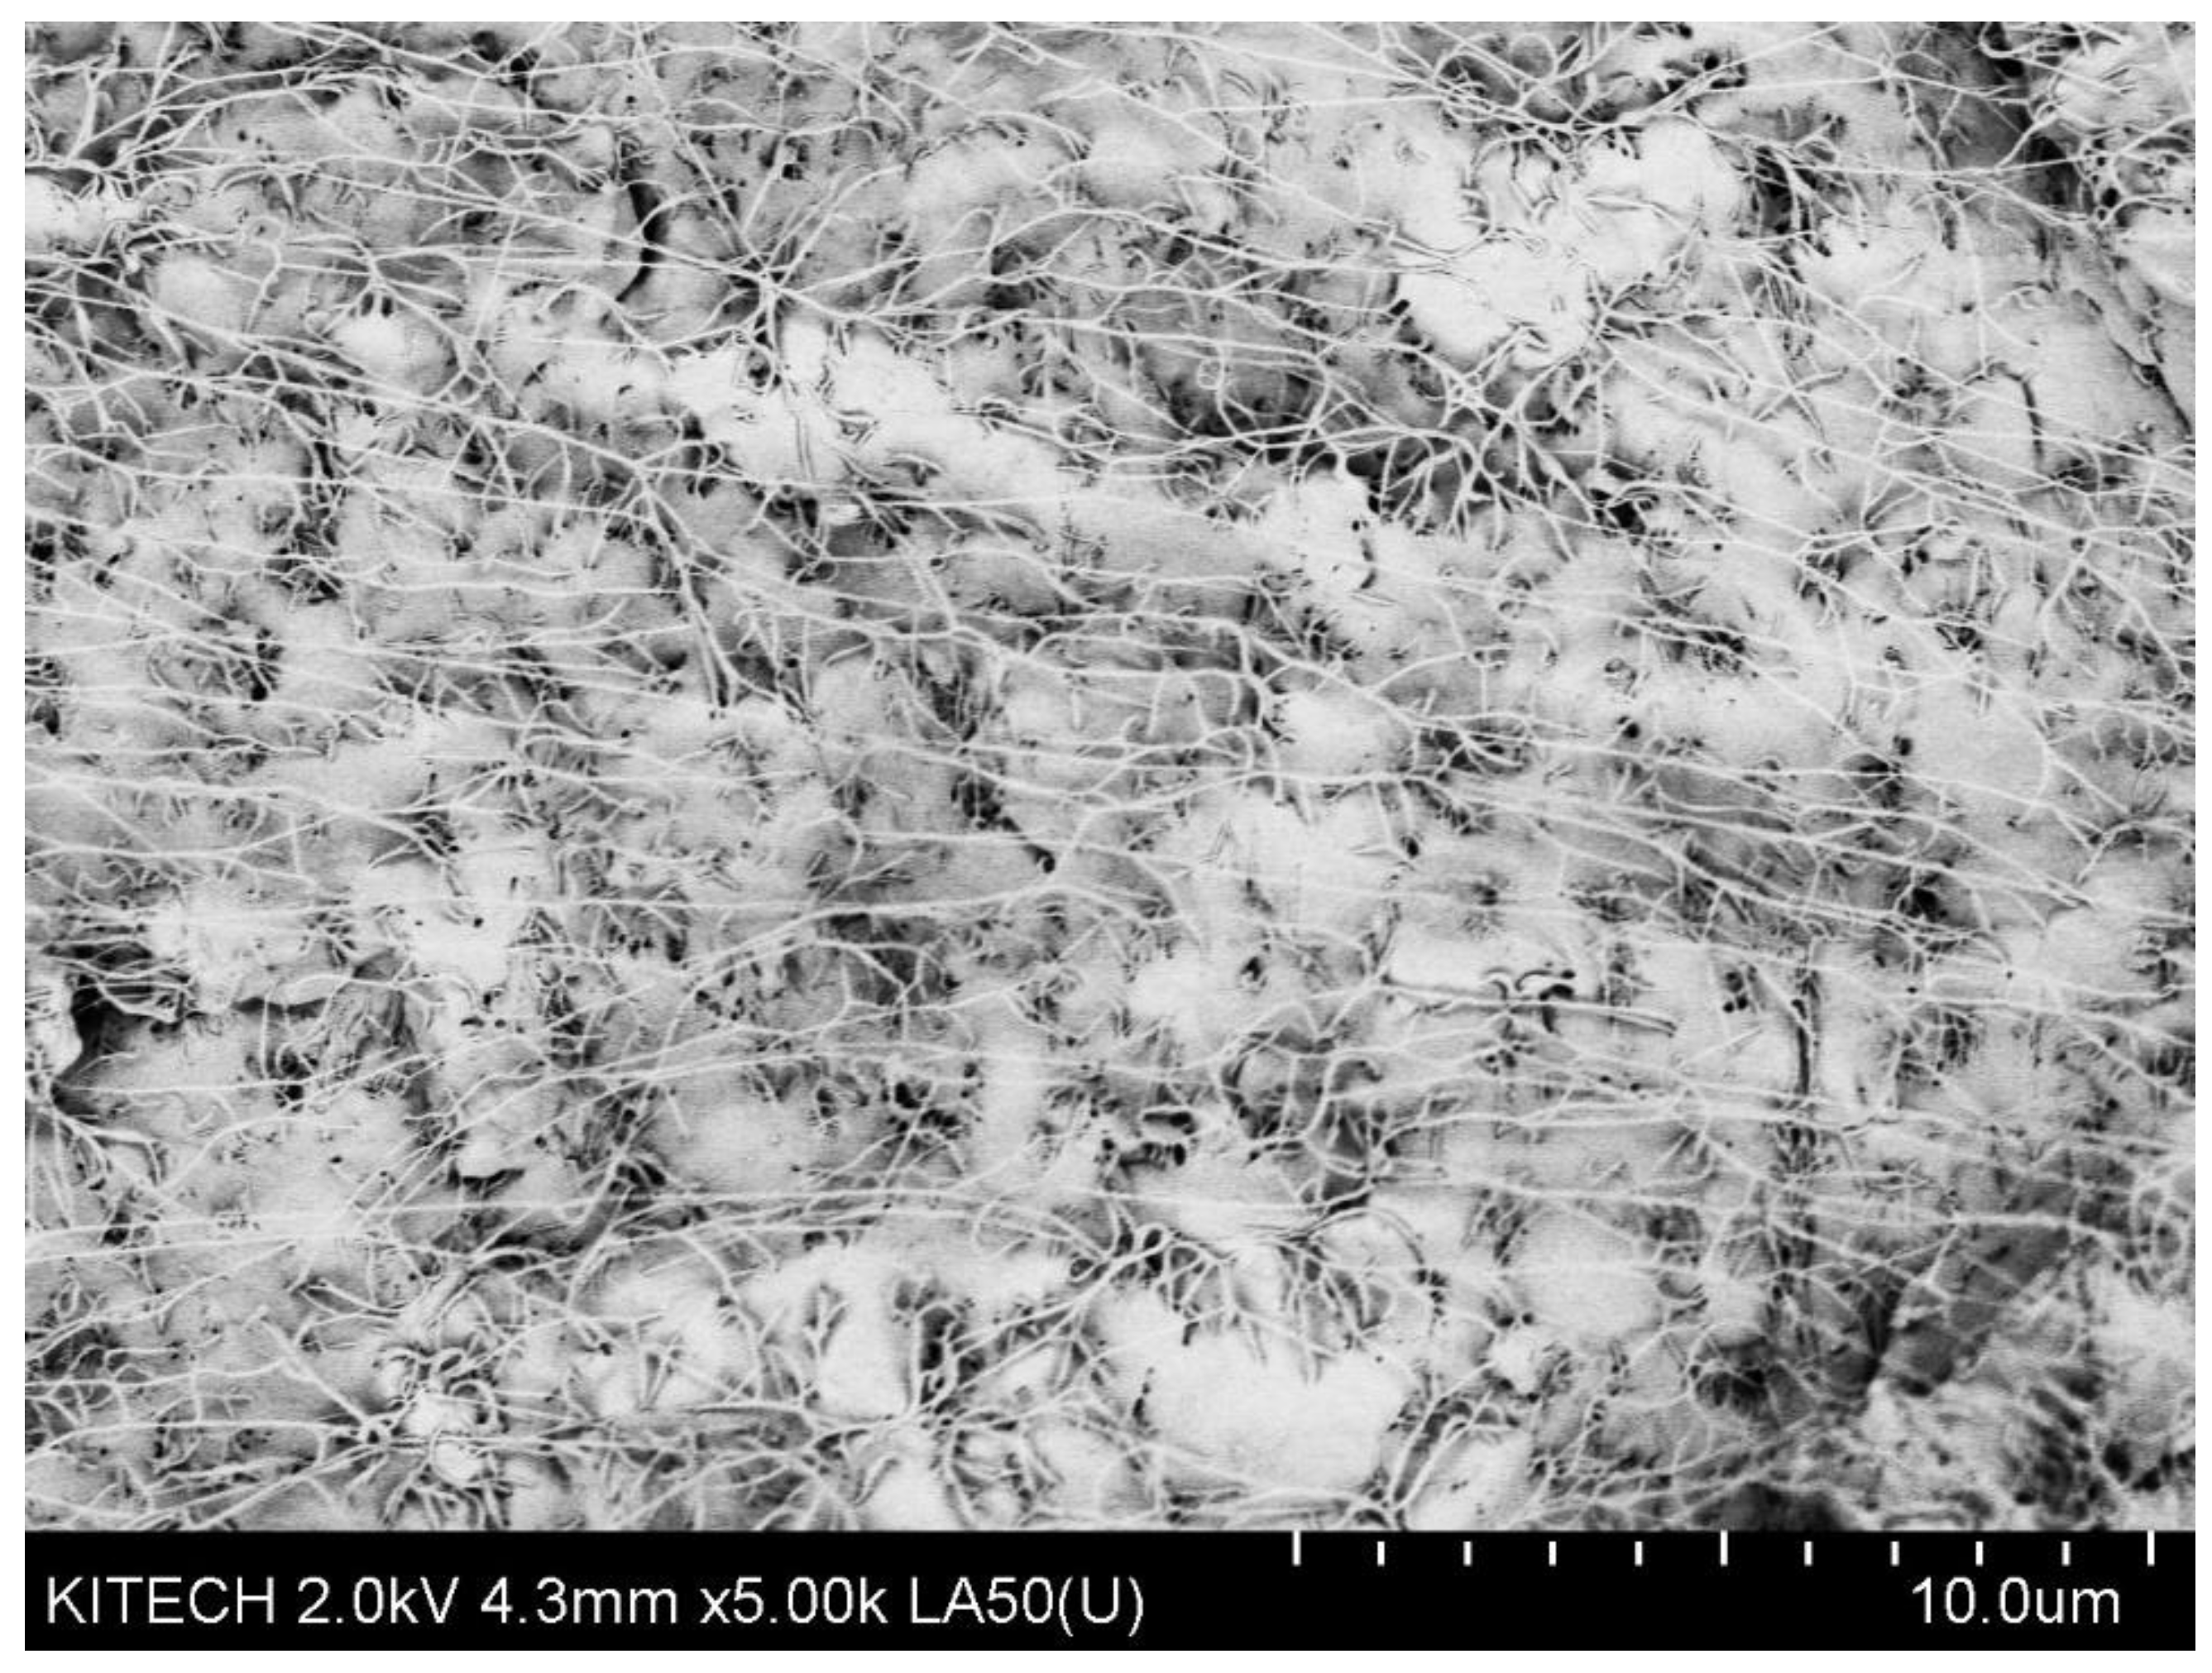
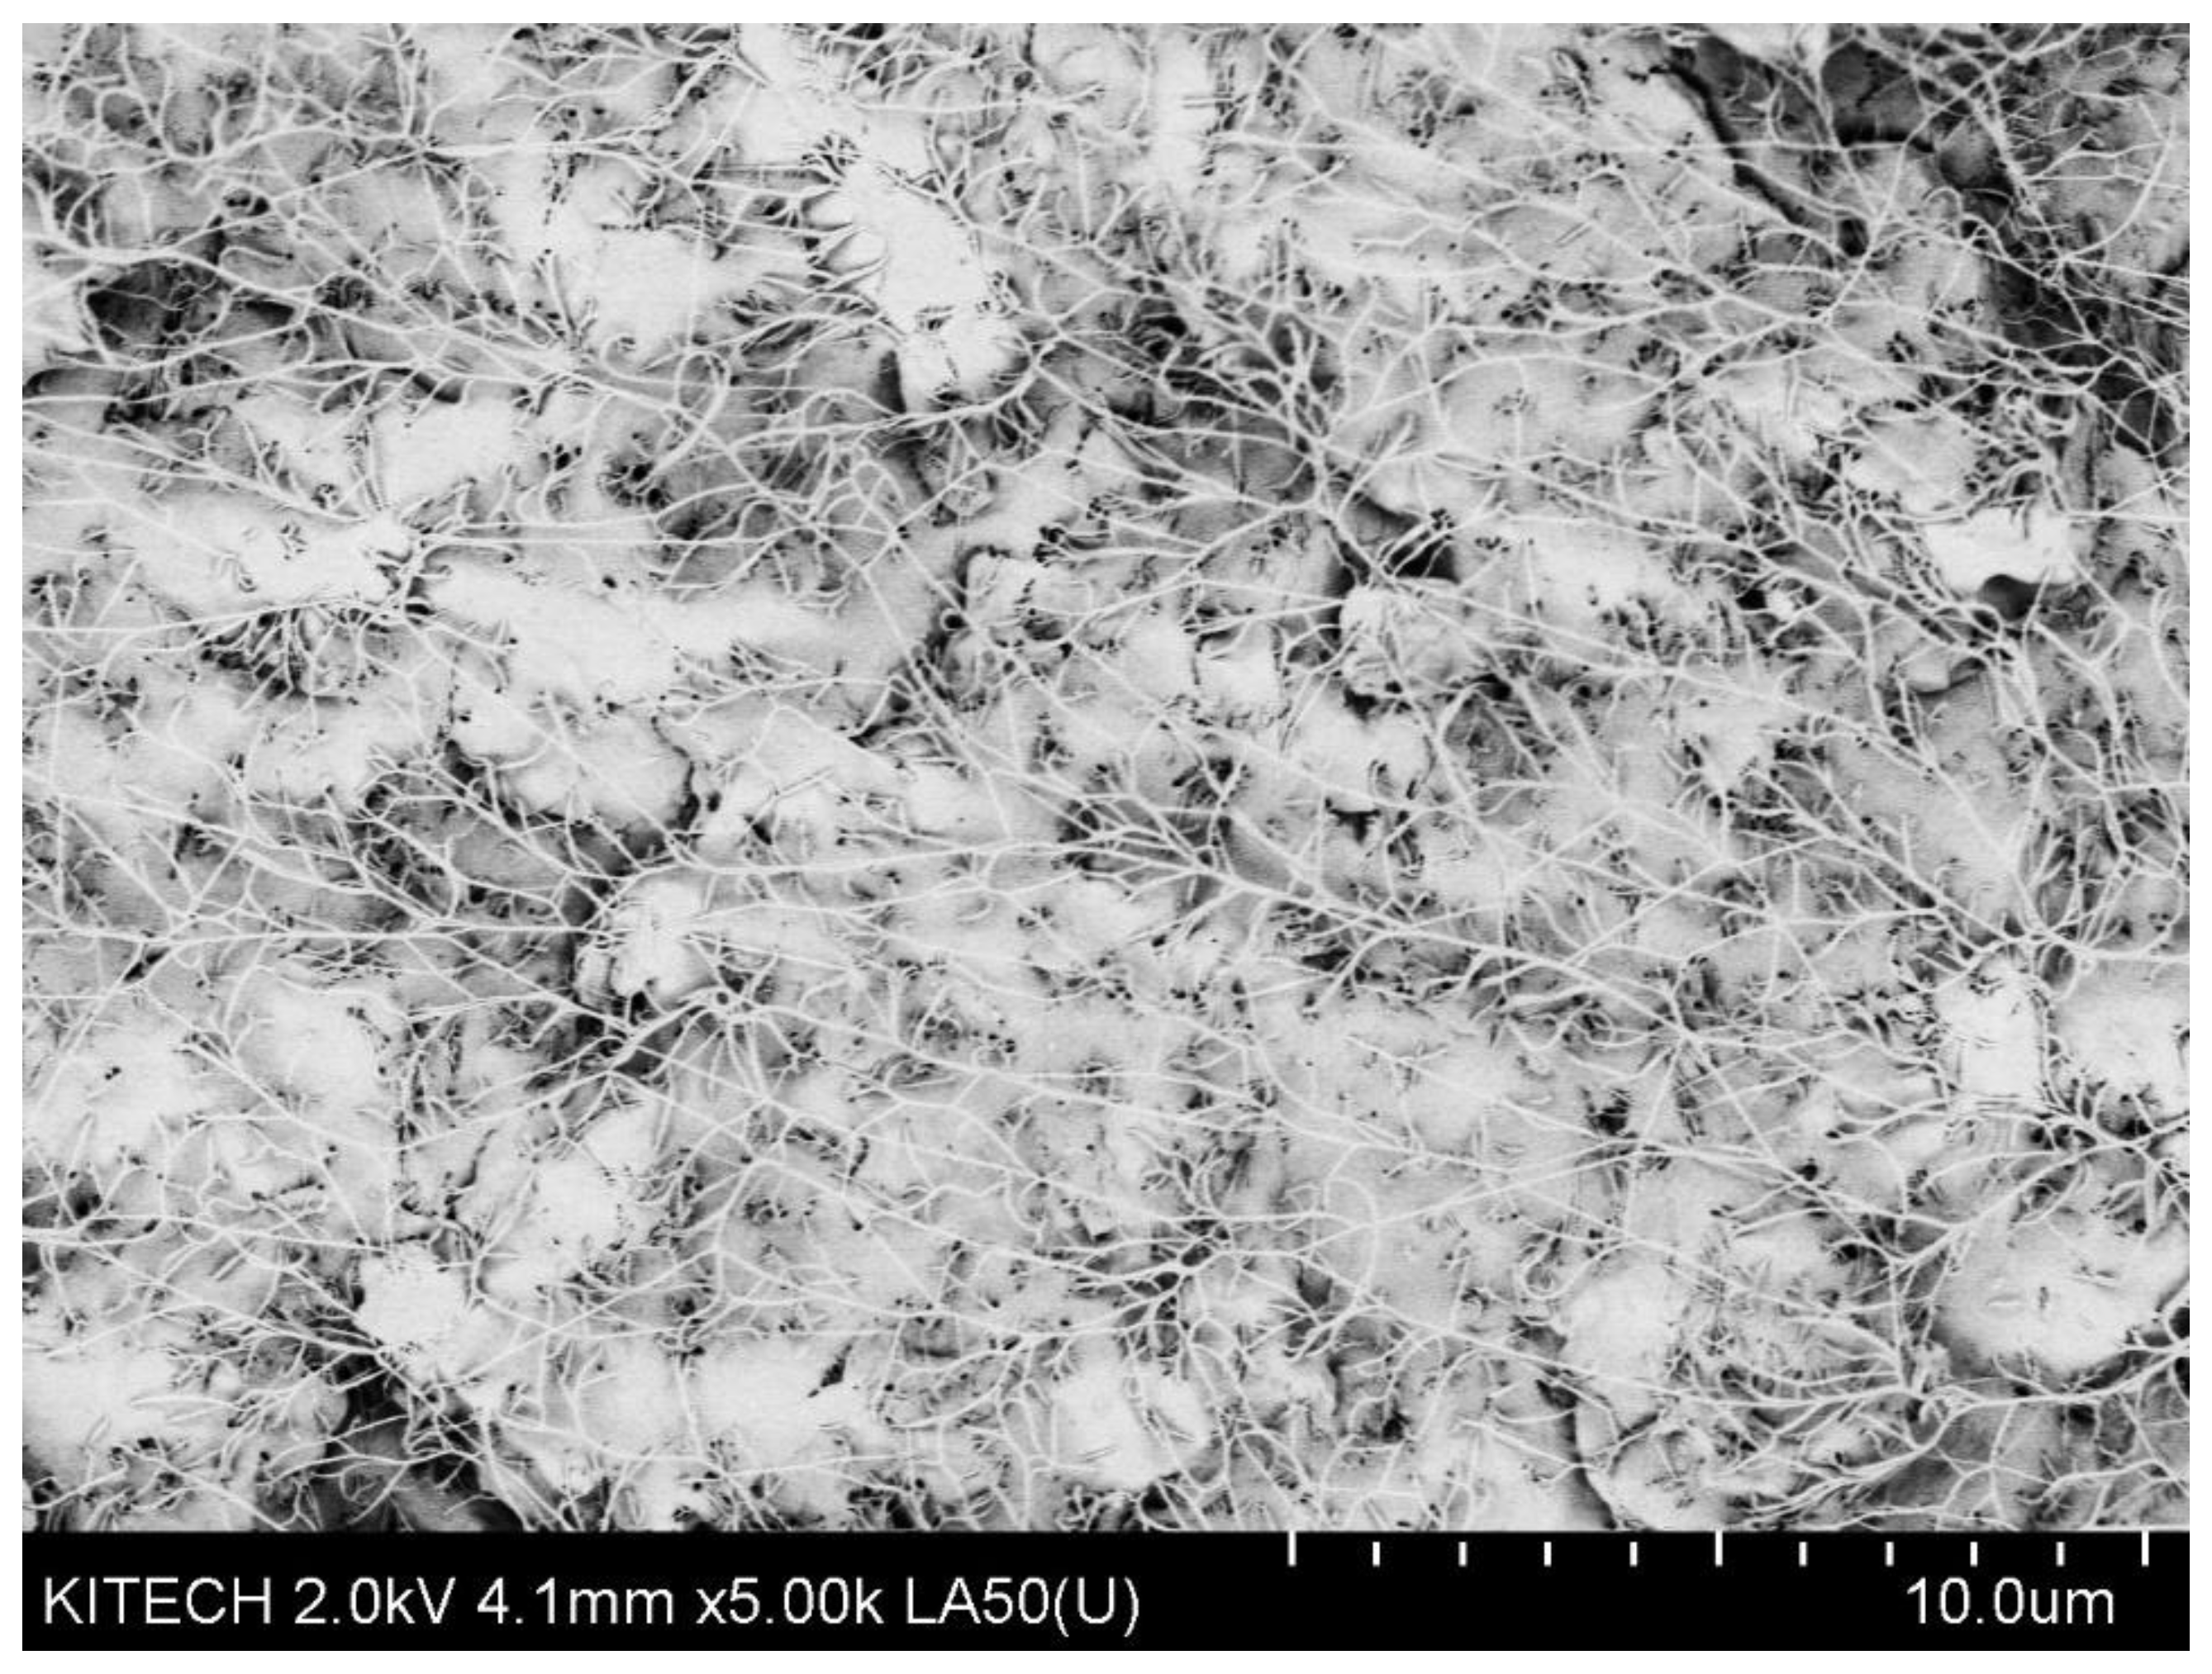
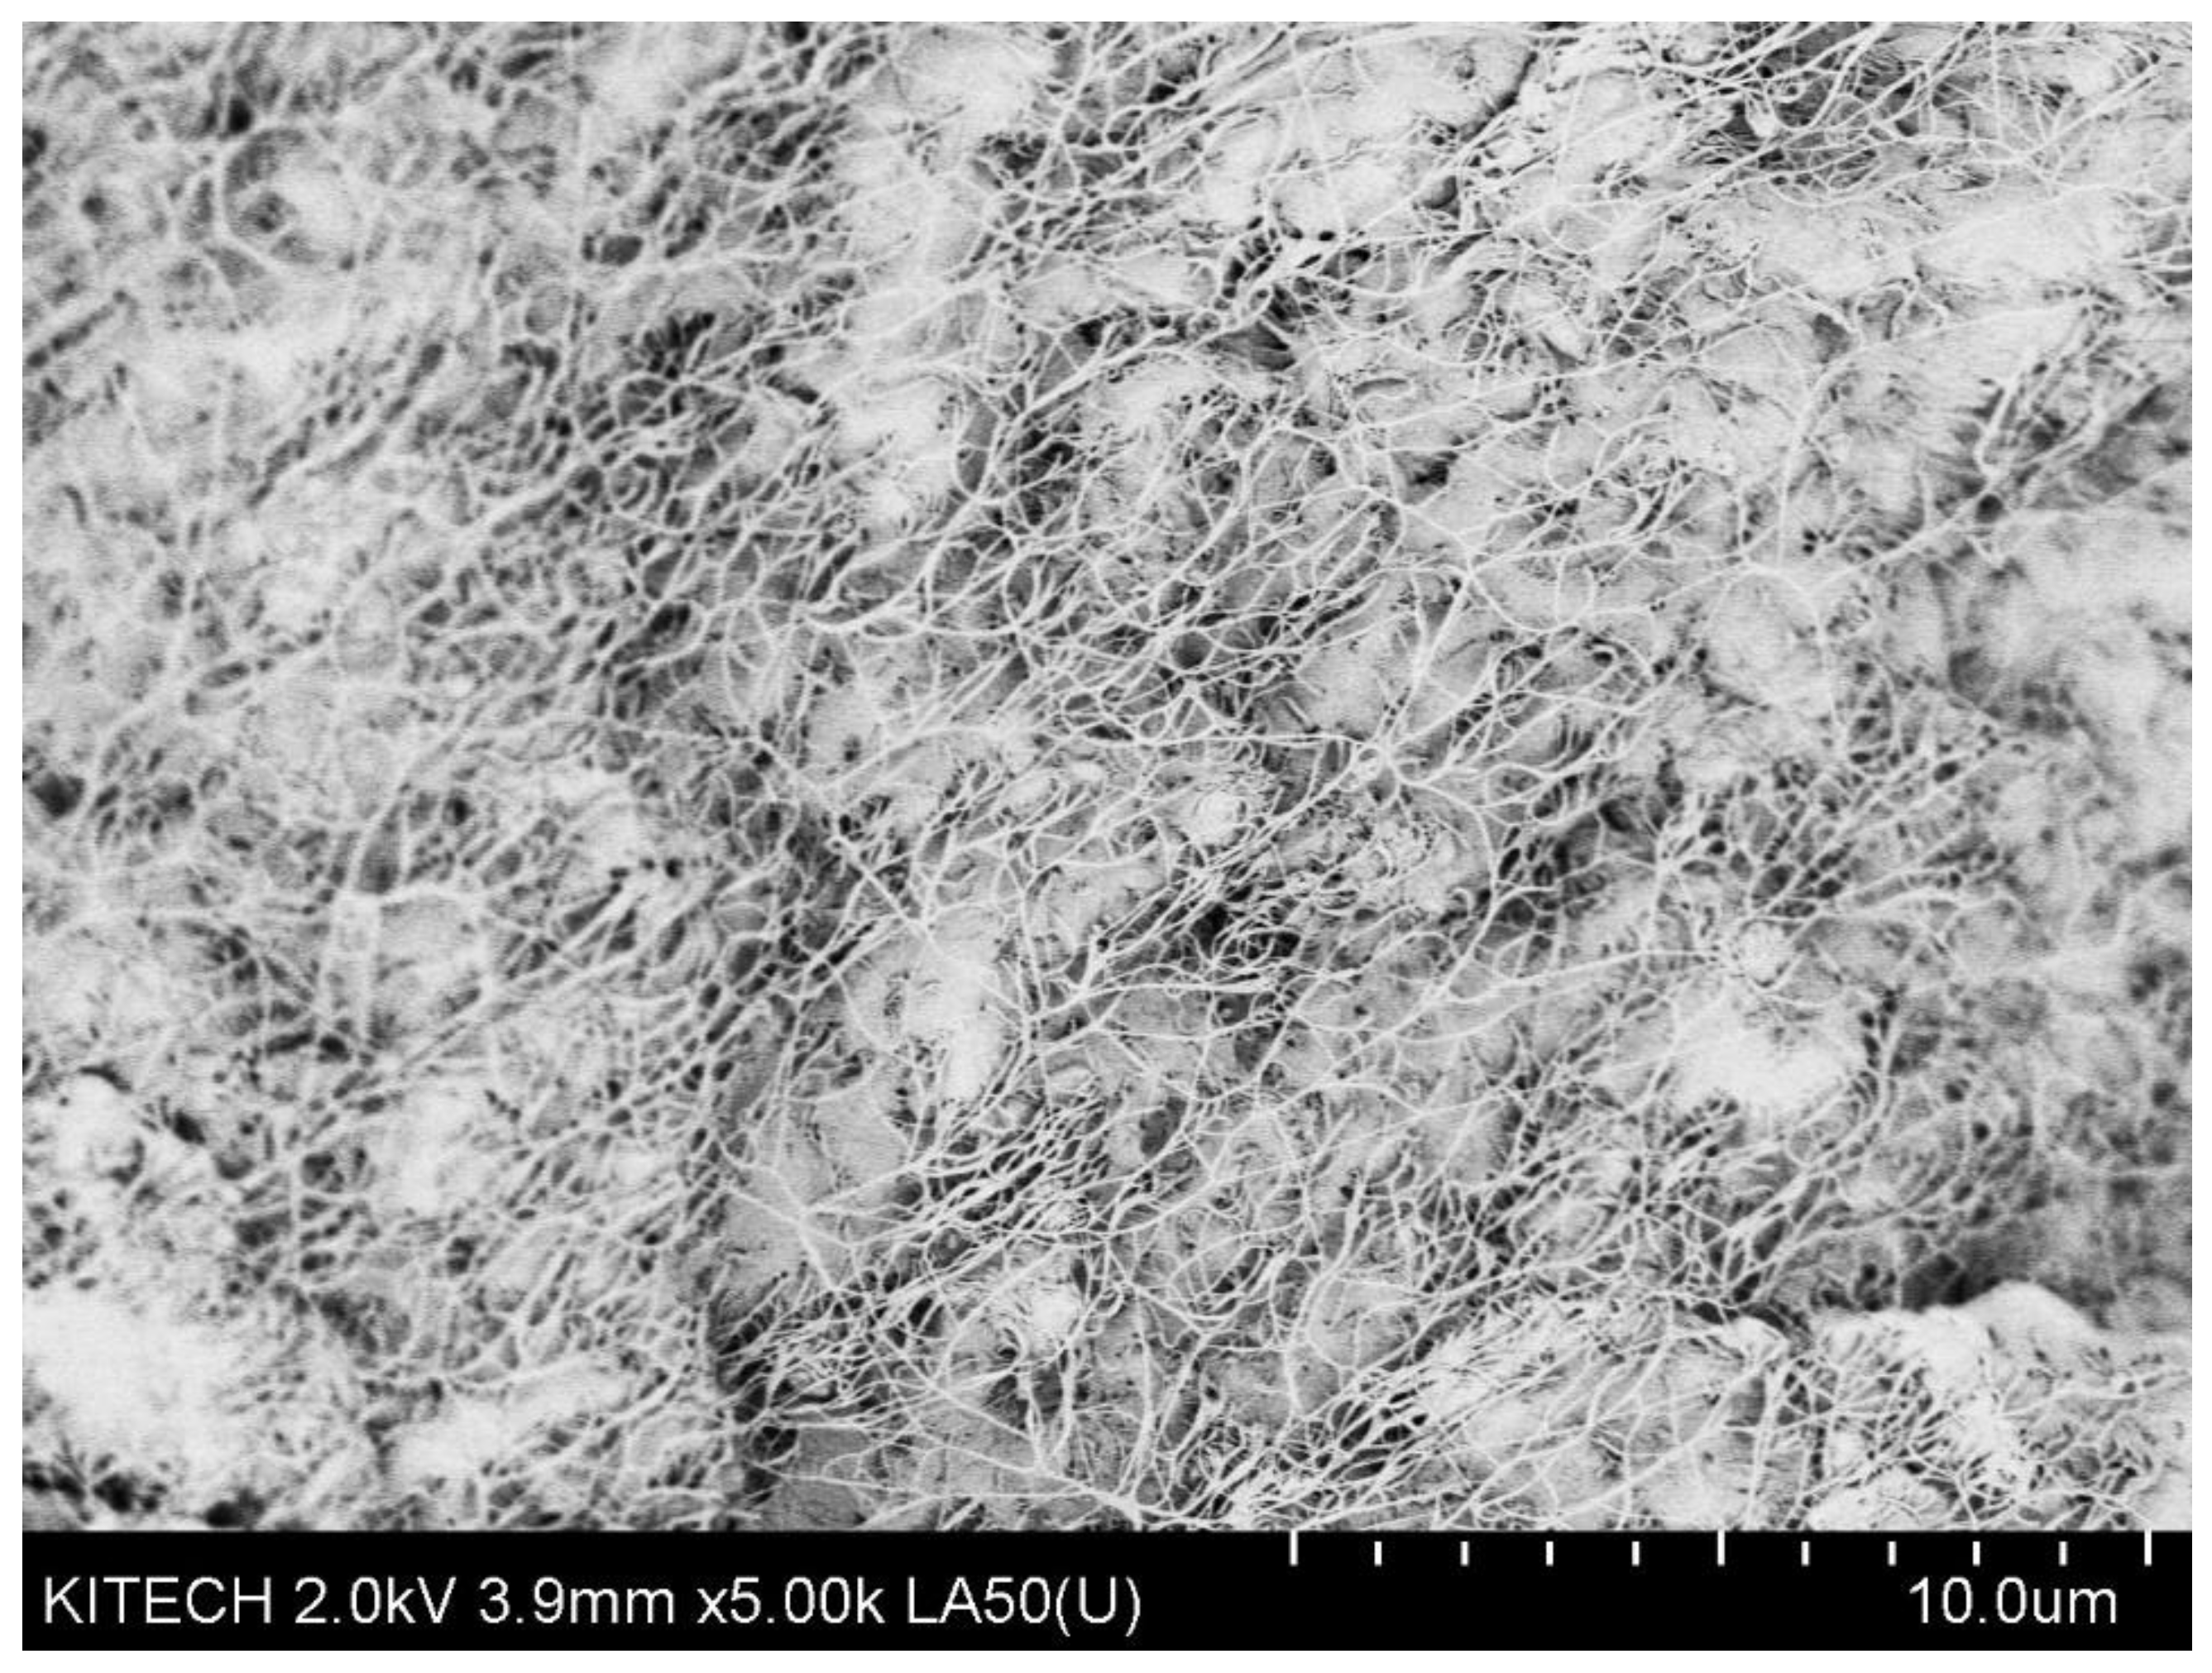
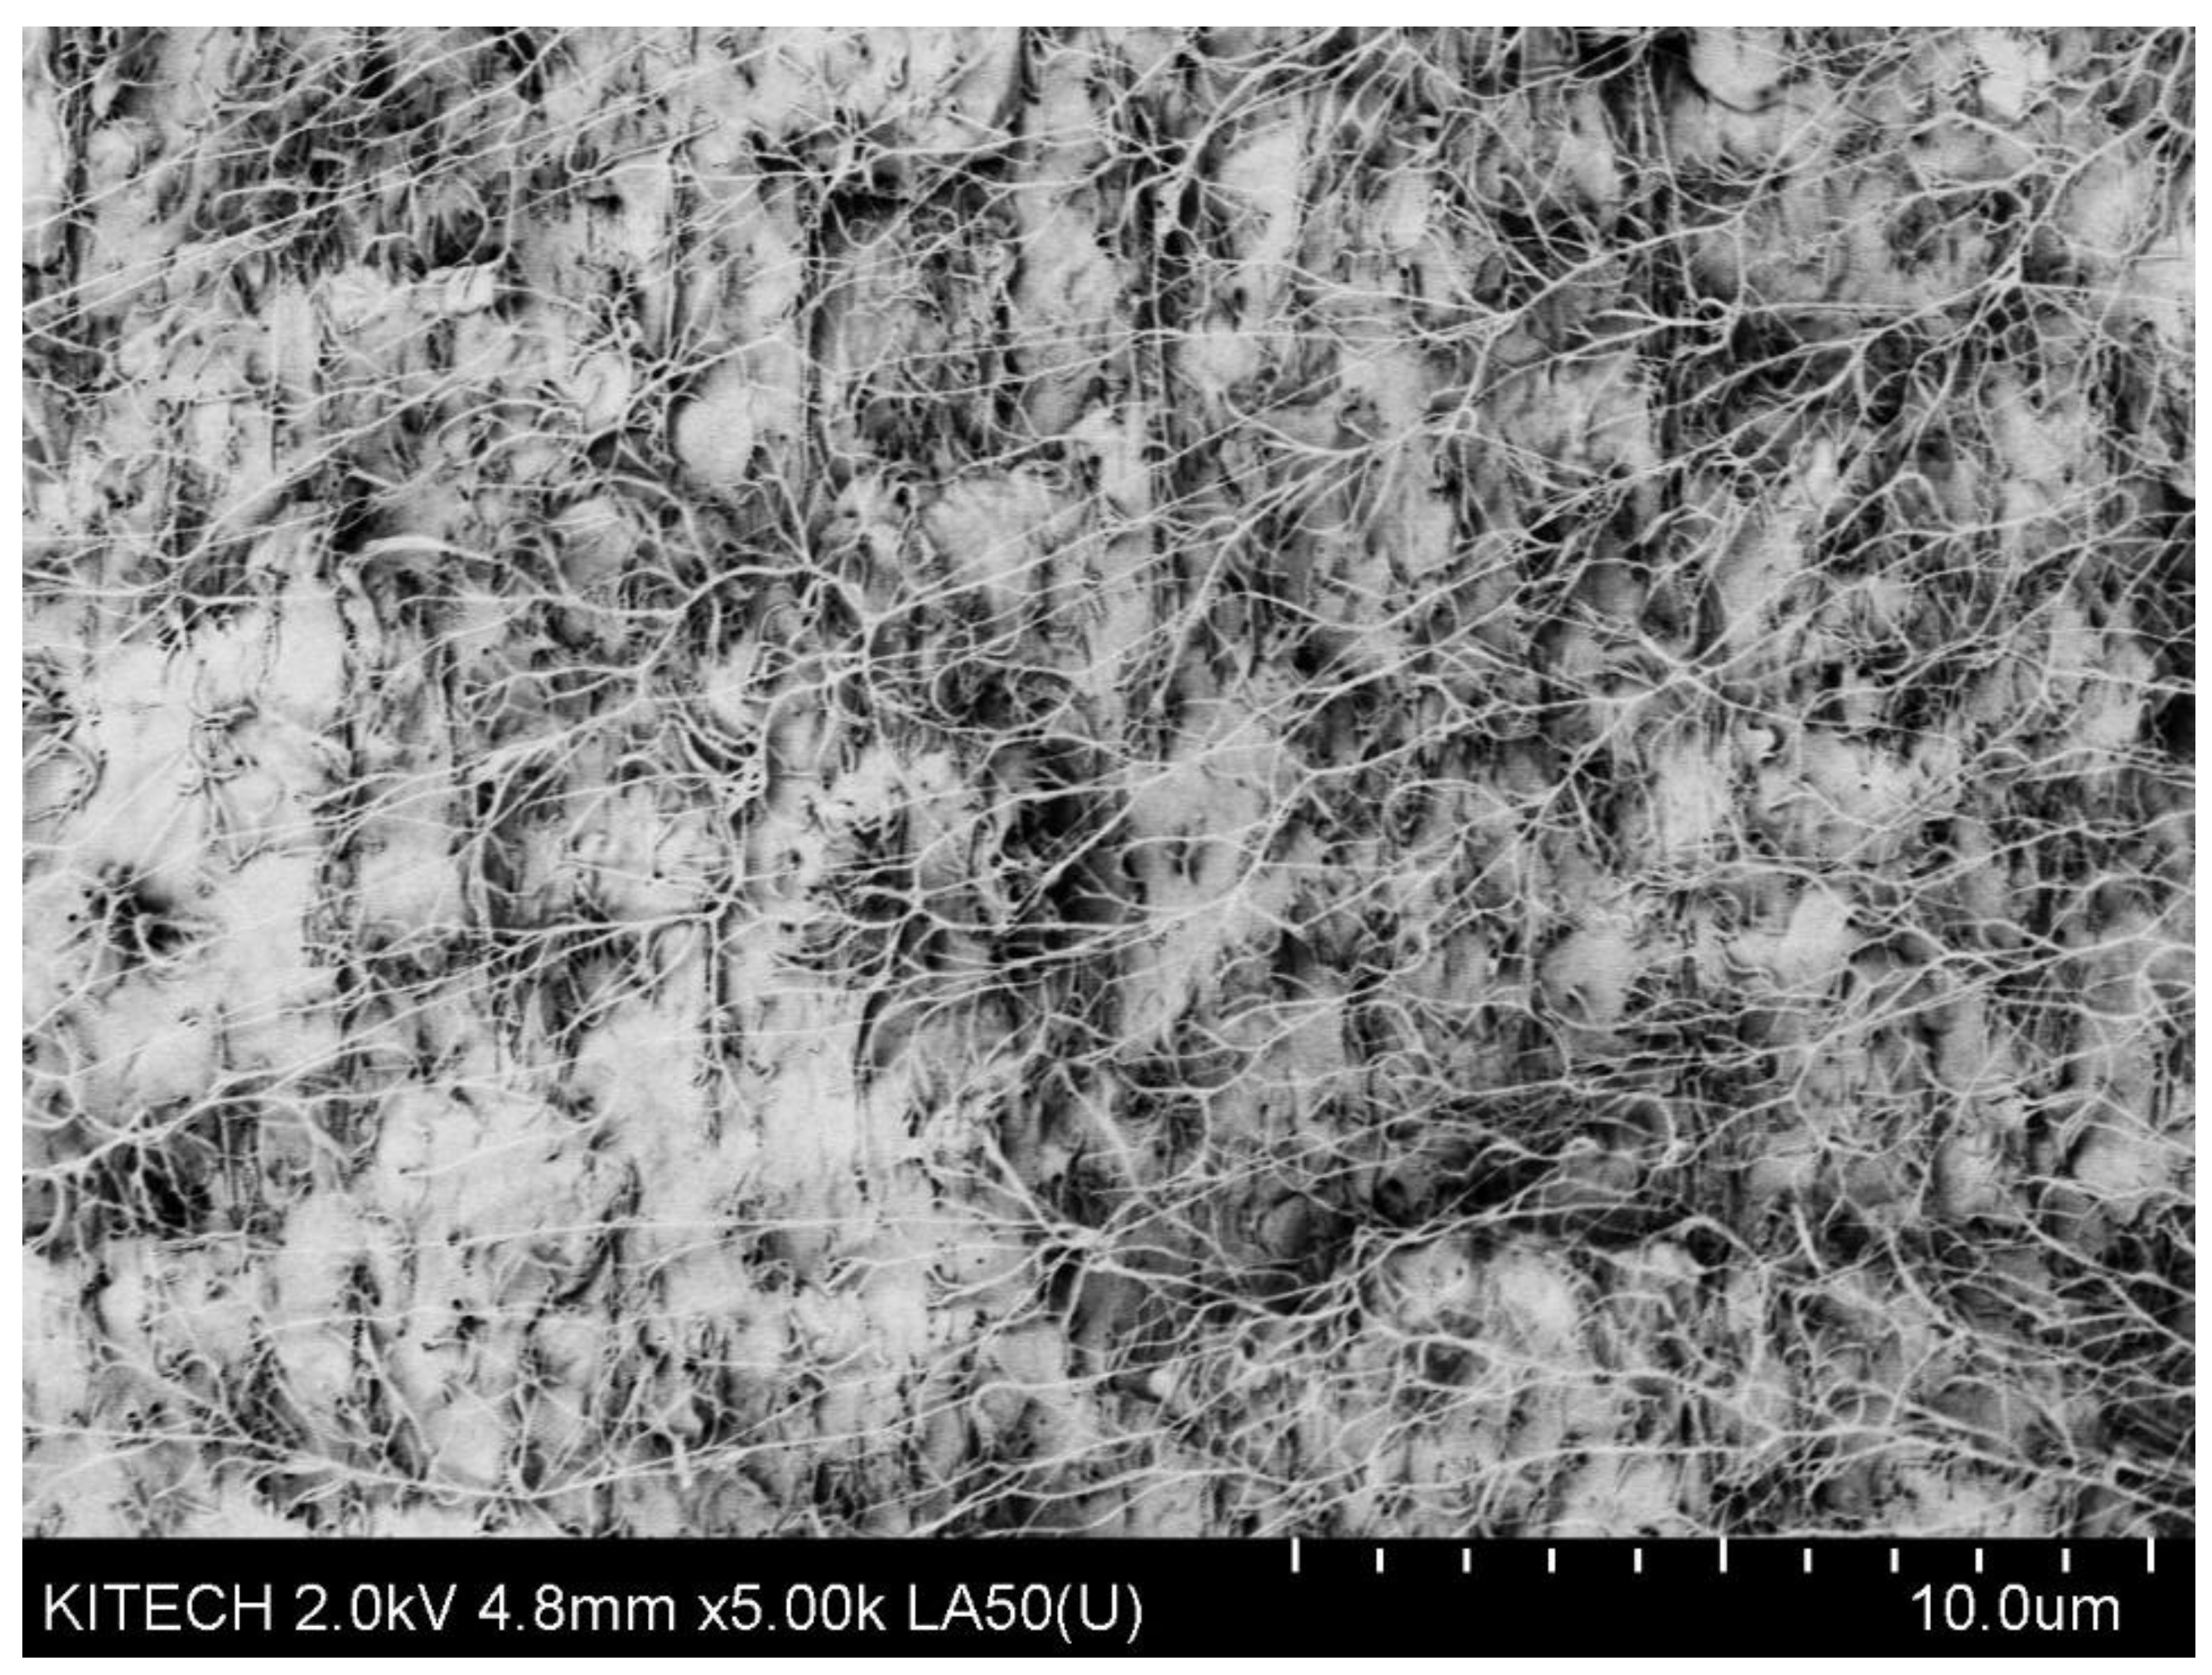
3.3. Morphological Properties of the Composites

Images of macrodispersion, size distribution, and area ratio of undispersed SWNT agglomerates (AA) evaluated by light microscope for composites with varying amounts of SWNTs are described in Figure 5. When it comes to the dispersion of any nanofillers, there are two main mechanisms: erosion and rupture. The erosion mechanism is dominated under low shear stresses with long mixing times, whereas SWNT agglomerates undergo dispersion mainly by the rupture mechanism at high shear stresses. Generally, longer mixing times lead to better dispersion, but they may induce polymer degradation, resulting in reduced viscosity or deteriorated properties of the matrix or the SWNTs. On the other hand, high rotation speed for high shear stresses may cause undesired breakage of SWNTs, reducing the aspect ratio and leading to higher electrical percolation thresholds and higher resistivity values at a given nanotube concentration. Thus, it is important to balance the shear stresses and mixing times for an optimal erosion and rupture mechanism.
In Figure 5, all composites show that the total area of undispersed SWNT agglomerates is less than 3%, which may imply that both mechanisms of dispersion are applied during the method employed in this study. Due to the amount of SWNTs inserted, the already-dispersed nanotubes enhance the matrix viscosity, and thus, the shear stresses act on the remaining initial agglomerates, which is also shown in Figure 2. In other words, as the SWNT content increases, enough high shear stress is generated to rupture the primary agglomerates into smaller agglomerates of different sizes. Given a controlled mixing time of 20 min, an erosion mechanism may take place to erode the free tube, small fragments, and agglomerates from the surface of the larger agglomerates.
It is generally observed that in composites prepared with high loading of SWNT content of more than 1.28 wt.%, relatively large agglomerates (more than 200 µm) are presented. As expected, the number of large agglomerates decreases with decreasing SWNT content. The decrease in the number of agglomerates from the larger diameter classes may indicate that this method may be effective in rupturing the large agglomerates for composites up to approximately 1.28 wt.% SWNT content.
In order to observe the dispersion state of SWNTs in composites and their network formation, FE-SEM was used to examine the composites. FE-SEM images of the composites with the addition of 0.29 wt.%, 1.28 wt.%, and 6.56 wt.% SWNTs are shown in Figure 6. FE-SEM images of the remaining composites are illustrated in Figure A1, Figure A2, Figure A3, Figure A4, Figure A5 and Figure A6. At low SWNT content (Figure 6a), most of the SWNTs are dispersed individually in the PP matrix, and some are formed as small aggregates. As confirmed from the results of the rheological property measurement, despite the small amount of SWNTs introduced, the dispersion state of SWNTs was good enough to transfer the mechanical momentum, resulting in a rheological percolation threshold at 0.29 wt.% SWNTs. As the SWNT content increases (Figure 6b), individual SWNTs gradually grow, and they start to form SWNT networks, resulting in small interparticle distances. Figure 6c illustrates the SEM image of the highest PP/SWNT composite in this study. At this high loading of SWNTs, the SWNT network dominates the properties of the PP/SWNT composite, leading to solid-like behavior at low frequencies of the rheological measurement in Figure 4.

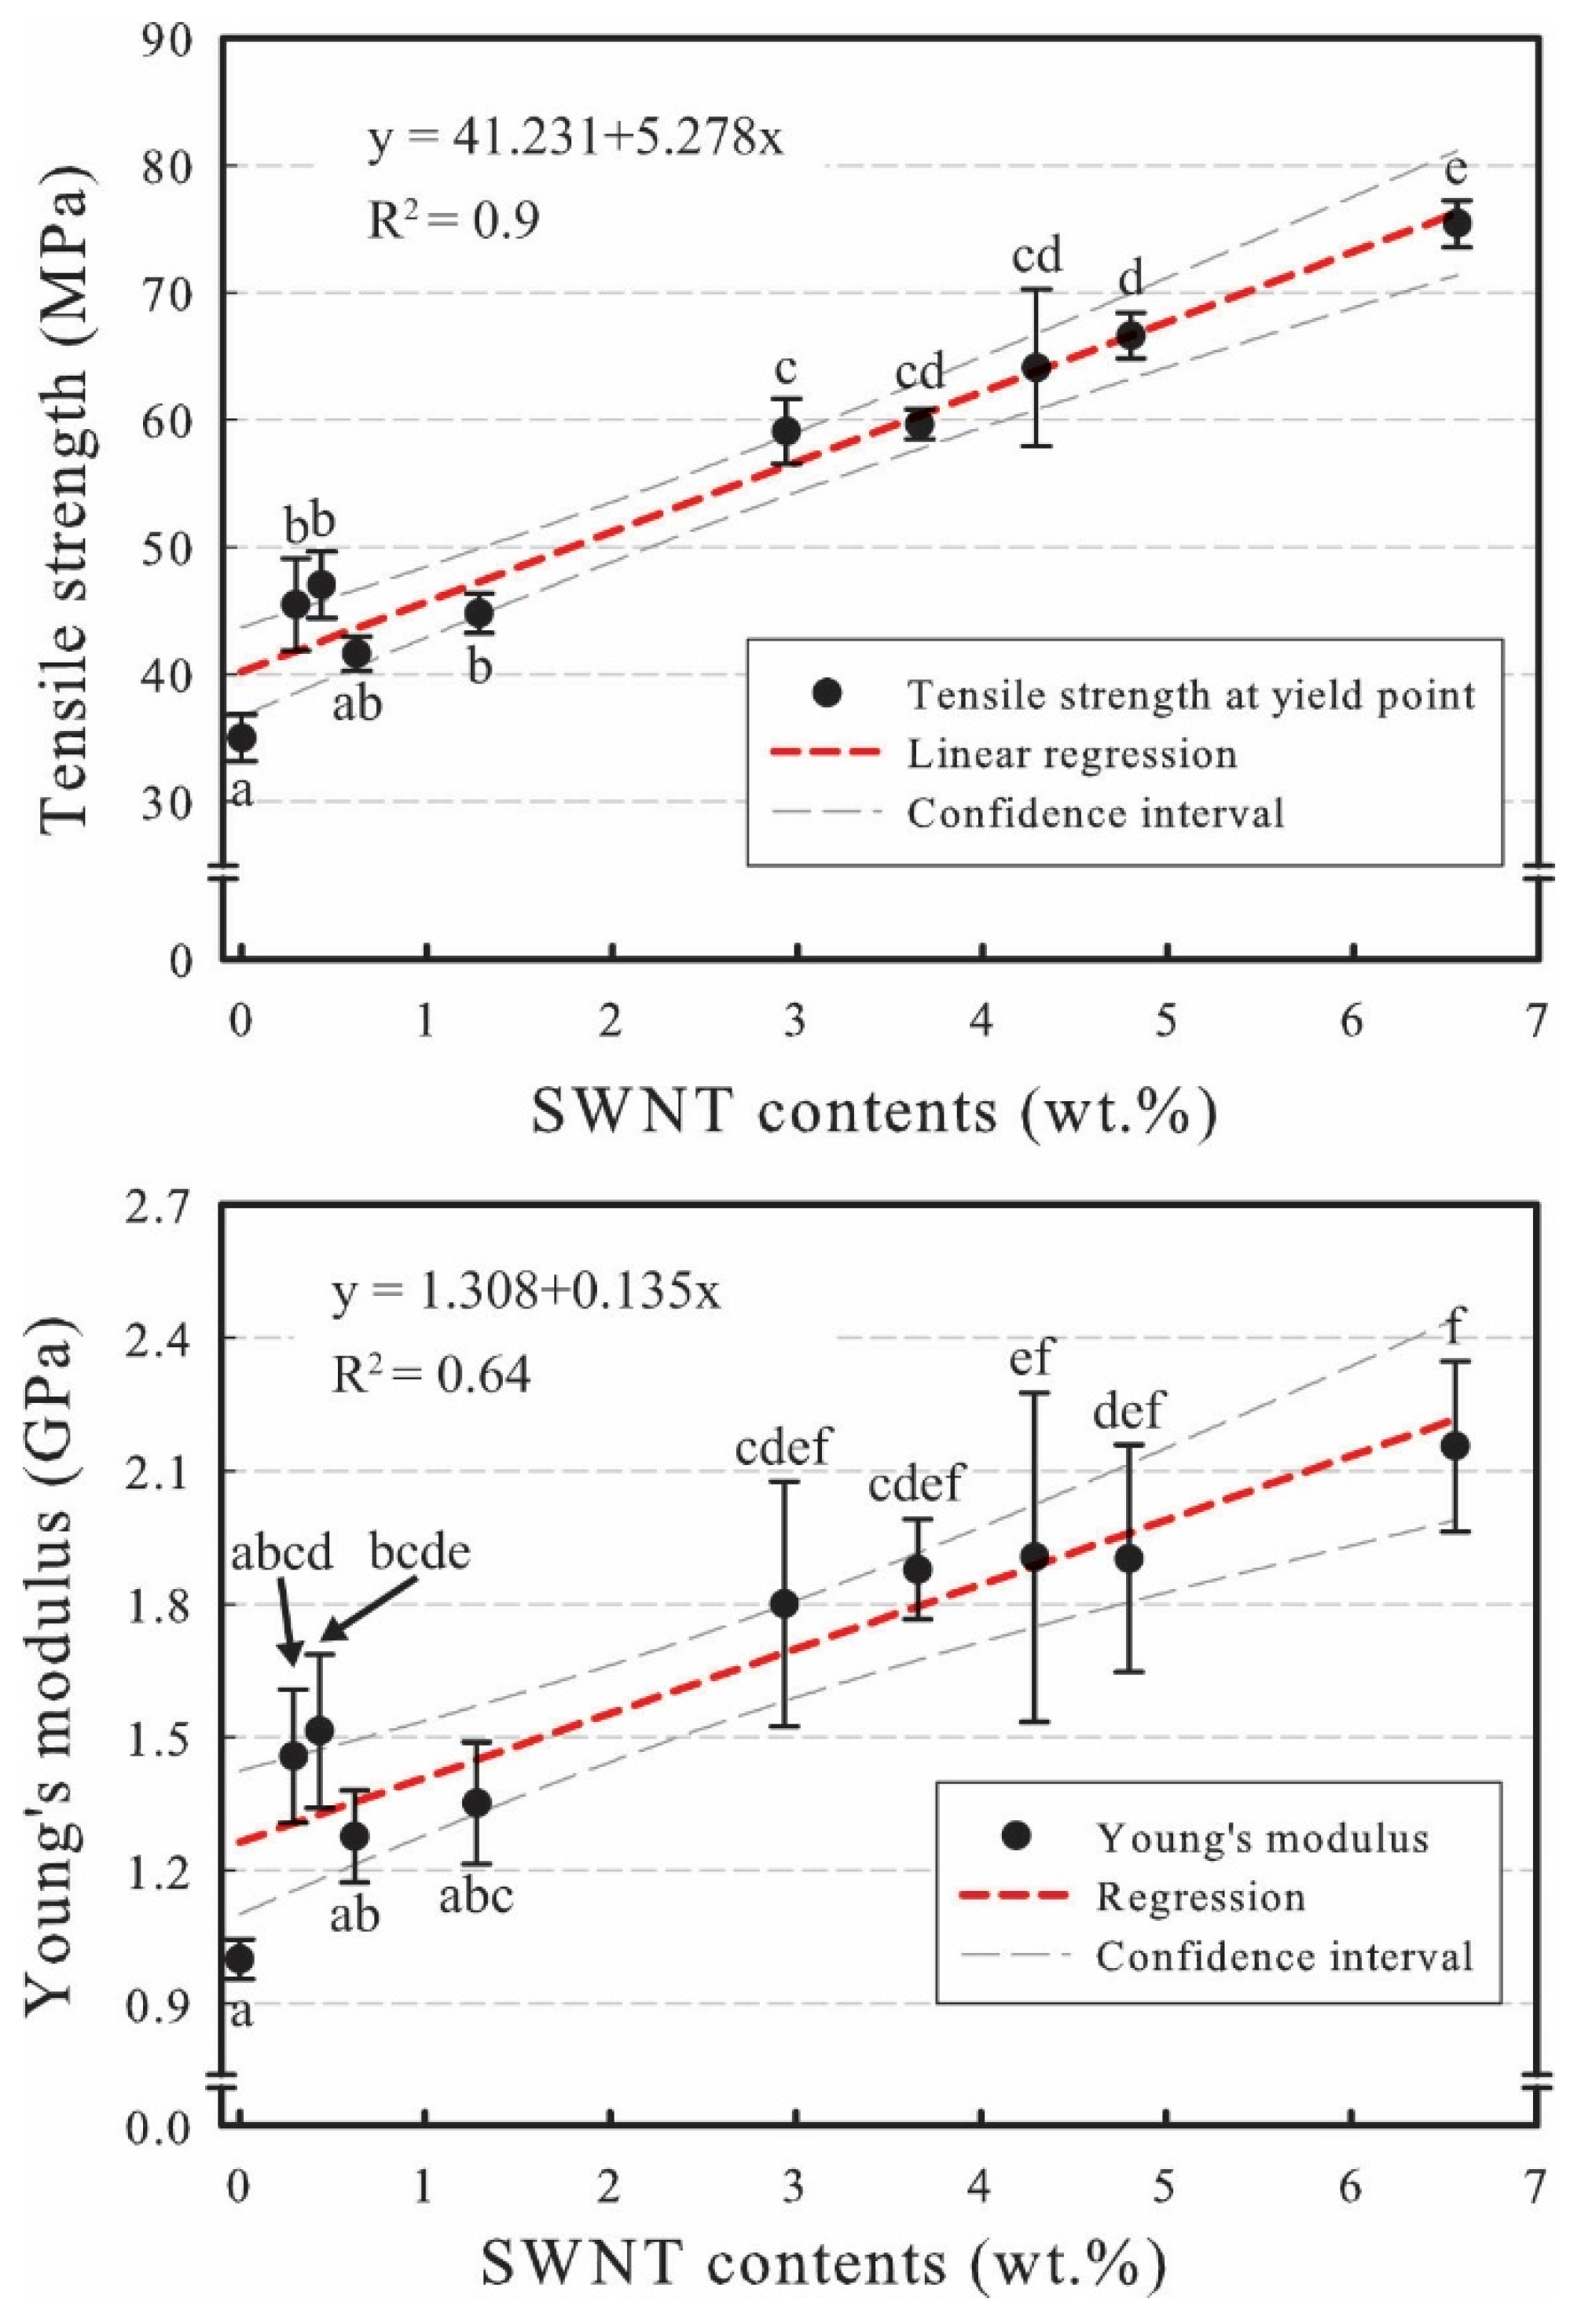
3.4. Mechanical Properties of the Composites

Due to their enormous modulus and high aspect ratio, it is reasonable to expect that the incorporation of SWNTs into polymers will be effective for the reinforcement of polymers, i.e., mechanical properties. The nanometer dimension of the interfacial regions surrounding the SWNTs allows the applied load to be easily transferred from the matrix to the SWNTs.
It has been reported that the formation of large agglomerates as the nanotube content increases acts as a mechanical failure concentrator. Thus, tensile strength and modulus are increased with increasing nanotube content until a certain level, but these properties are decreased when the nanotube content reaches a level where large agglomerates begin to form [51,52]. However, as shown in the upper part of Figure 7, the tensile strength increases almost linearly as the SWNT content increases with the coefficient of determination (R2) of 0.9. Even though the morphological analysis (Figure 5) reveals that relatively large agglomerates are found when the SWNT content is more than 1.28 wt.%, it can be speculated that there are no agglomerates large enough to induce stress cracking with high loading of SWNTs in composites.
The Young’s modulus of the composites is described at the bottom of Figure 7. It continuously increases with increasing SWNT content, revealing the reinforcement effect of SWNTs.

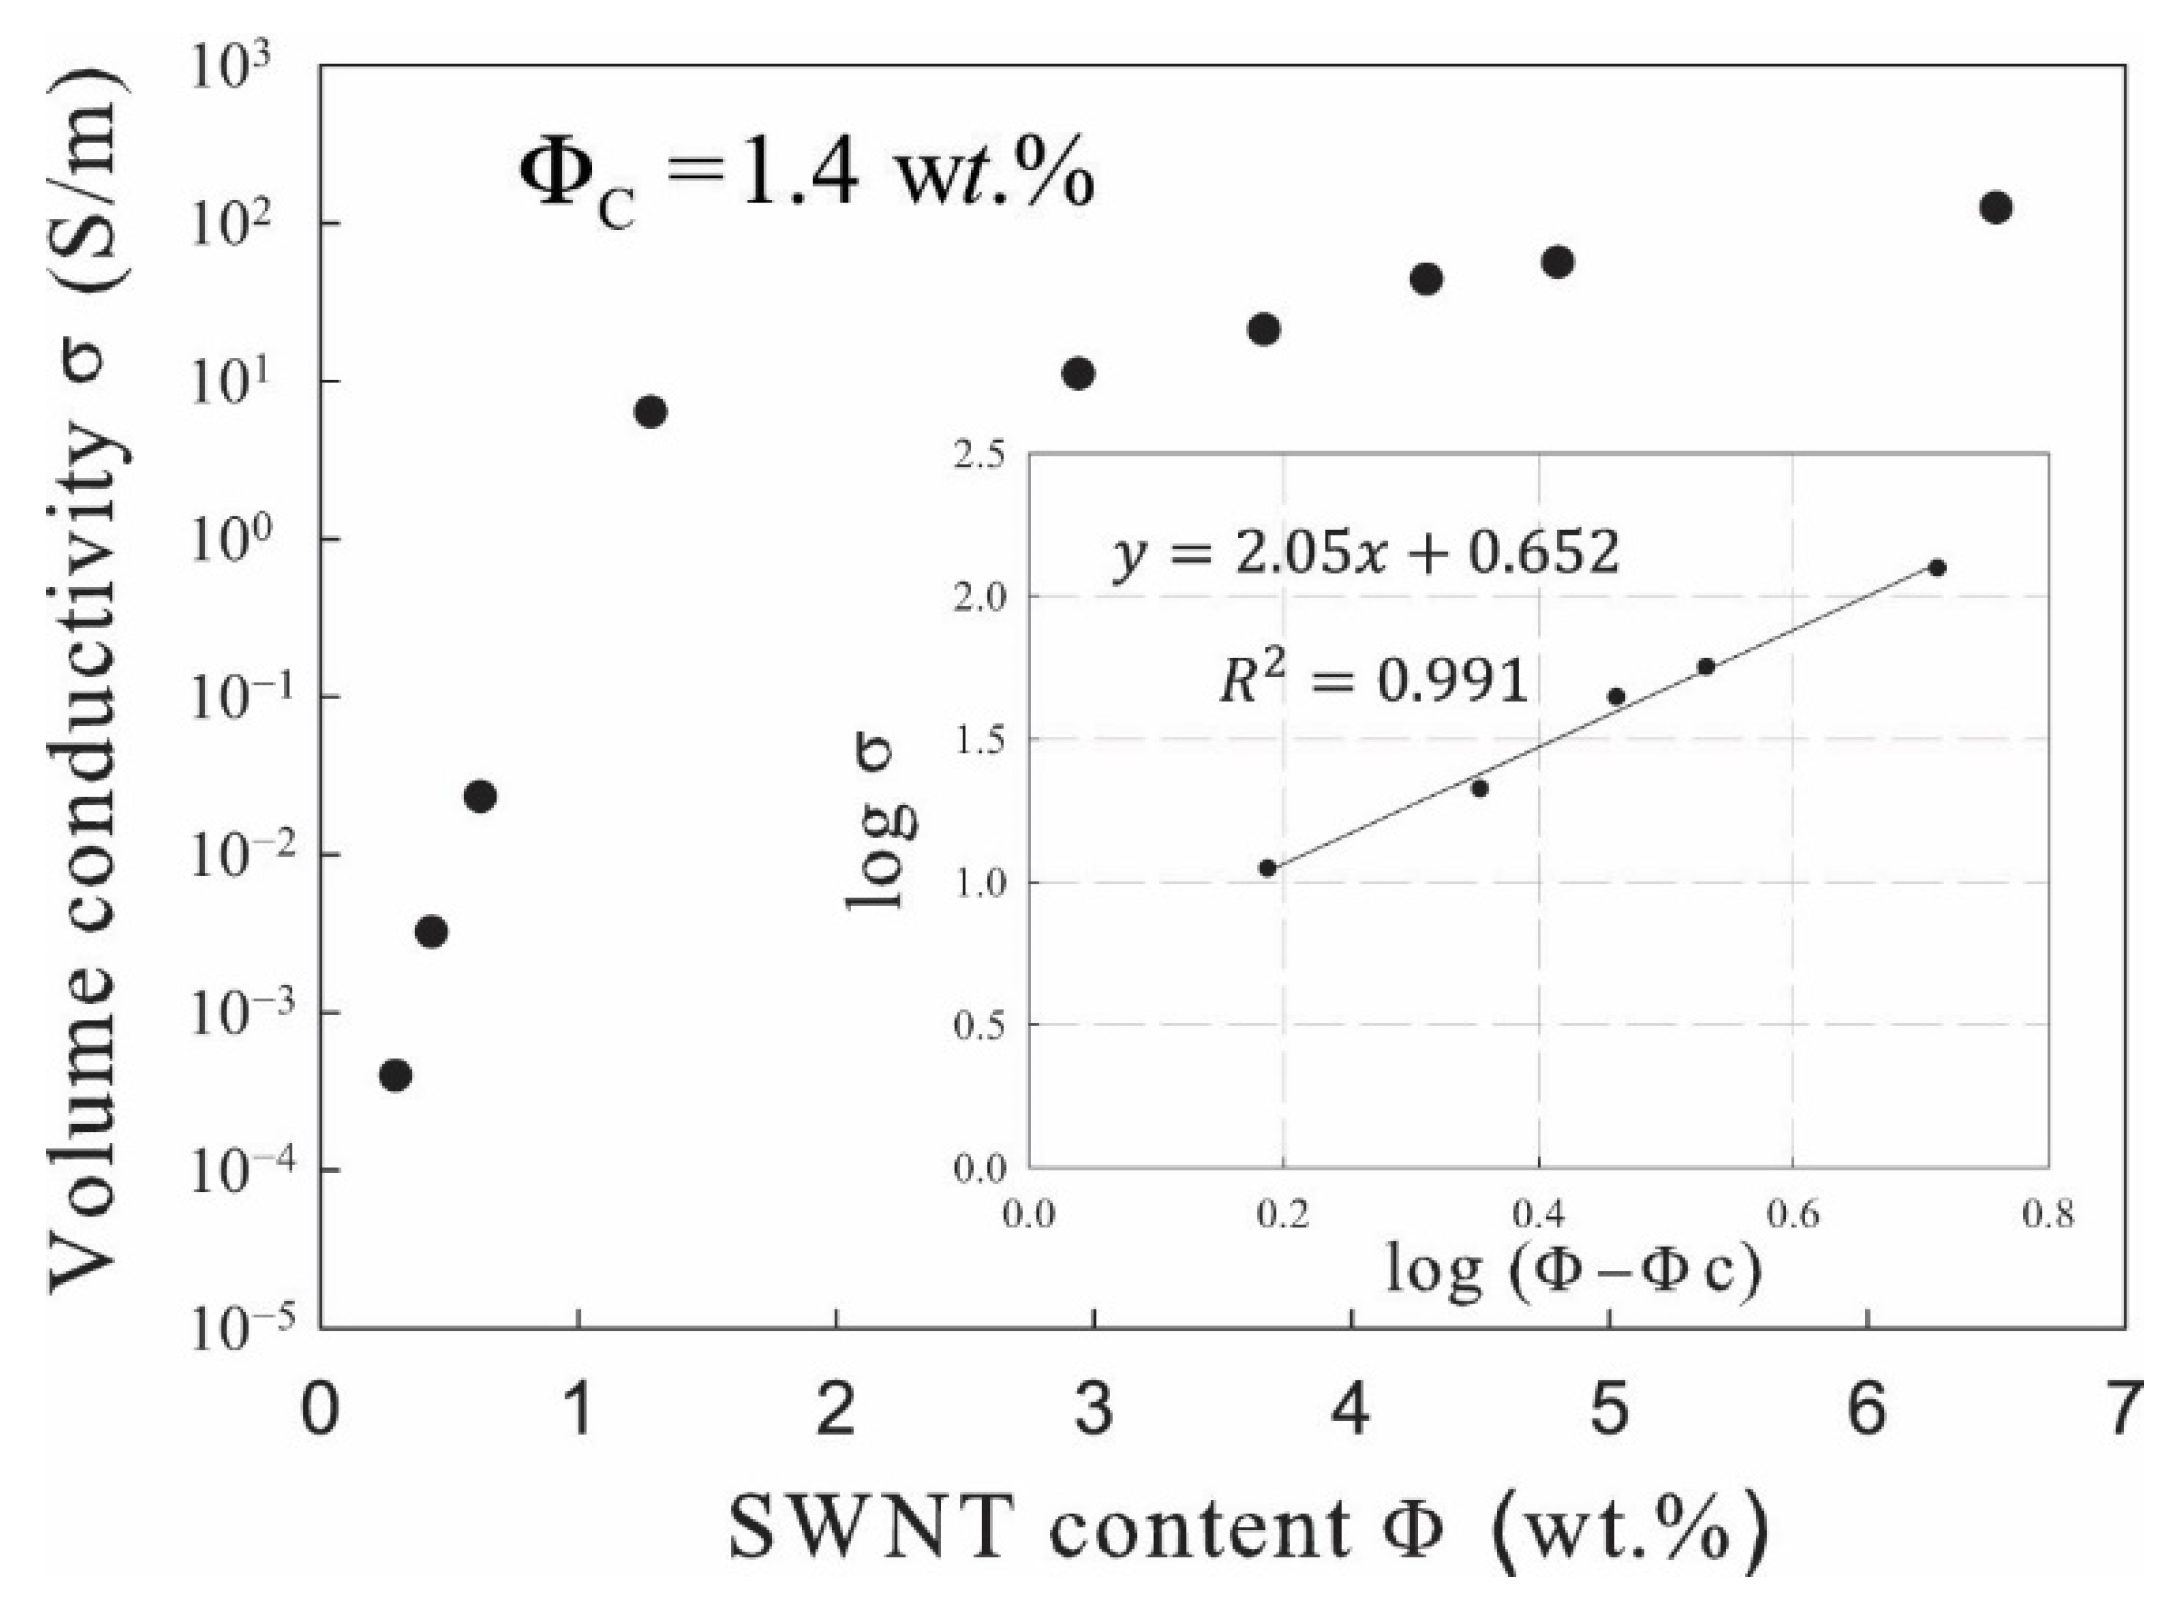
3.5. Electrical Properties of the Composites

One of the main advantages of CNTs is their electrical conductivity, and thus, their inclusion into their PP matrix can construct conductive pathways and increase the electrical conductivity of PP. Electrically conductive polymers based on CNTs and PP have been widely studied [48,53,54,55,56,57]. Electrical percolation thresholds range widely from 0.07 to 2.62 wt.% depending on many factors, such as the processing method and type of CNT (SWNT or MWNT). At these electrical percolation thresholds, the electrical conductivity for PP/CNT composites varies from 10−8 to 10−2 S/m. Compared to this range, the electrical conductivity in this study shows a profound improvement indicating that better microstructure in the PP/SWNT composite can be achieved with the novel processing technology without any additional additives and chemical treatments of PP or SWNTs.
As visible in Figure 8, the results of the statistical percolation theory show that the electrical percolation threshold is 1.4 wt.% with the critical exponent t = 2.05. This result is in parallel with the analysis of the FE-SEM image (Figure 6b), where the 1.28 wt.% SWNT composite shows a well-grown SWNT network, resulting in efficient electron transport through the network. On the other hand, the weight fraction of the rheological percolation threshold (0.29 wt.%) is much lower than the electrical percolation threshold. This different behavior may come from the difference between charge transfer and mechanical momentum transfer. The electrical percolation threshold is mainly determined by the CNT network and the connecting contacts, while the rheological percolation threshold is predominantly related equally with the CNT network, the polymer matrix, and the CNT–polymer network [42].

4. Conclusions

This study discussed the mechanical, electrical, morphological, and rheological properties of SWNT/PP composites prepared by the melt mixing method with a controlled residence time of 20 min. The composites were produced with varying SWNT content, and thermal gravimetric analysis confirmed the SWNT content as 0.29, 0.43, 0.62, 1.28, 2.94, 3.66, 4.29, 4.80, and 6.56 wt.%.
In the rheological measurement, it was found that a residence time of 20 min showed the lowest number-average MW and a low weight-average MW, resulting in a low polydispersity index. Therefore, based on the knowledge that polymer melt infiltration is enhanced with low melt viscosity and molecular weight, a residence time of 20 min for PP was used in this study. The storage modulus began to plateau at low frequencies at 0.29 wt.% loading of SWNTs. As the SWNT content increased, the storage modulus also increased, indicating the formation of interconnected nanotube networks. Based on the van Gurp–Palmen plot, a weight fraction of 0.29 wt.% SWNTs showed the rheological percolation threshold.
Morphological properties were assessed by optical microscopy and FE-SEM. All composites had less than 3% of their total area containing undispersed SWNT agglomerates. Relatively large agglomerates greater than 200 µm were found for composites containing more than 1.28 wt.% SWNTs. Additionally, FE-SEM analysis revealed that individual SWNTs and their small agglomerates were found in the 0.29 wt.% SWNT composite. As SWNT content increased in the PP matrix, the SWNT network also increased, forming an efficient electrical percolation network at 1.28 wt.%.
Despite the large agglomerates found in the morphological measurement at high loading of the SWNT composite, tensile strength and Young’s modulus increased linearly with increasing SWNT content, which may imply that relatively large agglomerates were not enough to induce stress cracking.
The result of the statistical percolation theory revealed that the electrical percolation threshold was 1.4 wt.% with a critical exponent t of 2.05. Volume conductivity increased with increasing SWNT content in the composites.
In summary, due to the controlled residence time and excellent dispersion state, an improvement in the electrical conductivity of the SWNTs in the PP matrix was achieved with the novel melt mixing process without further modifications, such as compatibilizers or chemical treatment of CNTs. Rheological, morphological, and electrical measurements supported that an optimized dispersion and electrical percolation network of SWNTs was formed with around 1.28 wt.% SWNTs in PP. However, given the fact that SWNTs have better properties than MWNTs, an electrical percolation threshold of around 1.28 wt.% loading of SWNTs may not meet expectations. This may be because a possible filler breakage, reducing the aspect ratio of SWNTs, occurred during the melt mixing process with a residence time of 20 min. This breakage, however, may help to form an efficient electrical percolation network, generating high electrical conductivity. Further analysis of SWNT length reduction by the melt mixing process and its effects will be needed to confirm this statement.

Author Contributions

Main author, D.K.; main coauthor, S.H.; sample preparation, B.J.; corresponding author, J.S. All authors have read and agreed to the published version of the manuscript.

Funding

This research and APC were funded by the Ministry of Strategy and Finance in South Korea, grant number EH210009.

Institutional Review Board Statement

Not applicable.

Informed Consent Statement

Not applicable.

Conflicts of Interest

The authors declare no conflict of interest.

Appendix A

SEM images of varying amounts (0.43 wt.%, 0.62 wt.%, 2.94 wt.%, 3.66 wt.%, 4.29 wt.%, and 4.90 wt.%) of SWNT-incorporated composites are shown below.
Figure A1. SEM image of the 0.43 wt.% SWNT/PP composite.
Processes 09 01395 g0a1
Figure A2. SEM image of the 0.62 wt.% SWNT/PP composite.
Processes 09 01395 g0a2
Figure A3. SEM image of the 2.94 wt.% SWNT/PP composite.
Processes 09 01395 g0a3
Figure A4. SEM image of the 3.66 wt.% SWNT/PP composite.
Processes 09 01395 g0a4
Figure A5. SEM image of the 4.29 wt.% SWNT/PP composite.
Processes 09 01395 g0a5
Figure A6. SEM image of the 4.90 wt.% SWNT/PP composite.
Processes 09 01395 g0a6

References

  1. Villmow, T.; Kretzschmar, B.; Pötschke, P. Influence of screw configuration, residence time, and specific mechanical energy in twin-screw extrusion of polycaprolactone/multi-walled carbon nanotube composites. Compos. Sci. Technol. 2010, 70, 2045–2055. [Google Scholar] [CrossRef] [Green Version]
  2. Iijima, S. Helical microtubules of graphitic carbon. Nature 1991, 354, 56–58. [Google Scholar] [CrossRef]
  3. Charlier, J.-C.; Michenaud, J.-P. Energetics of multilayered carbon tubules. Phys. Rev. Lett. 1993, 70, 1858. [Google Scholar] [CrossRef]
  4. Saito, R.; Dresselhaus, G.; Dresselhaus, M. Electronic structure of double-layer graphene tubules. J. Appl. Phys. 1993, 73, 494–500. [Google Scholar] [CrossRef]
  5. White, C.; Robertson, D.; Mintmire, J. Helical and rotational symmetries of nanoscale graphitic tubules. Phys. Rev. B 1993, 47, 5485. [Google Scholar] [CrossRef] [PubMed]
  6. Dresselhaus, M.; Dresselhaus, G.; Pimenta, M. The remarkable properties of carbon nanotubes as nanoclusters. Eur. Phys. J. D At. Mol. Opt. Plasma Phys. 1999, 9, 69–75. [Google Scholar]
  7. Ebbesen, T.; Lezec, H.; Hiura, H.; Bennett, J.; Ghaemi, H.; Thio, T. Electrical conductivity of individual carbon nanotubes. Nature 1996, 382, 54–56. [Google Scholar] [CrossRef]
  8. Dai, H.; Wong, E.W.; Lieber, C.M. Probing electrical transport in nanomaterials: Conductivity of individual carbon nanotubes. Science 1996, 272, 523–526. [Google Scholar] [CrossRef]
  9. Hone, J.; Llaguno, M.; Biercuk, M.; Johnson, A.; Batlogg, B.; Benes, Z.; Fischer, J. Thermal properties of carbon nanotubes and nanotube-based materials. Appl. Phys. A 2002, 74, 339–343. [Google Scholar] [CrossRef]
  10. Berber, S.; Kwon, Y.-K.; Tománek, D. Unusually high thermal conductivity of carbon nanotubes. Phys. Rev. Lett. 2000, 84, 4613. [Google Scholar] [CrossRef] [Green Version]
  11. Che, J.; Cagin, T.; Goddard, W.A., III. Thermal conductivity of carbon nanotubes. Nanotechnology 2000, 11, 65. [Google Scholar] [CrossRef]
  12. Ruoff, R.S.; Lorents, D.C. Mechanical and thermal properties of carbon nanotubes. Carbon 1995, 33, 925–930. [Google Scholar] [CrossRef]
  13. Treacy, M.J.; Ebbesen, T.; Gibson, J. Exceptionally high Young’s modulus observed for individual carbon nanotubes. Nature 1996, 381, 678–680. [Google Scholar] [CrossRef]
  14. Li, F.; Cheng, H.; Bai, S.; Su, G.; Dresselhaus, M. Tensile strength of single-walled carbon nanotubes directly measured from their macroscopic ropes. Appl. Phys. Lett. 2000, 77, 3161–3163. [Google Scholar] [CrossRef]
  15. Pan, Z.; Xie, S.; Chang, B.; Wang, C.; Lu, L.; Liu, W.; Zhou, W.; Li, W.; Qian, L. Very long carbon nanotubes. Nature 1998, 394, 631–632. [Google Scholar] [CrossRef]
  16. Walters, D.; Ericson, L.; Casavant, M.; Liu, J.; Colbert, D.; Smith, K.; Smalley, R. Elastic strain of freely suspended single-wall carbon nanotube ropes. Appl. Phys. Lett. 1999, 74, 3803–3805. [Google Scholar] [CrossRef] [Green Version]
  17. Salvetat, J.-P.; Bonard, J.-M.; Thomson, N.; Kulik, A.; Forro, L.; Benoit, W.; Zuppiroli, L. Mechanical properties of carbon nanotubes. Appl. Phys. A 1999, 69, 255–260. [Google Scholar] [CrossRef]
  18. Demczyk, B.; Wang, Y.; Cumings, J.; Hetman, M.; Han, W.; Zettl, A.; Ritchie, R. Direct mechanical measurement of the tensile strength and elastic modulus of multiwalled carbon nanotubes. Mater. Sci. Eng. A 2002, 334, 173–178. [Google Scholar] [CrossRef]
  19. El Assami, Y.; Drissi Habti, M.; Raman, V. Stiffening offshore composite wind-blades bonding joints by carbon nanotubes reinforced resin–a new concept. J. Struct. Integr. Maint. 2020, 5, 87–103. [Google Scholar]
  20. De Volder, M.F.; Tawfick, S.H.; Baughman, R.H.; Hart, A.J. Carbon nanotubes: Present and future commercial applications. Science 2013, 339, 535–539. [Google Scholar] [CrossRef] [Green Version]
  21. Kingston, C.; Zepp, R.; Andrady, A.; Boverhof, D.; Fehir, R.; Hawkins, D.; Roberts, J.; Sayre, P.; Shelton, B.; Sultan, Y. Release characteristics of selected carbon nanotube polymer composites. Carbon 2014, 68, 33–57. [Google Scholar] [CrossRef]
  22. Chen, G.-X.; Li, Y.; Shimizu, H. Ultrahigh-shear processing for the preparation of polymer/carbon nanotube composites. Carbon 2007, 45, 2334–2340. [Google Scholar] [CrossRef]
  23. Sen, R.; Zhao, B.; Perea, D.; Itkis, M.E.; Hu, H.; Love, J.; Bekyarova, E.; Haddon, R.C. Preparation of single-walled carbon nanotube reinforced polystyrene and polyurethane nanofibers and membranes by electrospinning. Nano Lett. 2004, 4, 459–464. [Google Scholar] [CrossRef]
  24. Vigolo, B.; Poulin, P.; Lucas, M.; Launois, P.; Bernier, P. Improved structure and properties of single-wall carbon nanotube spun fibers. Appl. Phys. Lett. 2002, 81, 1210–1212. [Google Scholar] [CrossRef]
  25. Chen, G.-X.; Kim, H.-S.; Park, B.-H.; Yoon, J.-S. Highly insulating silicone composites with a high carbon nanotube content. Carbon 2006, 44, 3373–3375. [Google Scholar] [CrossRef]
  26. Regev, O.; ElKati, P.N.; Loos, J.; Koning, C.E. Preparation of conductive nanotube-polymer composites using latex technology. Adv. Mater. 2004, 16, 248–251. [Google Scholar] [CrossRef]
  27. Kasaliwal, G.; Göldel, A.; Pötschke, P. Influence of processing conditions in small-scale melt mixing and compression molding on the resistivity and morphology of polycarbonate–MWNT composites. J. Appl. Polym. Sci. 2009, 112, 3494–3509. [Google Scholar] [CrossRef]
  28. Krause, B.; Pötschke, P.; Häußler, L. Influence of small scale melt mixing conditions on electrical resistivity of carbon nanotube-polyamide composites. Compos. Sci. Technol. 2009, 69, 1505–1515. [Google Scholar] [CrossRef]
  29. Pegel, S.; Pötschke, P.; Petzold, G.; Alig, I.; Dudkin, S.M.; Lellinger, D. Dispersion, agglomeration, and network formation of multiwalled carbon nanotubes in polycarbonate melts. Polymer 2008, 49, 974–984. [Google Scholar] [CrossRef]
  30. Villmow, T.; Pegel, S.; Pötschke, P.; Wagenknecht, U. Influence of injection molding parameters on the electrical resistivity of polycarbonate filled with multi-walled carbon nanotubes. Compos. Sci. Technol. 2008, 68, 777–789. [Google Scholar] [CrossRef]
  31. Lellinger, D.; Xu, D.; Ohneiser, A.; Skipa, T.; Alig, I. Influence of the injection moulding conditions on the in-line measured electrical conductivity of polymer–carbon nanotube composites. Phys. Status Solidi-B-Basic Solid State Phys. 2008, 245, 2268. [Google Scholar] [CrossRef]
  32. Villmow, T.; Pötschke, P.; Pegel, S.; Häussler, L.; Kretzschmar, B. Influence of twin-screw extrusion conditions on the dispersion of multi-walled carbon nanotubes in a poly (lactic acid) matrix. Polymer 2008, 49, 3500–3509. [Google Scholar] [CrossRef]
  33. Verma, P.; Saini, P.; Choudhary, V. Designing of carbon nanotube/polymer composites using melt recirculation approach: Effect of aspect ratio on mechanical, electrical and EMI shielding response. Mater. Des. 2015, 88, 269–277. [Google Scholar] [CrossRef]
  34. Selke, S.E.; Hernandez, R.J.; Culter, J.D. Plastics Packaging: Properties, Processing, Applications, and Regulations, 2nd ed.; Hanser Publishers: Munich, Germany, 2004. [Google Scholar]
  35. Bhattacharyya, A.R.; Sreekumar, T.; Liu, T.; Kumar, S.; Ericson, L.M.; Hauge, R.H.; Smalley, R.E. Crystallization and orientation studies in polypropylene/single wall carbon nanotube composite. Polymer 2003, 44, 2373–2377. [Google Scholar] [CrossRef]
  36. Manchado, M.L.; Valentini, L.; Biagiotti, J.; Kenny, J. Thermal and mechanical properties of single-walled carbon nanotubes–polypropylene composites prepared by melt processing. Carbon 2005, 43, 1499–1505. [Google Scholar] [CrossRef]
  37. Kashiwagi, T.; Grulke, E.; Hilding, J.; Groth, K.; Harris, R.; Butler, K.; Shields, J.; Kharchenko, S.; Douglas, J. Thermal and flammability properties of polypropylene/carbon nanotube nanocomposites. Polymer 2004, 45, 4227–4239. [Google Scholar] [CrossRef]
  38. Assouline, E.; Lustiger, A.; Barber, A.; Cooper, C.; Klein, E.; Wachtel, E.; Wagner, H. Nucleation ability of multiwall carbon nanotubes in polypropylene composites. J. Polym. Sci. Part B Polym. Phys. 2003, 41, 520–527. [Google Scholar] [CrossRef]
  39. Xia, H.; Wang, Q.; Li, K.; Hu, G.H. Preparation of polypropylene/carbon nanotube composite powder with a solid-state mechanochemical pulverization process. J. Appl. Polym. Sci. 2004, 93, 378–386. [Google Scholar] [CrossRef]
  40. Coleman, J.N.; Cadek, M.; Blake, R.; Nicolosi, V.; Ryan, K.P.; Belton, C.; Fonseca, A.; Nagy, J.B.; Gun’ko, Y.K.; Blau, W.J. High performance nanotube-reinforced plastics: Understanding the mechanism of strength increase. Adv. Funct. Mater. 2004, 14, 791–798. [Google Scholar] [CrossRef]
  41. Kasaliwal, G.; Villmow, T.; Pegel, S.; Pötschke, P. Influence of material and processing parameters on carbon nanotube dispersion in polymer melts. In Polymer–Carbon Nanotube Composites; Woodhead Publishing: Sawston, UK, 2011; pp. 92–132. [Google Scholar]
  42. Alig, I.; Pötschke, P.; Lellinger, D.; Skipa, T.; Pegel, S.; Kasaliwal, G.R.; Villmow, T. Establishment, morphology and properties of carbon nanotube networks in polymer melts. Polymer 2012, 53, 4–28. [Google Scholar] [CrossRef]
  43. Wang, T.; Song, B.; Qiao, K.; Huang, Y.; Wang, L. Effect of dimensions and agglomerations of carbon nanotubes on synchronous enhancement of mechanical and damping properties of epoxy nanocomposites. Nanomaterials 2018, 8, 996. [Google Scholar] [CrossRef] [PubMed] [Green Version]
  44. Kasaliwal, G.R.; Göldel, A.; Pötschke, P.; Heinrich, G. Influences of polymer matrix melt viscosity and molecular weight on MWCNT agglomerate dispersion. Polymer 2011, 52, 1027–1036. [Google Scholar] [CrossRef]
  45. Bauhofer, W.; Kovacs, J.Z. A review and analysis of electrical percolation in carbon nanotube polymer composites. Compos. Sci. Technol. 2009, 69, 1486–1498. [Google Scholar] [CrossRef]
  46. Stauffer, D.; Aharony, A. Introduction to Percolation Theory; CRC Press: Boca Raton, FL, USA, 1994. [Google Scholar]
  47. Sahini, M.; Sahimi, M. Applications of Percolation Theory; CRC Press: Boca Raton, FL, USA, 1994. [Google Scholar]
  48. Seo, M.-K.; Park, S.-J. Electrical resistivity and rheological behaviors of carbon nanotubes-filled polypropylene composites. Chem. Phys. Lett. 2004, 395, 44–48. [Google Scholar] [CrossRef]
  49. Pötschke, P.; Fornes, T.; Paul, D. Rheological behavior of multiwalled carbon nanotube/polycarbonate composites. Polymer 2002, 43, 3247–3255. [Google Scholar] [CrossRef]
  50. Abdel-Goad, M.; Potschke, P.; Zhou, D.; Mark, J.E.; Heinrich, G. Preparation and rheological characterization of polymer nanocomposites based on expanded graphite. J. Macromol. Sci. Part A Pure Appl. Chem. 2007, 44, 591–598. [Google Scholar] [CrossRef]
  51. Hemmati, M.; Rahimi, G.; Kaganj, A.; Sepehri, S.; Rashidi, A. Rheological and mechanical characterization of multi-walled carbon nanotubes/polypropylene nanocomposites. J. Macromol. Sci. Part B 2008, 47, 1176–1187. [Google Scholar] [CrossRef]
  52. Chang, T.; Jensen, L.R.; Kisliuk, A.; Pipes, R.; Pyrz, R.; Sokolov, A. Microscopic mechanism of reinforcement in single-wall carbon nanotube/polypropylene nanocomposite. Polymer 2005, 46, 439–444. [Google Scholar] [CrossRef]
  53. Andrews, R.; Jacques, D.; Minot, M.; Rantell, T. Fabrication of carbon multiwall nanotube/polymer composites by shear mixing. Macromol. Mater. Eng. 2002, 287, 395–403. [Google Scholar] [CrossRef]
  54. Kharchenko, S.B.; Douglas, J.F.; Obrzut, J.; Grulke, E.A.; Migler, K.B. Flow-induced properties of nanotube-filled polymer materials. Nat. Mater. 2004, 3, 564–568. [Google Scholar] [CrossRef]
  55. Tjong, S.C.; Liang, G.; Bao, S. Electrical behavior of polypropylene/multiwalled carbon nanotube nanocomposites with low percolation threshold. Scr. Mater. 2007, 57, 461–464. [Google Scholar] [CrossRef]
  56. Gorrasi, G.; Romeo, V.; Sannino, D.; Sarno, M.; Ciambelli, P.; Vittoria, V.; De Vivo, B.; Tucci, V. Carbon nanotube induced structural and physical property transitions of syndiotactic polypropylene. Nanotechnology 2007, 18, 275703. [Google Scholar] [CrossRef]
  57. Logakis, E.; Pollatos, E.; Pandis, C.; Peoglos, V.; Zuburtikudis, I.; Delides, C.; Vatalis, A.; Gjoka, M.; Syskakis, E.; Viras, K. Structure–property relationships in isotactic polypropylene/multi-walled carbon nanotubes nanocomposites. Compos. Sci. Technol. 2010, 70, 328–335. [Google Scholar] [CrossRef]
Figure 1. Schematic diagram of the sample preparation of the PP/SWNT composite for this study.
Processes 09 01395 g001
Figure 2. Specific mechanical energy applied to produce composites with different SWNT content.
Processes 09 01395 g002
Figure 3. (a) Number, weight-average molecular weight, and polydispersity index (PDI) of PP as a function of residence time; (b) storage modulus G and loss modulus G of PP as a function of residence time at 200 °C.
Processes 09 01395 g003
Figure 4. (a) Storage modulus G , (b) loss modulus G , and (c) complex viscosity η of the composites with frequency sweep as a function of SWNT content at 200 °C; (d) van Gurp–Palmen plot of the composites.
Processes 09 01395 g004
Figure 5. Size distribution of undispersed SWNT agglomerates observed in composites; SWNT content and total agglomerate area (AA) are described in each figure. (a) 6.56 wt.%; (b) 4.80 wt.%; (c) 4.29 wt.%; (d) 3.66 wt.%; (e) 2.94 wt.%; (f) 1.28 wt.%; (g) 0.62 wt.%; (h) 0.43 wt.%; (i) 0.29 wt.%.
Processes 09 01395 g005
Figure 6. SEM images of (a) 0.29 wt.%, (b) 1.28 wt.%, and (c) 6.56 wt.% SWNT in the composite.
Processes 09 01395 g006
Figure 7. Tensile strength (top) and Young’s modulus (bottom) of the composites as a function of SWNT content; different letters on the top or bottom of the error bar indicate a statistically significant difference at the 95% confidence level.
Processes 09 01395 g007
Figure 8. Electrical conductivity as a function of SWNT content.
Processes 09 01395 g008
Publisher’s Note: MDPI stays neutral with regard to jurisdictional claims in published maps and institutional affiliations.

