Article

Techno-Economic Assessment of a Grid-Independent Hybrid Power Plant for Co-Supplying a Remote Micro-Community with Electricity and Hydrogen

1
Hubei Collaborative Innovation Center for High-Efficiency Utilization of Solar Energy, Hubei University of Technology, Wuhan 430068, China
2
Queensland Micro- and Nanotechnology Centre, Griffith University, Nathan 4111, Australia
3
Faculty of Engineering, Kotelawla Defence University, Kandawala Estate, Ratmalana 10390, Sri Lanka
4
Department of Botany and Microbiology, College of Science, King Saud University, P.O. Box 2455, Riyadh 11451, Saudi Arabia
5
Department of Physiology, College of Medicine and King Khalid University Hospital, King Saud University, Medical City, P.O. Box-2925, Riyadh 11461, Saudi Arabia
6
Institute of Mechanical Engineering, Warsaw University of Life Sciences, 02-787 Warsaw, Poland
7
Electrical Engineering Department, Faculty of Engineering, Minia University, Minia 61519, Egypt
8
Department of Electrical Engineering, Fuzhou University, Fuzhou 350116, China
*
Authors to whom correspondence should be addressed.
Processes 2021, 9(8), 1375; https://doi.org/10.3390/pr9081375
Submission received: 9 July 2021 / Revised: 30 July 2021 / Accepted: 2 August 2021 / Published: 6 August 2021
(This article belongs to the Section Energy Systems)

Abstract

:
This study investigates the techno-economic feasibility of an off-grid integrated solar/wind/hydrokinetic plant to co-generate electricity and hydrogen for a remote micro-community. In addition to the techno-economic viability assessment of the proposed system via HOMER (hybrid optimization of multiple energy resources), a sensitivity analysis is conducted to ascertain the impact of ±10% fluctuations in wind speed, solar radiation, temperature, and water velocity on annual electric production, unmet electricity load, LCOE (levelized cost of electricity), and NPC (net present cost). For this, a far-off village with 15 households is selected as the case study. The results reveal that the NPC, LCOE, and LCOH (levelized cost of hydrogen) of the system are equal to $333,074, 0.1155 $/kWh, and 4.59 $/kg, respectively. Technical analysis indicates that the PV system with the rated capacity of 40 kW accounts for 43.7% of total electricity generation. This portion for the wind turbine and the hydrokinetic turbine with nominal capacities of 10 kW and 20 kW equates to 23.6% and 32.6%, respectively. Finally, the results of sensitivity assessment show that among the four variables only a +10% fluctuation in water velocity causes a 20% decline in NPC and LCOE.

1. Introduction

Ever-increasing patterns in energy demand, environmental pollution, and population growth have stimulated the need to replace the conventional methods of generating energy as they are limited, non-renewable, and not eco-friendly [1,2]. Fortunately, there are several other means to produce energy without causing major issues to the environment and without suffering from a depleting resource. More importantly, some of these can be employed together as a hybrid system in appropriate areas. For instance, wind and solar combination is one of the most favorable hybrid systems in suitable locations. However, other resources such as geothermal, biomass, hydro, wave, etc. can be added to an integrated solar-wind plant depending on the area.
Statistics about utilizing renewable and sustainable energies indicate that solar energy is the most favorable means among its counterparts [3]. This extreme popularity is due to the development of related equipment and also the high availability of solar irradiance around the world [4]. Additionally, wind energy has been applied for some basic purposes such as windmills since early ages of human existence [5]. As the knowledge of humans developed, great advancements occurred in the exploitation of wind energy. The most common method of harnessing wind energy is the installation of wind turbines. Some developed countries have taken serious steps to meet their electric power demand by wind-generated electricity [6]. Another renewable method of producing electricity, far less exploited than solar and wind energies, is hydrokinetic energy of river streams. This indicates the application of kinetic energy available in the flowing water of rivers or man-made waterways for electricity generation [7]. This sort of energy has been used since long time ago for several primary applications such as watermills and marine transport. Furthermore, some wind turbine-shaped devices have been introduced and advanced to turn this kinetic energy into electricity in recent decades; moreover, unlike hydroelectric power plants, this energy resource does not involve huge constructions for dams, which makes it more cost-effective [8] and its efficiency seems to be greater than that of wind turbines [9]. In addition to the two aforementioned technical and economic supremacies, this power generation method possesses a priority regarding environmental impact, since it needs very little or no civil work, causing less detrimental issues [10]. From the beginning of forming communities, rivers have been at the center of attention. As such, nowadays, there are many megacities, towns and small communities that have rivers nearby or in the middle of them. This means that these areas have a great source of energy ready to be exploited. In order to make this transition occur, turbines turn the kinetic energy of water into electricity via their alternators combined on the shaft of the turbine [11]. Generally, different devices for this purpose have been introduced, including equipment with horizontal axis parallel to flow, with horizontal axis perpendicular to flow, with vertical axis, and hydrofoil [12].
Hybrid energy systems possess some fundamental advantages, particularly that they are less costly in terms of energy production and carry a reduced risk of power shortage compared to those with just one source of energy. Hence, this study attempts to model an autonomous system integrating three potential ways of generating renewable electricity and hydrogen, including solar, wind, and hydrokinetic, in order to serve a micro-community with 15 households. It is worth mentioning that the main reason behind selecting these three sources of energy is that the case study area possesses a great potential for wind and solar energy, along with having a river in its vicinity.
The primary purpose of this work is to propose and analyze an off-grid hybrid solar/wind/hydrokinetic power generation plant to simultaneously meet the electric and hydrogen demand required by a far-off micro-community near the Karun River. For this, a techno-economic assessment is conducted using HOMER software. In addition to this, a sensitivity analysis is carried out in order to take into consideration the effect of fluctuations in the normal values of wind speed, solar radiation, air temperature, and water flow velocity. Then, the impact of these variations on annual electric production, unmet electricity load, total NPC, and LCOE is projected.
After carefully scrutiny of the literature pertinent to the subject of this work, it was spotted that there is no published work about the techno-economic assessment of utilizing hydrokinetic energy combined with solar and wind energies in Iran to co-supply electricity and hydrogen. Hence, this is the novelty and major contribution of this work by which other developing countries can address their research gap.

2. Literature Review
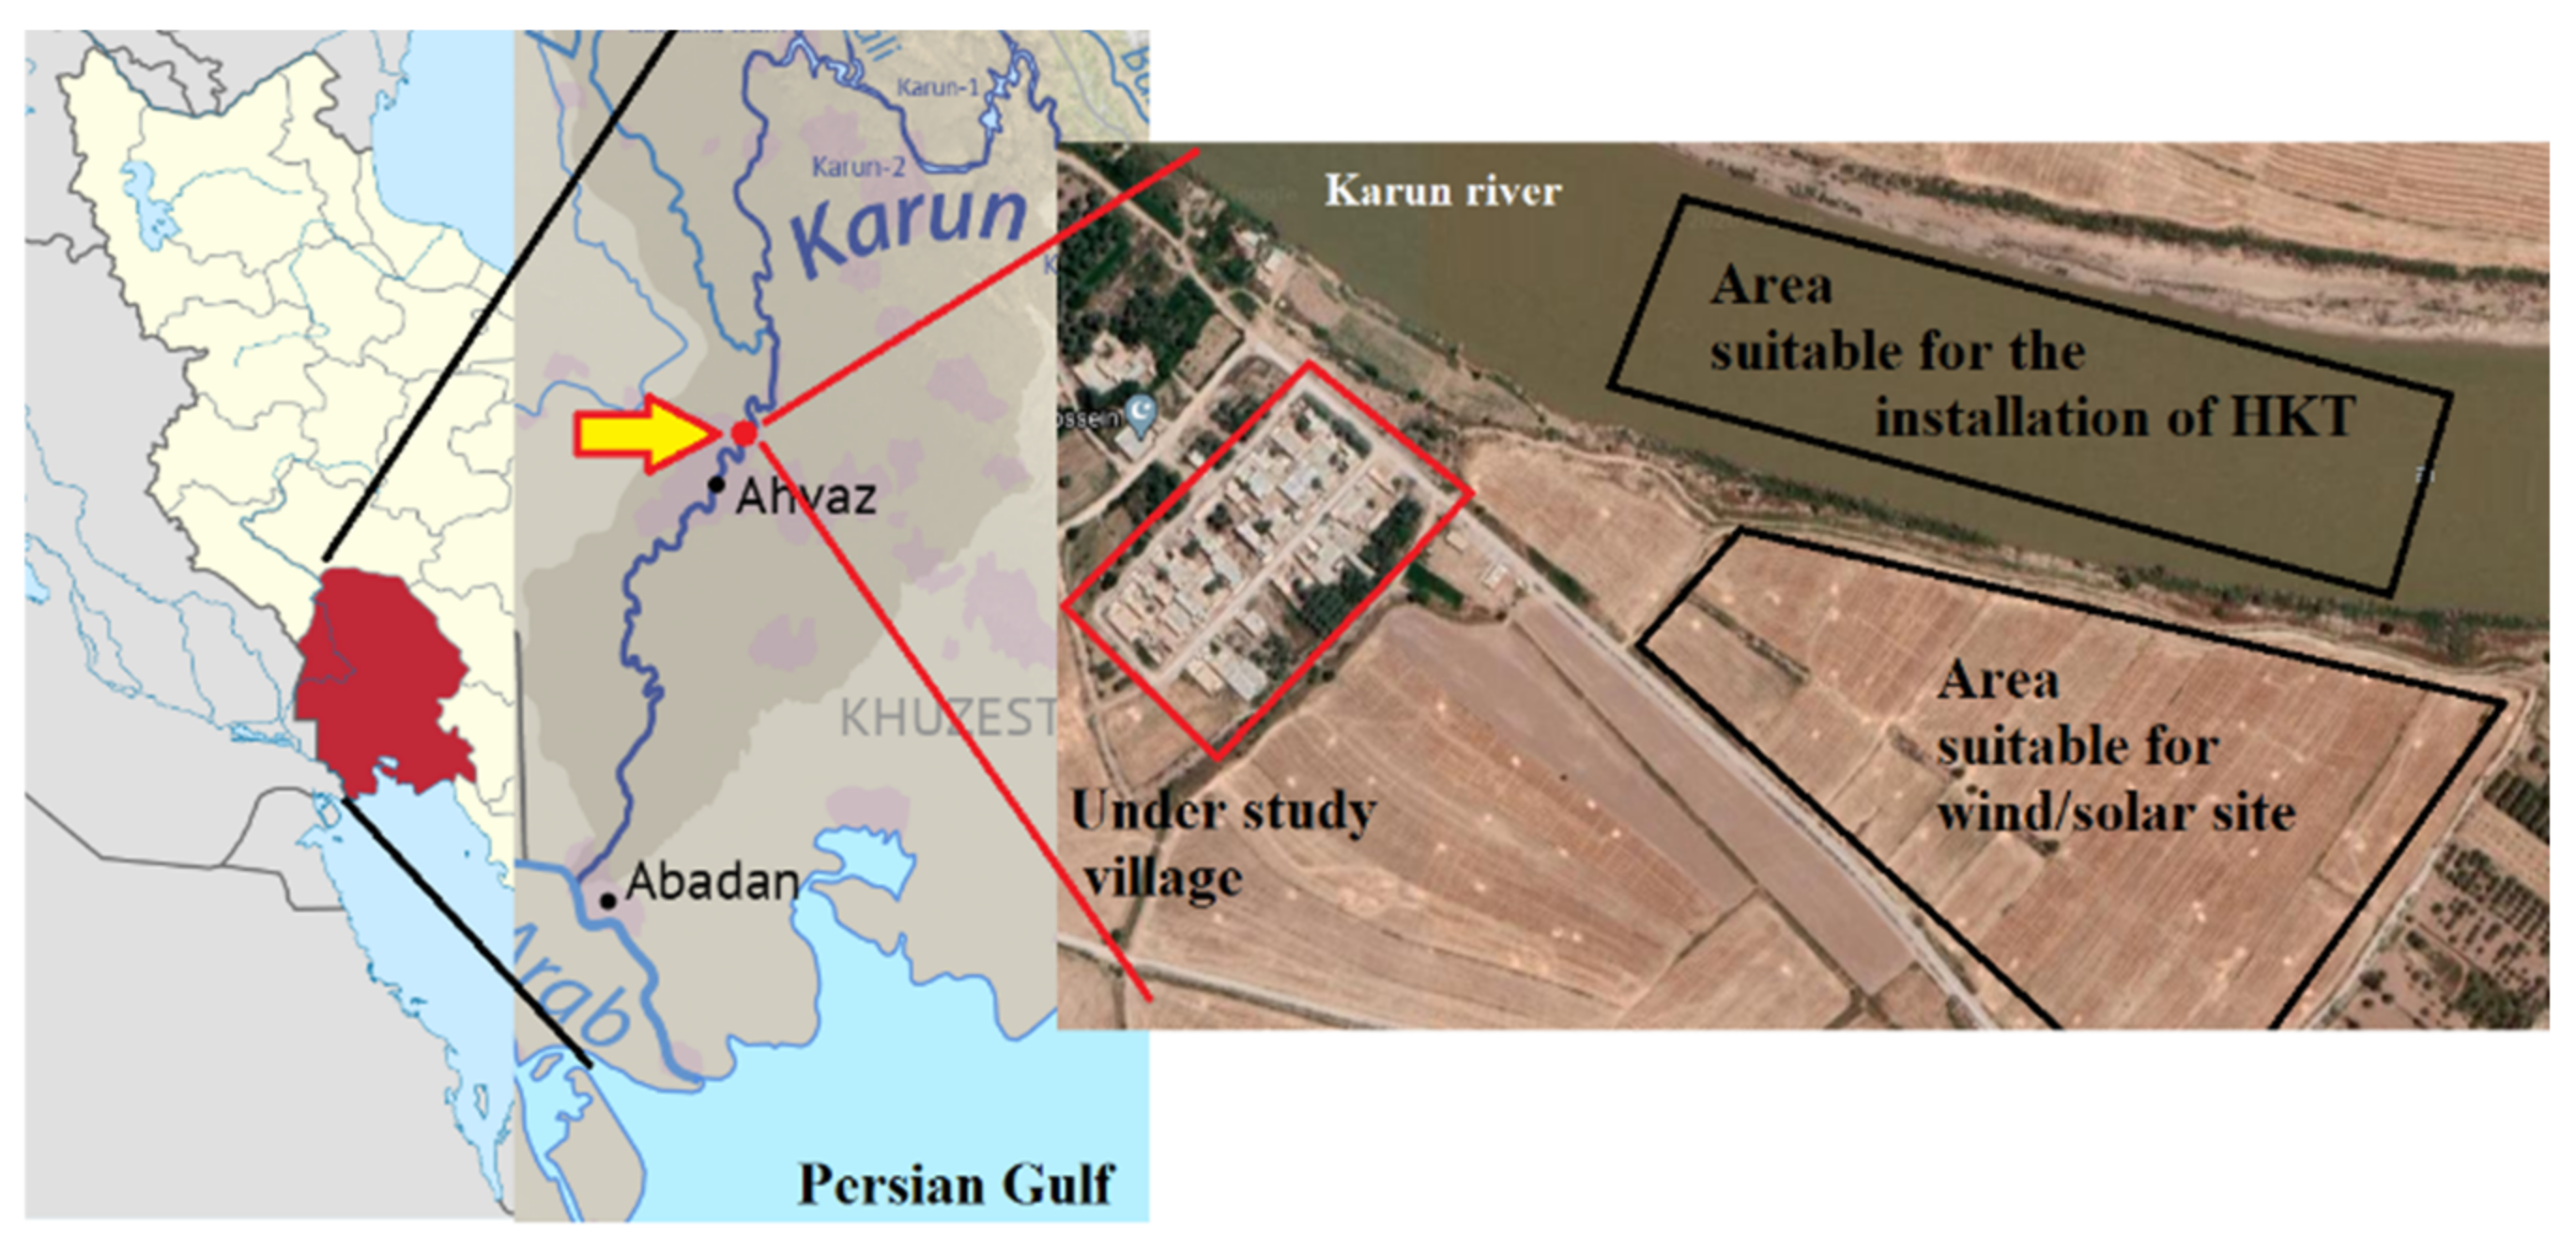
Kusakana and Vermaak in [13] performed a study to evaluate the potential of hydrokinetic energy for electrification of a remote and isolated area in South Africa. To serve the purpose of the study, HOMER software was utilized. The economic and environmental results were in favor of this method in comparison with deploying a wind turbine, PV system, and diesel generator. Similarly, Kusakana in [14] studied the techno-econo-environmental aspects of adding pumped hydro storage to a hydrokinetic power generation plant to supply energy required by a rural area in South Africa. The findings proved that the hydrokinetic energy utilization along with the storage method would be economically and technically feasible. An optimization model for the purpose of electricity production via a hydrokinetic/diesel generator plant was introduced and developed in [15]. Ramírez et al. [16] evaluated the techno-economic viability of installing hydrokinetic turbines in the discharge channels of hydroelectric dams in Colombia. Their findings implied that the technology was not suitable for Colombia at the time of conducting the research. Li et al. [17] analyzed the economics of employing ocean turbines in the Gulf Stream off the North Carolina coast. Then, a portfolio optimization model was introduced in order to determine the most suitable sites in which turbines could reach the best technical outcomes. Lata-García et al. [18] investigated the techno-economic feasibility of a hybrid solar/hydrokinetic energy with a subsystem of hydrogen and batteries in order to produce electricity for a set of isolated loads near the Guayas River. Technical analysis revealed that the system could provide all electricity demanded by the load and also the economic assessment showed LCOE would be 0.254 $/kWh. Kusakana et al. [19] introduced cost and performance evaluation of hydrokinetic-diesel hybrid systems. The outcomes proved the feasibility of the system in terms of technical and economic aspects. Cano et al. [20] proposed and optimized an integrated power production plant consisting of a PV system, hydrokinetic turbine, batteries, and biomass gasifiers to be applied in the south of Ecuador. The findings indicated that the system would be feasible in terms of technical and economic aspects. John et al. [21] conducted a study to optimally size a standalone hybrid hydrokinetic/solar/battery storage system to be installed and operate in the remote communities of the tropical regions. Arévalo et al. [8] carried out research to scrutinize the impact of utilizing five different types of batteries on a hybrid solar/hydrokinetic/diesel generator power generation plant. The configurations were compared to each other based on NPC, LCOE, unmet load, and CO2 emissions reduction. The results suggested that the system with vanadium redox flow storages would impose a lower NPC and LCOE. Ibrahim et al. [22] assessed two different combinations of off-grid hybrid systems for supplying a water treatment plant with electricity in Egypt. The first one comprised a PV system, wind turbine, diesel generator, and battery, while the other included a hydrokinetic turbine instead of a wind turbine. Aziz et al. [23] sought to optimize a hybrid power generation system in terms of economic, technical, and environmental views in order to provide a village in Iraq with electricity. The results of simulation by HOMER revealed that the hybrid solar/hydro/diesel/battery system was the most cost-effective one. Cordero et al. [9] studied the feasibility of the application of a hybrid hydrokinetic/wind/diesel system coupled with lead acid batteries to meet the load required by a university in the south of Ecuador. Four main parameters that were attempted to be optimized were NPC, LCOE, unmet electric demand, and penetration of the diesel generator. Kumar et al. [24] proposed and tested a bi-level approach in order to design rural micro-grids to be applied in a remote village in a hilly region. The design assessed the available resources in the proximity of the area, including solar, hydrokinetic, and hydro with the dam and diesel generator, batteries, and pump-hydro storage as backups.
With regard to electrification of remote and isolated areas using renewable sources of energy, some works have been carried out in different parts of the world, such as Malaysia [25], Cambodia [26], Sub-Saharan African countries [27], west China [17], India [28,29,30], Pakistan [31], Mexico [32], Venezuela [33], the Amazon region [34], Algeria [35], Myanmar [36], Ethiopia [37], Benin [38], and the Philippines [39]. For Iran, Mostafaeipour et al. [40] examined the techno-economic feasibility of harnessing wind energy for electrifying a tribal region, called Gachsaran, in the south-west of Iran. Moreover, Kasaeian et al. [41] performed a study to economically optimize an integrated solar/diesel/biogas system connected to the grid in a small village in the east of Iran. To overcome the issue of economic uncertainty in Iran, several values of inflation rate and discount rate were taken into consideration. Vaziri Rad et al. in [42] studied a hybrid solar/wind/biogas power generation system to electrify a remote village in Iran. The proposed system was analyzed in terms of both grid-connected and off-grid applications. Fuel cells were also included as the backup system to cover the times when renewable-generated electricity would not be enough. The results revealed that the system without fuel cells would be the most cost-effective one, while adding fuel cells could raise the costs by 33–37%. Furthermore, the grid-connected scheme incurred less costs in contrast to the stand-alone one.
Among research works conducted in Iran to assess the techno-economic aspects of utilizing renewable energies for electricity and hydrogen production, none of which has included a hydrokinetic energy conversion system to analyze the possibility of renewable electricity and hydrogen co-generation for supporting a remote micro-community. For this, the authors have viewed this as an existing research gap.

3. Case Study Area

Khuzestan province, located in the southwest of Iran, is the richest part of the country in terms of fossil fuel resources. This circumstance has led to neglecting alternative means of generating energy, despite its considerable resources such as solar, wind, and hydrokinetic. The longest river in Iran, Karun, passes through this province and its many local and small communities. To serve the purpose of the study, a far-off remote micro-community situated in the proximity of the Karun River, along the longitude line 48.59 °   E and the latitude line 31.23 °   N , was selected as the case study. Figure 1 depicts this micro-community and the proposed position of the wind and solar site as well as hydrokinetic turbine.

4. Technical Characteristics

In this study, to assess the techno-economic feasibility of the proposed system, HOMER pro has been utilized. The following methods are applied by the software in order to model the devices incorporated in the system.

4.1. Modeling of PV System

One of several pieces of equipment required to catch and turn the original form of renewable energies into electricity is PV panels. Owing to the abundance of and accessibility to solar irradiance around the globe, the related apparatus has been well-developed and is available in almost every country. The foremost parameter for sizing and optimizing a PV power plant is the power output, which can be computed using Equation (1) [42].
P P V = Y P V f P V I T I s 1 + φ P T c T s
in which:
  • Y P V : the rated capacity of the PV system under standard environment in kW,
  • f P V : derating or reduction factor which impacts the performance of the PV under real-world conditions in %,
  • I T : the solar radiation incident on the PV module in kW/m2,
  • I s : the solar radiation incident under standard test conditions in kW/m2,
  • φ P : the temperature coefficient of power in ° C ,
  • T c : the PV cell temperature in the current time step in ° C ,
  • T s : the PV cell temperature under standard test conditions in ° C .
It should be noted that the standard environment or standard test conditions refer to a radiation value of 1 kW/m2, cell temperature of 25 ° C , and without wind. Additionally, to simulate the real-world conditions, the derating factor is of high value as some circumstances, such as dust or snow cover, shading, and wire losses, may degrade the performance of the PV system.
To acquire the temperature of the PV cell, Equation (2) can be used [43].
T c = T a + I T T c , N O C T 20 0.8 1 γ P V 0.9
where:
  • T a : the ambient temperature in ° C ,
  • T c , N O C T : the PV nominal cell temperature, denoting the surface temperature that the PV may reach when exposed to a condition under which solar radiation, ambient temperature, and wind velocity are 0.8 kW/m2, 20 ° C , 1 m/s, respectively,
  • γ P V : the electrical conversion efficiency of the PV system in %.
Moreover, I T can be projected via Equation (3) [43].
I T = G ¯ b + G ¯ d G ¯ b G ¯ o ( c o s θ c o s θ z ) + G ¯ d 1 G ¯ b G ¯ o 1 + c o s β 2 1 + f s i n 3 β 2 + G ¯ b + G ¯ d ρ g 1 c o s β 2
where:
  • G ¯ b : the beam radiation in kW/m2,
  • G ¯ d : the diffuse radiation in kW/m2,
  • G ¯ o : the average extraterrestrial horizontal radiation in kW/m2,
  • θ : the angle of incidence or the angle between the sun’s beam radiation and the PV surface in ° .
  • θ z : the zenith angle in ° . It constitutes zero or 90 ° if the sun is directly overhead or at the horizon, respectively,
  • β : the slope of the surface in ° .
  • ρ g : albedo in %, indicating the portion of solar radiation striking the ground and then reflecting. This value may change from 20% to 70% according to the surrounding area of the PV systems.

4.2. Modeling of Wind Turbine

To harness the energy provided by wind, horizontal and vertical axis turbines have been introduced and developed in the last decades. In this regard, the most important output factor, the amount of energy generated via these turbines, can be obtained by Equation (4) [44].
E W T = 0.5 × ρ a i r × A × v 3 × C p w × ɳ W T × t
where:
  • ρ a i r : the actual air density in kg/m3,
  • A : the area swept by the blades of the nominated turbine in m2,
  • v : the wind speed at the current time step in m/s,
  • C p w : the coefficient of the turbine performance in %,
  • ɳ W T : the combined efficiency of the turbine and its generator,
  • t : the whole time that the total produced energy is to be projected.
Since the wind velocity changes at different elevations, Equation (5) is used to compute the wind speed at the hub height [45].
v h u b = v a n e m   H h u b H a n e m z
in which:
  • v a n e m : the recorded wind speed at the height of the anemometer in m/s,
  • H h u b : the distance between the rotor of the nominated wind turbine and the ground in m,
  • H a n e m : the anemometer height in m,
  • z : the power law coefficient (Equation (6)).
    α = 0.37 0.088 × ln v a n e m 1 0.088 × ln H a n e m 10

4.3. Modeling of Hydrokinetic Turbine

Hydrokinetic turbines transform the kinetic energy of flowing water passing through rivers into electrical energy. To calculate the amount of energy that is made via this type of turbine, Equation (7) is utilized [46,47].
E H K T = 0.5 × ρ w a t e r × A H K T × ( v w a t e r ) 3 × C p H K T × ɳ H K T × h
where:
  • ρ w a t e r : the density of water in kg/m3,
  • A H K T : the area rotated by the blades of the hydrokinetic turbine in m2,
  • v w a t e r : the speed of water flow in m/s,
  • ɳ H K T : the combined efficiency of the hydrokinetic turbine and the generator,
  • h : the whole time during which the hydrokinetic turbine operates and the produced energy is to be projected,
  • C p H K T : the performance coefficient of hydrokinetic turbine which can be obtained by Equation (8) [47].
    C p H K T = P r o t o r P a v a i a b l e
    in which:
    • P r o t o r : the amount of power that is produced by the rotor in kW,
    • P a v a i a b l e : the amount of power available in the free stream in kW.

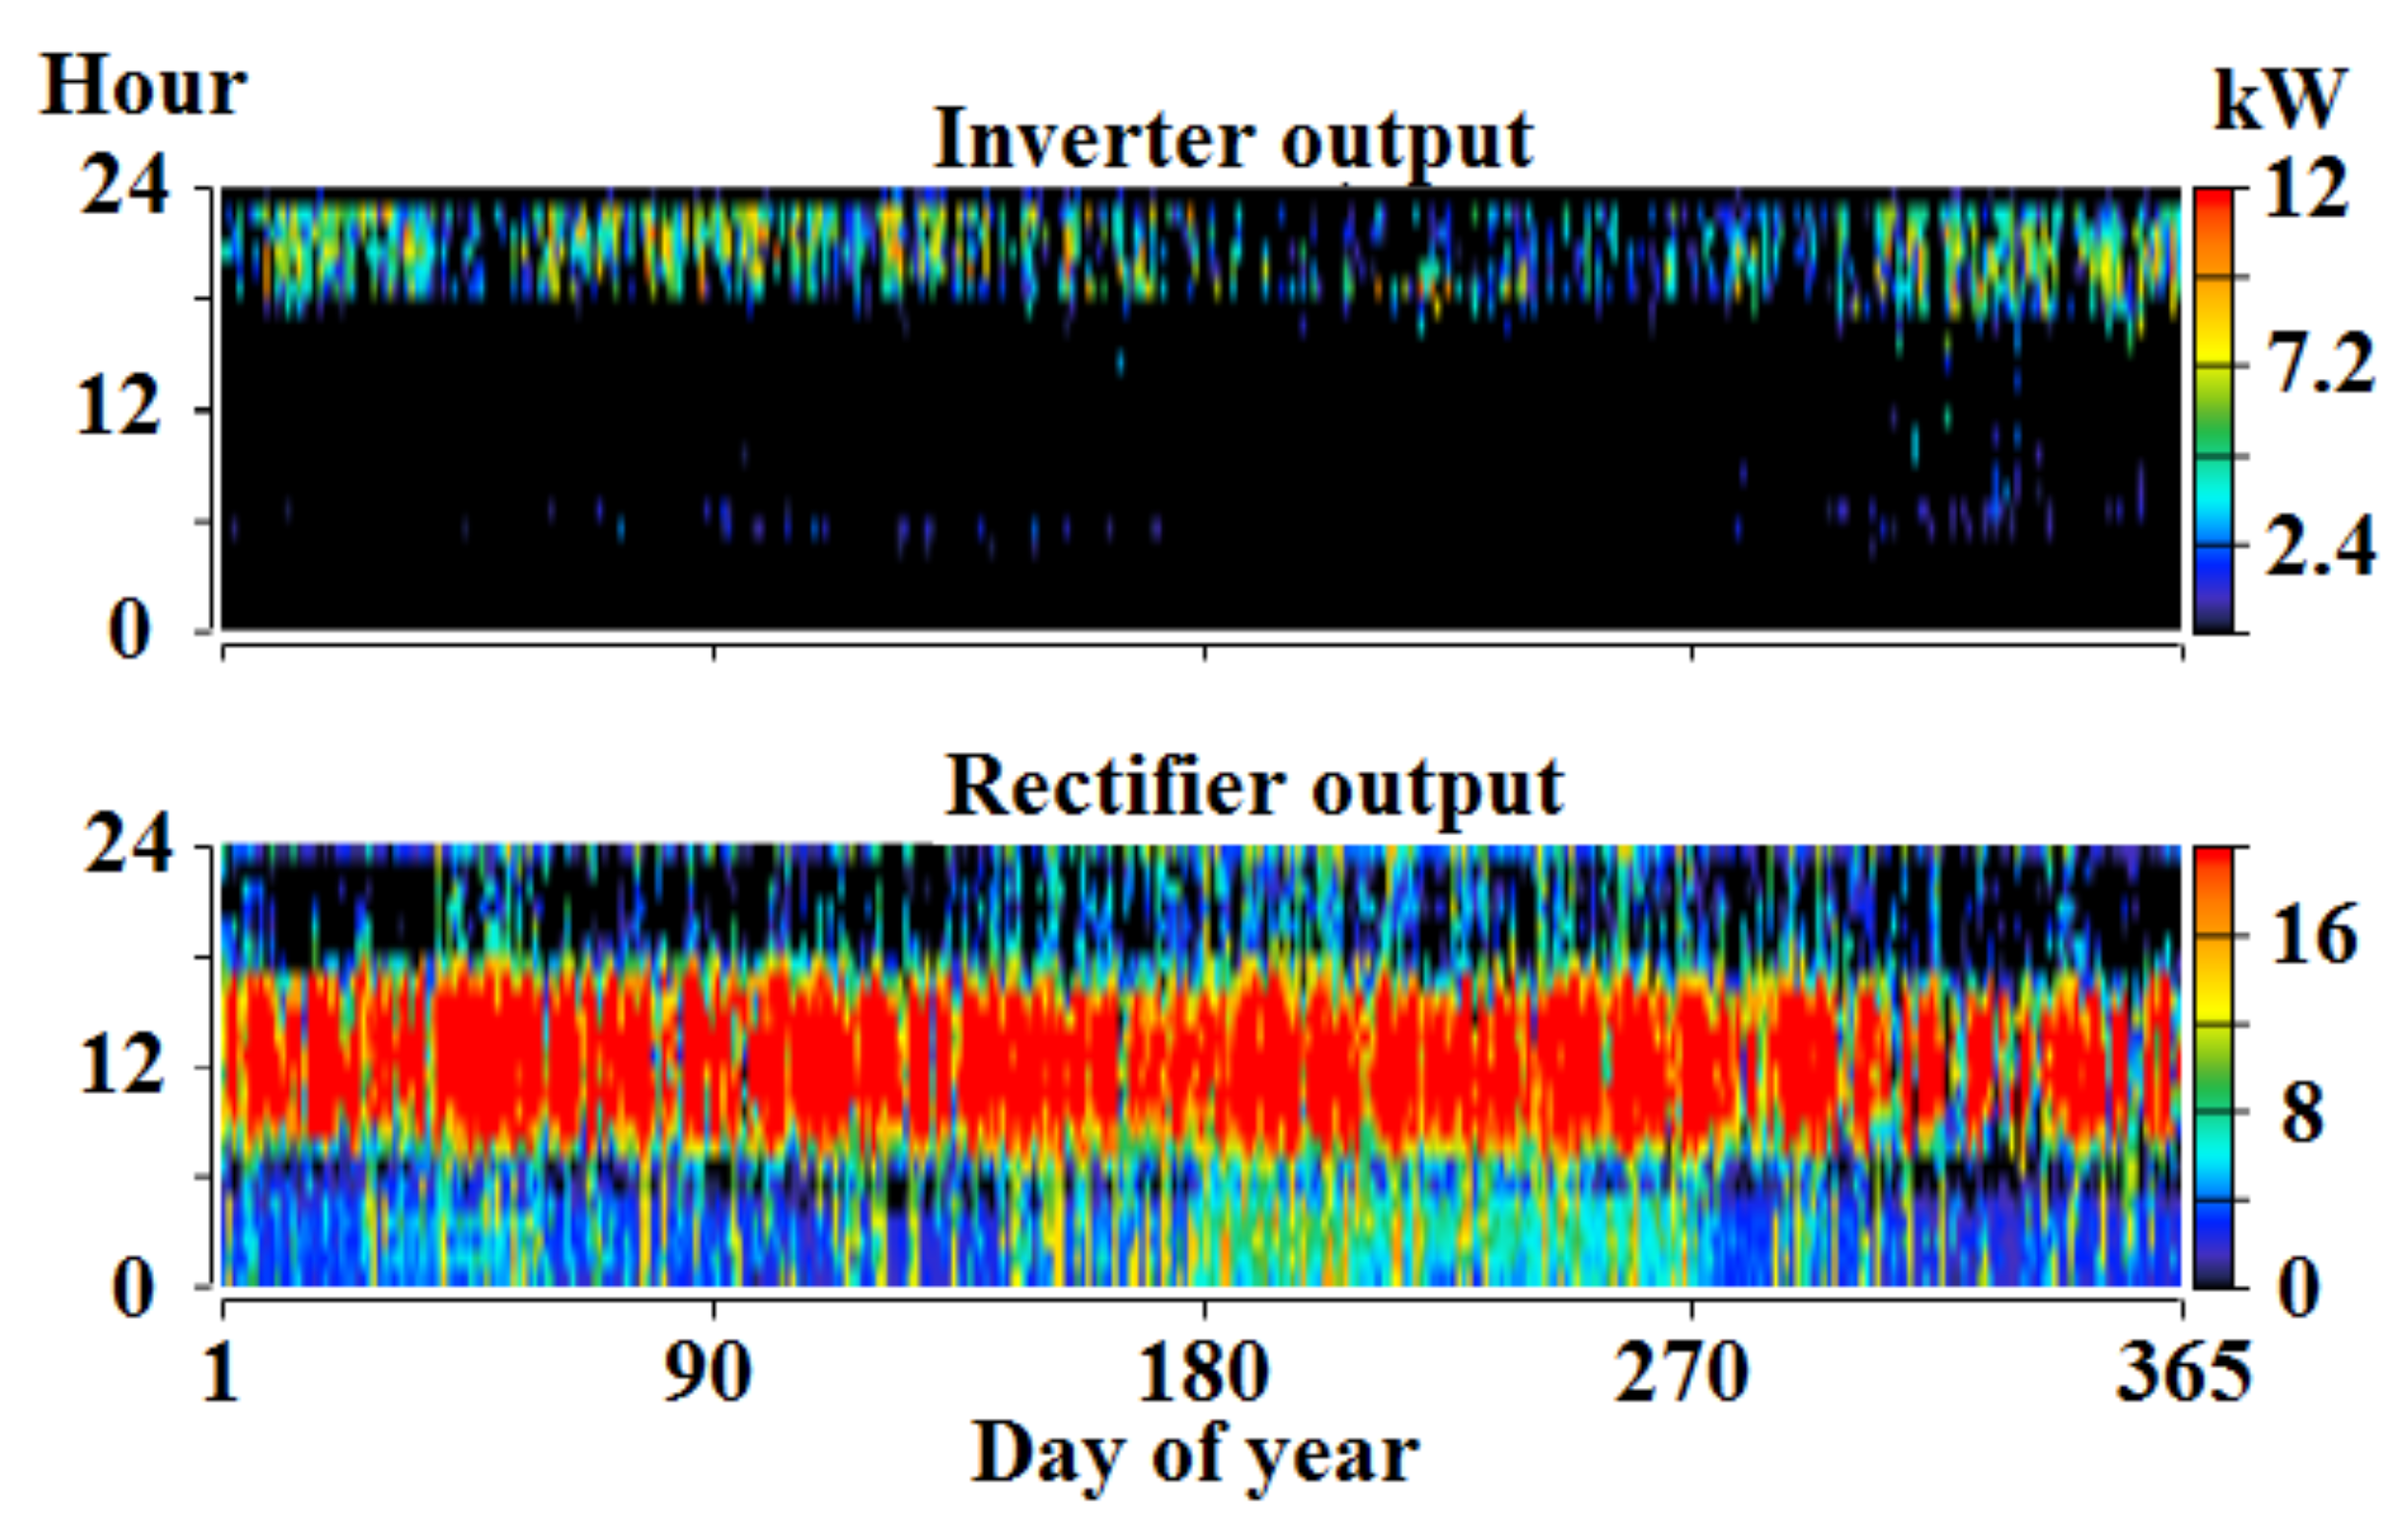
4.4. Modeling of Inverter

Since some equipment in the proposed hybrid system generates AC or DC output and some also require DC or AC input, a converter should be included. In order to calculate the power of the load side, Equation (9) is deployed [20].
P l , s t = P i t × ɳ i n v
where:
  • P l , s t : the power sent to the load side from output of the inverter in kW,
  • P i t : the input power of the inverter,
  • ɳ i n v : the efficiency of the inverter.

4.5. Modeling of Battery

One of the crucial parts in any power generation system that provides/raises the reliability of the whole system is batteries. They are employed to store the surplus electricity generated via the system in order to supply energy for the load when the system suffers from an energy shortage. Take a PV power generation plant for example: batteries would be charging during sunny hours of a day so that during night hours, when solar irradiance is not available, they could compensate for an electricity shortage caused by intermittent nature of solar energy. An important variable of batteries is the state of charge that consists in time. In this regard, Equation (10) can be used to obtain this parameter [20].
S C t = S C t 1 × t 1 t P b t × ɳ b a t V b u s d t
where:
  • V b u s : the voltage in bus,
  • ɳ b a t : the efficiency of the battery in %,
  • P b t : the load power of the battery in kW that can be determined by Equation (11) [48].
    P b t = k × Q 1 t × exp k + Q t × k × c × 1 exp k t 1 exp k t + c × k t 1 + exp k t
    in which:
    • k : the constant energy storage rate,
    • Q 1 t : the amount of energy available at the start of the operating interval and above the minimum state of charge,
    • Q t : the total energy at the start of the passage of time,
    • c : the storage capacity ratio,
    • t : the time interval.
Finally, Equation (12) determines the total number of nominated batteries to be installed in the system [18,20].
N b a t = r o u n d   u p L E S × L b a t l a s t . y e a r T b a t L
where:
  • L E S : life expectancy of the system, which is the lifetime of the project,
  • L b a t l a s t . y e a r : the duration of the battery in the last year operation of the system,
  • T b a t L : the period of time from the beginning of the year to the last battery replaced.

4.6. Modeling of Electrolyzer

Decomposition of water into its molecules, H2 and O2, using electrical energy has long been employed for making hydrogen. This process can occur via a water electrolysis system by which electricity is used to generate hydrogen. Equation (13) can be applied to evaluate the rate of obtained hydrogen [42].
R h y d r o g e n = I e l e × ɳ F × N c 2 F
where:
  • I e l e : the electrolyzer current,
  • N c : the number of total cells which are in series in the electrolyzer,
  • F : the coefficient of Faraday,
  • ɳ F : the Faraday efficiency that can be determined by Equation (14) [48].
    ɳ F = 96 × exp 0.09 I e l e 75.5 I e l e 2
Finally, Equation (15) shows how to compute the amount of energy required by the electrolyzer [49].
E e l e = B E × R n , h y d r o g e n + A E × R h y d r o g e n
where:
  • B E and A E : the coefficients of curve consumption in kW/kg/h,
  • R n , h y d r o g e n : The nominal mass flow rate of hydrogen in kg/h.

5. Economic Features

The NPC or life-cycle cost of a system is the main economic variable, using which HOMER ranks all different configurations of the system and then decides which one is the most cost-effective one. Additionally, the software deems the least amount of NPC for optimally sizing the devices to gain the best technical results. NPC is defined as the present worth of all imposed costs minus all earned incomes during the project lifespan. Costs of the system comprise capital costs, replacement costs, operation, and maintenance (OM) costs, costs of purchasing electricity from the grid for grid-connected systems, environmental penalties after releasing emissions into the environment, and fuel costs. On the other side, incomes are the summation of the revenue of selling electricity to the grid and the scrap value of selling equipment at the end of the project. Equation (16) determines NPC of the system [50,51].
N P C = C t a C R F i , n
where:
  • n : the lifetime of the project, same as L E S in Equation (12),
  • i : the real amount of interest rate in % determined by Equation (17),
  • C R F : the capital recovery factor obtained by Equation (18),
  • C t a : the total annualized cost of the system equating to the aggregation of capital cost, replacement cost and OM cost.
    i = i n f 1 + f
    in which:
    • i n : the nominal interest rate in %,
    • f : the inflation rate.
      C R F i , n = i × ( 1 + i ) n 1 + i n 1
The primary economic output variable determining whether or not the power generation scheme would be lucrative is LCOE. This value indicates the mean cost of producing a kWh of electricity and can be projected via Equation (19) [52].
L C O E = C t a E l
where:
E l : the total amount of electricity generated by the system in kWh/yr.
Finally, another main economic variable implying the average cost of obtaining a kg of hydrogen via the electrolyzer is LCOH. Equation (20) is utilized for computing the value of this output variable [53].
L C O H = C t a V e l e c × E l M h y d r o g e n
in which:
  • V e l e c : the value of electricity in $/kWh,
  • M h y d r o g e n : the total amount of hydrogen gained at the output of the electrolyzer in kg.

6. Assumptions

The proposed system to co-generate electricity and hydrogen consists of the components demonstrated in Table 1. In addition, some postulations, which are presented in the table below, should be taken into account in order to attain the purpose of the study [54,55,56,57].
Figure 2 presents the average electric load demanded by the 15 households in the under-study village on a monthly and hourly basis. The average and peak of this load are, respectively, 7.26 and 27.83 kW. With regard to the hydrogen load, it has been presumed that the residents of the village would request hydrogen as fuel for their vehicles only on the weekends, as illustrated in Figure 3. This assumption has been considered for minimizing the size of hydrogen tank and also minimizing the risk of storing hydrogen as it is extremely flammable. Consequently, the electrolyzer is forced to operate just on the weekends. As a result, the vertical black bars visible in Figure 3 refer to days in which hydrogen is not demanded and not generated.
It should be mentioned that, as a plan for energy balance of the proposed system, the priority of the energy consumption parts is the load, then the battery, and at last, the electrolyzer. To this end, HOMER evaluates the energy required by the load in each time step and then calculates the amount of energy production in the related time step. After comparing these values, the software identifies if the battery needs to be charged by excess electricity or this surplus electricity should be sent to the electrolyzer for hydrogen generation. If the load is completely satisfied, the battery is full of charge, and the electrolyzer cannot operate, then surplus electricity will be dumped. Similarly, in the times of power shortage, HOMER decides that the battery should be discharged for providing power to the load or the electrolyzer, whichever has the highest priority.

7. Techno-Economic Assessment

The proposed stand-alone hybrid system that HOMER simulates in order to obtain the economic and technical results is illustrated in Figure 4.
Economic evaluation showed that total NPC of the proposed system would equate to $333,074. This led to a reasonable value for LCOE, which was 0.1155 $/kWh. Then, LCOH was computed as 4.59 $/kg, which could also be lucrative. Table 2 provides the NPC concerned with each component as well as the whole system over the project lifetime, 20 years.
Having simulated the proposed system by HOMER, the under-investigation PV system, wind turbine, and hydrokinetic turbine would, respectively, account for 43.7%, 23.6%, and 32.6% of the total electricity production by the hybrid system. In other words, 72,726, 39,339, and 54,274 kWh/yr would be generated by the aforementioned devices. Figure 5 depicts the average electricity production by the proposed system on a monthly basis.
Calculations indicated that 1601 kg of hydrogen would be obtained over a year with a mean flow rate of 0.183 kg per hour. This rate reached the maximum point of 0.431 kg per hour. In addition to the amount of electricity dedicated to the electrical and hydrogen load, almost 20,270 kWh/yr of electricity would be excess. This surplus electricity could be used for other purposes such as farming or street lighting. Figure 6 shows the amount of power sent to the input of the electrolyzer. Mean input power to and capacity factor of the electrolyzer were equal to 8.48 kW and 42.4%, respectively. Moreover, Figure 7 provides the status of the hydrogen tank. As mentioned, to lower the risk of flammability of hydrogen stored in the tank, it was set to be generated on the weekends.
Figure 8 demonstrates the state of charge of the battery. Since the PV system constitutes the largest portion of the total electricity production, the state of charge shows that during the sunny hours of day the battery is almost full.
A technical analysis of the converter implied that the mean output of the inverter and the rectifier would equate to 0.538 and 9.35 kW, and their maximum points reached 11.5 and 20 kW. The hourly profile of the converter is shown in Figure 9.
It should be clarified that HOMER takes into account the energy losses that occur during the conversion of AC into DC and vice versa as a result of transferring electricity between power generation units, electricity storage, and energy consumption parts [58]. Therefore, the summation of total energy consumption, 137,908 kWh/yr, and surplus electricity, 20,270 kWh/yr, equating to 158,178 kWh/yr is less than the total amount of energy production, 166,338 kWh/yr, by 8160 kWh/yr.

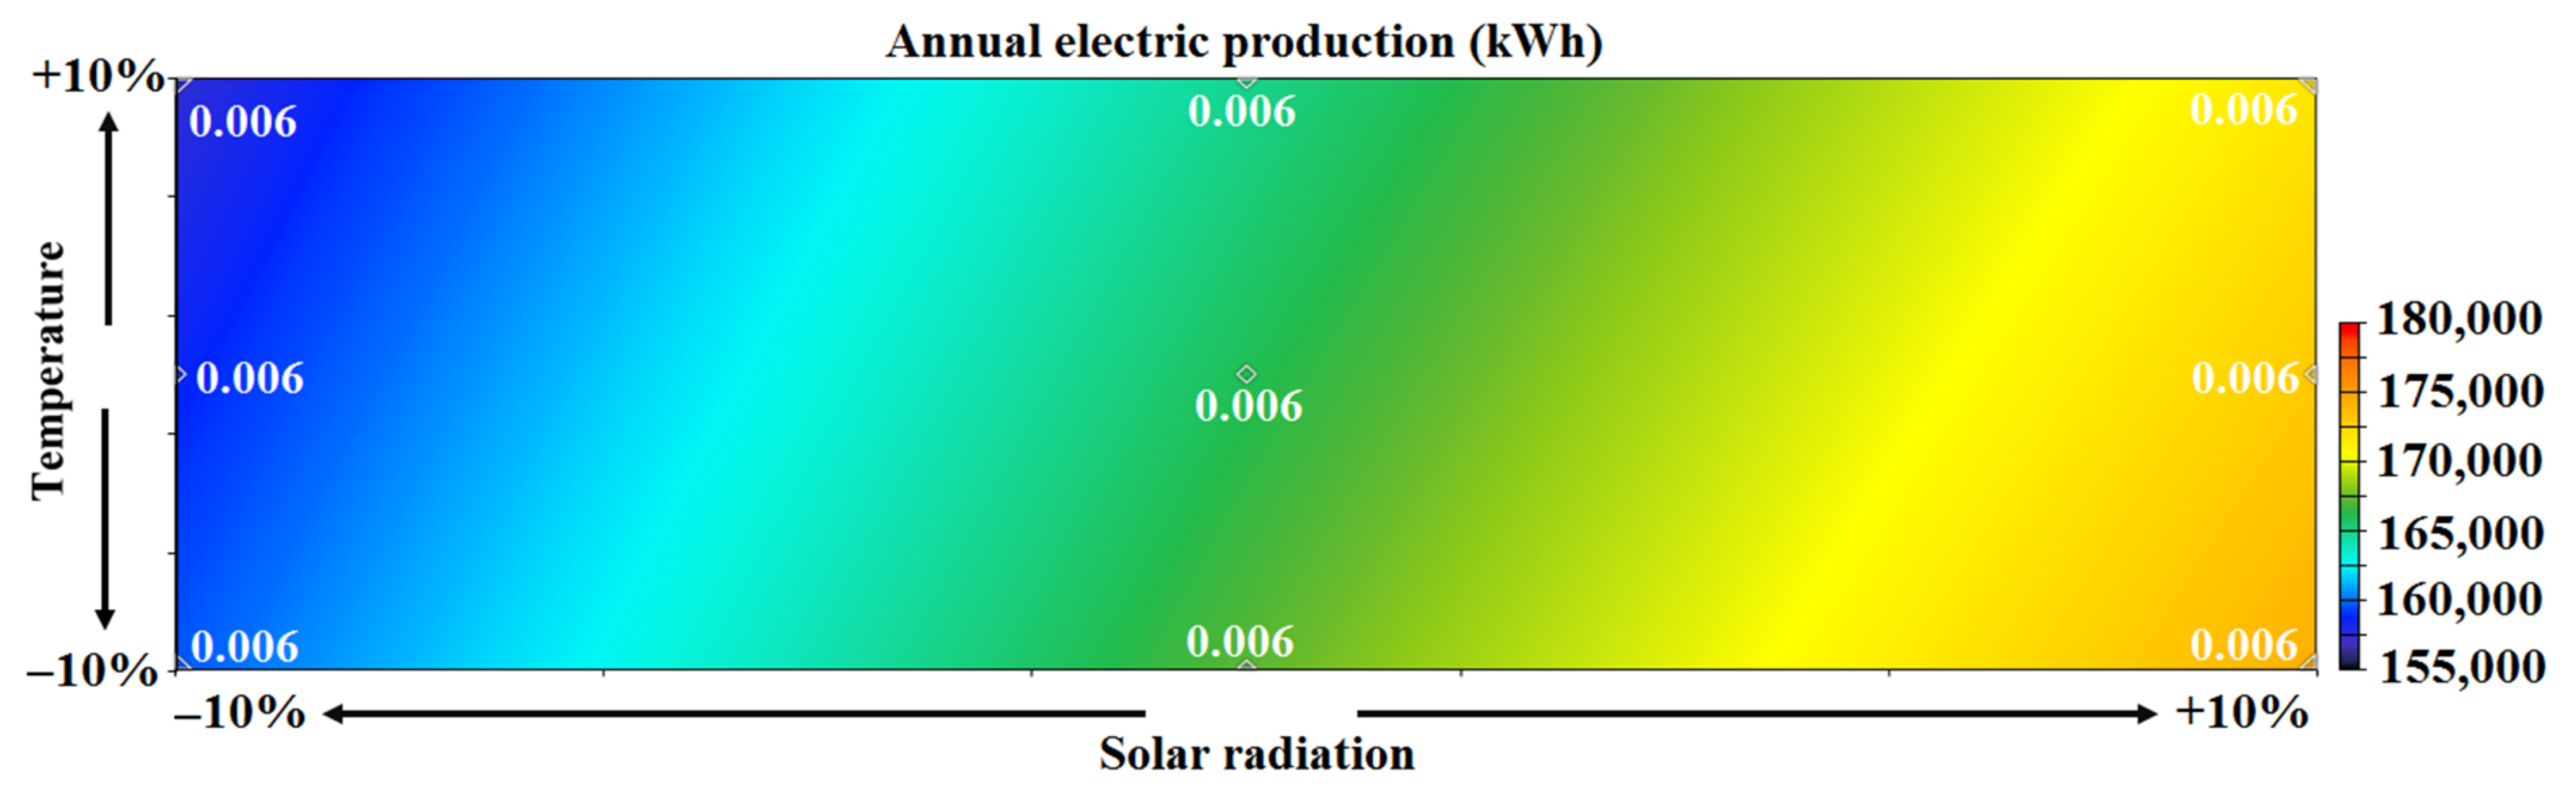
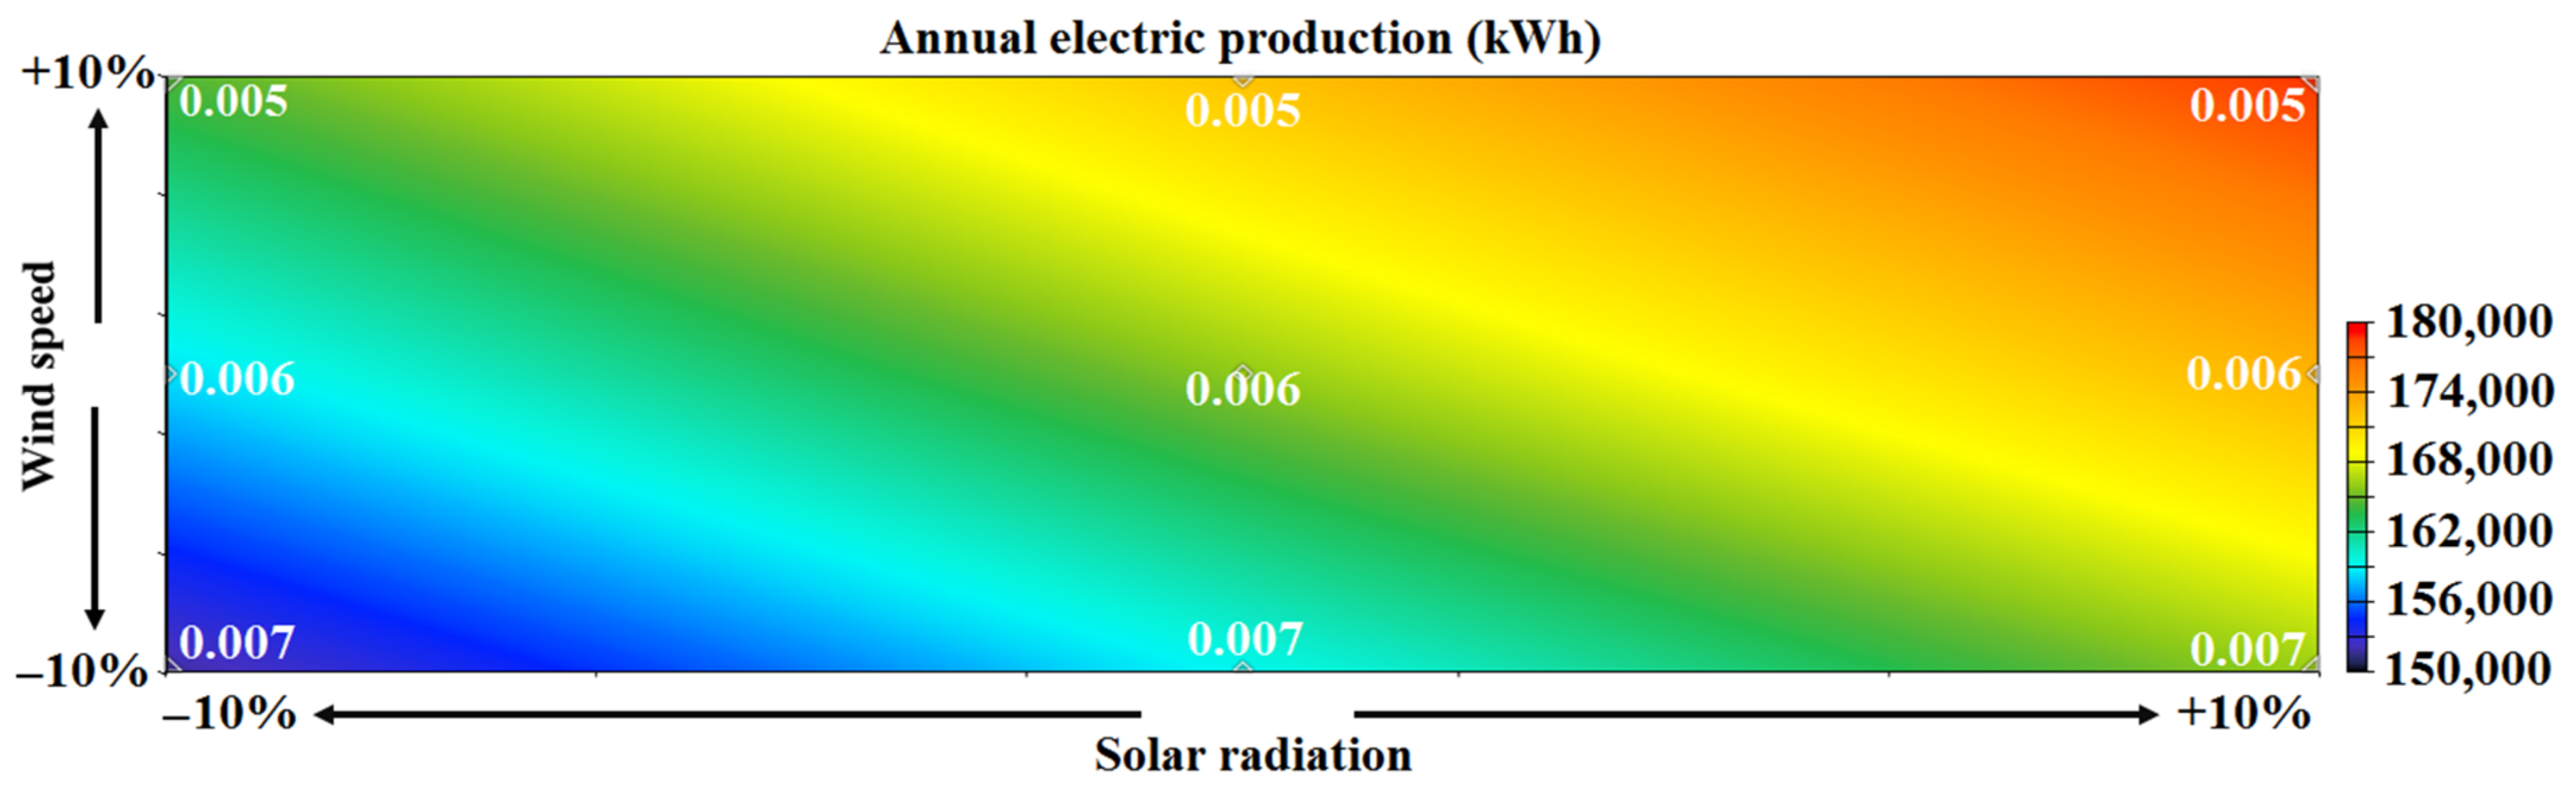
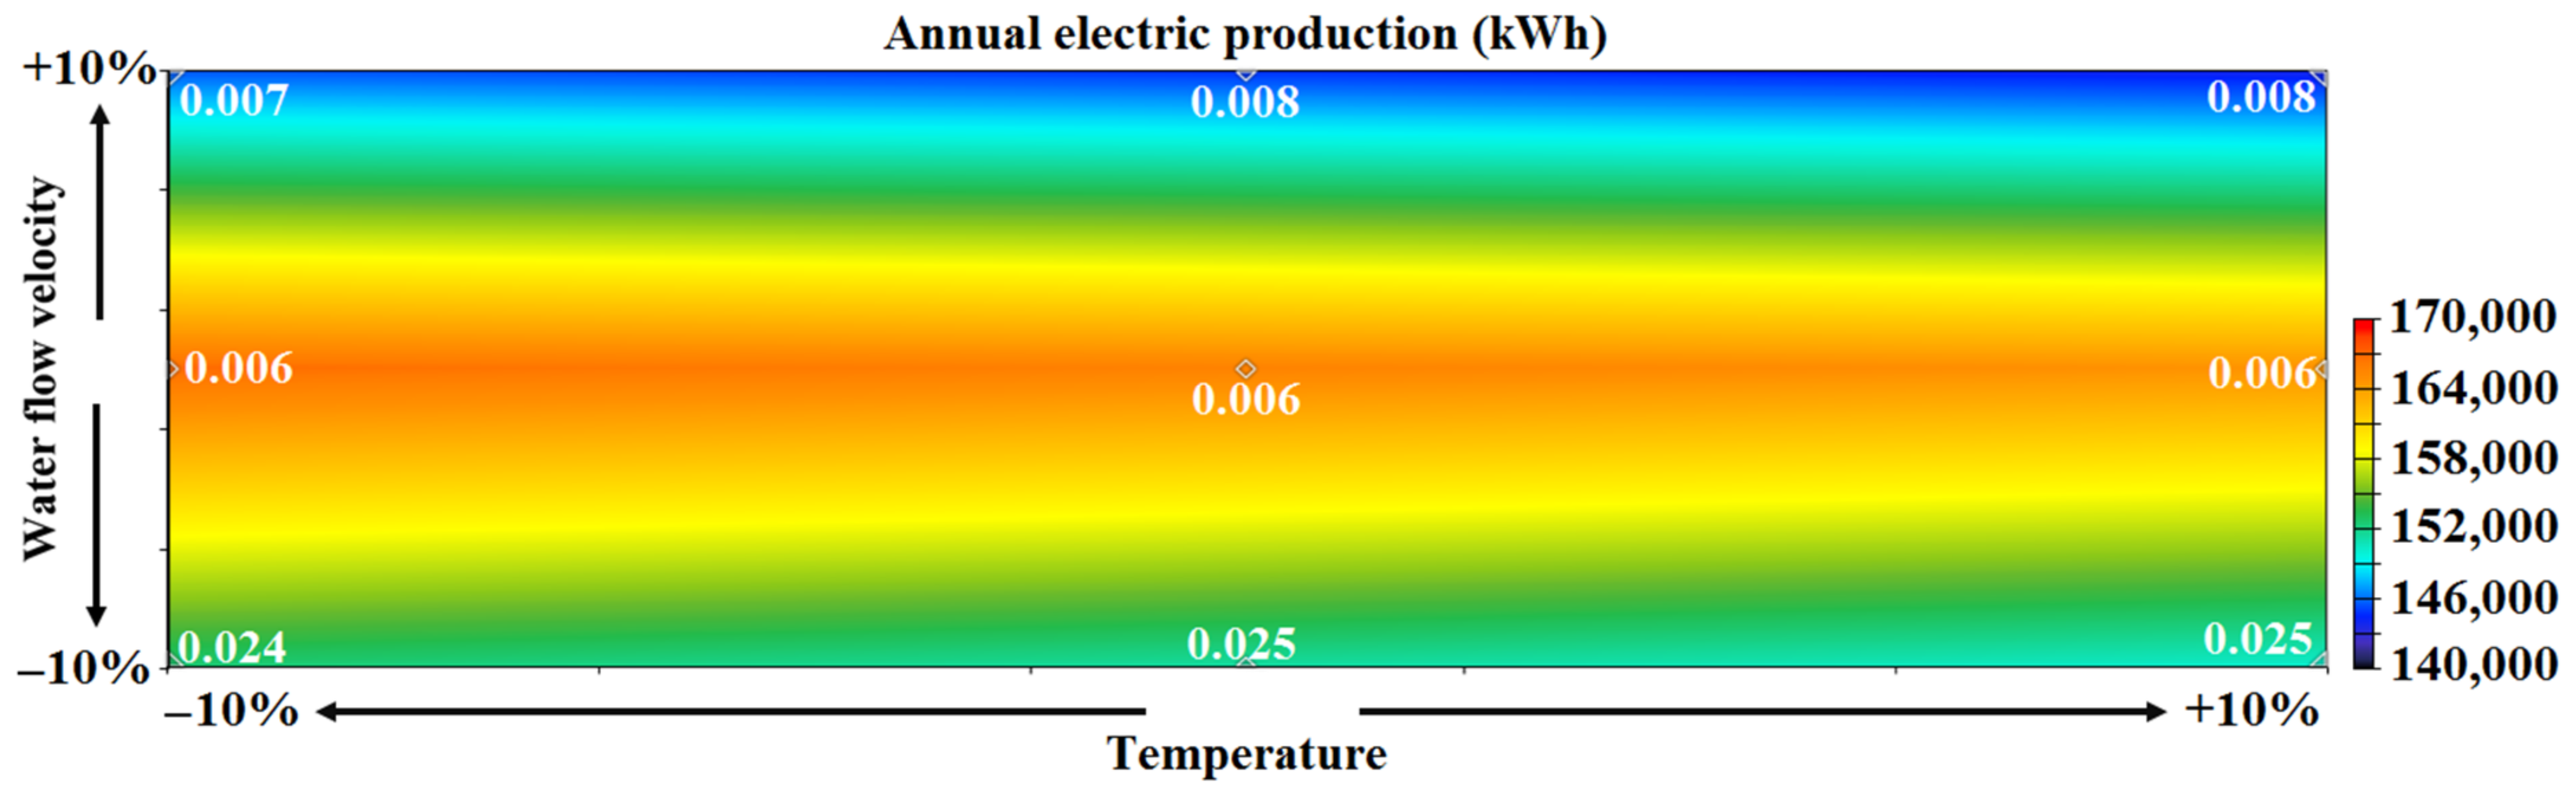
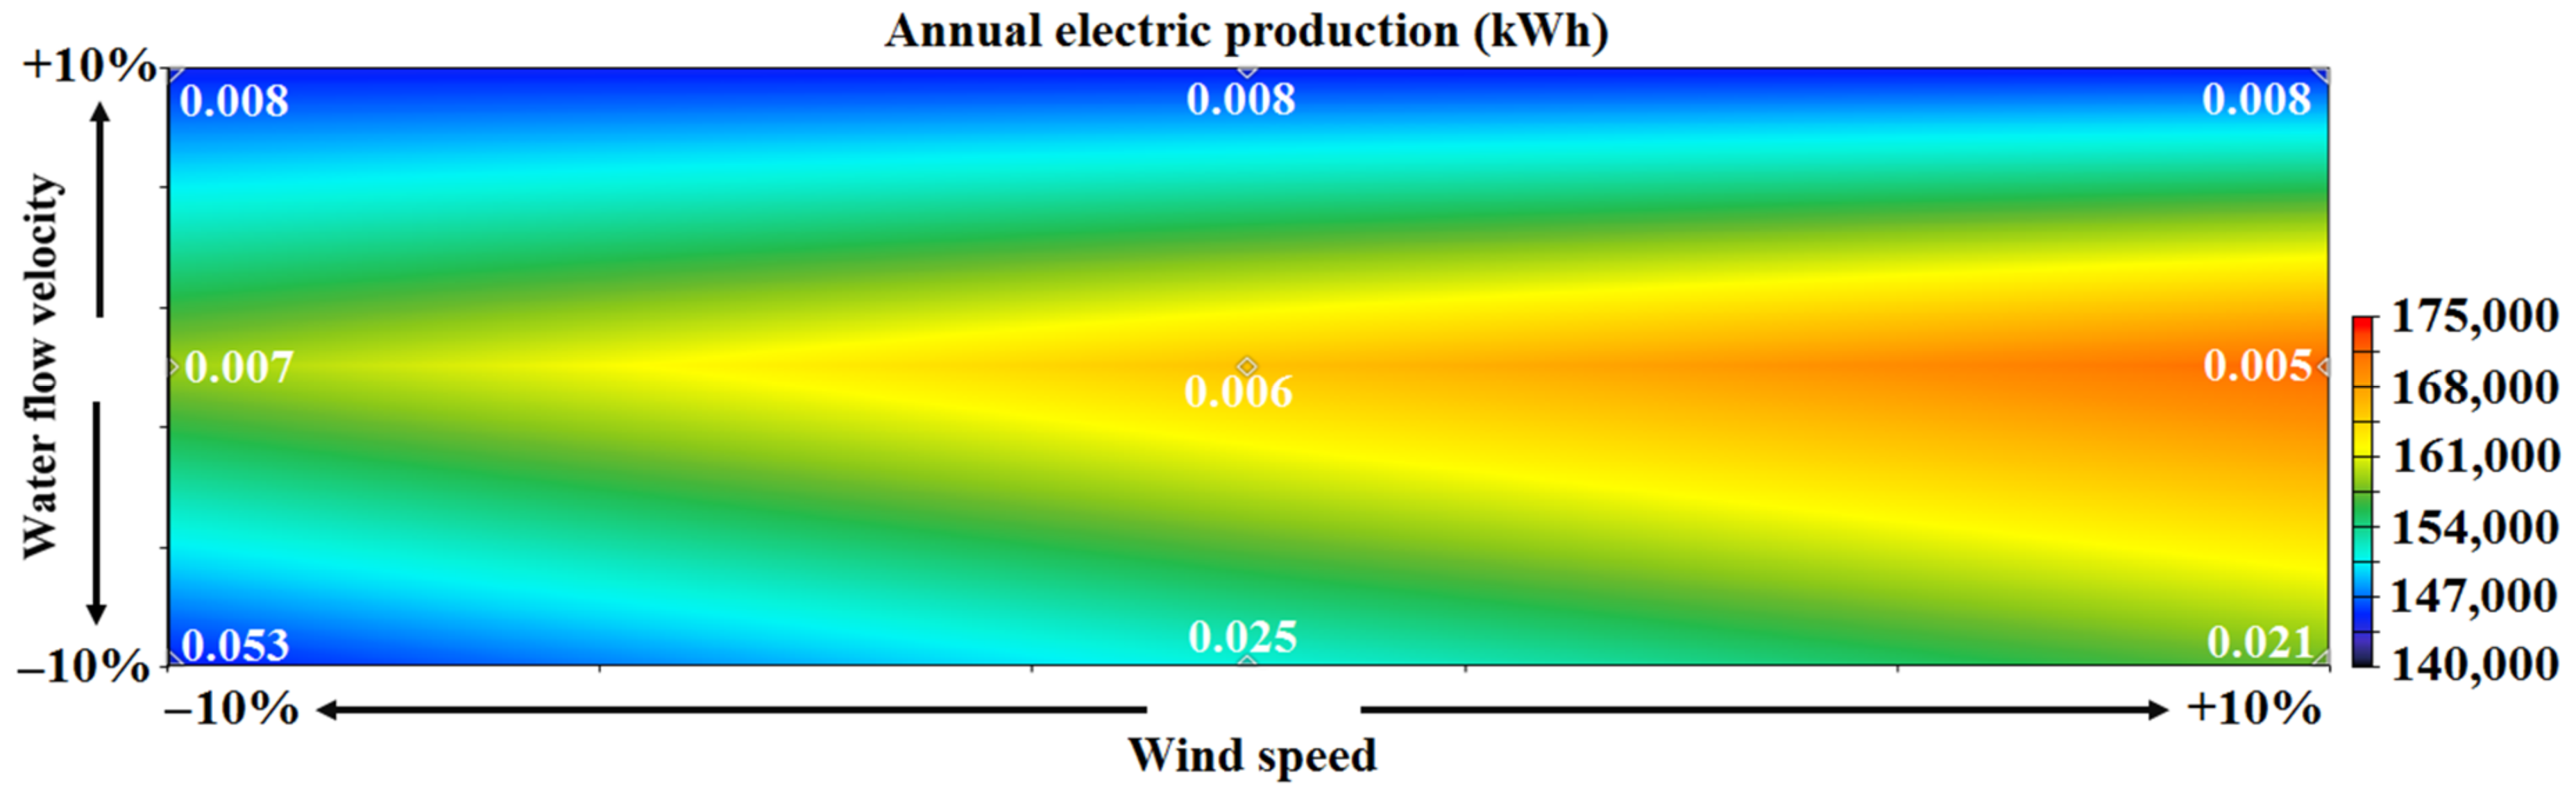
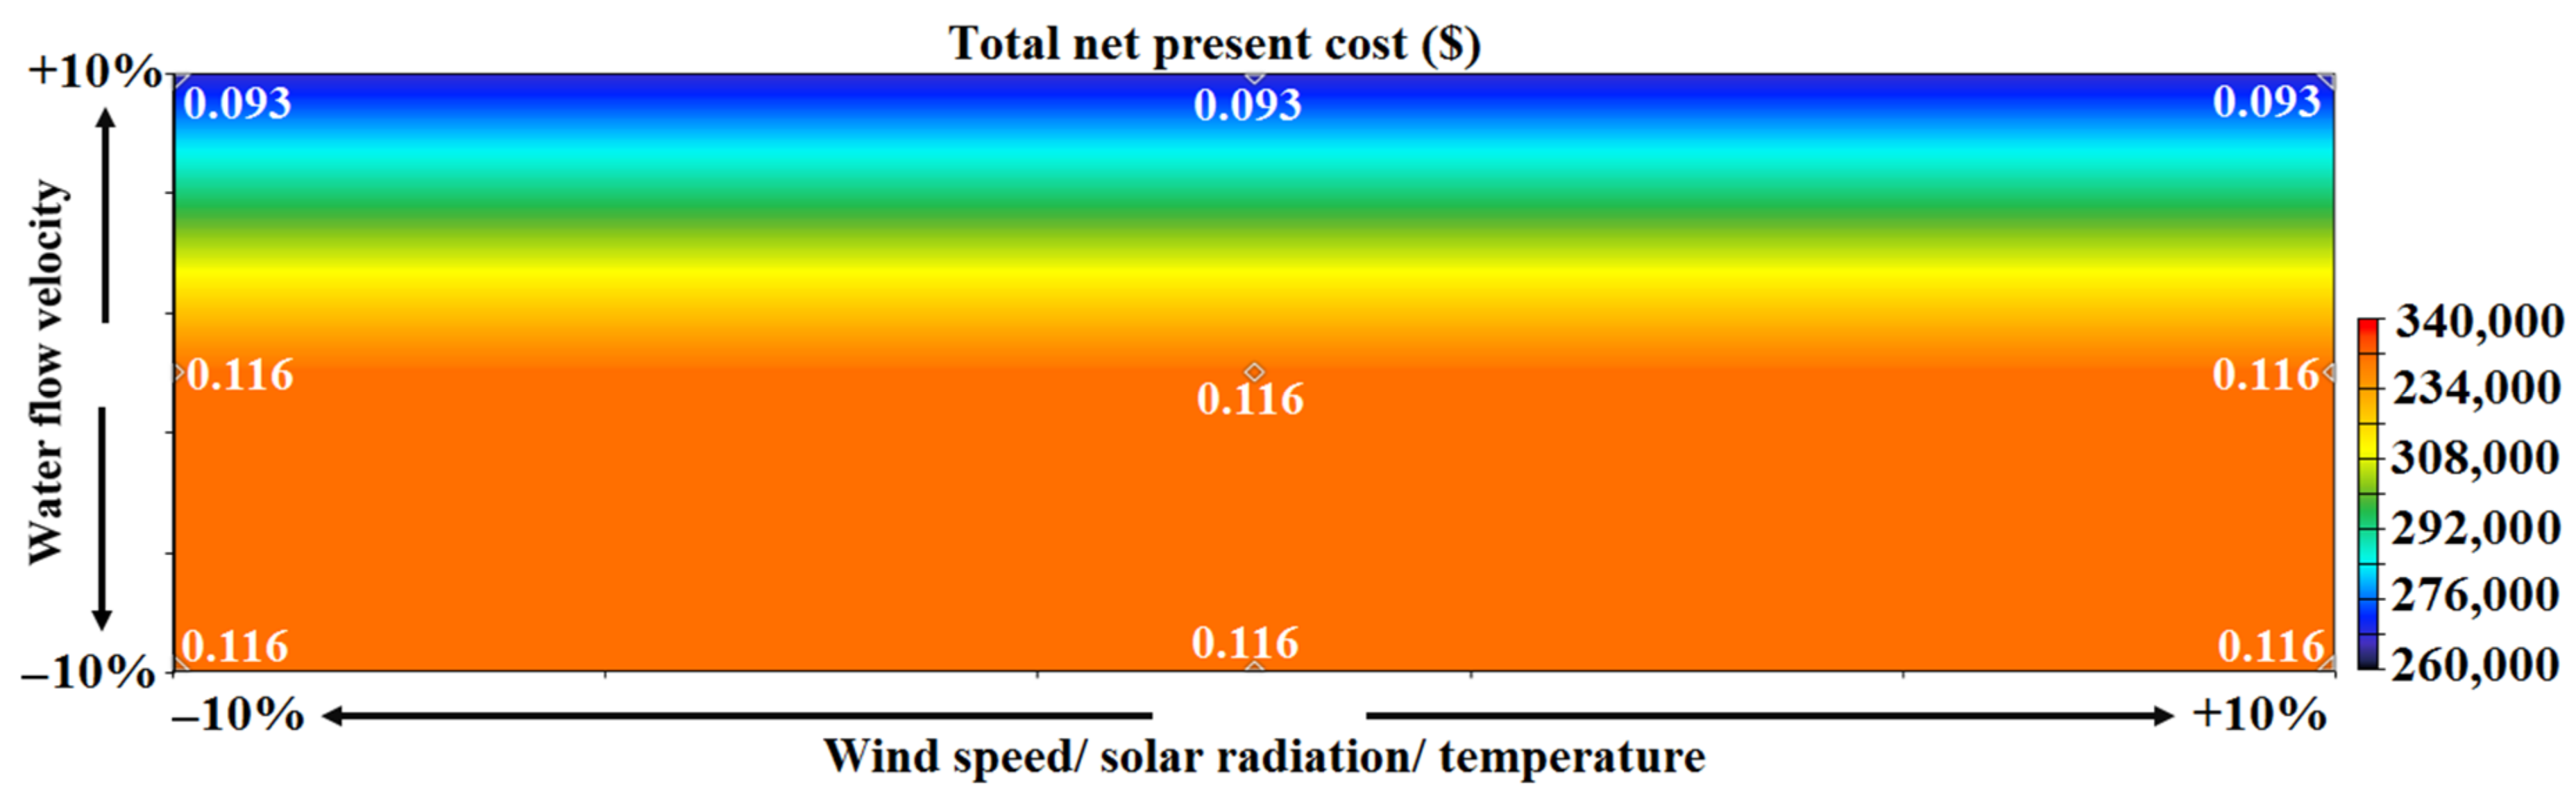
8. Sensitivity Analysis and Discussion

One of the main concerns regarding renewable projects speculating the future is the uncertainty of some critical parameters such as the wind speed, solar radiation, air temperature and water flow velocity. For this, a sensitivity analysis was performed, presuming that the fluctuation of the four above-mentioned variables would be in the range of −10% and +10%. Since HOMER simply creates two-dimensional charts to show the results of sensitivity analysis, the effect of the variation of two variables could be demonstrated. Figure 10, Figure 11, Figure 12, Figure 13, Figure 14 and Figure 15 illustrate the surface plots of annual electricity production for different sensitivity cases. The numbers inside the surface plots refer to the percentage of unmet electricity load. For the case when temperature and solar radiation fluctuated in the range, the amount of unmet load would not see any changes, as demonstrated in Figure 10. Figure 11 shows that when both the wind speed and solar radiation fluctuated, the unmet load would only be sensitive to wind speed. As shown in Figure 15, the maximum of unmet electricity load, 0.053% of the total electricity demand, would occur when the wind speed and water velocity were 10% lower than their normal value.
Other important factors that may be impacted by the fluctuations of the variables are NPC and LCOE. The results of sensitivity analysis revealed that the values of NPC and LCOE would vary only in the case of changing water velocity. Figure 16 depicts the total NPC and LCOE when the water velocity variated in the range of −10% and +10%. Furthermore, LCOE would vary from 0.093 $/kWh to 0.116 $/kWh when the water flow speed decreased from 10% higher than its normal value to 10% lower than that.
To obtain a broader view regarding the establishment of off-grid renewable-based power generation systems in the area under study, different configurations with just one or two sources were analyzed. Table 3 lists the results of further investigation for co-supplying electricity and hydrogen to the case study area using just one or two of the three renewable resources of energy. It also needs to be stated that the number of turbines and capacity of PV systems in table below were obtained in a way to reach the least amount of imposed costs for meeting the electricity and hydrogen load. Comparison of the findings revealed that the proposed power generation site with a PV system, wind turbine, and hydrokinetic turbine would see the best economic output as its NPC, LCOE, and LCOH are the lowest amongst all single and two source power systems.

9. Conclusions

These days, many issues have forced researchers and scientists around the world to propose and assess sustainable means for meeting energy demand. In this regard, remote villages and communities are of high importance as connecting them to the grid will cause extensive costs and detrimental damages to the environment. Therefore, those enjoying natural and renewable resources of energy have drawn attention of researchers because their energy demand could be met by a stand-alone renewable power generation plant. As a result, this study spotted a remote micro-community, near the Karun River in Iran, which possesses great sources of wind, solar, and hydrokinetic energy. Then, an off-grid integrated solar/wind/hydrokinetic system was proposed and examined for co-producing electricity and hydrogen to meet the household demand. The main findings of the simulation by HOMER are as follows:
The combination of a PV system with a rated capacity of 40 kW, a wind turbine with a nominal capacity of 10 kW, and a hydrokinetic turbine with a rated capacity of 20 kW would result in generating 166,338 kWh/yr of electricity.
The aforementioned system would also produce 1601 kg of hydrogen to meet the demand for household transport.
After co-supplying the electric and hydrogen demand, the surplus electricity would equate to some 20,270 kWh/yr, which could be planned for other loads such as farming or street lighting.
The total NPC of electricity and hydrogen co-generation using the proposed system would be $333,074.
LCOE and LCOH of the under-investigation system were computed 0.1155 $/kWh and 4.59 $/kg, respectively.
If the two variables of solar radiation and wind speed went 10% higher than their normal value, then the maximum of annual electric production would be obtained.
If just the water flow velocity was 10% higher than its normal value, then the LCOE would decline by almost 20%, from 0.1155 to 0.093 $/kWh.
Analysis and comparison of various configurations with one or two sources of energy disclosed that the proposed system combining three resources of solar, wind, and hydrokinetic energy is the most cost-competitive one, as its NPC, LCOE, and LCOH have the lowest values compared to those of other systems containing just one or two sources of energy. Unlike the wind-based and hydrokinetic-powered system, HOMER could not find a feasible solution with just solar energy as the power source to meet the load. This indicates that the idea of integrating three sources of energy that are available in the area is the most appropriate alternative from an economic point of view.

10. Future Research Direct

Due to the high importance of economics of a project and analyzing the risk associated with investments, it is recommended that the impact of economic uncertainty be assessed in a future research because developing countries are suffering from volatile economies. Additionally, a techno-economic assessment of electricity/heat co-production is recommended.

Author Contributions

Conceptualization, T.X., M.R., U.D., S.A.A., P.F.B. and M.A.M.; Formal analysis, M.R., U.D., P.F.B. and M.A.M.; Funding acquisition, M.R., U.D. and O.N.; Investigation, M.A.M.; Methodology, M.R., U.D., P.F.B. and M.A.M.; Project administration, O.N.; Resources, M.R. and U.D.; Software, M.R., U.D. and M.A.M.; Supervision, M.A.M.; Validation, S.A.A. and O.N.; Writing—original draft, T.X., M.R., U.D., P.F.B. and M.A.M.; Writing—review & editing, M.R., U.D., P.F.B. and M.A.M. All authors have read and agreed to the published version of the manuscript.

Funding

This project was supported by Researchers Supporting Project number (RSP-2021/257) King Saud University, Riyadh, Saudi Arabia.

Institutional Review Board Statement

Not applicable.

Informed Consent Statement

Not applicable.

Data Availability Statement

The data supporting reported results are available in the manuscript.

Acknowledgments

This project was supported by Researchers Supporting Project number (RSP-2021/257) King Saud University, Riyadh, Saudi Arabia.

Conflicts of Interest

The authors declare no conflict of interest.

References

  1. Borowski, P.F.; Kupczyk, A. Adaptation Strategy as a Direction of Firm Development In an Uncertain (Variable) Environment. J. Emerg. Mark. 2015, 20, 24–36. [Google Scholar]
  2. Rezaei, M.; Khalilpour, K.R.; Jahangiri, M. Multi-Criteria Location Identification for Wind/Solar based Hydrogen Generation: The Case of Capital Cities of a Developing Country. Int. J. Hydrog. Energy 2020, 45, 33151–33168. [Google Scholar] [CrossRef]
  3. IRENA. International Renewable Energy Agency. n.d. Available online: https://www.irena.org/solar. (accessed on 13 February 2021).
  4. Rezaei, M.; Mostafaeipour, A.; Jafari, N.; Naghdi-Khozani, N.; Moftakharzadeh, A. Wind and Solar Energy Utilization for Seawater Desalination and Hydrogen Production in the Coastal Areas of Southern Iran. J. Eng. Des. Technol. 2020. [Google Scholar] [CrossRef]
  5. Kaldellis, J.K.; Zafirakis, D. The Wind Energy (r) Evolution: A Short Review of a Long History. Renew. Energy 2011, 36, 1887–1901. [Google Scholar] [CrossRef]
  6. Bórawski, P.; Bełdycka-Bórawska, A.; Jankowski, K.J.; Dubis, B.; Dunn, J.W. Development of Wind Energy Market in the European Union. Renew. Energy 2020, 161, 691–700. [Google Scholar] [CrossRef]
  7. Khan, M.J.; Bhuyan, G.; Iqbal, M.T.; Quaicoe, J.E. Hydrokinetic Energy Conversion Systems and Assessment of Horizontal and Vertical Axis Turbines for River and Tidal Applications: A Technology Status Review. Appl. Energy 2009, 86, 1823–1835. [Google Scholar] [CrossRef]
  8. Arévalo, P.; Benavides, D.; Lata-García, J.; Jurado, F. Energy Control and Size Optimization of a Hybrid System (Photovoltaic-Hidrokinetic) using Various Storage Technologies. Sustain. Cities Soc. 2020, 52, 101773. [Google Scholar] [CrossRef]
  9. Cordero, P.A.; Benavides, D.J.; Jurado, F. Energy Control and Sizing Optimization of an off Grid Hybrid System (Wind-Hydrokinetic-Diesel). In Proceedings of the IEEE 4th Colombian Conference on Automatic Control (CCAC), Medellin, Colombia, 15–18 October 2019. [Google Scholar]
  10. Khan, M.J.; Iqbal, M.T.; Quaicoe, J.E. River Current Energy Conversion Systems: Progress, Prospects and Challenges. Renew. Sustain. Energy Rev. 2008, 12, 2177–2193. [Google Scholar] [CrossRef]
  11. Kumar, A.; Pandey, A. Cost Assessment of Hydrokinetic Power Generation. Int. J. Adv. Res. Sci. Eng. 2017, 6, 224–233. [Google Scholar]
  12. Fouz, D.M.; Carballo, R.; Ramos, V.; Iglesias, G. Hydrokinetic Energy Exploitation under Combined River and Tidal Flow. Renew. Energy 2019, 143, 558–568. [Google Scholar] [CrossRef]
  13. Kusakana, K.; Vermaak, H.J. Hydrokinetic Power Generation for Rural Electricity Supply: Case of South Africa. Renew. Energy 2013, 55, 467–473. [Google Scholar] [CrossRef]
  14. Kusakana, K. Feasibility Analysis of River Off-Grid Hydrokinetic Systems with Pumped Hydro Storage in Rural Applications. Energy Convers. Manag. 2015, 96, 352–362. [Google Scholar] [CrossRef]
  15. Kusakana, K. Optimization of the Daily Operation of a Hydrokinetic–Diesel Hybrid System with Pumped Hydro Storage. Energy Convers. Manag. 2015, 106, 901–910. [Google Scholar] [CrossRef]
  16. Ramírez, R.D.M.; Cuervo, F.I.; Rico, C.A.M. Technical and Financial Valuation of Hydrokinetic Power in the Discharge Channels of Large Hydropower Plants in Colombia: A Case Study. Renew. Energy 2016, 99, 136–147. [Google Scholar] [CrossRef]
  17. Li, B.; DeQueiroz, R.A.; DeCarolis, J.F.; Bane, J.; He, R.; Keeler, A.G.; Neary, V.S. The Economics of Electricity Generation from Gulf Stream Currents. Energy 2017, 134, 649–658. [Google Scholar] [CrossRef]
  18. Lata-García, J.; Jurado, F.; Fernández-Ramírez, L.M.; Sánchez-Sainz, H. Optimal Hydrokinetic Turbine Location and Techno-Economic Analysis of a Hybrid System based on Photovoltaic/Hydrokinetic/Hydrogen/Battery. Energy 2018, 159, 611–620. [Google Scholar] [CrossRef]
  19. Kusakana, K.; Vermaak, H.J. Cost and Performance Evaluation of Hydrokinetic-Diesel Hybrid Systems. Energy Procedia 2014, 61, 2439–2442. [Google Scholar] [CrossRef] [Green Version]
  20. Cano, A.; Arévalo, P.; Jurado, F. Energy Analysis and Techno-Economic Assessment of a Hybrid PV/HKT/BAT System using Biomass Gasifier: Cuenca-Ecuador Case Study. Energy 2020, 202, 117727. [Google Scholar] [CrossRef]
  21. John, B.; Thomas, R.N.; Varghese, J. Integration of Hydrokinetic Turbine-PV-Battery Standalone System for Tropical Climate Condition. Renew. Energy 2020, 149, 361–373. [Google Scholar] [CrossRef]
  22. Ibrahim, M.M.; Mostafa, N.H.; Osman, A.H.; Hesham, A. Performance Analysis of a Stand-Alone Hybrid Energy System for Desalination Unit in Egypt. Energy Convers. Manag. 2020, 215, 112941. [Google Scholar] [CrossRef]
  23. Aziz, A.S.; Tajuddin, M.F.N.; Adzman, M.R.; Azmi, A.; Ramli, M.A.M. Optimization and Sensitivity Analysis of Standalone Hybrid Energy Systems for Rural Electrification: A Case Study of Iraq. Renew. Energy 2019, 138, 775–792. [Google Scholar] [CrossRef]
  24. Kumar, A.; Singh, A.R.; Deng, Y.; He, X.; Kumar, P.; Bansal, R.C. Integrated Assessment of a Sustainable Microgrid for a Remote Village in Hilly Region. Energy Convers. Manag. 2019, 180, 442–472. [Google Scholar] [CrossRef]
  25. Fadaeenejad, M.; Radzi, M.A.M.; AbKadir, M.Z.A.; Hizam, H. Assessment of Hybrid Renewable Power Sources for Rural Electrification in Malaysia. Renew. Sustain. Energy Rev. 2014, 30, 299–305. [Google Scholar] [CrossRef]
  26. Pode, R.; Diouf, B.; Pode, G. Sustainable Rural Electrification using Rice Husk Biomass Energy: A Case Study of Cambodia. Renew. Sustain. Energy Rev. 2015, 44, 530–542. [Google Scholar] [CrossRef]
  27. Baurzhan, S.; Jenkins, G.P. Off-Grid Solar PV: Is It an Affordable or Appropriate Solution for Rural Electrification in Sub-Saharan African Countries? Renew. Sustain. Energy Rev. 2016, 60, 1405–1418. [Google Scholar] [CrossRef]
  28. Sarkar, T.; Bhattacharjee, A.; Samanta, H.; Bhattacharya, K.; Saha, H. Optimal Design and Implementation of Solar PV-Wind-Biogas-VRFB Storage Integrated Smart Hybrid Microgrid for Ensuring Zero Loss of Power Supply Probability. Energy Convers. Manag. 2019, 191, 102–118. [Google Scholar] [CrossRef]
  29. Murugaperumala, K.; Srinivasn, S.; Prasad, G.R.K.D.S. Optimum Design of Hybrid Renewable Energy System through Load Forecasting and Different Operating Strategies for Rural Electrification. Sustain. Energy Technol. Assess. 2020, 37, 100613. [Google Scholar] [CrossRef]
  30. Suresh, V.; Muralidhar, M.; Kiranmayi, R. Modelling and Optimization of an Off-Grid Hybrid Renewable Energy System for Electrification in a Rural Area. Energy Rep. 2020, 6, 594–604. [Google Scholar] [CrossRef]
  31. Tamoor, M.; Tahir, M.S.; Sagir, M.; Tahir, M.B.; Iqbal, S.; Nawaz, T. Design of 3 kW Integrated Power Generation System from Solar and Biogas. Int. J. Hydrog. Energy 2020, 45, 12711–12720. [Google Scholar] [CrossRef]
  32. Gómez-Hernández, D.F.; Domenech, B.; Moreira, J.; Farrera, N.; López-González, A.; Ferrer-Martí, L. Comparative Evaluation of Rural Electrification Project Plans: A Case Study in Mexico. Energy Policy 2019, 129, 23–33. [Google Scholar] [CrossRef]
  33. López-González, A.; Ferrer-Martí, L.; Domenech, B. Sustainable Rural Electrification Planning in Developing Countries: A Proposal for Electrification of Isolated Communities of Venezuela. Energy Policy 2019, 129, 327–338. [Google Scholar] [CrossRef]
  34. Sánchez, A.S.; Torres, E.A.; Kalid, R.A. Renewable Energy Generation for the Rural Electrification of Isolated Communities in the Amazon Region. Renew. Sustain. Energy Rev. 2015, 49, 278–290. [Google Scholar] [CrossRef]
  35. Fodhil, F.; Hamidat, A.; Nadjemi, O. Potential, Optimization and Sensitivity Analysis of Photovoltaic-Diesel-Battery Hybrid Energy System for Rural Electrification in Algeria. Energy 2019, 169, 613–624. [Google Scholar] [CrossRef]
  36. Xu, D.; Numata, M.; Mogi, G. Economic Comparison of Microgrid Systems for Rural Electrification in Myanmar. Energy Procedia 2019, 159, 309–314. [Google Scholar] [CrossRef]
  37. Gebrehiwot, K.; Mondal, M.A.H.; Ringler, C.; Gebremeskel, A.G. Optimization and Cost-Benefit Assessment of Hybrid Power Systems for Off-Grid Rural Electrification in Ethiopia. Energy 2019, 177, 234–246. [Google Scholar] [CrossRef]
  38. Odou, O.D.T.; Bhandari, R.; Adamou, R. Hybrid Off-Grid Renewable Power System for Sustainable Rural Electrification in Benin. Renew. Energy 2020, 145, 1266–1279. [Google Scholar] [CrossRef]
  39. Lozano, L.; Querikiol, E.M.; Abundo, M.L.S.; Bellotindos, L.M. Techno-Economic Analysis of a Cost-Effective Power Generation System for Off-Grid Island Communities: A Case Study of Gilutongan Island, Cordova, Cebu, Philippines. Renew. Energy 2019, 140, 905–911. [Google Scholar] [CrossRef]
  40. Mostafaeipour, A.; Qolipour, M.; Rezaei, M.; Goudarzi, H. Techno-Economic Assessment of using Wind Power System for Tribal Region of Gachsaran in Iran. Int. J. Eng. Des. Technol. 2019, 18, 293–307. [Google Scholar] [CrossRef]
  41. Kasaeian, A.; Rahdan, P.; Vaziri Rad, M.A.; Yan, W.M. Optimal Design and Technical Analysis of a Grid-Connected Hybrid Photovoltaic/Diesel/Biogas under Different Economic Conditions: A Case Study. Energy Convers. Manag. 2019, 198, 111810. [Google Scholar] [CrossRef]
  42. Vaziri Rad, M.A.; Ghasempour, R.; Rahdan, P.; Moosavi, S.; Arastounia, M. Techno-Economic Analysis of a Hybrid Power System based on the Cost-Effective Hydrogen Production Method for Rural Electrification, A Case Study in Iran. Energy 2020, 190, 116421. [Google Scholar]
  43. Mandal, S.; Das, B.K.; Hoque, N. Optimum Sizing of a Stand-Alone Hybrid Energy System for Rural Electrification in Bangladesh. J. Clean. Prod. 2018, 200, 12–27. [Google Scholar] [CrossRef]
  44. Kusakana, K. Techno-Economic Analysis of Off-Grid Hydrokinetic-Based Hybrid Energy Systems for Onshore/Remote Area in South Africa. Energy 2014, 68, 947–957. [Google Scholar] [CrossRef]
  45. Rezaei, M.; Naghdi-Khozani, N.; Jafari, N. Wind Energy Utilization for Hydrogen Production in an Underdeveloped Country: An Economic Investigation. Renew. Energy 2020, 47, 1044–1057. [Google Scholar] [CrossRef]
  46. Noruzi, R.; Vahidzadeh, M.; Riasi, A. Design, Analysis and Predicting Hydrokinetic Performance of a Horizontal Marine Current Axial Turbine by Consideration of Turbine Installation Depth. Ocean. Eng. 2015, 108, 789–798. [Google Scholar] [CrossRef]
  47. Vermaak, H.J.; Kusakana, K.; Koko, S.P. Status of Micro-Hydrokinetic River Technology in Rural Applications: A Review of Literature. Renew. Sustain. Energy Rev. 2014, 29, 625–633. [Google Scholar] [CrossRef]
  48. Cozzolino, R.; Tribioli, L.; Bella, G. Power Management of a Hybrid Renewable System for Artificial Islands: A Case Study. Energy 2016, 106, 774–789. [Google Scholar] [CrossRef]
  49. Singh, A.; Baredar, P.; Gupta, B. Techno-Economic Feasibility Analysis of Hydrogen Fuel Cell and Solar Photovoltaic Hybrid Renewable Energy System for Academic Research Building. Energy Convers. Manag. 2017, 145, 398–414. [Google Scholar] [CrossRef]
  50. Karmaker, A.K.; Ahmed, R.; Hossain, A.; Sikder, M. Feasibility Assessment & Design of Hybrid Renewable Energy based Electric Vehicle Charging Station in Bangladesh. Sustain. Cities Soc. 2018, 39, 189–202. [Google Scholar]
  51. Das, B.K.; Zaman, F. Performance Analysis of a PV/Diesel Hybrid System for a Remote Area in Bangladesh: Effects of Dispatch Strategies, Batteries, and Generator Selection. Energy 2019, 169, 263–276. [Google Scholar] [CrossRef]
  52. Kumar, D.; Sarkar, S. A Review on the Technology, Performance, Design Optimization, Reliability, Techno-Economics and Environmental Impacts of Hydrokinetic Energy Conversion Systems. Renew. Sustain. Energy Rev. 2016, 58, 796–813. [Google Scholar] [CrossRef]
  53. Abdin, Z.; Mérida, W. Hybrid Energy Systems for Off-Grid Power Supply and Hydrogen Production based on Renewable Energy: A Techno-Economic Analysis. Energy Convers. Manag. 2019, 196, 1068–1079. [Google Scholar] [CrossRef]
  54. Al-Ghussain, L.; Ahmad, A.D.; Abubaker, A.M.; Mohamed, M.A. An Integrated Photovoltaic/Wind/Biomass and Hybrid Energy Storage Systems Towards 100% Renewable Energy Microgrids in University Campuses. Sustain. Energy Technol. Assess. 2021, 46, 101273. [Google Scholar]
  55. Lan, T.; Jermsittiparsert, K.; Alrashood, S.T.; Rezaei, M.; Al-Ghussain, L.; Mohamed, M.A. An Advanced Machine Learning based Energy Management of Renewable Microgrids Considering Hybrid Electric Vehicles’ Charging Demand. Energies 2021, 14, 569. [Google Scholar] [CrossRef]
  56. Rezaei, M.; Khalilpour, K.R.; Mohamed, M.A. Co-Production of Electricity and Hydrogen from Wind: A Comprehensive Scenario-based Techno-Economic Analysis. Int. J. Hydrog. Energy 2021, 46, 18242–18256. [Google Scholar] [CrossRef]
  57. Al-Ghussain, L.; Ahmad, A.D.; Abubaker, A.M.; Abujubbeh, M.; Almalaq, A.; Mohamed, M.A. A Demand-Supply Matching-Based Approach for Mapping Renewable Resources Towards 100% Renewable Grids in 2050. IEEE Access 2021, 9, 58634–58651. [Google Scholar] [CrossRef]
  58. Borowski, P.F. Zonal and Nodal Models of Energy Market in European Union. Energies 2020, 13, 4182. [Google Scholar] [CrossRef]
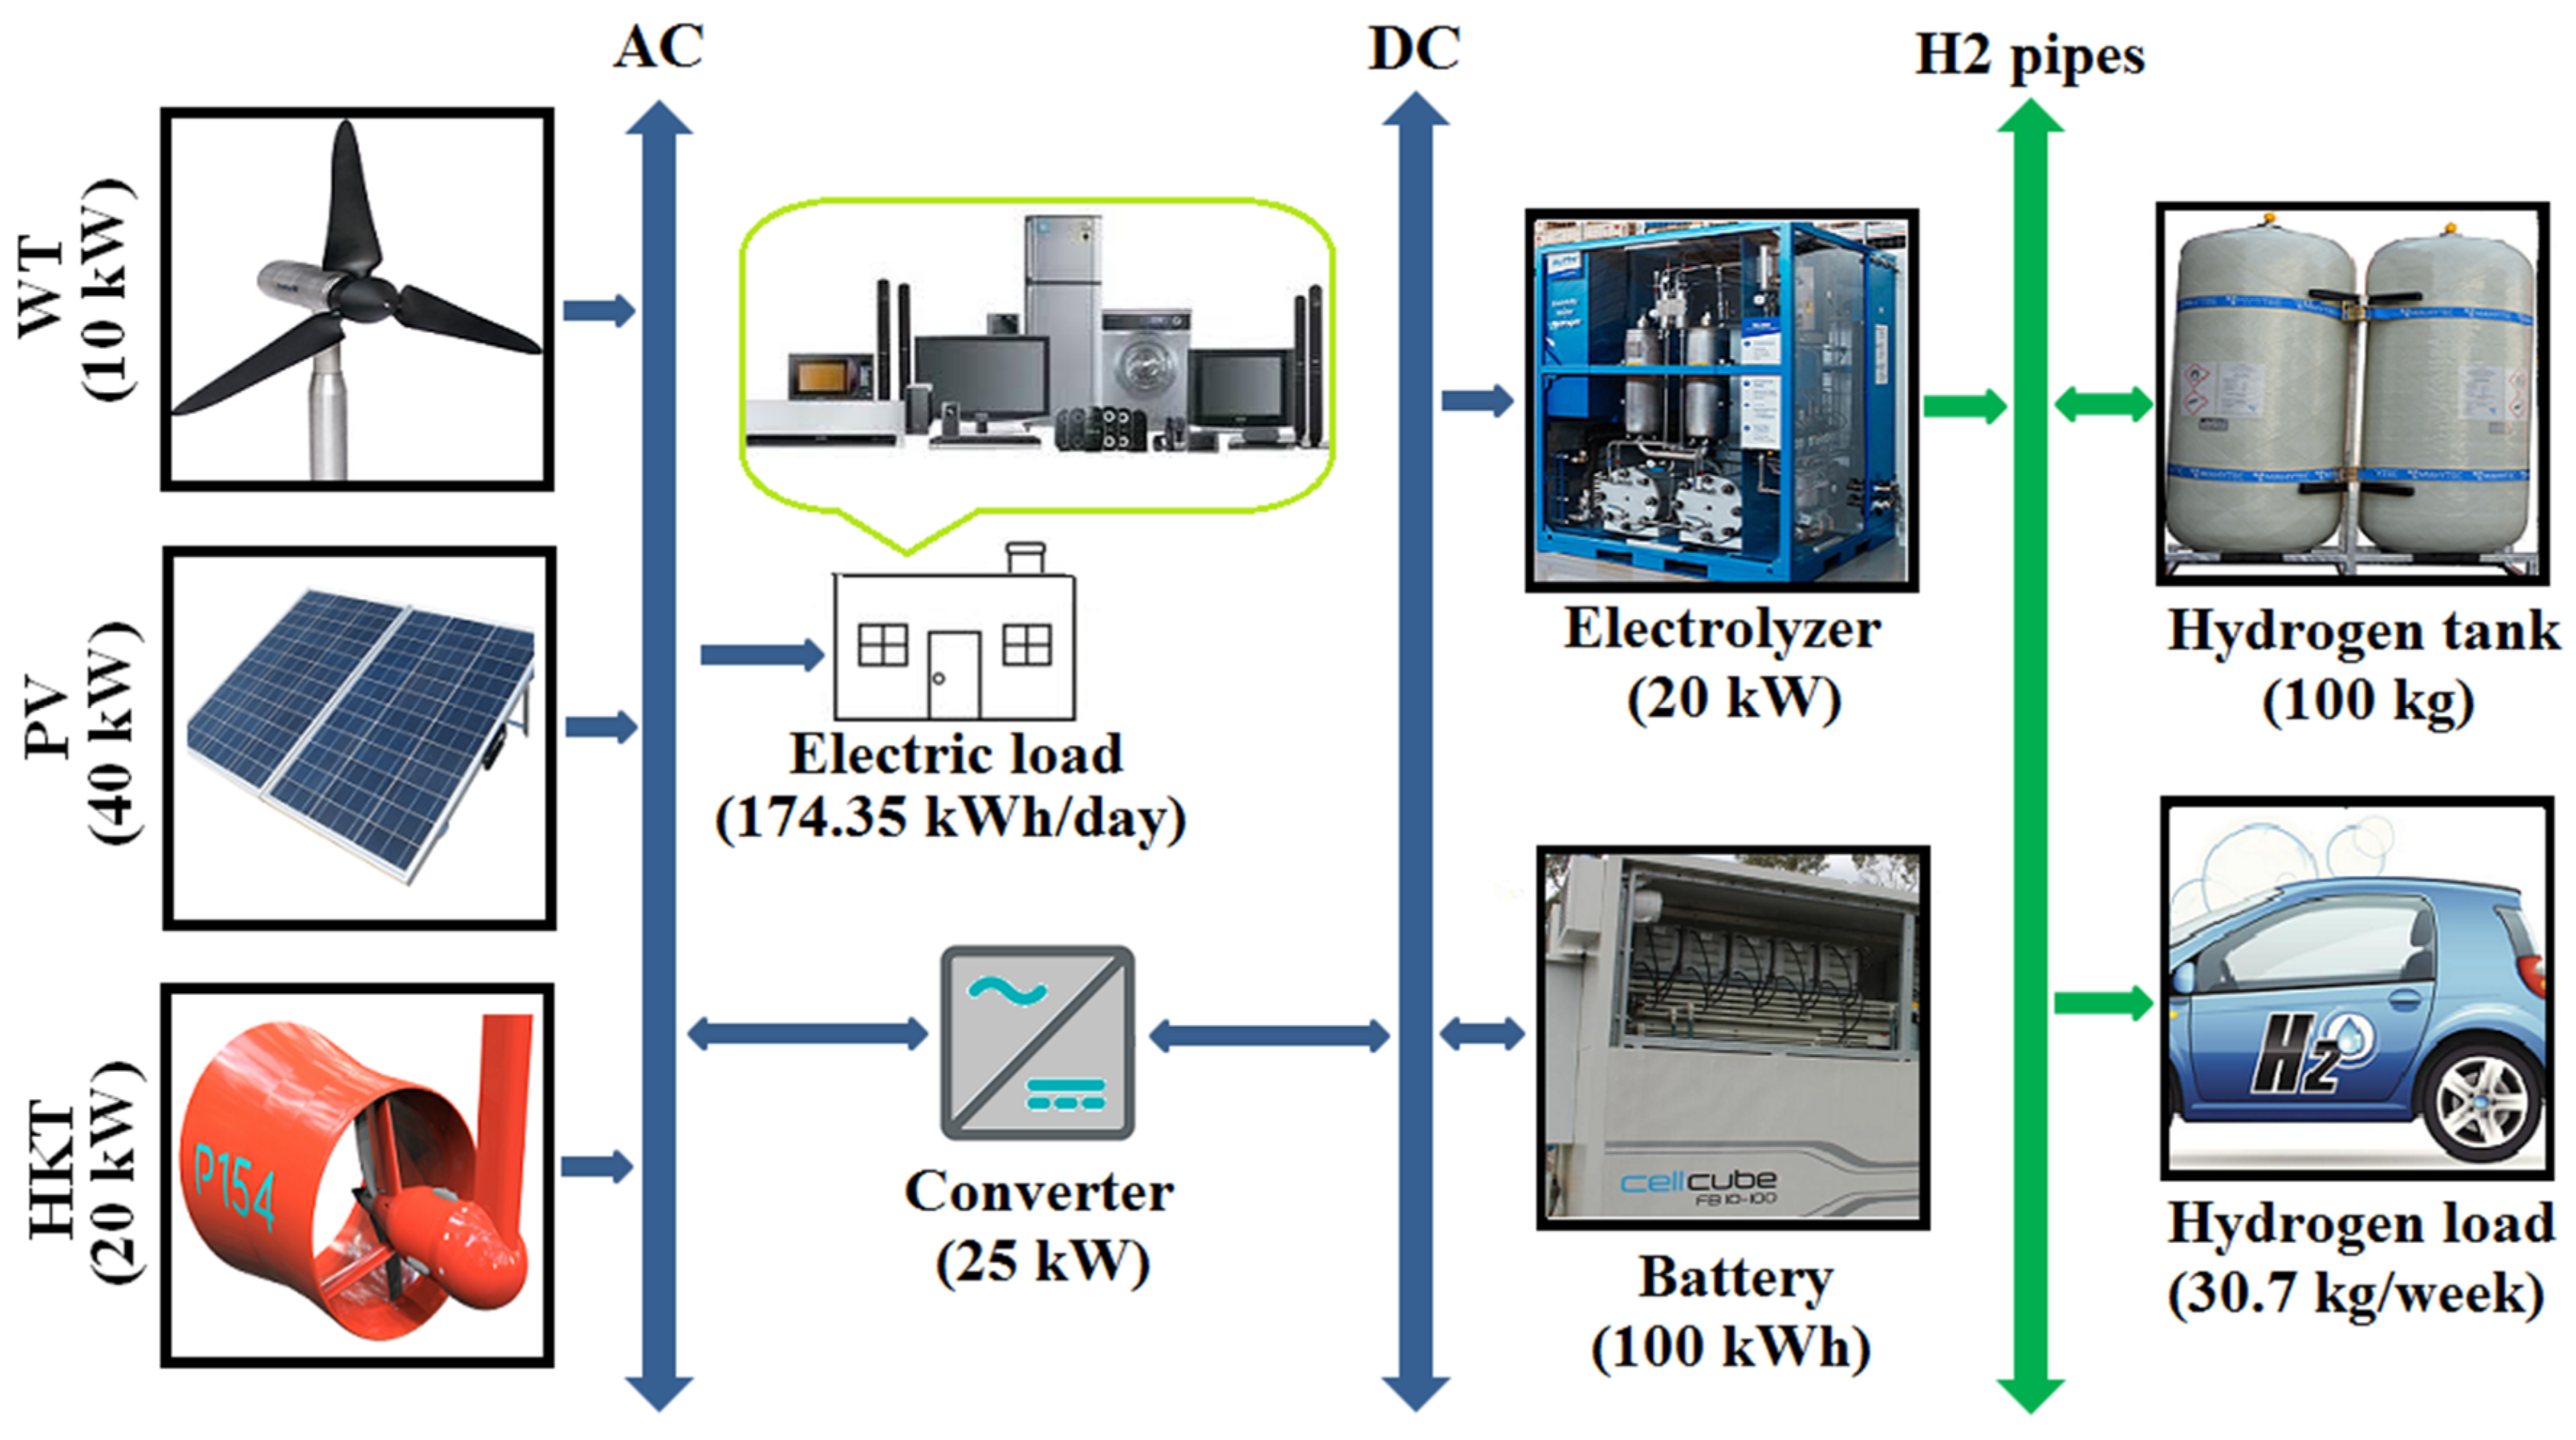
Figure 1. The location of the micro-community under study in Khuzestan province in the vicinity of Karun River.
Processes 09 01375 g001
Figure 2. The monthly and hourly electric load demand.
Processes 09 01375 g002
Figure 3. The hourly hydrogen demand on the weekends.
Processes 09 01375 g003
Figure 4. Schematic of the off-grid integrated system (WT: wind turbine, HKT: hydrokinetic turbine).
Processes 09 01375 g004
Figure 5. The mean monthly electricity generation.
Processes 09 01375 g005
Figure 6. The electrolyzer input power.
Processes 09 01375 g006
Figure 7. The hydrogen tank level.
Processes 09 01375 g007
Figure 8. The state of charge of the battery.
Processes 09 01375 g008
Figure 9. Inverter and rectifier output.
Processes 09 01375 g009
Figure 10. Annual electricity generation (kWh) when solar radiation and temperature change.
Processes 09 01375 g010
Figure 11. Annual electricity generation (kWh) when solar radiation and wind speed change.
Processes 09 01375 g011
Figure 12. Annual electricity generation (kWh) when solar radiation and water flow velocity change.
Processes 09 01375 g012
Figure 13. Annual electricity generation (kWh) when temperature and wind speed change.
Processes 09 01375 g013
Figure 14. Annual electricity generation (kWh) when temperature and water flow velocity change.
Processes 09 01375 g014
Figure 15. Annual electricity generation (kWh) when wind speed and water flow velocity change.
Processes 09 01375 g015
Figure 16. Total NPC ($) when water flow velocity, wind speed, solar radiation, and temperature fluctuate.
Processes 09 01375 g016
Table 1. Characteristics of the components of the proposed system.
ComponentSize/NumberLifetime (yr)Capital CostReplacement CostOM CostOther Specifications
Wind turbine10 (kW)202000 ($/kW)1200 ($/kW)100 ($/kW/yr)Electrical bus: AC
Hub height: 16 m
Rotor diameter: 15.8 m
Cut-in wind velocity: 2.75 m/s
Cut-out wind velocity: 20 m/s
PV system40 (kW)251300 ($/kW)1300 ($/kW)20 ($/kW/yr)Electrical bus: AC
Derating (reduction) factor: 96%
Temperature coefficient: −0.41% / ° C
operating temperature: 45 ° C
Efficiency at standard test conditions: 17.3%
Ground reflectance: 20%
Tracking system: no tacking
Hydrokinetic turbine20 (kW)2035,000 ($/#)21,000 ($/#)1200 ($/#/yr)Electrical bus: AC
Size: 2.3 m × 3 m
Weight: 750 kg
Rotor diameter: 1.54 m
Water depth required: 3 m
Converter25 (kW)10300 ($/kW)300 ($/kW)0Rectifier efficiency: 94%
Inverter efficiency: 96%
Rectifier relative capacity: 80%
Battery1(#)2012,000 ($/#)12,000 ($/#)20 ($/yr)Type: vanadium redox flow battery
Throughput: 876,000 kWh
Nominal Voltage: 48 V
Nominal Capacity: 100 kWh
Roundtrip efficiency: 64%
Maximum charge current: 200 (A)
Maximum discharge current: 313 (A)
Initial state of charge: 100%
Electrolyzer20 (kW)152000 ($/kW)2000 ($/kW)50 ($/kW/yr)Electrical bus: DC
Efficiency: 85%
Hydrogen Tank100 (kg)25300 ($/kg)300 ($/kg)0 Initial tank level: 0
Other assumptions: nominal discount rate in Iran: 10%; expected inflation rate in the years to come in Iran: 18%; project lifetime: 20 years.
Table 2. NPC of components and the system in general.
ComponentCapital ($)Replacement ($)OM ($)Salvage ($)Total ($)
Wind turbine20,000045,309065,309
PV system52,000036,247−42,34745,900
Hydrokinetic turbine35,000054,371089,371
Converter750015,1340022,634
Battery12,0000906012,906
Electrolyzer40,000114,65745,309−108,58191,385
Hydrogen Tank30,00000−24,4315569
System196,500129,791182,142−175,359333,074
Table 3. Size of components, NPC, LCOE, and LCOH of systems with one or two sources.
System PV (kW)WT (#)HKT (#)NPC ($)LCOE ($/kWh)LCOH ($/kg)
Single source003400,6070.13894.82
Single source070589,6570.22308.27
Double source012376,5450.13064.95
Double source031417,7920.14545.53
Double source4002357,1360.12394.10
Double source19801449,0720.15586.37
Double source4040439,6310.15475.74
Double source15720443,2720.15516.29
Publisher’s Note: MDPI stays neutral with regard to jurisdictional claims in published maps and institutional affiliations.

