1. Introduction
The current market of microalgae is growing fast in recent years and the microalgae culture systems require not only improved microorganisms but also significant improvements in process and equipment to support the increased microalgal biomass demand. The core of the microalgal metabolism is the photosynthesis process converting light and carbon dioxide to chemical energy and new biomass. Therefore, efficient light to biomass conversion in photobioreactors (PBRs) is crucial for economically feasible microalgae production processes. Currently, microalgae are cultivated in open ponds and closed photobioreactors [
1]. The design of photobioreactors is selected to maximize the so-called light-to-biomass yield. For this reason, the main guidelines to design the cultivation system suggest having high surface to volume ratio and many geometries have been proposed in laboratory and pilot investigations: tubular photobioreactor, flat panel, bubble column and airlift, and more advanced configurations [
2] Besides that, after Kok’s seminal work suggesting that photosynthesis is enhanced by flashing light regimes [
3,
4], a much research was done aimed at assessing whether flashing light actually increases the overall efficiency of the photosynthesis in ‘model’ conditions [
5], assessing the role of photosystem damage, repair, and thermal dissipation in lowering the achievable photosystem efficiency [
6,
7,
8], establishing whether these benefits actually translate into an improved biomass growth rate in actual photobioreactors, and devising how the flashing light effect can be exploited in existing and novel equipment [
9]. Recently, with the aim of producing hydrodynamically induced light/dark cycles and improving mass transfer, Torzillo et al. [
10] proposed a novel cascade photobioreactor featuring a thin liquid layer flowing along a sloping, wavy bottomed surface. This system was characterized both experimentally and computationally [
11,
12] and for some operating conditions, it seems to be characterized by a particular fluid dynamics structure that can provide the flashing light regime by rapid mixing of microalgal suspension.
The metabolic network involved in the photosynthesis is described by complex kinetic models. They become even more complex when the dynamics of the irradiance experienced by the microalgal cell is considered. The mathematical models of the photosynthesis available in the literature are based on lumping many biochemical reactions into simple steps [
13,
14,
15,
16,
17,
18,
19,
20,
21,
22]. Many models are based on the concept of the photosynthetic unit (PSU). The main hypothesis is that the PSU has a manifold of states that depend on the photon flux, and only few simple steps are considered to approximate the photosynthesis process: light-capture, photochemical and nonphotochemical quenching, photoinhibition, and PSU repairing. Most of them are triggered by the actual exposition of the PSU to the light, which is affected by (1) light field throughout the liquid culture and (2) the hydrodynamic of the microalgal cells. The light decays inside the photobioreactor depending on several phenomena, such as reflection, refraction, and absorption on the microalgal cells [
23,
24,
25]. Instead, the hydrodynamics tends to move the microalgal cell between light and dark zones. Photobioreactor hydrodynamic is a function of its design and of the adopted operating conditions [
26,
27].
The development of simulation tools capable of providing quantitative predictions for PBR performance could contribute to improving PBR designs, and it could also support process scale-up. However, cell functioning depends on many conditions in its microenvironment, such as light availability, temperature, nutrient concentration, and shear stress. This multifactor dependence makes the simulation of PBRs complicated compared to that of ordinary chemical reactors. Although PBR models with sufficient predictive ability for reactor design do not currently exist, progress towards this goal has occurred in recent years and many authors have indicated the importance of these tools [
28,
29,
30,
31,
32,
33,
34,
35,
36,
37].
As light delivery is usually the most important factor in the performance of PBRs, an important feature of any photosynthetic model is the ability to account for strong light gradients in space and time and the relevant light/dark cycles.
The experimental investigations aimed at quantifying the photosynthesis promotion warranted by flashing light were carried out on a laboratory scale, either in dilute culture under artificial light flashing precisely controlled both in frequency and duty cycle [
5], or in the target photobioreactors operated at a biomass concentration that is appropriate for the geometry and installation conditions under continuous illumination [
38]. Performance is generally established based on biomass production or photosynthetic activity. While in the former case the time history of perceived irradiance is known, being independent of microalgae position and depending solely on the installed light generation and control apparatus, in the latter case it is not, because perceived irradiance is the combined effect of a complicate (and possibly nonstationary) radiative field and of fluid dynamics, which is seldom known with sufficient detail.
In this article, we postulate that an intermediate quantity could be considered in assessing the relationship between process design and existing and ongoing experimental research on the flashing light effect, and that this quantity is the frequency spectrum of the variation of perceived irradiance with time. Apparently, this method of characterizing flashing performance of photobioreactor hydrodynamics has never been used in the literature. To calculate this time-varying quantity, we developed and utilized a model that couples a radiation transport model and hydrodynamic transport; thereafter we analyzed spectrally the calculated quantity.
The dynamics of a microalgal cell inside the system was described according to the gas–liquid flow within the reactor. The flow field was simulated by Computational Fluid Dynamics (CFD). A random walk model developed in MATLAB® (MATLAB 2020a, The MathWorks, Natick, MA, USA, 2020) was adopted for the microalgal cells to assess the irradiance experienced by the cells in the wavy-bottomed photobioreactor. The spectral characteristics of the perceived irradiance inside the circulating cultural suspension were then calculated and compared to those prevailing in common commercial bubbled photobioreactors (i.e., flat panels and bubble columns). The aim was to assess whether the convective circulation determined by the specific geometry of the analyzed photobioreactor place it apart with respect to potential toward benefitting from light flashing effects.
2. Materials and Methods
2.1. General Model Equations
The proposed model describes the interaction of microalgal cells with the light illuminating an inclined wavy-bottomed photobioreactor.
It should be noted that the model presented is not aimed at estimating productivity, for which a reliable and fully predictive model of the PSUs would be required, but rather at capturing the spectral features of the temporal variations of irradiance due to hydrodynamics. Those variations occur on a time scale that is significantly shorter than those of sunlight hitting the PBR. The basic underlying hypothesis is (a) that the PBR is held at constant temperature and (b) that light hits the photo bioreactor from a direction that is normal to the horizontal plane, and does not vary over time either in intensity or angle. Since the liquid surface is horizontal for greater than two-thirds of its total extent [
11], refraction effects were therefore neglected along with any ‘locally periodic’ light beams concentration and rarefaction effects—(c) that the concentration of microalgae biomass is held constant and (d) that the varying spectral quality of the perceived irradiance is neglected.
This section describes the submodels used to characterize the fluid hydrodynamics, cell trajectories, and radiation transport.
2.1.1. Hydrodynamic Transport Model
The core of the simulation carried out by CFD relies on the solution of the equations that govern the fluid motion. This process is divided into two steps. First, the equations are converted from partial differential equations (PDE). Second, the region of interest is divided in a certain number of finite cells and the abovementioned algebraic system is numerically solved in each cell of the domain. In this way, the values of the transport variables (velocity vectors, pressure, etc.) in defined positions of the domain (such as the cell center) are obtained. The fundamental equations that govern the fluid dynamics are the analytical expression of three important physical principles: conservation of mass, conservation of linear momentum (also known as Newton’s second law of motion), and conservation of energy (also known as the first law of thermodynamics).
Mass continuity (conservation of mass): The rate of change of fluid mass inside a control volume must be equal to the net rate of fluid flow into the volume. This statement can be translated into the differential form of the continuity equation:
where
is the fluid density,
is the flow velocity vector, and
is time. The first term of the above expression is the rate of increase of mass within the volume, whereas the second term is the mass convected into the system.
Conservation of momentum: This statement claims that any change in momentum of the fluid within the control volume will be due to the net flow of momentum into the volume and the action of external forces acting on the fluid within the volume. It comes from Newton’s second law of motion applied to a control volume:
where
is the total force (sum of surface and body forces) acting on the control volume and
is the pressure on the volume’s surfaces.
For a Newtonian, incompressible (
constant) fluid, flowing in an isothermal system, the equations of mass continuity and conservation of momentum become:
where
is the dynamic viscosity and
is the standard gravity. This form of the conservation of momentum equation is called the Navier–Stokes equation and governs both the laminar and turbulent flows in a system.
2.1.2. Random Walk Scheme
In the present study, the microalgal displacement in the inclined wavy-bottomed photobioreactor was described by adopting a random walk according to the Langevin scheme [
39]. The Lagrangian tracking of particles in a turbulent flow with the random walk scheme has been previously reported in literature [
40,
41,
42]. The main hypotheses used in this method were (i) no microalgal effects on the turbulence of the fluid flow and (ii) passive motion of the microalgae with respect to the liquid flow. Both hypotheses rely on the fact that the microalgae are typically characterized by a low difference of density compared to the liquid phase, low volumetric concentration, and negligible swimming velocity, in comparison with the turbulence field [
39].
The microalgal trajectory was simulated according to the random walk. The turbulent behavior of the two-phase gas–liquid flow was characterized in terms of statistical data—the velocity variance (
v’), the Lagrangian integral time scale (
TL), and the turbulent dispersion (
DT)—referred to as three component
x,y,z by processing the assessed field of velocity—
vi(
x,y,z,t). The Langevin scheme [
29,
39] was implemented in a code developed by MATLAB
®. The velocity (
ux,
uy,
uz) and the position (
x,y,z) of a microalgal cell was calculated as a function of the time
t according to Equations (5) and (6):
where (
ξx, ξy, ξz) is a Wiener isotropic process.
2.1.3. Radiation Transport Model
The Lambert–Beer law is employed to simulate the light distribution. The Lambert–Beer law, which can be easily derived from the general radiative transport equation, claims that the instantaneous level of irradiance on the tracked algal cell can be calculated as:
where
is the incident photon flux,
is the instantaneous microalgal depth inside the inclined wavy-bottomed photobioreactor,
is the biomass concentration, and
is the dry weight specific absorption coefficient. Vejrazka et al. [
43] reported that for
Chlamydomonas reinhardtii,
ranges between
, depending on the irradiance strategy (continuous vs. intermittent). Some of the restrictive assumptions implicit in Equation (7) include neglecting wavelength dependence (monochromatic light), travel of light in a single direction (collimated light), homogeneous semitransparent medium, and absence of light scattering. Although these are relatively strong assumptions, they can be considered as a valid hypothesis especially in the range of the operating conditions considered for the photobioreactor.
2.2. Numerical Simulation of the Recirculated Wavy-Bottomed Photobioreactor
The velocity field within the photobioreactor was computed with numerical methods. It should be emphasized that the PBR hydrodynamics depends on its design and operating conditions (single-phase/two-phase, laminar/turbulent flow, gas and liquid flow rate, etc.). The incorporation of multiphase computational fluid dynamics simulations in the analysis of PBR is becoming widespread because it provides insight into the specific role of hydrodynamics in overall PBR performance. CFD allows simulation of the dynamic behavior of the fluids in complex physical problems by numerical processing of mathematical models describing their evolution in time. In this way, the fluid velocity fields inside the system and thus the cells trajectories may be determined.
The commercial software ANSYS FLUENT
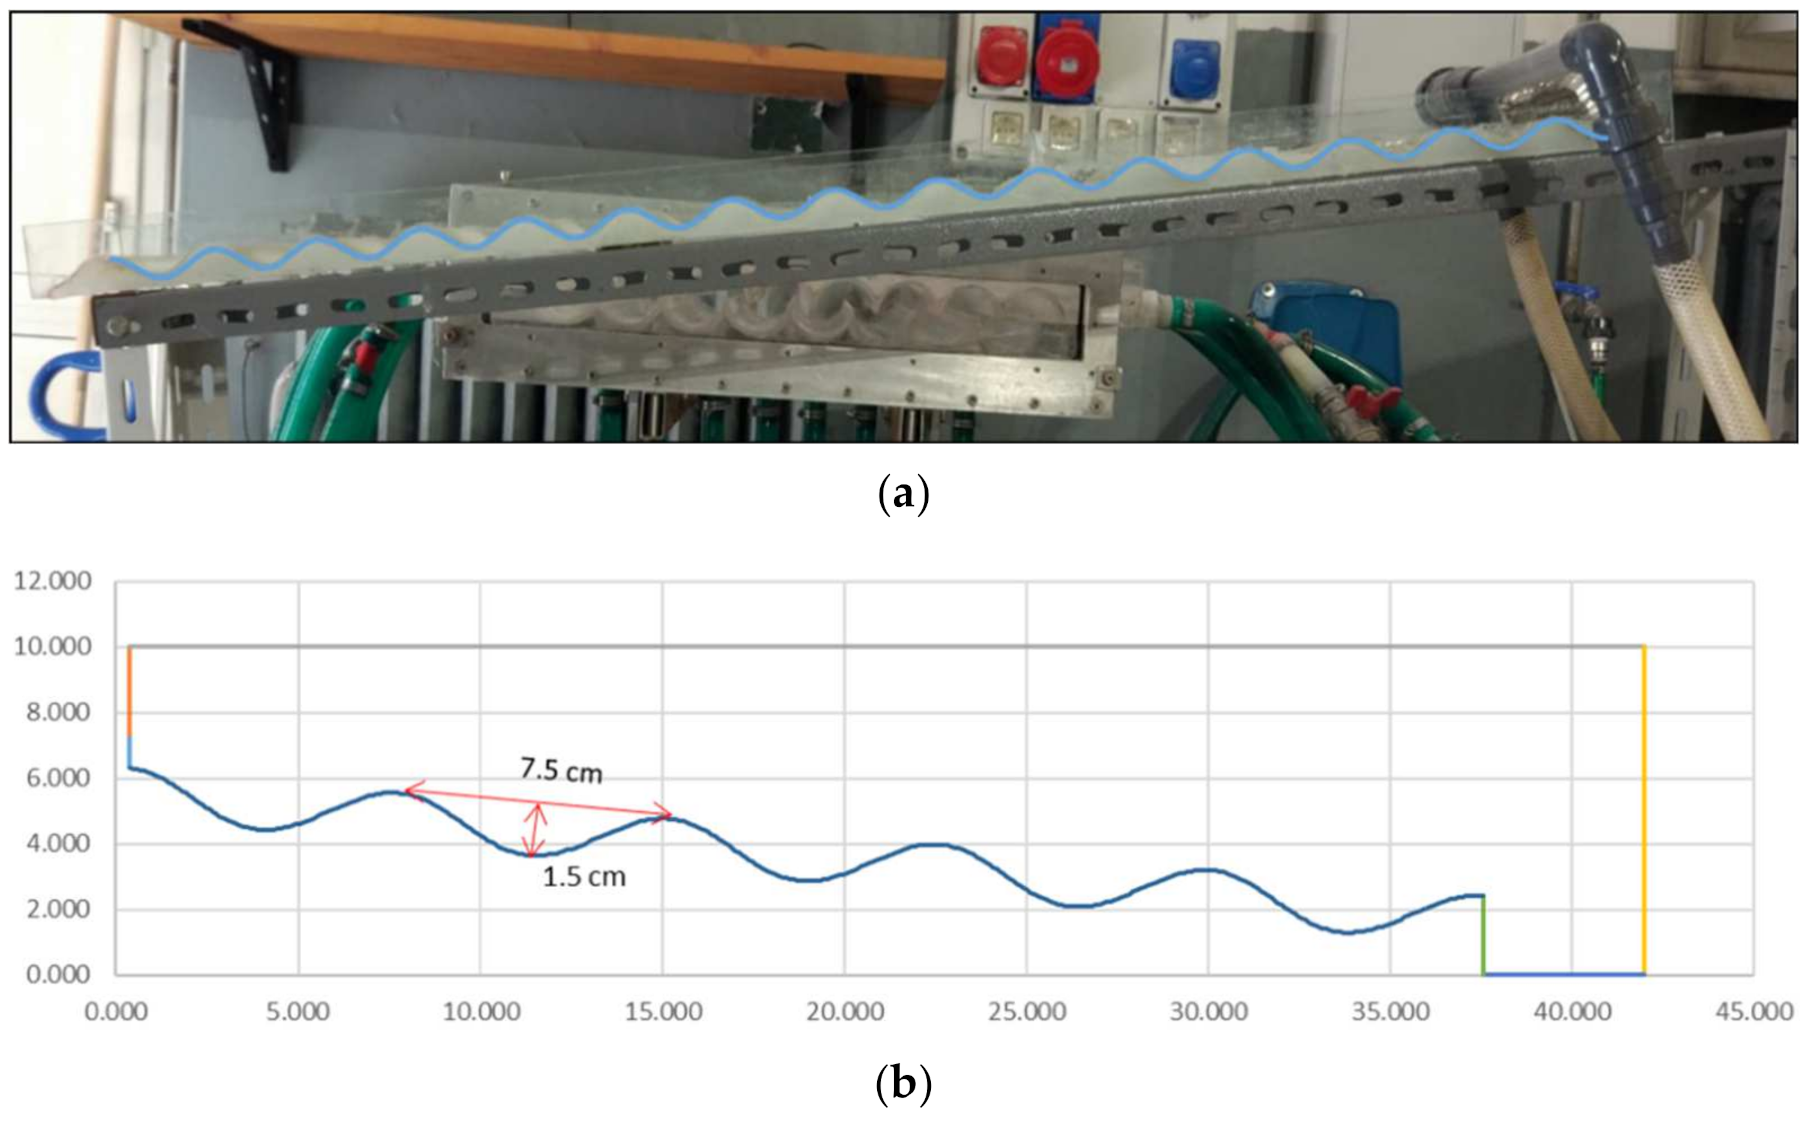
® (Ansys Inc., Canonsburg, PA, USA) was used to solve the Navier–Stokes equations and the additional transport equations required to represent the effect of turbulence. The numerical model was validated via experimental data. The core of the experimental setup was one 120 cm long waved surface, inclined with respect to the horizontal plane of an angle of 6°. The waved surface comprises 15 complete vanes with a wavelength of 7.5 cm, a depth of 1.5 cm, and a width of 15 cm (see
Figure 1a). Considering the channel geometry and the feeding condition, the flow was assumed mainly two dimensional. The first step of an analysis performed with CFD is the designation of the area affected by the fluid motion, i.e., the definition of the model geometry (computational domain). Hence, the bottom shape was simulated with a sine curve with the same characteristics of the experimental setup (wavelength of 7.5 cm and depth of 1.5 cm). To limit the computational burden in the CFD simulation, a 5-vane channel was implemented (see
Figure 1b). The second step was the division of this domain in a finite number of elements (called cells), each of which can be considered as a distinct control volume wherein the equations governing the fluid motion (in the form of a discrete system) are solved. Values of the transport variables (velocity, pressure, etc.) are evaluated for each cell.
Due to the geometry of the computational domain, an unstructured grid with a cell size of 0.5 mm was chosen to obtain a well-defined interface between air and water. The grid generated comprised 80,893 cells. A detailed sensitivity analysis was conducted to optimize both size and typology of the mesh. Meshes of quadrangular cells and unstructured meshes of triangular cells were tested and the final mesh features were chosen by checking the accuracy of the interface detected and the likeliness between experimental and numerical profiles [
12].
The following step of the CFD model implementation was the selection of the models required for the solution of the Navier–Stokes equations. The nonlinear Reynolds stress terms require additional modeling to close the Reynolds-averaged Navier–Stokes (RANS) equations. This has led to the creation of many different turbulence models. These models are simplified constitutive equations that predict the statistical evolution of turbulent flows. Here we chose Menter’s shear stress transport (SST) turbulence model to predict the Reynolds stress terms since it is a widely used and robust two-equation eddy-viscosity turbulence model.
The second model that must be chosen in the CFD simulation is the multiphase model for tracking and locating the free surface (or air–liquid interface) in a two-phase system. In this work, the volume of fluid (VOF) method was selected for this purpose. The VOF model is widely used when the interface dimension is significantly higher compared to the computational grid as it is in this case.
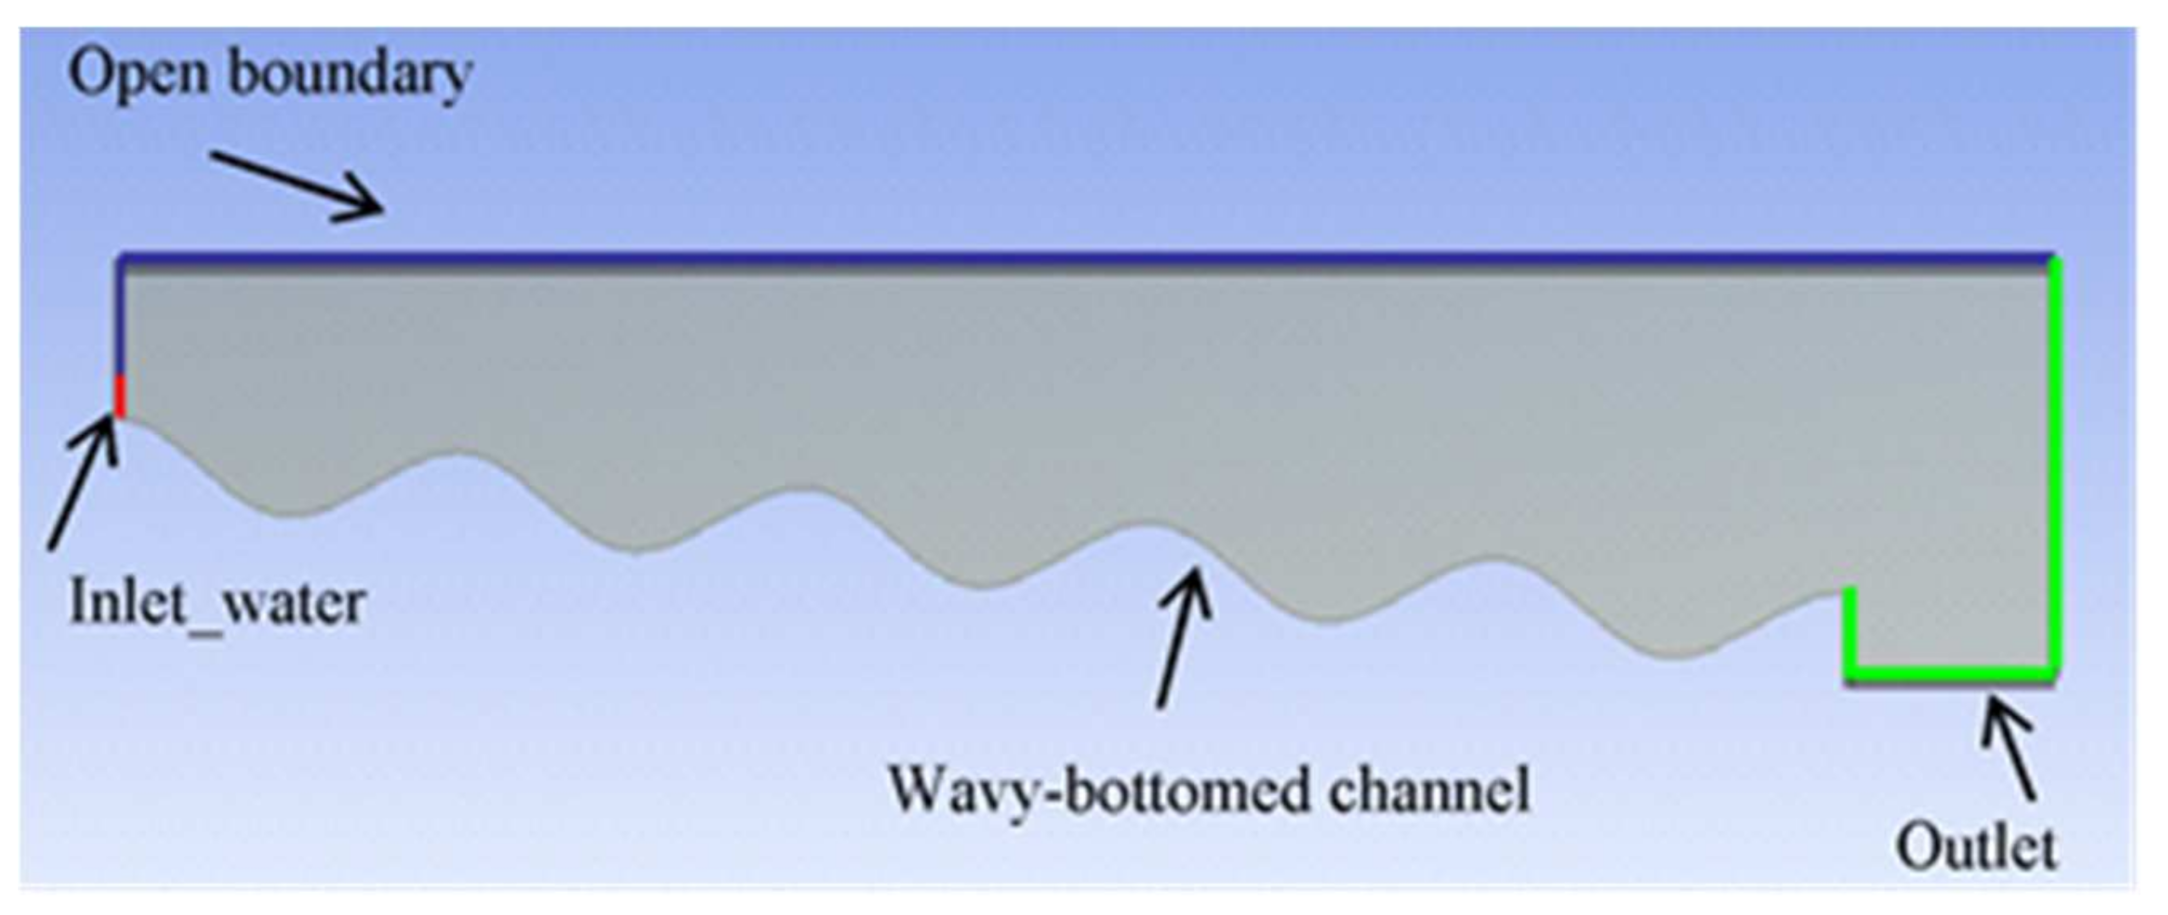
The final step of a CFD simulation is the selection of boundary conditions and numerical solution methods for the models chosen. Boundary conditions are required on all the boundaries of the solution domain to define a specific fluid flow. In the present work, water was injected in the domain through a
high aperture determining its mass flow. Referring to a 1 m wide channel, two different flow rates per unit width were investigated,
and
. Atmospheric pressure was specified at the outlet, at the boundary above the inlet, and at the top boundary. Last, the wavy-bottom channel was modeled as a no-slip wall boundary (
Figure 2).
A second-order discretization scheme was chosen for the momentum, turbulent kinetic energy, and the specific dissipation rate equations. The body force-weighted pressure discretization scheme was used because of the presence of gravity, and the ‘Geometric Reconstruction’ method was applied in sharpening the interface between air and water. The PISO algorithm was adopted as the solver because it is specifically designed for transient simulations, and a time step of s was used to keep the simulation stable. Finally, proper initial conditions implying constant water height and constant velocity were adopted because of their faster convergence to the pseudo-steady state solution and thereby also guarantee a shorter computation time.
2.3. Simulation of Algal Photobioreactors
The development of a robust and quantitatively accurate model that incorporates the complex interplay between the various physical, chemical, and biological phenomena occurring inside a PBR, is not an easy challenge. The first mandatory step is modeling the frequency spectrum of the variation of perceived irradiance with time. This was achieved in this research work by providing a radiation transport model and a hydrodynamic transport model to account for fluid mixing and the spatial distribution of the various phases: gas bubbles, liquid, and biomass. These submodels are discussed in detail in the following subsections.
2.3.1. Light Field
The light availability inside a PBR is one of the most important factors in determining the biomass productivity of the system. The light field in a PBR depends on several phenomena inside and outside the system, namely:
External phenomena, including the daily and seasonal variability of light intensity and angle of incidence due to the time of day (when sunlight is the light source) and light reflection and refraction at the PBR wall.
Internal phenomena, including light absorption, reflection, and scattering associated to the microalgae, possibly entrained air bubbles, and the PBR design.
The culture medium was assumed to be perfectly transparent, and opacity of the microalgae suspension assumed to be due only to the presence of the suspended microalgae. No gas entrainment was observed experimentally by the authors at the adopted flow rates, which ruled out any scattering effect due to air bubbles. The simplest and most widely adopted approach to describe the internal phenomena is to employ a light exponential decay relationship characterized by the decay coefficient
K. The coefficient depends on the light path (
LP), the dry weight specific absorption coefficient (
), and the biomass concentration (
X), according to the following equation:
where
and
are the irradiance levels at the inner side of the wall and at a LP distance from the wall,
the spectrophotometric true absorbance at the wavelength λ, and 2.303 the decimal/natural logarithm base conversion factor. This approximated law entails some restrictive assumptions (and notably the assumption that multiple scattering is irrelevant) but avoids solving a complex three-dimensional radiation transport equation, which considers all the phenomena noted above that should be otherwise implemented.
2.3.2. Cell Trajectories
The cell trajectory within the photobioreactor is affected by the PBR hydrodynamics. It should be noted that microalgal suspensions are Newtonian and near water-like-thin, far beyond the concentration that is assumed for this work, as both literature [
44] and the authors’ own unpublished data confirm (8 g/L of the small-coenobia-forming
S. dimorphus microalga warrant a ~10% increase of viscosity). Therefore, the suspension was assumed to behave as a Newtonian liquid with viscosity equal to that of water. The fluid velocity fields inside the system can be used to reconstruct the cells trajectories. Several authors proposed different models that couple photosynthesis kinetics, light intensity field, and photobioreactor hydrodynamics. Models differ for numerical and theoretical approaches and include circulation-time approach (where the flow patterns and thus the cell trajectories are presumed a priori) [
29,
45], Lagrangian approach [
30], and Eulerian approach [
46]. The latter two involve the use of CFD whereas in the first case it is not necessary.
The concept that underpins the Lagrangian approach is to focus on a single microalgal cell, to follow its trajectory, and to record its irradiance history over a sufficiently long time to acquire a statistically significant representation of the PBR. The Lagrangian approach was used here because it can be directly coupled to a photosynthetic model.
3. Results
The wavy-bottomed photobioreactor light regime was simulated for 1800 s to ensure that each zone of it had been reached by microalgae.
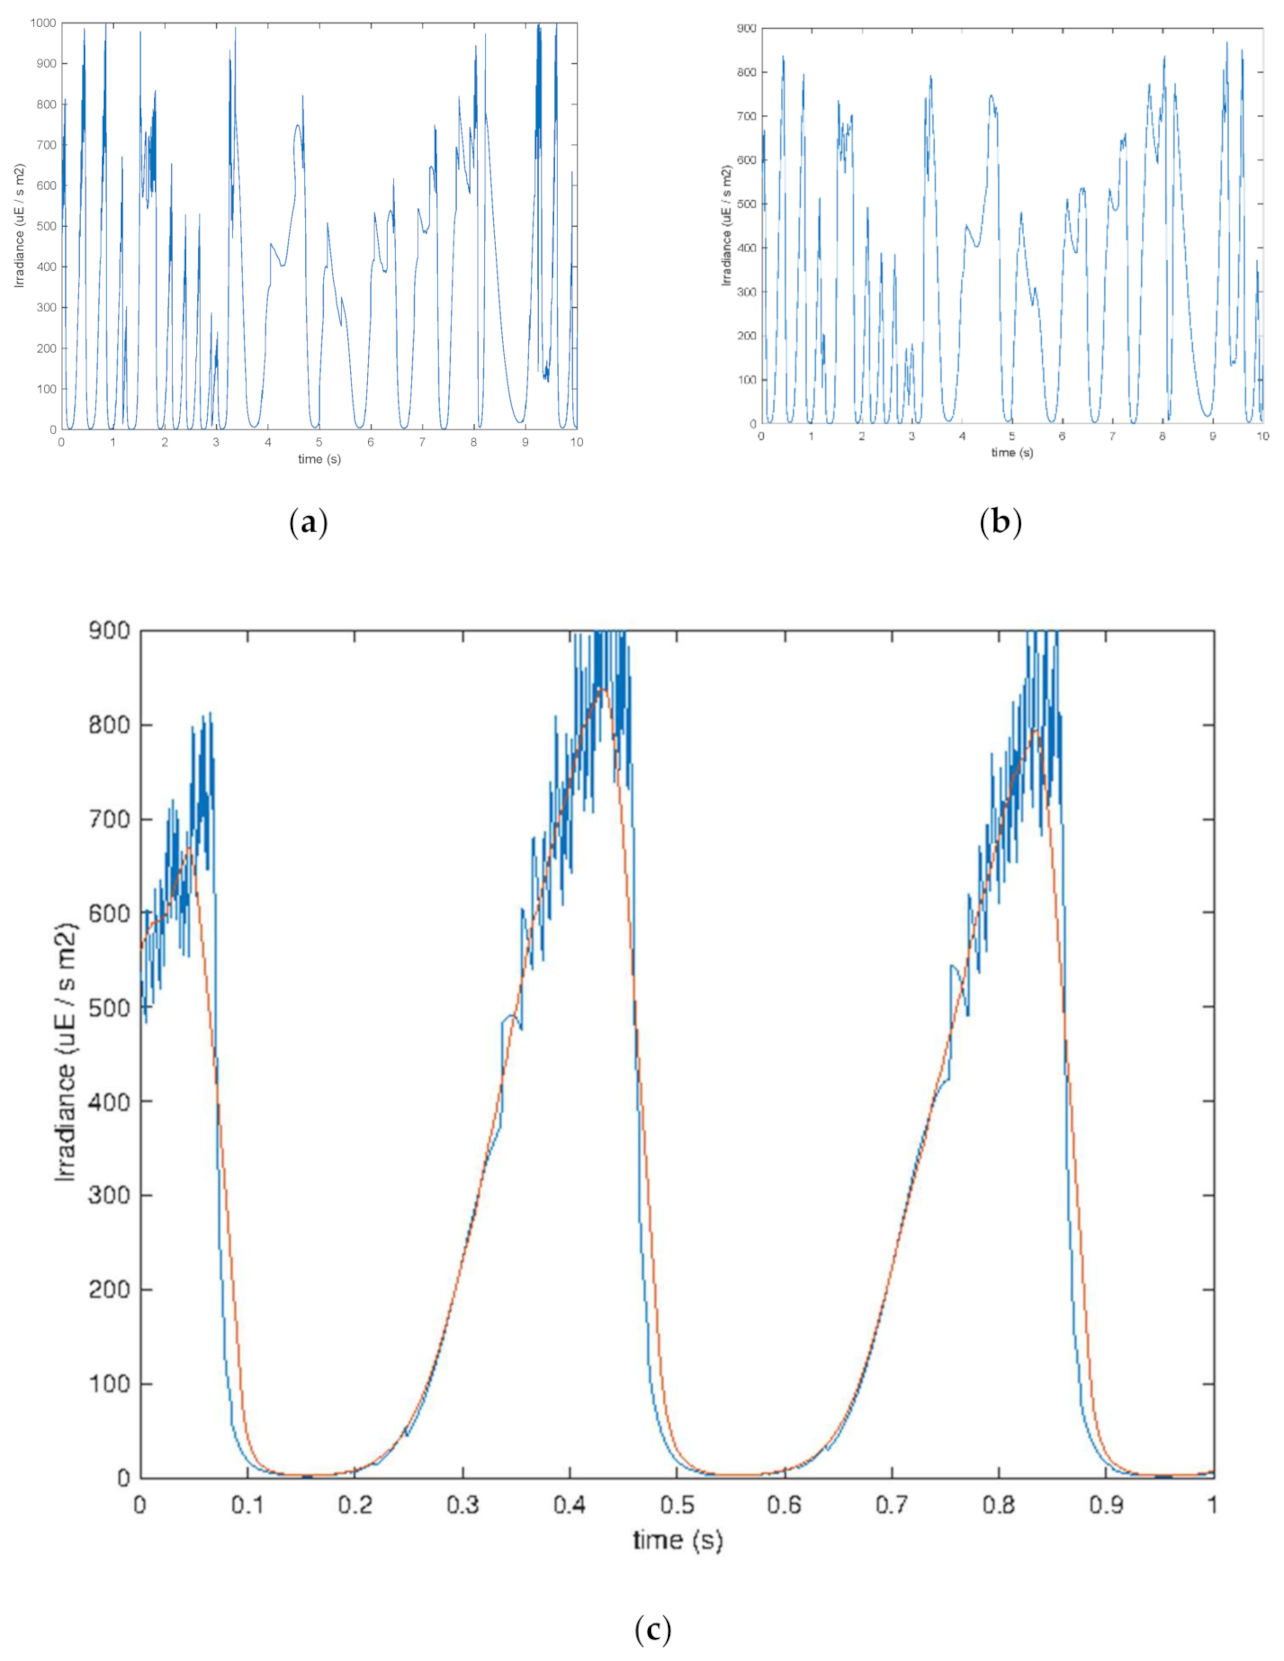
The time history of the perceived irradiance was recorded with a 1 ms cadence (i.e., 1000 Hz). A representative 10 s long excerpt of it is shown in
Figure 3a. As it can be seen, the irradiance profile shows a fine serration, particularly at high radiance values. This is an artifact originated by the algorithm managing the reflection of microalgae cells in the vicinity of the liquid–gas boundary as an effect of the random walk algorithm. Since it is not considered in the calculation of light–dark cycle frequency, it was removed while leaving the component related to the actual displacement of the microalgae intact. ‘Deterministic removal’ of small and frequent irradiance oscillations cannot be performed as it would also cut the small irradiance changes due to turbulence. To obtain this, digital filtering was applied in the form of a moving-average low-pass filter with a moving window that was 0.25 ms long. The irradiance time sequence and the filtered irradiance signal were plotted and inspected to check that a good balance of artifact rejection and preservation of the fundamental behavior of the irradiance time history had been achieved (see
Figure 3b).
Figure 3c shows the detail of the appearance of the high-irradiance part of the unfiltered time sequence and the beneficial effect of time-averaging irradiance values, which consider only fluctuations related to actual displacement of cells in the prevailing irradiance field.
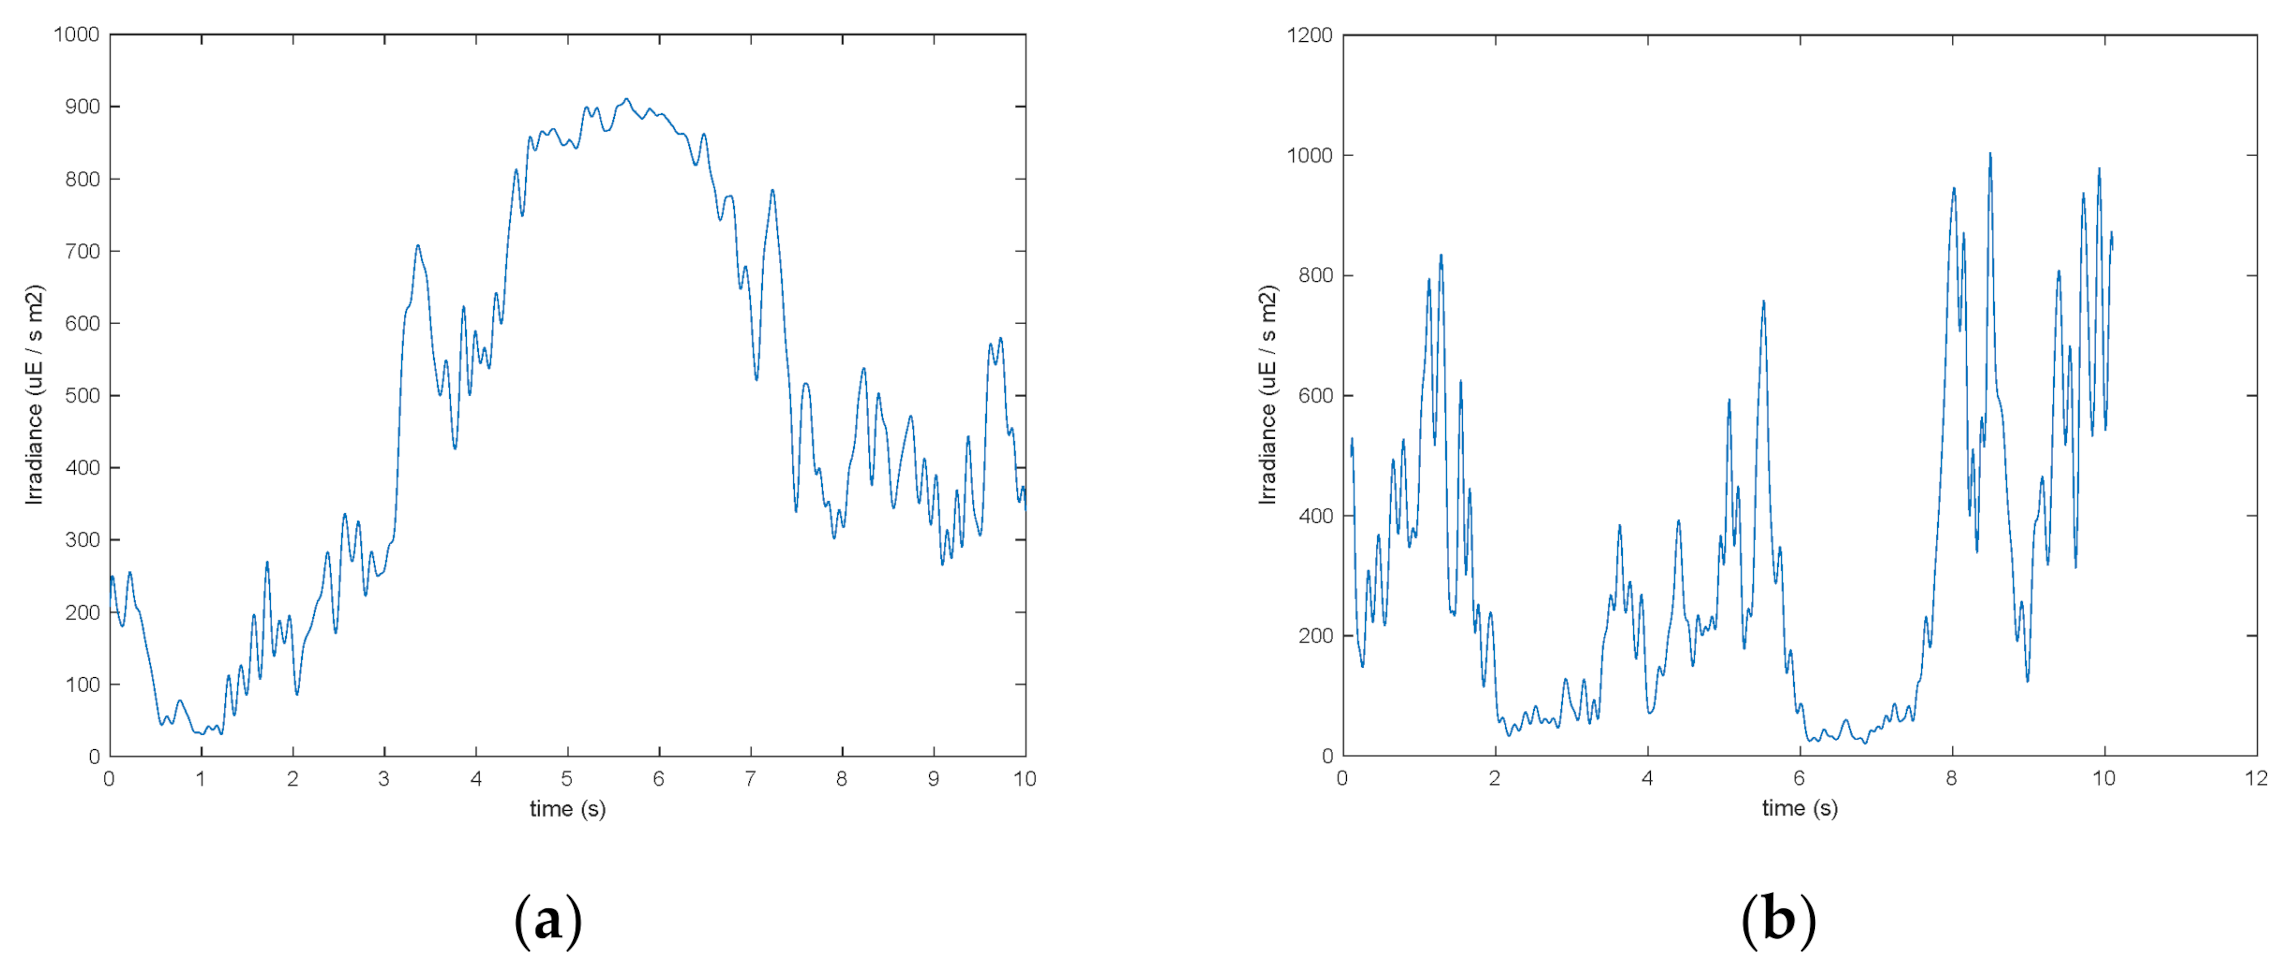
The vertical cylindrical bubble column (with internal diameter equal to 50 mm) and the vertical flat photobioreactor (with thickness equal to 20 mm) were adopted for comparison, and simulated as described by Olivieri et al. [
29]. A similar time history of the perceived irradiance was eventually obtained at a uniform 1 ms cadence, which was subjected to the same data processing adopted for the wavy-bottomed photobioreactor. Representative 10 s long excerpts of the irradiance histories of these two reference photobioreactor types are shown in
Figure 4a,b.
Subsequently, the time sequences obtained were subjected to a fast Fourier transform (FFT), thus producing a power spectrum of irradiance frequency components. It should recalled that by the application of the Fourier transform any periodic or nonperiodic signal in the time domain can be transformed into its spectral image, and for a periodic signal this implies that the fundamental sine wave-shaped harmonic making up the original signal shape appears together with the higher order harmonics that ultimately generate the actual shape of the irradiance time history. This concept holds both for regularly time-varying irradiance sequences (a rectangular wave explodes into an infinite number of harmonics of decaying amplitude), and irregularly time-varying irradiance sequences, under the only constraint that it is ‘stationary’, that is, indeed, that its spectral content does not change over time. This latter condition is well realized for irradiance time sequencies by transforming a sufficiently long time sequence (30 min).
Upon inspection, the shape of the spectrum obtained for the wavy-bottomed photobioreactor still could hardly be appreciated due to the high number of different frequency bands exhibiting markedly different power density. A clean picture of the spectrum was obtained also by applying a moving average to the frequency spectrum.
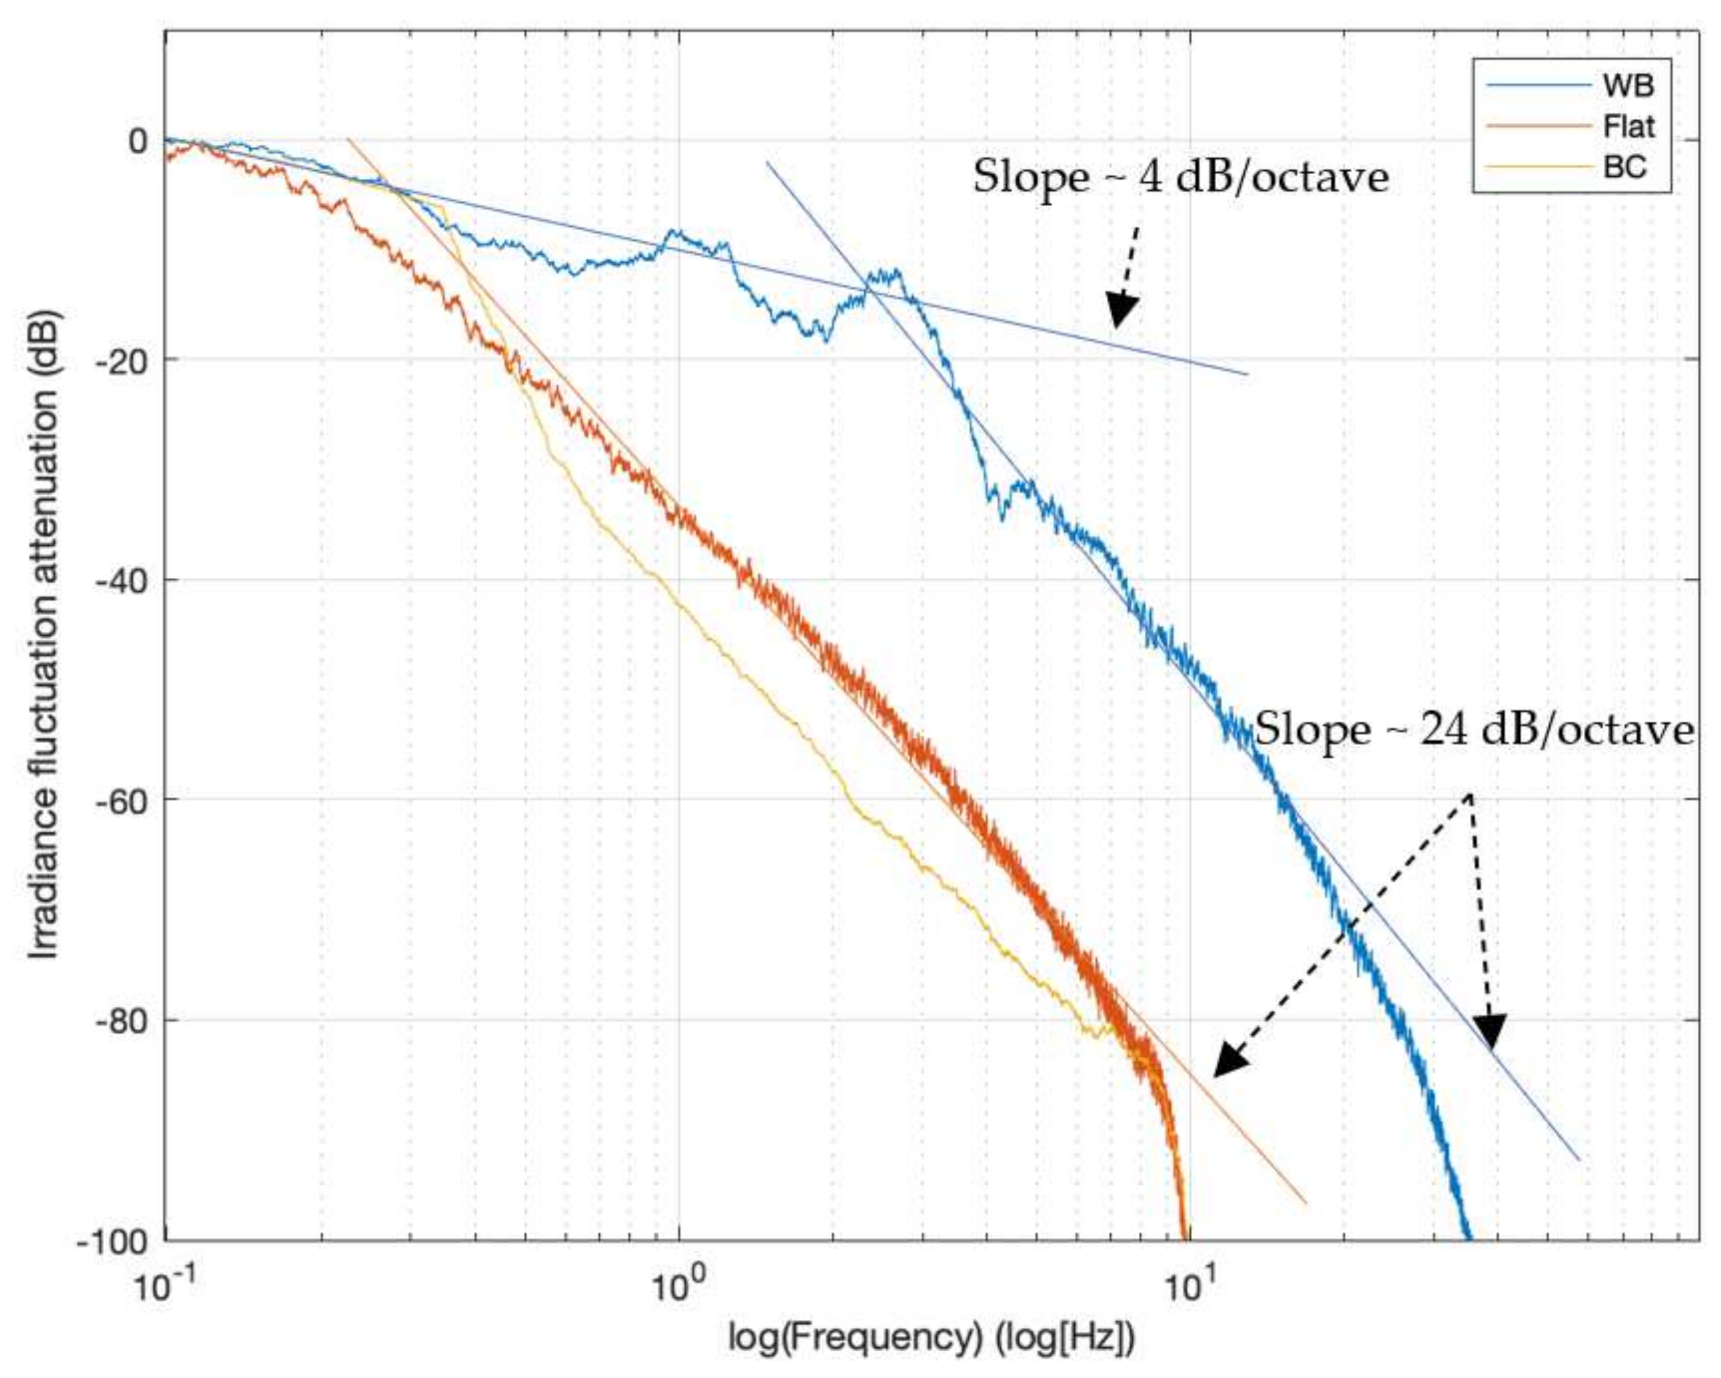
The power spectrum of the moving average-filtered hydrodynamically originated irradiance fluctuation of the wavy-bottomed PBR and of the PBR types adopted as comparison types is shown in
Figure 5. By normalizing the frequency power to the highest value across the entire spectrum and taking the decimal logarithm of this ratio, the ordinate unit is dB (decibel), as customarily done in frequency response analyses and in attenuation plots. The plot ordinate range was limited to −100 dB, which corresponds to a 1/10
10 ratio of representativeness of frequency power with respect to the most relevant frequency exhibited over the entire spectrum, so that the very low power ‘ripple’ produced by the digital filter applied to eliminate the artifacts in the time history irradiance that are not displayed in the plot.
Most experimental studies investigating the effect of light flashing have been carried out by exposing microalgal cultures to light pulses with a rectangular shape, that is, where the irradiance hitting the photobioreactor is either zero or the maximum value, and characterized normally with a maximum irradiance, a frequency, and a duty cycle (i.e., the fraction of time irradiance is at its maximal value). Therefore, it is useful to compare the dynamic excitation imparted by the irradiance fluctuation that has been applied in the studies, thereby providing definite answers concerning the potential benefits offered by light fluctuation. Among those studies, we selected those that also investigated uniform lighting conditions of the entire culture volume, that is, those using low biomass concentration [
5,
43,
47,
48]. We plotted the irradiance sequences used in those works and calculated their spectra.
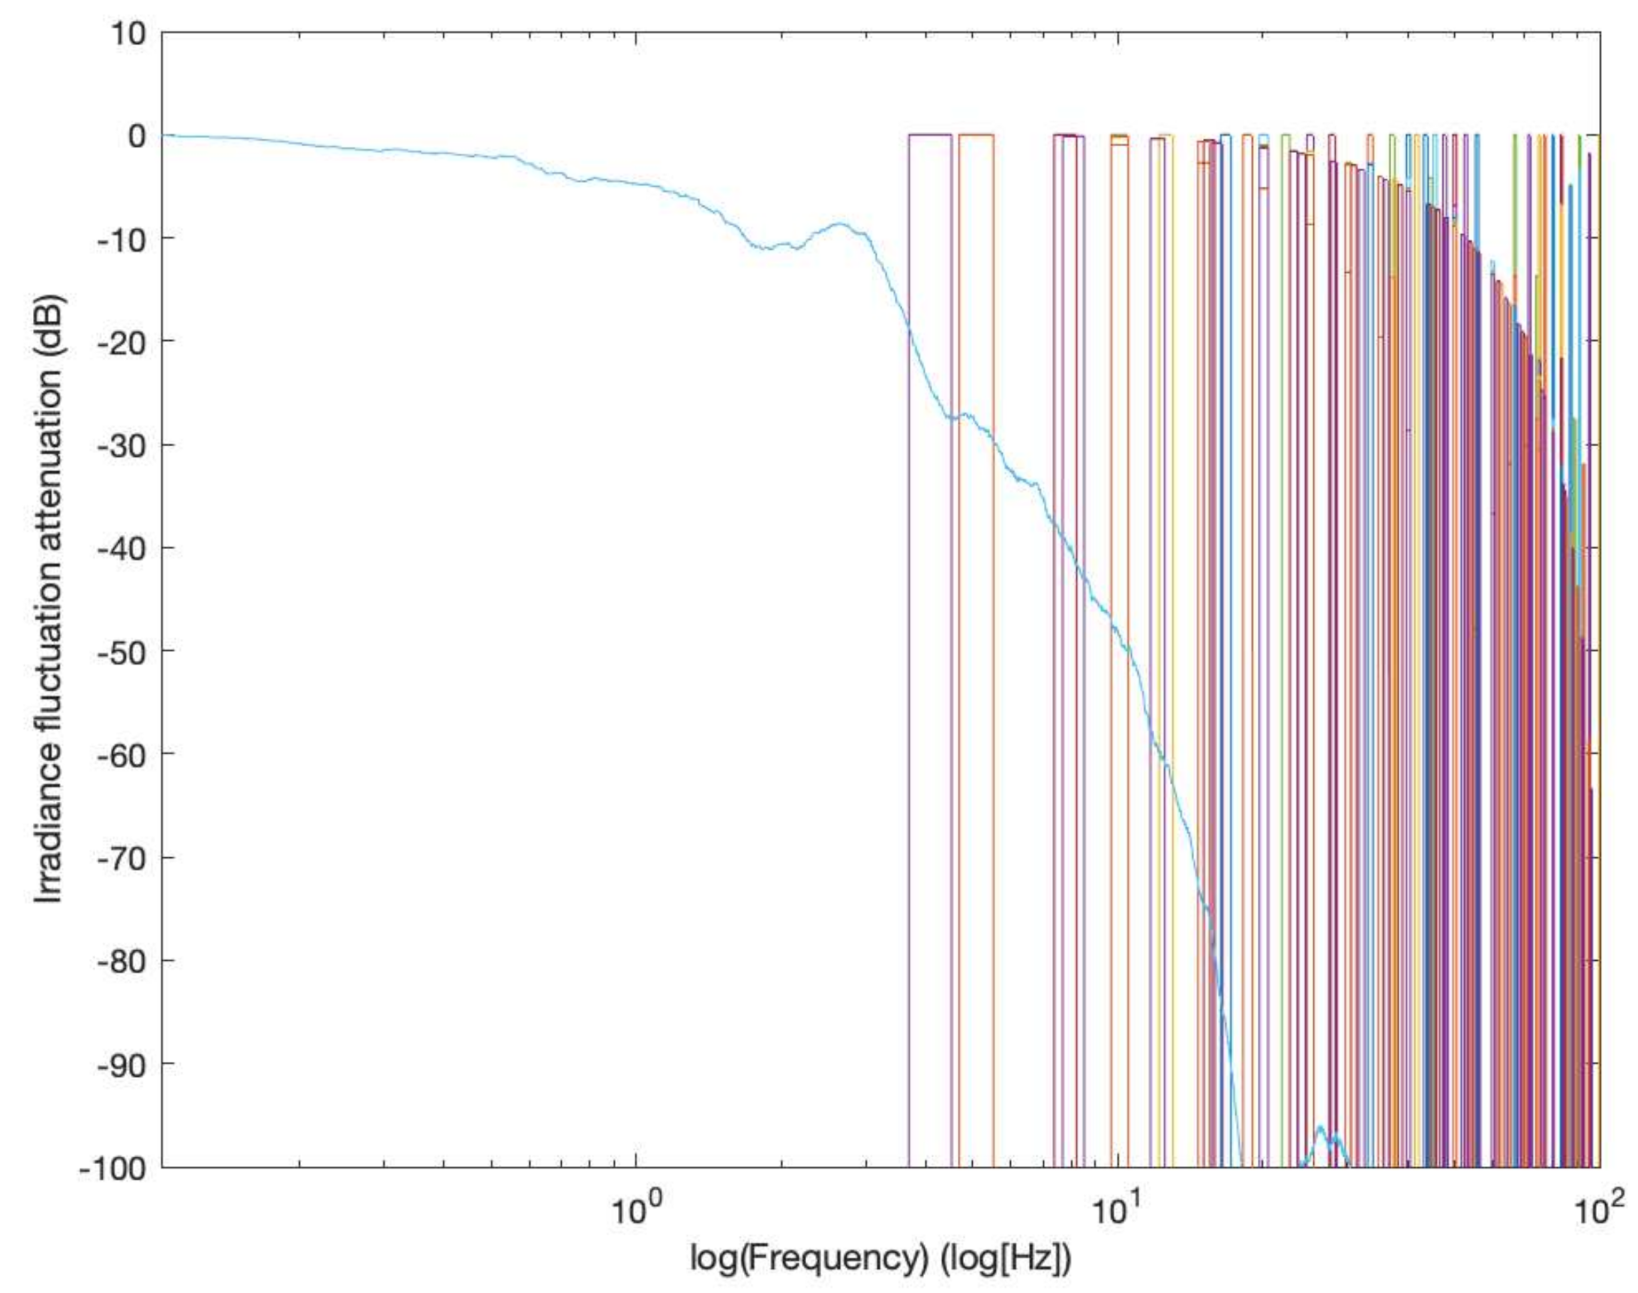
Figure 6 shows in the same plot the spectral excitation used in the experimental studies cited above together with the spectral excitation provided by the inclined wavy-bottomed photobioreactor in the test conditions.
4. Discussion
At first glance, it can be seen from the attenuation plots reported in
Figure 5 that the bubble column and the flat photobioreactor are rich in low frequency components, and that higher frequency are attenuated at a rate of about 24 dB/octave, one octave being the frequency interval spanning the duplication of frequency itself.
In contrast, the wavy-bottomed photobioreactor maintains a high amount of power until about 3 Hz, with marginal attenuation (about 4 dB/octave). Above 3 Hz, however, a similar attenuation is observed.
The attenuation curve of the wavy-bottomed stays above that of the flat photobioreactor, and the difference in attenuation of irradiance fluctuations reaches its maximum value at about 3 Hz, where it reaches about 40 dB, which means that at 3 Hz a wavy-bottomed PBR provides about 104 times the excitation energy of a similarly externally irradiated flat PBR.
The meaning of this result is apparently clear—the wavy-bottomed photobioreactor in the tested installation mode can ‘excite’ the alternance of high light and dark conditions much more than the two adopted reference photobioreactors. However, this is only possible up to a very low frequency, 3 Hz, beyond which the contribution decays rapidly as it does for the reference photobioreactors. This is equivalent to saying that only regular (i.e., convective) flow can impart an energetically significant excitation, while chaotic motion only exerts a very limited contribution.
Figure 6 offers an opportunity to qualitatively appreciate the spectral location of the exciting frequencies deployed in artificial flash experimental tests that were carried out to diagnose photosynthesis promotion, and those used in actual mixing-driven photobioreactors. As can be seen, all the frequencies that are contained in the spectral excitation provided by the experiments considered are beyond what can be warranted by the current operational mode of the wavy-bottomed photobioreactor, let alone the types of photobioreactors that rely on hydrodynamic (i.e., related to liquid motion) irradiance fluctuations based on bubbling. By recalling that the energy content of an irradiance fluctuation in the spectrum depends on its amplitude in the irradiance time history, this is not to say that these excitation modes are totally absent in the spectra of these photobioreactors, but only that they are simply not relevant from the energy point of view.
The irradiance band can be divided into three bands which, in actual photobioreactors, also characterize three different zones in their structure. Since light acts toward autotrophic microalgal biomass as a substrate but cannot be ‘homogenized in the liquid medium’ as carbon-supplying chemical species would do for heterotrophic growth, it must be continuously supplied to cells after crossing a boundary that separates the ‘irradiance pool’ from the liquid and thereafter decays in the liquid according to its absorbance. Given the law determining light decay in liquids and suspensions, irradiance decays along with the microalgal suspension thickness. Assuming a very high irradiance (for example, on the order of 1000 to 2000 μmol photons m
−2 s
−1) is hitting the device, a microalgal suspension characterized by an arbitrarily large thickness from the outside environment (from an illuminating device), irradiance will be very intense irradiance in a band close to the ‘irradiance pool’–liquid boundary (called the ‘photic zone’); then, it will drop to lower values so that the subsequent zone is called the ‘limiting light zone’. At a larger distance, light will drop below a still lower level, denoting a third zone as the ‘dark zone’. Although the actual boundaries between the three zones are species-dependent, the following approximate values suffice for the present qualitative reasoning: I > 250 μmol photons m
−2 s
−1 in the photic zone, 10 μmol photons m
−2 s
−1 < I <250 μmol photons m
−2 s
−1 in the limiting light zone, and I < 10 μE in the dark zone. The transition between the light limiting and the photic zone is smooth and somewhat large; this zone is also denoted as the ‘saturation zone’ [
49].
To keep the microalgae PSU system functional, a short stay in the photic zone followed by the transit in the limiting light zone is essential. Entering the dark zone is also favorable to relieve the PSU state of electronic stress, but only if the stay in that zone is sufficiently short; otherwise, this permanence degrades biomass due to respiration.
There are not many ways to guarantee a fast transition from the photic to the limiting light zone by a hydrodynamic mechanism. In equipment where microalgae displacement is mainly by vortices created by turbulence and bubble motion, long-range cell displacement is infrequent, as the direction of the cell path is frequently reversed. To have a frequent irradiance band change, therefore, the thickness of these bands should be very small, and this would also imply that the microalgal suspension should be concentrated (in the order of several grams of dry biomass per liter, or more). However, having thin bands also implies that either the photobioreactor is itself thin or, if it is not, that the dark zone will be large and the respiratory loss for the biomass which it contains would offset any local improvement that could be obtained in the photic and light-limited part of the photobioreactor. To describe this in other words, in this latter case the prevailing respiratory metabolism of the large dark zone would lead to significant ‘biomass-dissipative’ effects, so that the ‘photoprotective’ effect of the rapid light–dark alternation would not entail any measurable overall positive effects. It should also be noted that if the microalgal concentration were, on the other hand, lower (a few grams of dry biomass per liter), each ‘band’ would have a significant thickness (on the order of 1 cm) and traveling across bands at a multiple-Hz frequency would be unfeasible in terms of ‘chaotic’ displacement. On the other hand, if there were a predominant movement of convective nature, a rapid passage from the photic to the limiting light zone or even to the dark zone would be possible, as is demonstrated here. Finally, in the case of low concentration suspensions, irradiance decay occurs across several centimeters and thick photobioreactors holding volumes are required. Here, there is no way to ensure fast band transition unless high intense mixing is applied. In this case, however, the effect of hydrodynamic stress on the biomass might result in curtailed growth (or even biomass decay) and high energy dissipation, which are highly detrimental of plant productivity.


 ,
, 


