Article

Development of Simpler Coarse-Grain Model for Analyzing Behavior of Particles in Fluid Flow

1
Institute of Multidisciplinary Research for Advanced Materials (IMRAM), Tohoku University, 2-1-1 Katahira, Aoba-ku, Sendai 980-8577, Miyagi, Japan
2
Graduate School of Environmental Studies, Tohoku University, 468-1, Aramakiazaaoba, Aoba-ku, Sendai 980-0845, Miyagi, Japan
3
Magnetic Powder Metallurgy Research Center, National Institute of Advanced Industrial Science and Technology (AIST), 2266-98 Anagahora, Shimo-Shidami, Moriyama-ku, Nagoya 463-8560, Aichi, Japan
*
Author to whom correspondence should be addressed.
Processes 2021, 9(7), 1098; https://doi.org/10.3390/pr9071098
Submission received: 27 April 2021 / Revised: 21 June 2021 / Accepted: 21 June 2021 / Published: 24 June 2021
(This article belongs to the Special Issue Simulation for Analyzing Particle Behavior)

Abstract

:
A new simpler coarse-grain model (SCG) for analyzing particle behaviors under fluid flow in a dilute system, by using a discrete element method (DEM), was developed to reduce calculation load. In the SCG model, coarse-grained (CG) particles were enlarged from original particles in the same way as the existing coarse-grain model; however, the modeling concept differed from the other models. The SCG model focused on the acceleration by the fluid drag force, and the CG particles’ acceleration coincided with that of the original particles. Consequently, the model imposed only the following simple rule: the product of particle density and squared particle diameter is constant. Thus, the model had features that can be easily implemented in the DEM simulation to comprehend the modeled physical phenomenon. The model was validated by comparing the behaviors of the CG particles with the original particles in the uniform and the vortex flow fields. Moreover, the usability of the SCG model on simulating real dilute systems was confirmed by representing the particle behavior in a classifier. Therefore, the particle behavior in dilute particle-concentration systems would be analyzed more simply with the SCG model.

1. Introduction

Powder simulations are commonly utilized in numerous industrial fields such as food, medicine, and ceramics to control powder processes and comprehend the powder phenomena. A representative method for analyzing the powder behavior is the discrete element method (DEM) [1,2,3,4,5,6,7], and the coverage of the analysis region has been expanding [8,9,10,11,12]. In the DEM, the powder behavior is represented by solving Newton’s motion equations of each particle composing the powder [13]. However, the calculation load is exponentially increased with the increase in the number of particles. Particularly, the load dramatically increases with decreasing the particle diameter. Namely, it is realistically difficult to simulate the behavior of the particles on a scale of actual processes due to the huge number of particles. Thus, it is desirable to realize faster and larger-scale calculations of the DEM simulation.
Coarse-grain models have been developed as an effective method to reduce the calculation load of the DEM simulation. In the coarse-grain models, the powder behavior is generally represented by coarse-grained particles (CG particles) that is equivalent to the original particles in something physical despite having a larger diameter. There are representative models that use the concept of the coarse-grain models already, such as the similarity model by Washino et al. [14], the imaginary sphere model by Sakano et al. [15], and the similar particle assembly model by Kuwagi et al. [16,17], to represent the particle behavior in fluidized beds. For instance, in the case of the imaginary sphere model, an imaginary sphere is the CG particle and is defined as a cluster of original particles. Collision force is assumed to occur between two imaginary spheres, while fluid drag force is calculated by the summation of fluid drag forces acted on the original particles in one imaginary sphere. Although these three models indicated that the particle behavior in fluidized beds could be represented, and that the calculation load could be reduced, the particle behavior cannot be represented with sufficient accuracy. Subsequently, for fluidized beds, numerous coarse-grain models have been developed to improve the accuracy and versatility of the models [17,18,19,20,21,22,23,24]. Sakai et al. proposed the more accurate coarse-grain model for the particle behavior in fluidized beds. In the model, a CG particle is assumed to compose of original particles that have the same volume. The forces acted on the CG particle are adjusted such that the kinetic energy of the CG particle coincides with the total of the kinetic energies of the original particles composed. It was confirmed that the model was able to represent the bubble diameter in the fluidized beds more accurately.
Recently, the coarse-grain models have been modified and improved, and are applied to the other powder processes and powder phenomena [25,26,27,28,29,30,31]. Nakamura et al. developed a “coarse-grained method for a granular shear flow (CGSF)” to apply the coarse-grain model to the mixing process [31]. In the CGSF, the four types of energies that include friction damping energy, kinetic energy, elastic energy, and viscous energy are modeled. The energies of the CG particles are matched with that of the original particles. The coarse-grain model has been evolving into a useful model dealing with various processes faster and complex powder phenomena, as in the examples above.
However, implementing the coarse-grain models to the DEM simulation becomes complex, and modeled physical phenomena would be difficult comprehend. Additionally, in expanding the application region of the coarse-grain models, the cases not requiring a complicated model is also increasing. The dilute particle-concentration processes are the typical instances: for example, investigation of a classification effect in a cyclone classifier and identification of a movement path of particles in a pneumatic conveyance are included. Furthermore, most of the reports applied the coarse-grain models to complex powder phenomena, however, fundamental particle behavior when no collision occurs has hardly been validated.
Thus, in this paper, we develop a new simpler coarse-grain (SCG) model in which physical meanings are intelligible and implementing the model is facilitated. The purpose of the SCG model is to represent the particle behavior in dilute particle-concentration systems such as a cyclone classifier and pneumatic conveyance. In the SCG model, the fluid drag force is only modeled because the particle motion in the dilute particle-concentration systems is governed by the fluid drag force [15]. To validate the SCG model when no collision occurs, the single CG particle behaviors simulated with the SCG model are compared with the single original particle behaviors on two simple flow fields (uniform and vortex flow fields). Moreover, to confirm the usability of the SCG model for representing the particle behavior in an actual process, the SCG model is applied to represent the particle behavior in a classifier, and the behaviors of a number of CG particles are compared with the original particles.

2. Simulation Method

It is assumed that the fluid flow field is constant and the particles do not affect the fluid flow, namely the one-way coupling is adapted. This is because the force acted on the fluid from the particles would be negligible when the particle concentration is dilute and the particle diameter is micron-order. Additionally, the micron-order particles follow the fluid flow due to the particles having small inertia. Thus, the particle Reynolds number could often be smaller than 0.1 because the relative velocity between the particles and fluid flow is close to zero. However, the particle Reynolds number could be larger than 0.1 in the calculation system. Alternatively, the quite simple Equation (7) can be derived when the C d = 24 / R e is held. This leads to the SCG model being easily implemented into any DEM simulations without changing the simulation codes. Thus, in this paper, the C d = 24 / R e is held because the SCG model places emphasis on the ease of the implementation into the existing DEM simulation codes. Furthermore, it is assumed that the particle–particle interactions are hardly acted on the particles due to the dilute particle-concentration and that the fluid drag force is mainly acted on the particles. In this paper, the dilute particle-concentration system is defined by the following [32]:
S t τ v τ c = 4 π n ρ p d ¯ 4 | u r | 18 μ f < 100
where S t denotes the Stokes number, τ v the momentum response time of a particle, τ c the average time between particle–particle collisions, n the number density of particles, ρ p the particle density, d ¯ mean particle diameter, u r relative velocity between fluid and a particle, and μ f the fluid viscosity. In general, the Stokes number is below 0.1 when the particle-concentration is dilute. However, the SCG model can be applied as long as the particles occasionally collide with each other. This is confirmed in Section 5.
The particle behavior is represented by the DEM, while the fluid flow field is given by the uniform and the vortex flows. In the DEM, the motion of the particles is tracked by the following transitional and rotational motion equations, respectively:
m i d v i d t = j = 1 k i ( F i j n + F i j s ) + F D
I i d ω i d t = j = 1 k i ( 1 2 d i F i j s )
where m i and I i denote the mass and inertia moment of the i-th particle, respectively, v i the transitional velocity, ω i the rotational velocity, t time, and d i the i-th particle diameter. F i j n and F i j s are the normal and tangential collision forces, respectively. F D represents the fluid drag force and calculated by the following:
F D = C d A ρ f | u r | 2 u r
where A is the projection area of a particle, ρ f the fluid density, and u r the relative velocity between a particle and fluid. C d denotes the coefficient of fluid drag and is represented by the following when the Stokes’ law is valid (particle Reynolds number R e < 0.1 ):
C d = 24 R e         ( R e = d i | u r | ρ f μ f )
where μ f fluid viscosity.

3. SCG Model for Fluid Drag Force

The motion of the CG particle must be equal to that of the original particle when the accelerations of the particles are the same. Here, the acceleration ratio of the CG particle to the original particle is calculated by the following:
a CG a O = F D , CG / m CG F D , O / m O = C D , CG A CG ρ f | u r | 2 u r / 4 3 π ( d CG 2 ) 3 ρ p , CG C D , O A O ρ f | u r | 2 u r / 4 3 π ( d O 2 ) 3 ρ p , O = π 8 C D , CG ρ f d CG 2 | u r | u r / π 6 d CG 3 ρ p , CG π 8 C D , O ρ f d O 2 | u r | u r / π 6 d O 3 ρ p , O = π 8 24 μ d CG u r ρ f ρ f d CG 2 | u r | u r / π 6 d CG 3 ρ p , CG π 8 24 μ d O u r ρ f ρ f d O 2 | u r | u r / π 6 d O 3 ρ p , O = 1 / ρ p , CG d CG 2 1 / ρ p , O d O 2
where subscripts O and CG denote the original particle and the CG particle, respectively, a the particle acceleration, d the particle diameter, and ρ p the particle density. Consequently, the accelerations of original and CG particles are equaled when the following rule is satisfied:
ρ p , CG d CG 2 = ρ p , O d O 2
Thus, in the SCG model, the CG particle density only decreases with the increasing of the CG particle diameter to follow Equation (7).

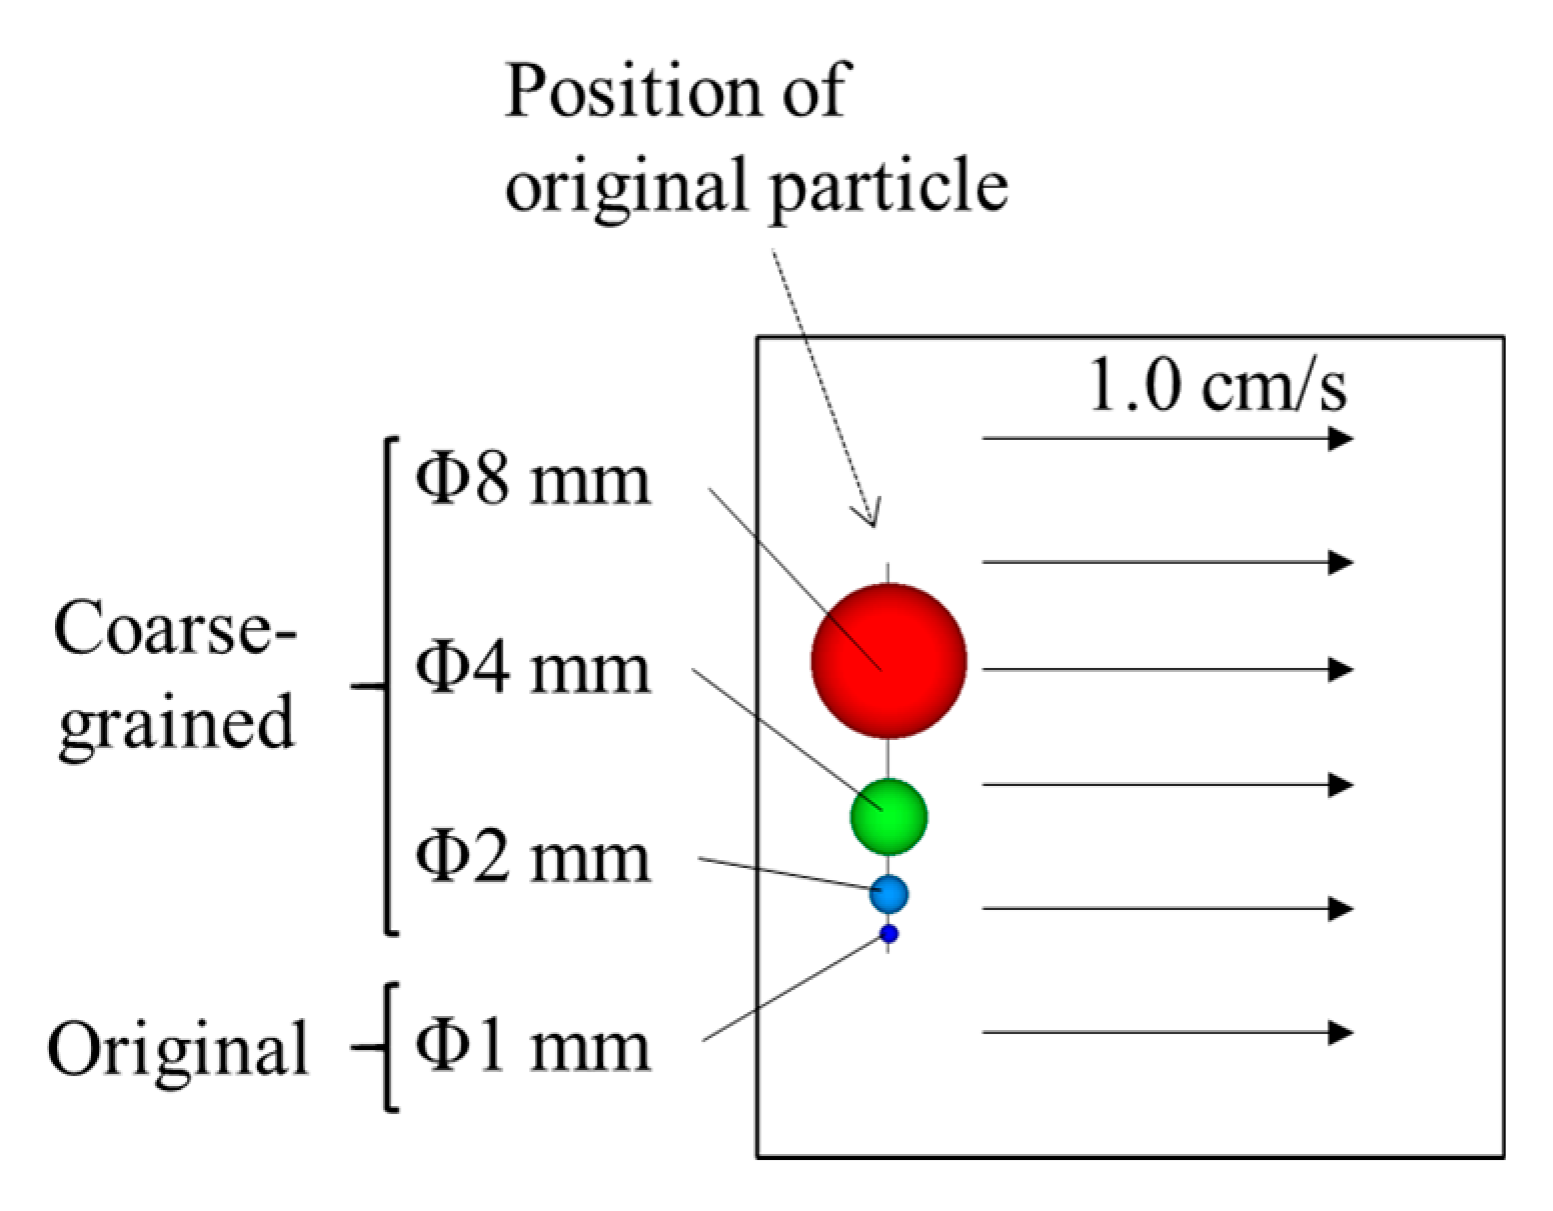
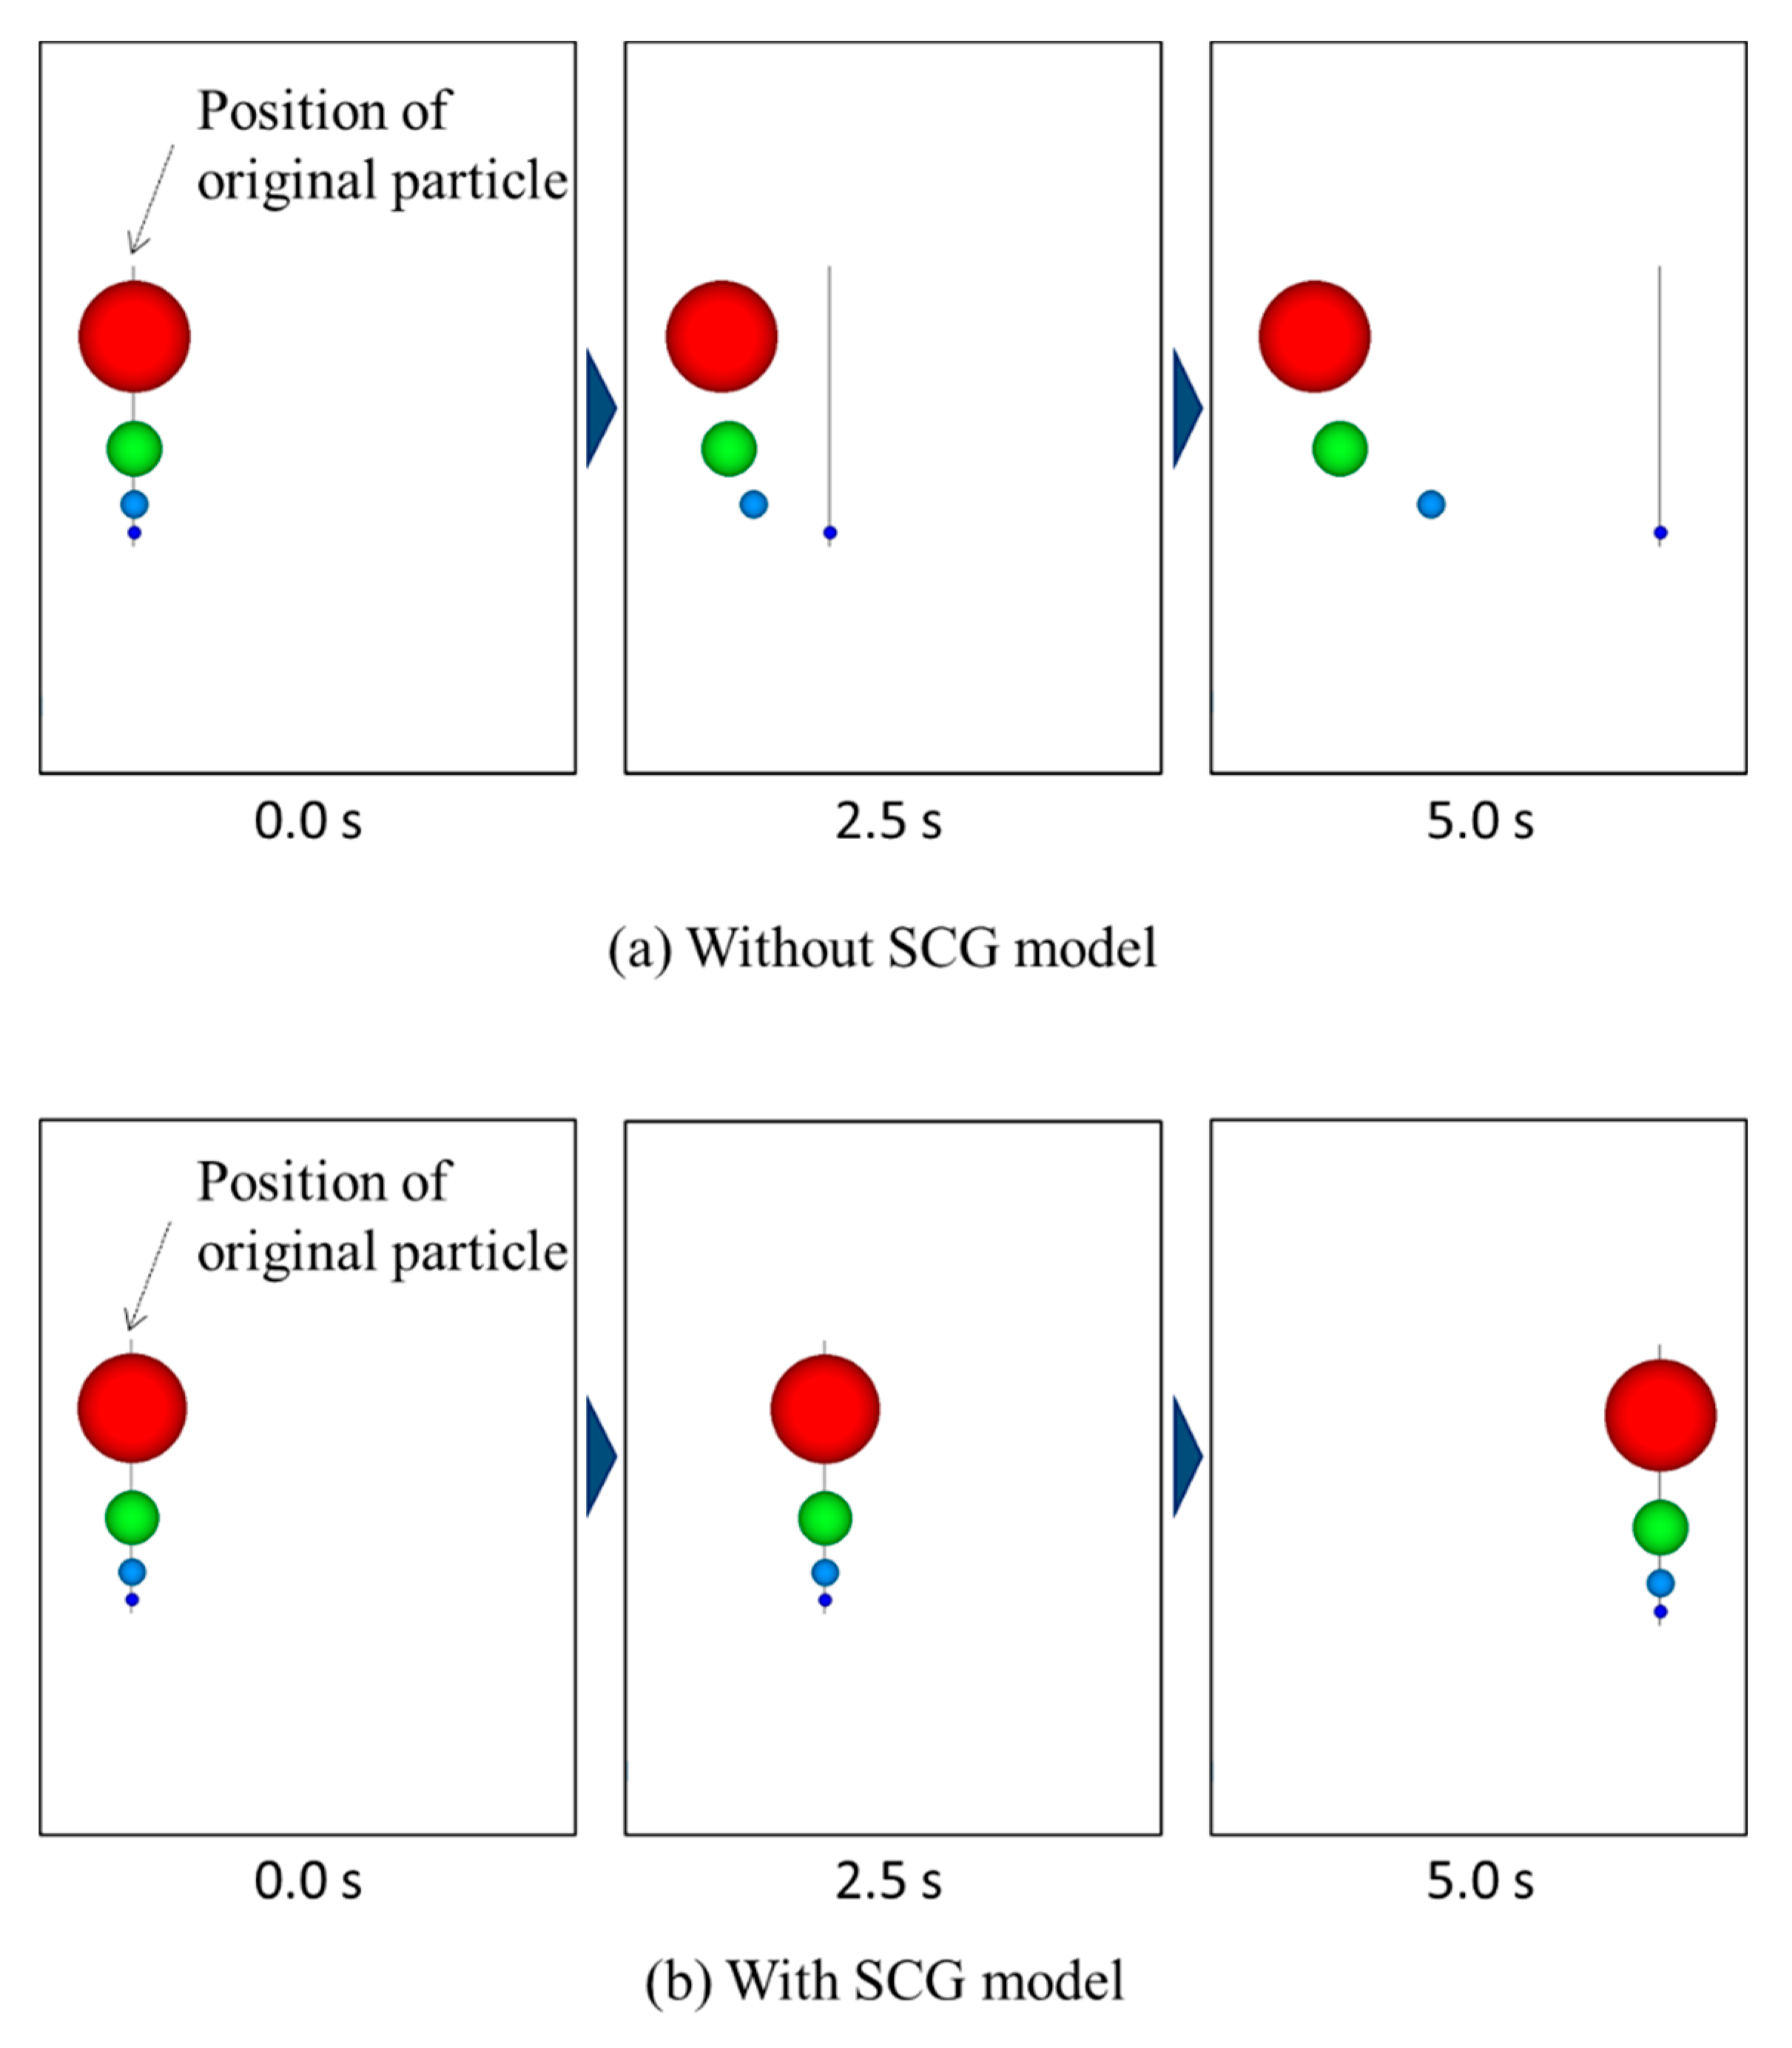
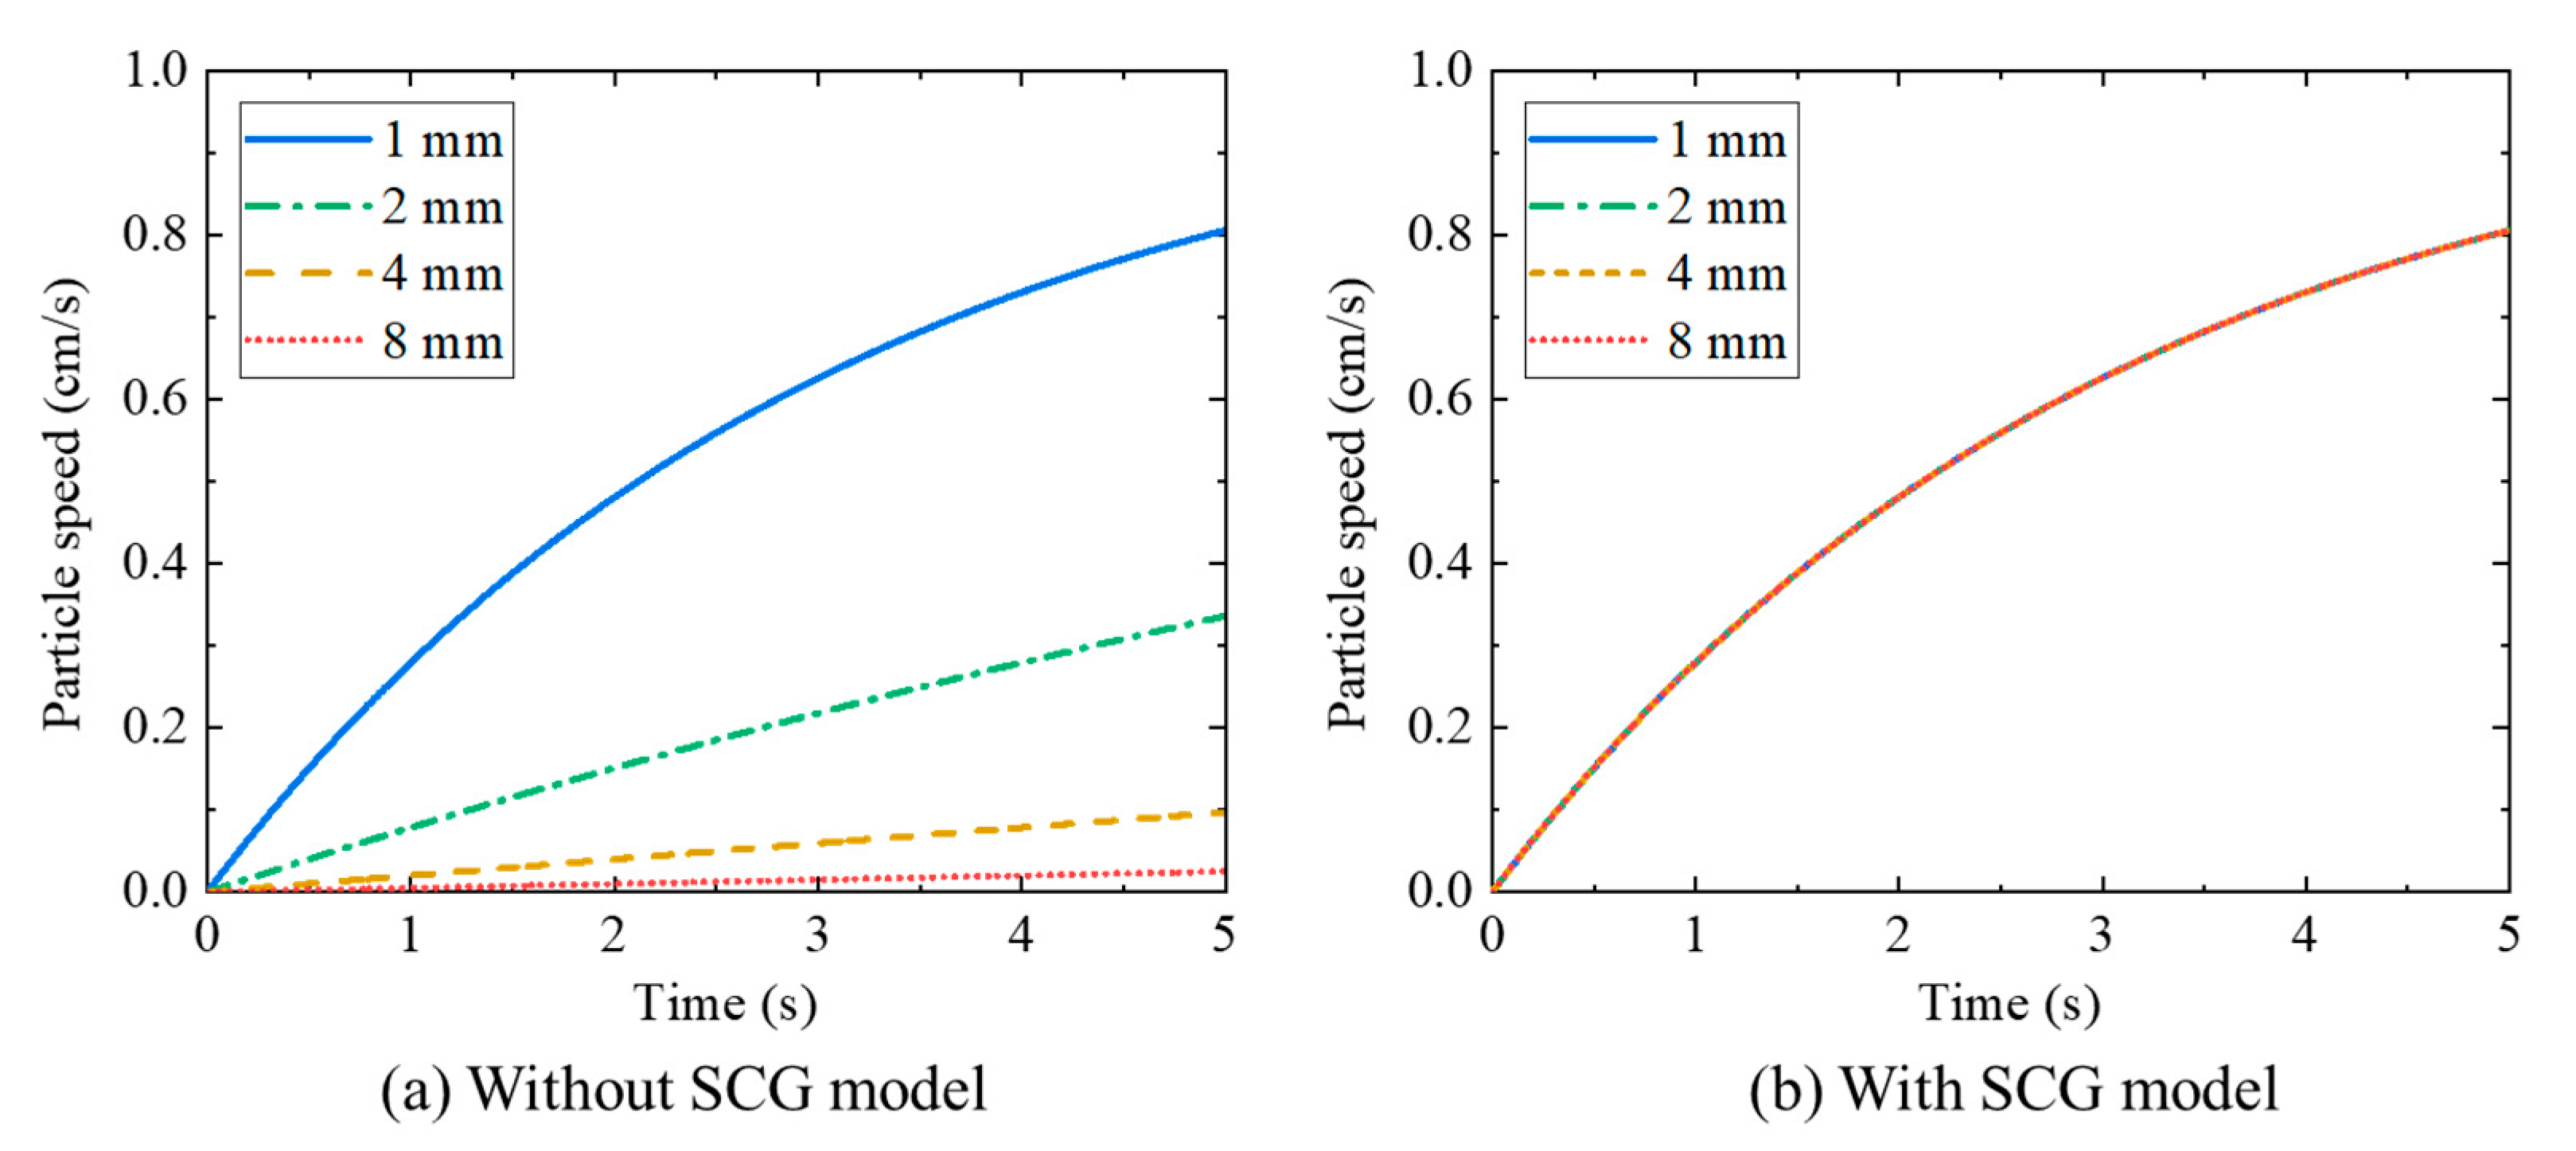
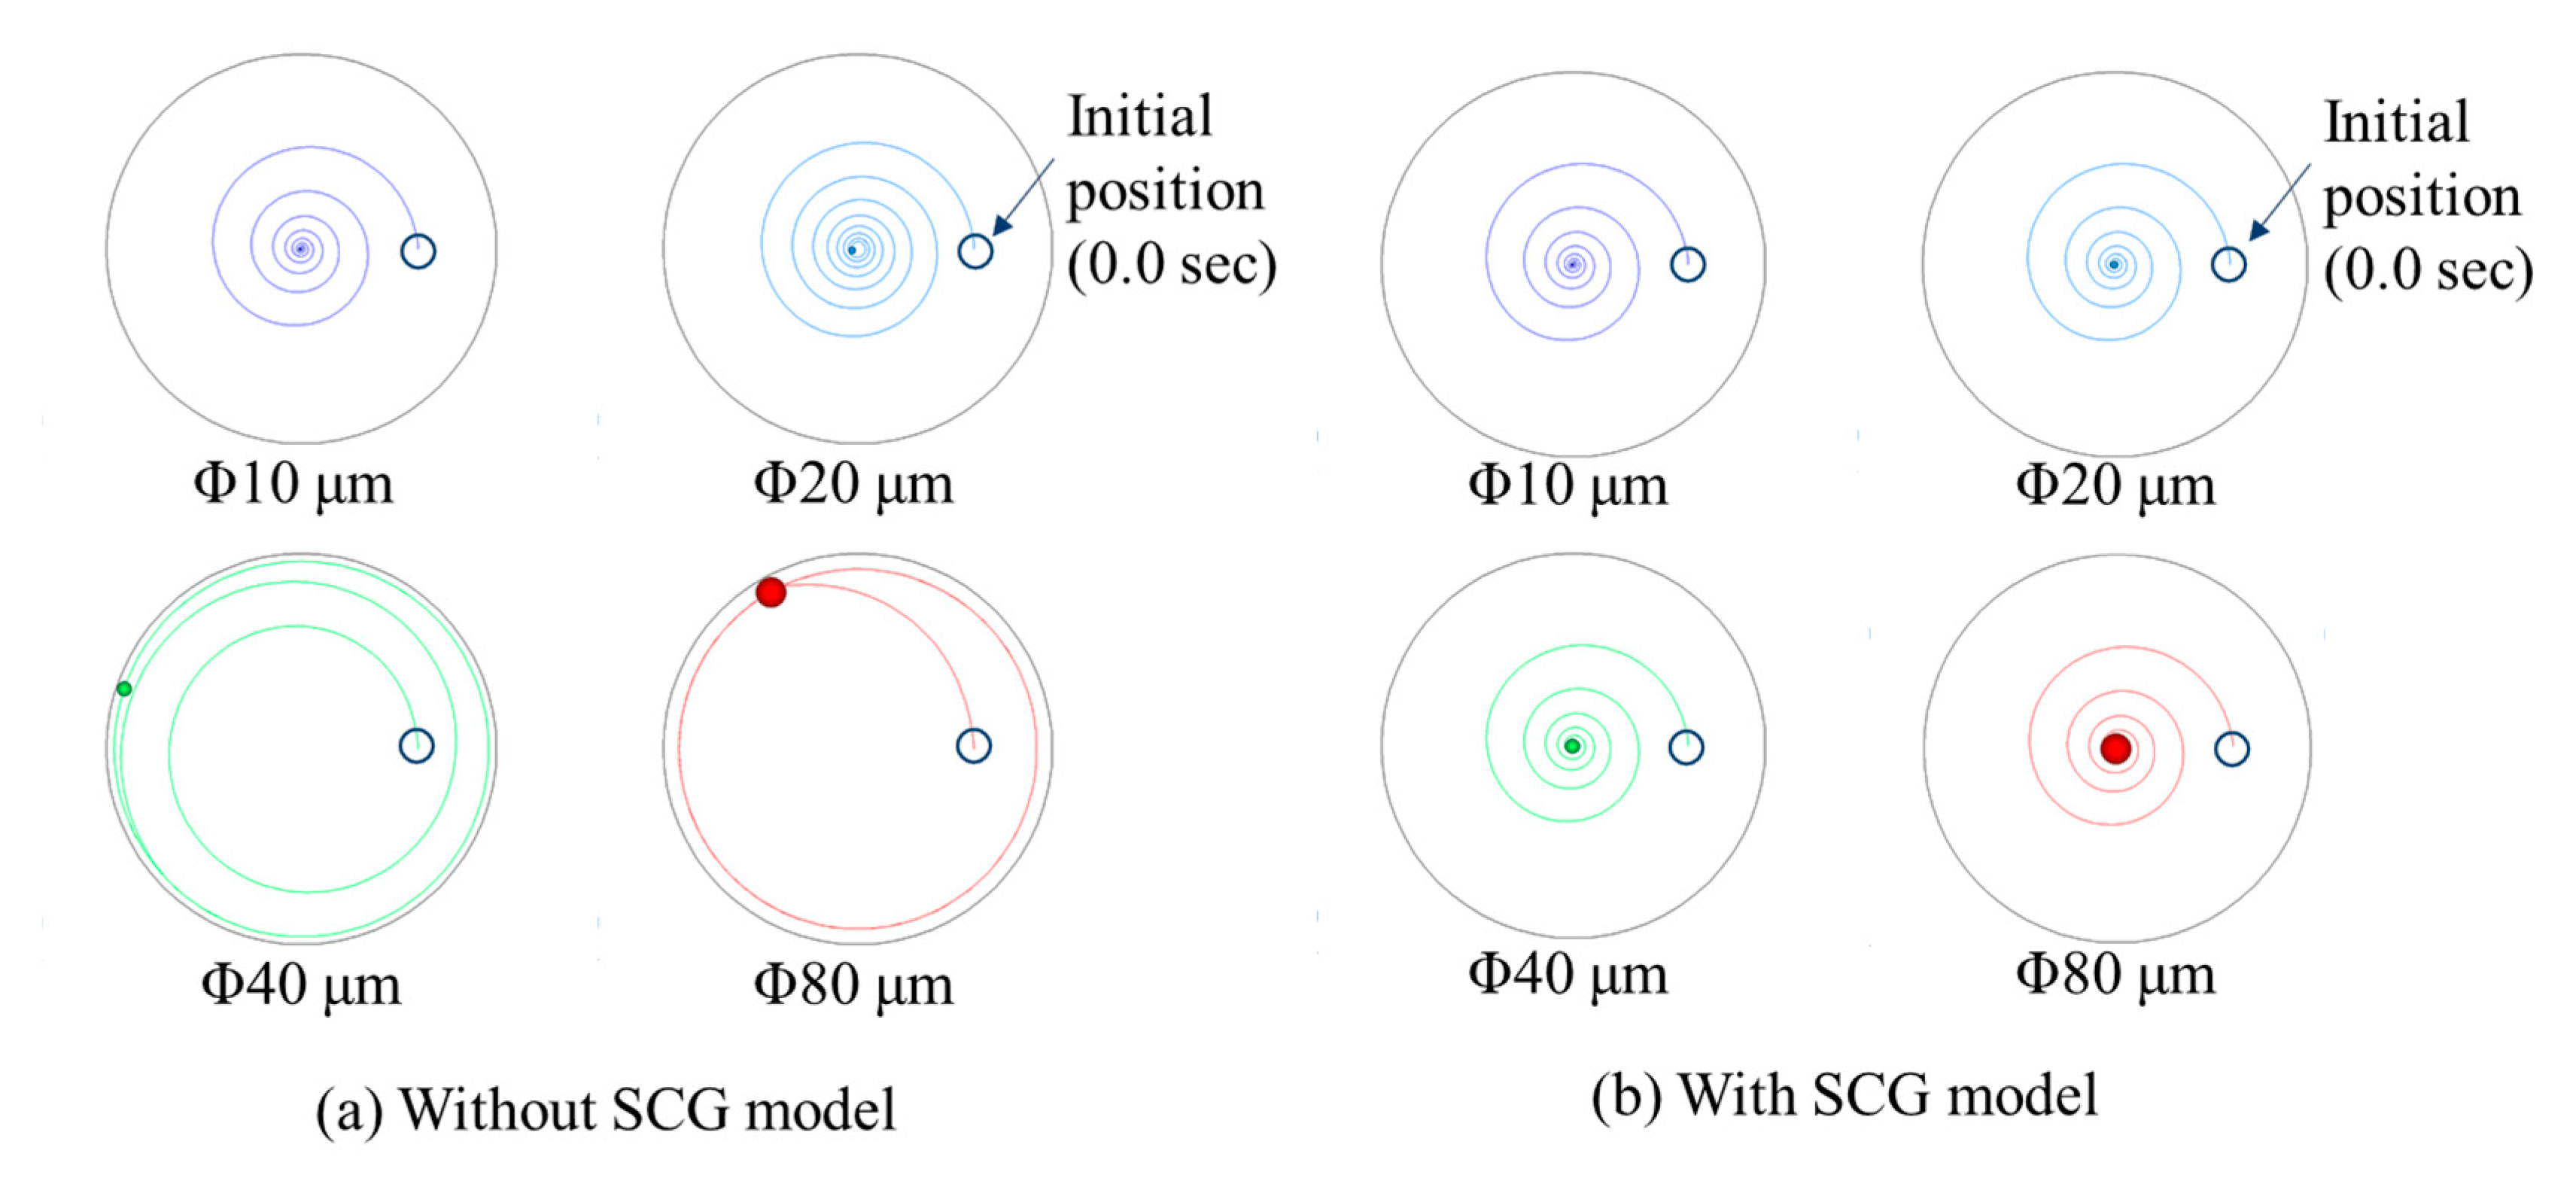
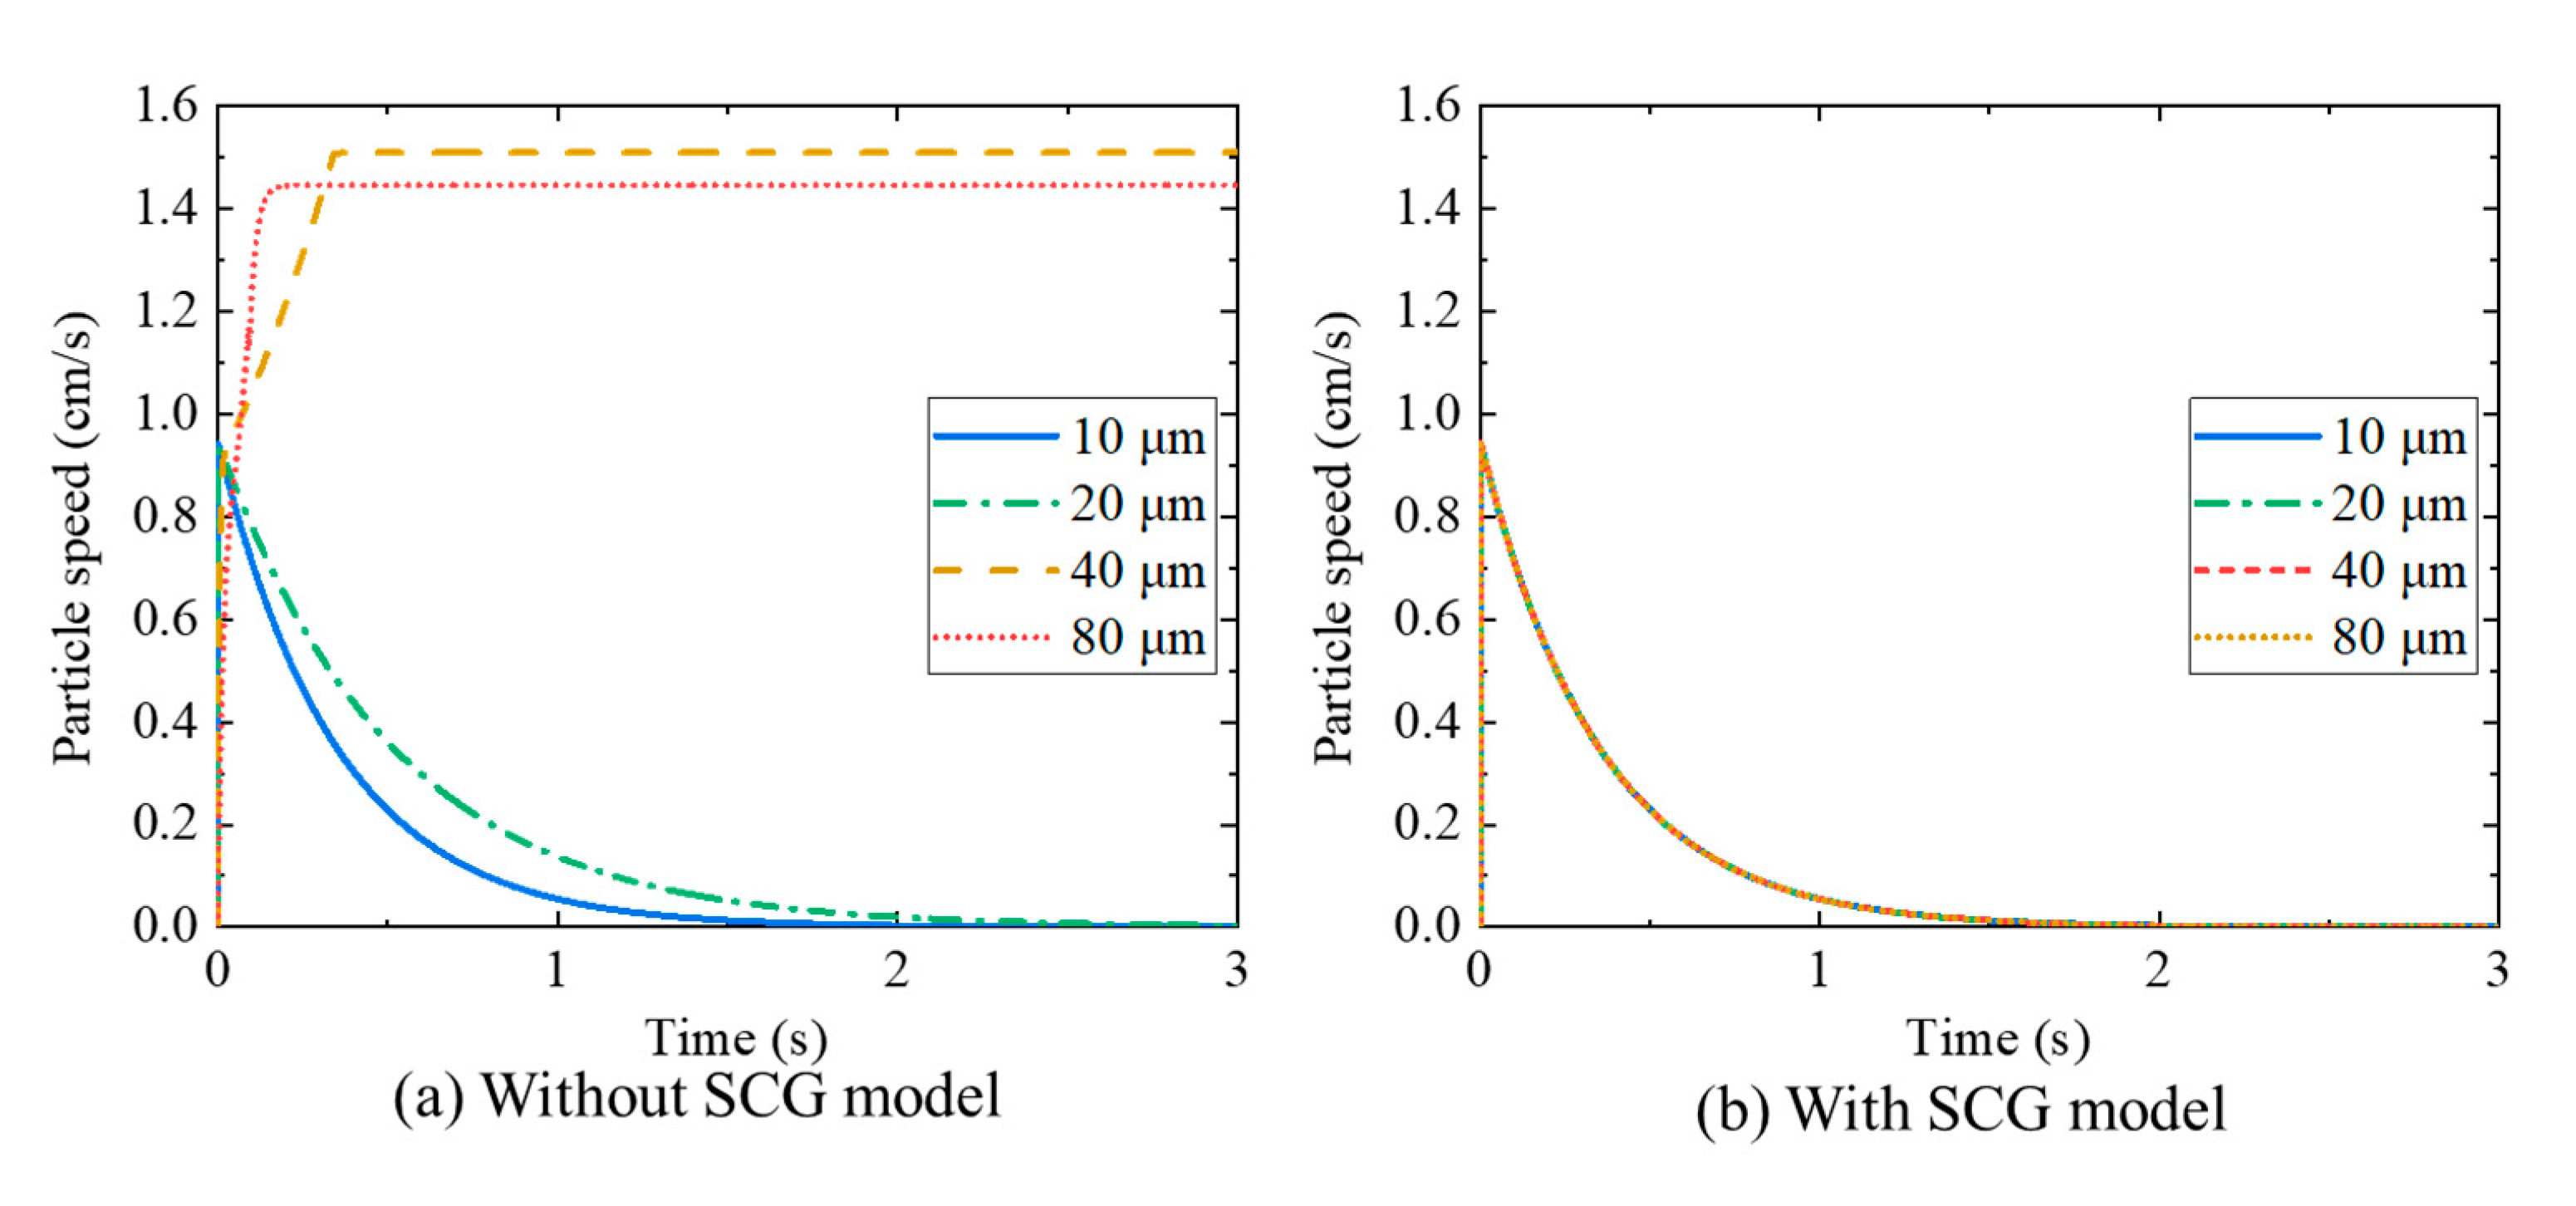
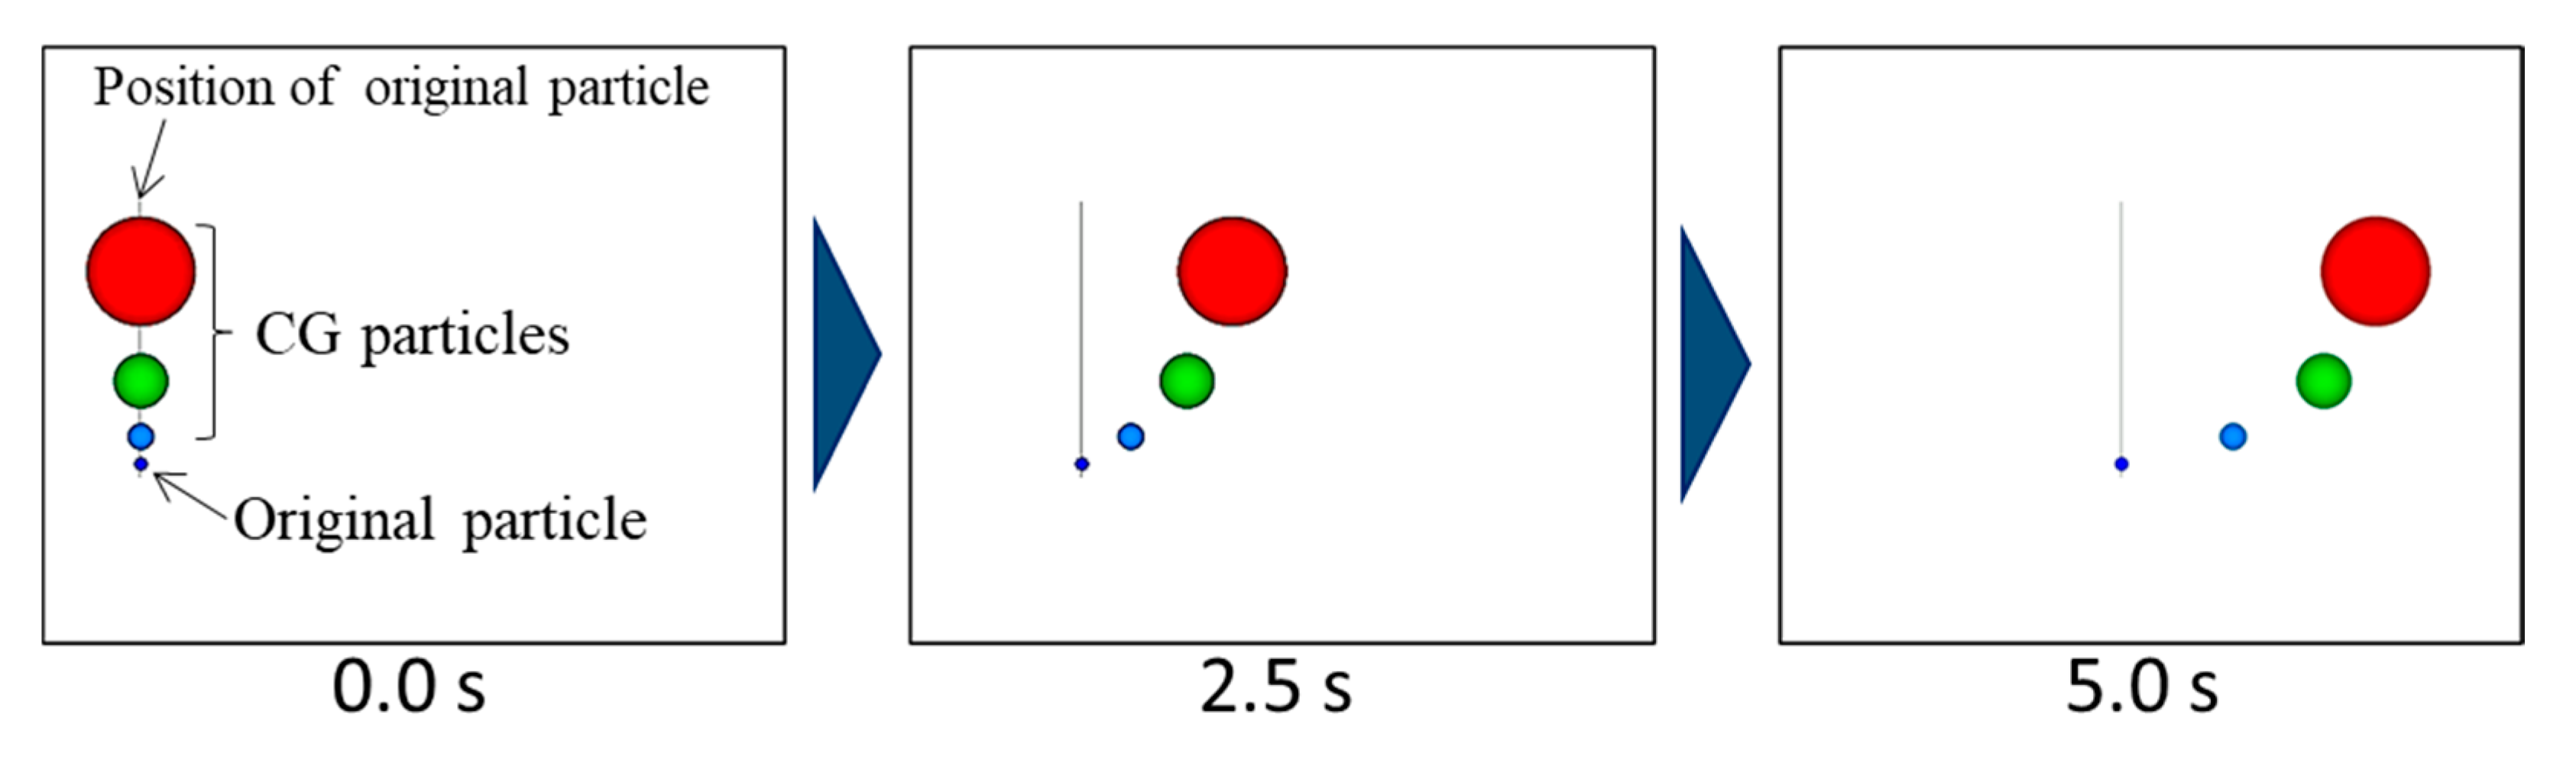
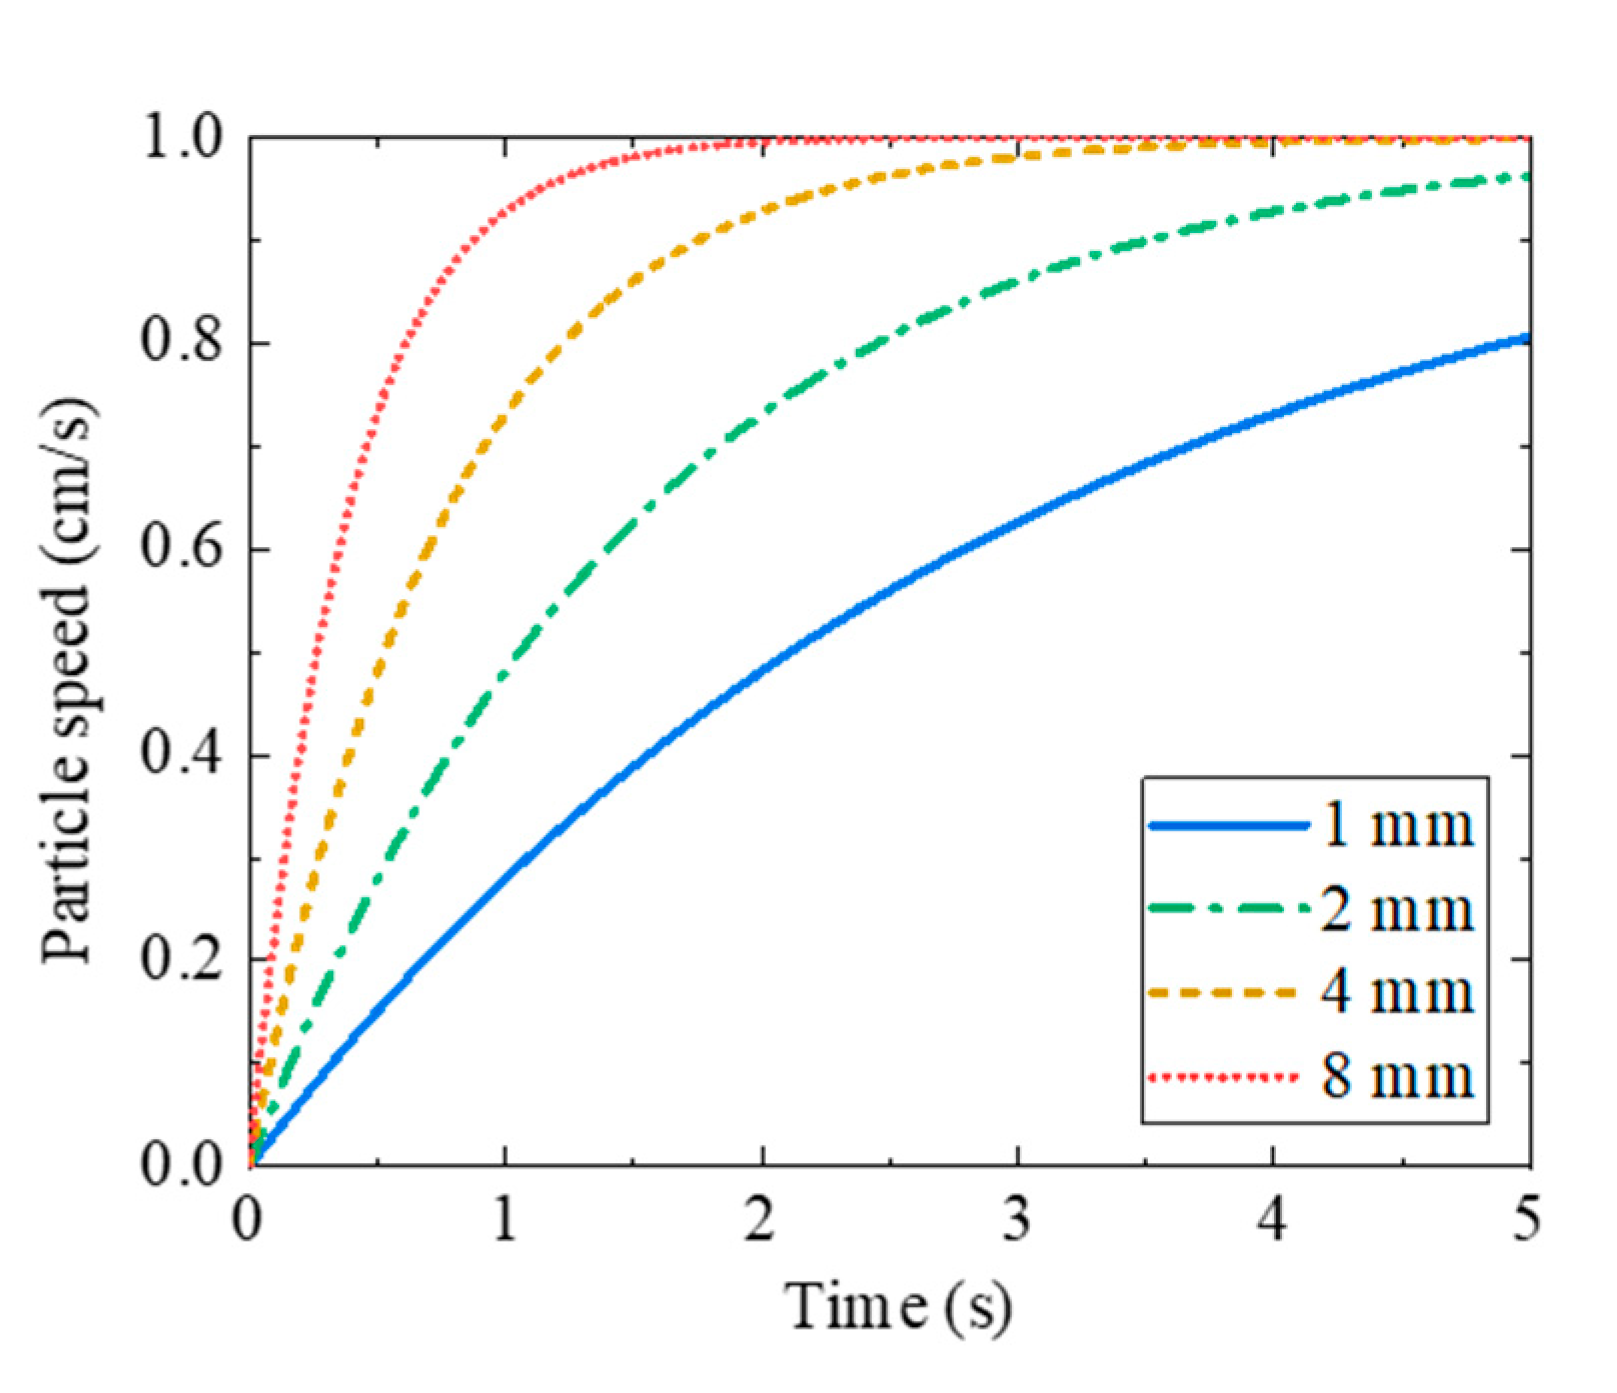
4. Comparisons of Particle Behaviors on Simple Flow Fields

The behaviors of the original and the CG particles on two simple flow fields are compared to validate the SCG model when the model represents the single particle behavior. First of all, the CG particle behaviors in a uniform flow field represented by the DEM with the SCG model are compared with the particle behaviors without the SCG model. Figure 1 shows the schematic diagram of the simulation system for analyzing the particle behaviors in the uniform flow field.
The original particle and three CG particles are positioned for their centers to be lined up on the same straight line. Table 1 shows the simulation conditions of the particles. The densities of the CG particles are calculated by Equation (7). The fluid density and viscosity are set to 1.2   kg / m 3 and 1.8 × 10 5   Pa · s, respectively.
Figure 2 shows the snapshots of particle behaviors by the DEM with and without the SCG model. Further, Figure 3 shows the change of the particle speeds in time. In the case without the SCG model, the particles move faster with decreasing particle diameters, and the centers of the particles are far apart from each other. This is because the inertia of particles is proportional to the third power of the particle diameters, while the fluid drag force is to the second power. Alternatively, with the SCG model, all of the particles move at the same velocity. Thus, it is suggested that the inertia of the CG particles could be precisely represented by using the SCG model. In Appendix A, Figure A1 and Figure A2 show the particle behaviors and the particle speeds when the CG particle masses are set to the same as the original particle mass, respectively. It is found that the larger CG particles move faster due to overestimating the fluid drag force.
The behaviors of micron-order particles are also compared in a vortex flow field in order to validate the SCG model in the flow field closer to the real dilute particle-concentration processes. Figure 4 shows the schematic diagram of the simulation system for analyzing the particle behaviors in the vortex flow field. The vessel diameter is set to 1.0 mm, and the vessel height is infinity.
The centers of one original particle and three CG particles are placed on the straight line vertical to the vessel. Figure 4 also shows the vortex flow velocity field of the cross-section of the vessel. The field is created by superposing the forced-vortex field with the flow field toward the vessel’s center. In this case, the rotational speed of the forced-vortex is set to 300 rpm, and the speed of the field toward the center is set to 10 % of the flow velocity in the forced-vortex field. There is no velocity distribution in the vertical direction of the vessel. Table 2 shows the simulation conditions of the particles. The fluid density and viscosity are set to 1.2   kg / m 3 and 1.8 × 10 5   Pa · s, respectively. The densities of the CG particles are calculated by Equation (7) in the same manner as Table 1. Figure 5 shows the particle trajectories in the vortex flow field represented by the DEM with and without the SCG model. Further, Figure 6 shows the change of particle speeds in time.
The CG particles move quite differently from the original particle without the SCG model, while all the CG particles move in the same way and speed of the original particle with the SCG model. Thus, it is suggested that the SCG model would represent the behavior of particles in the dilute systems.

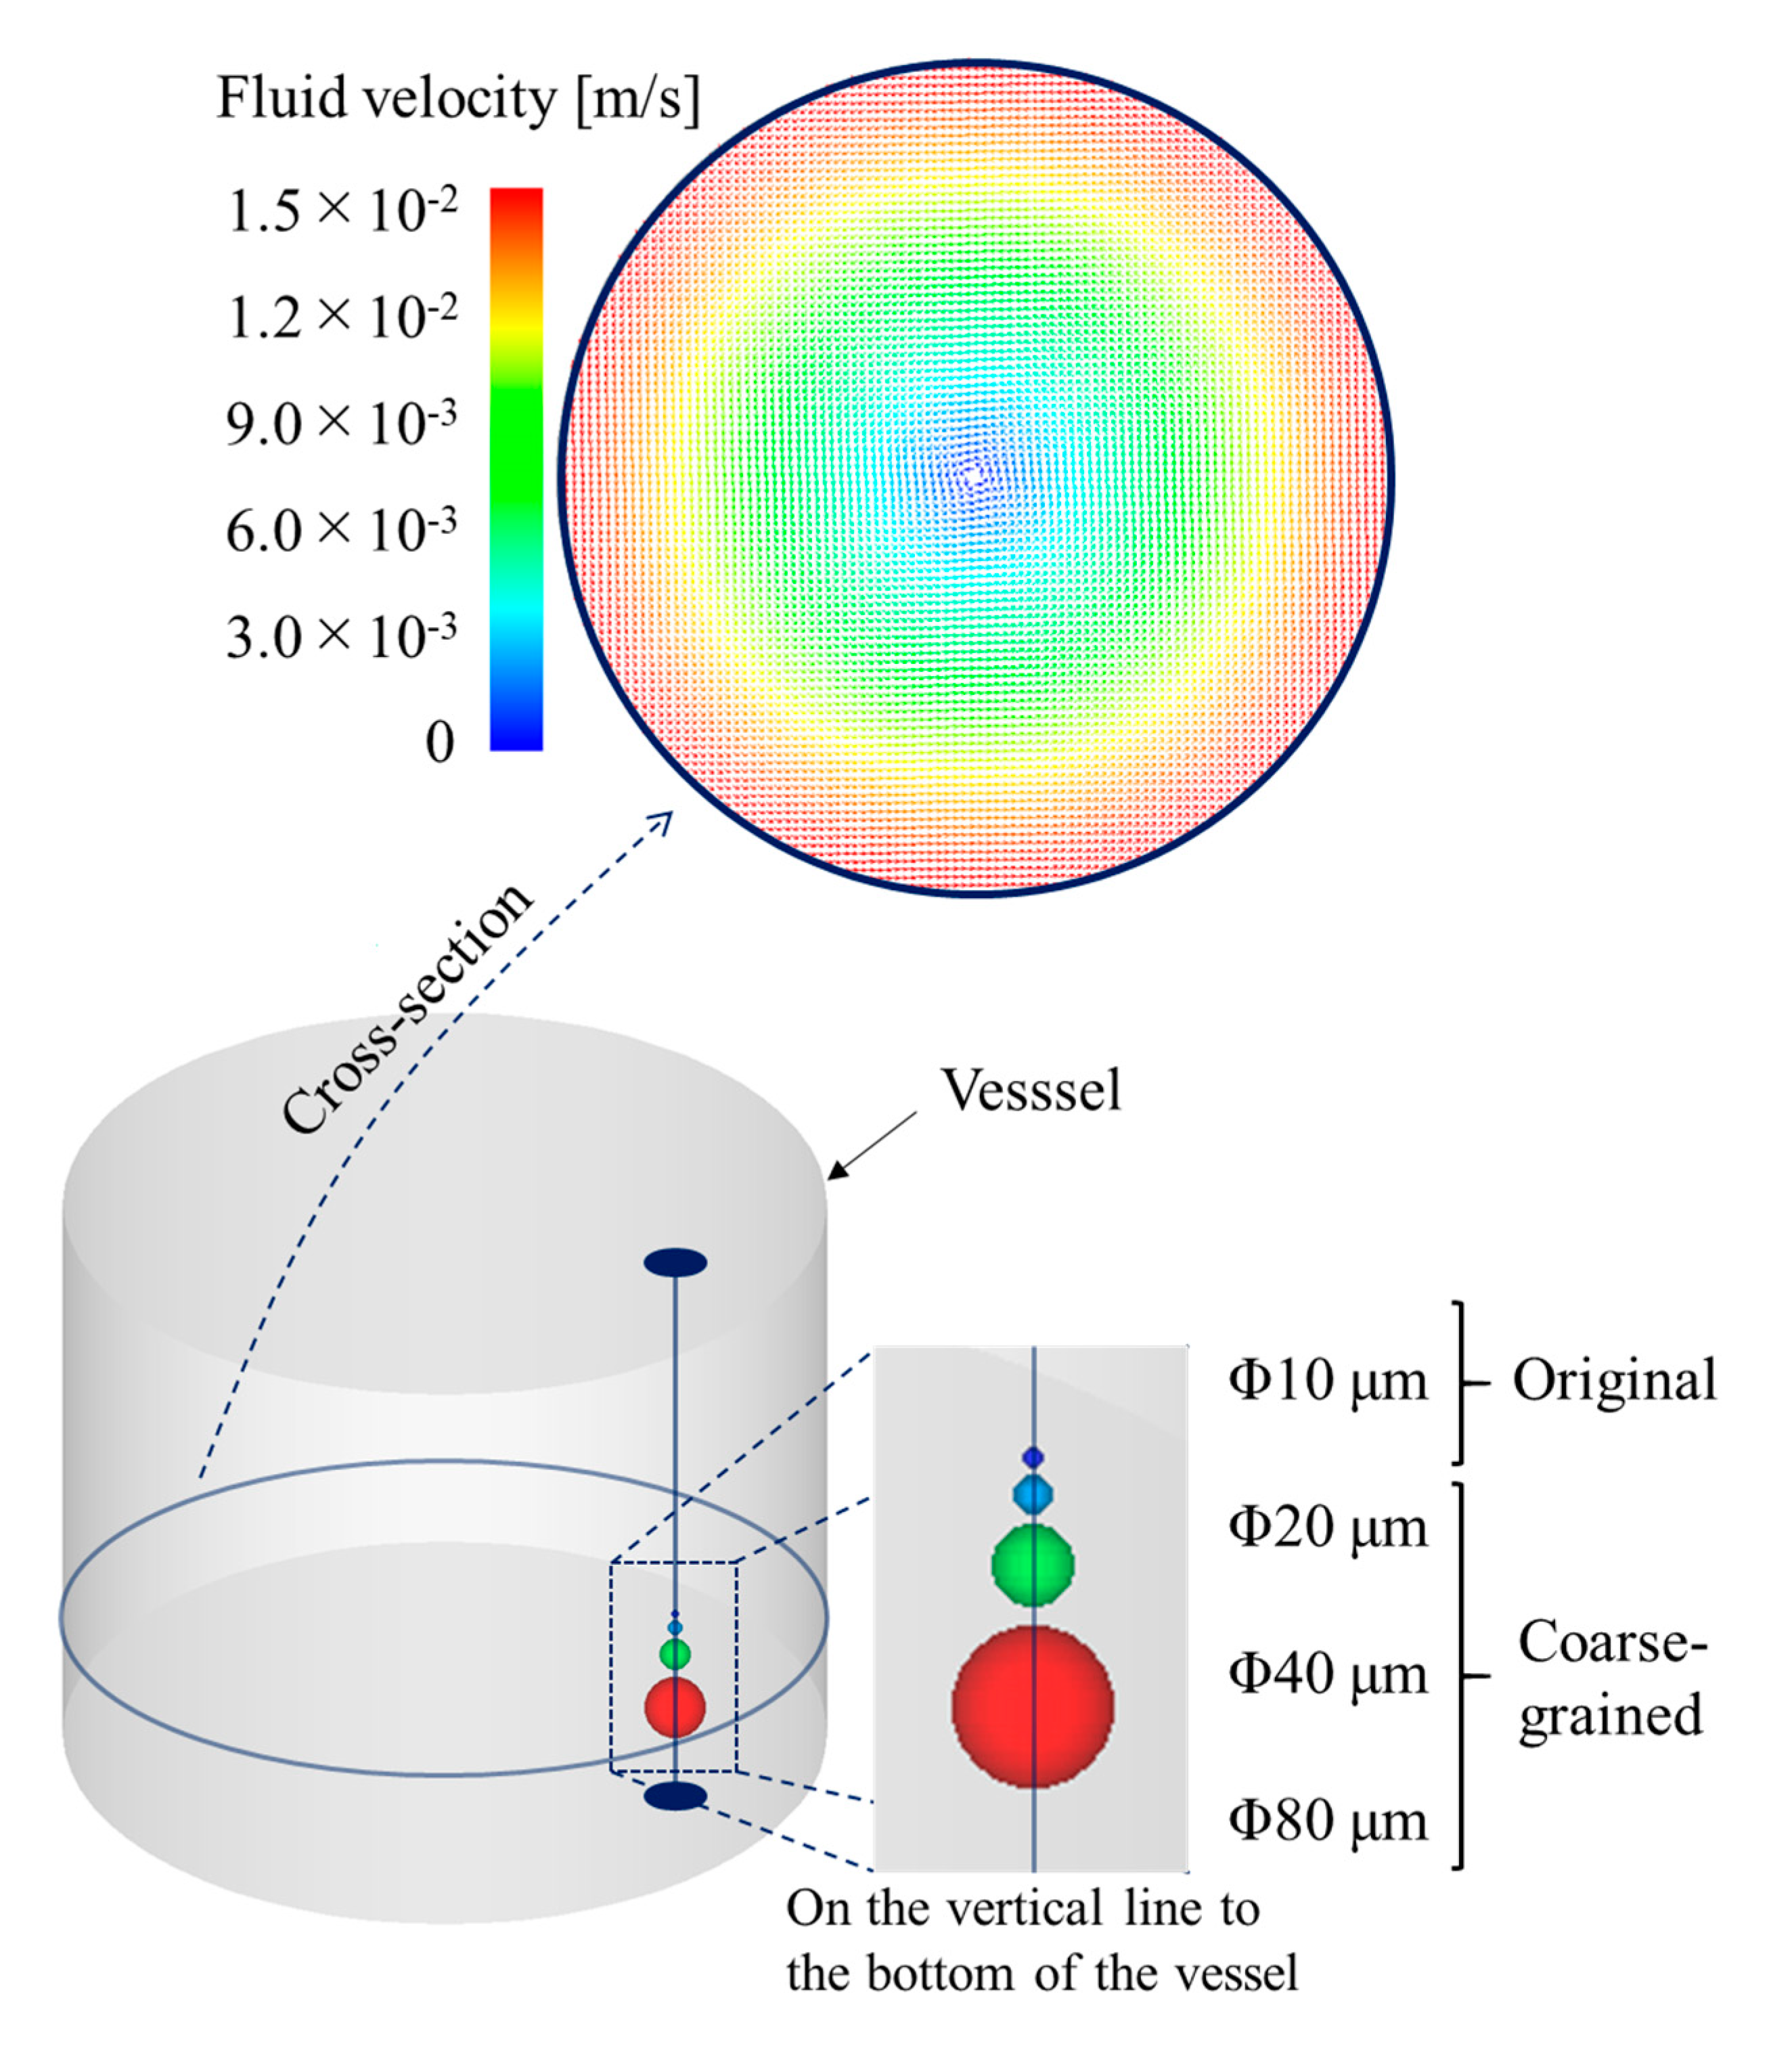
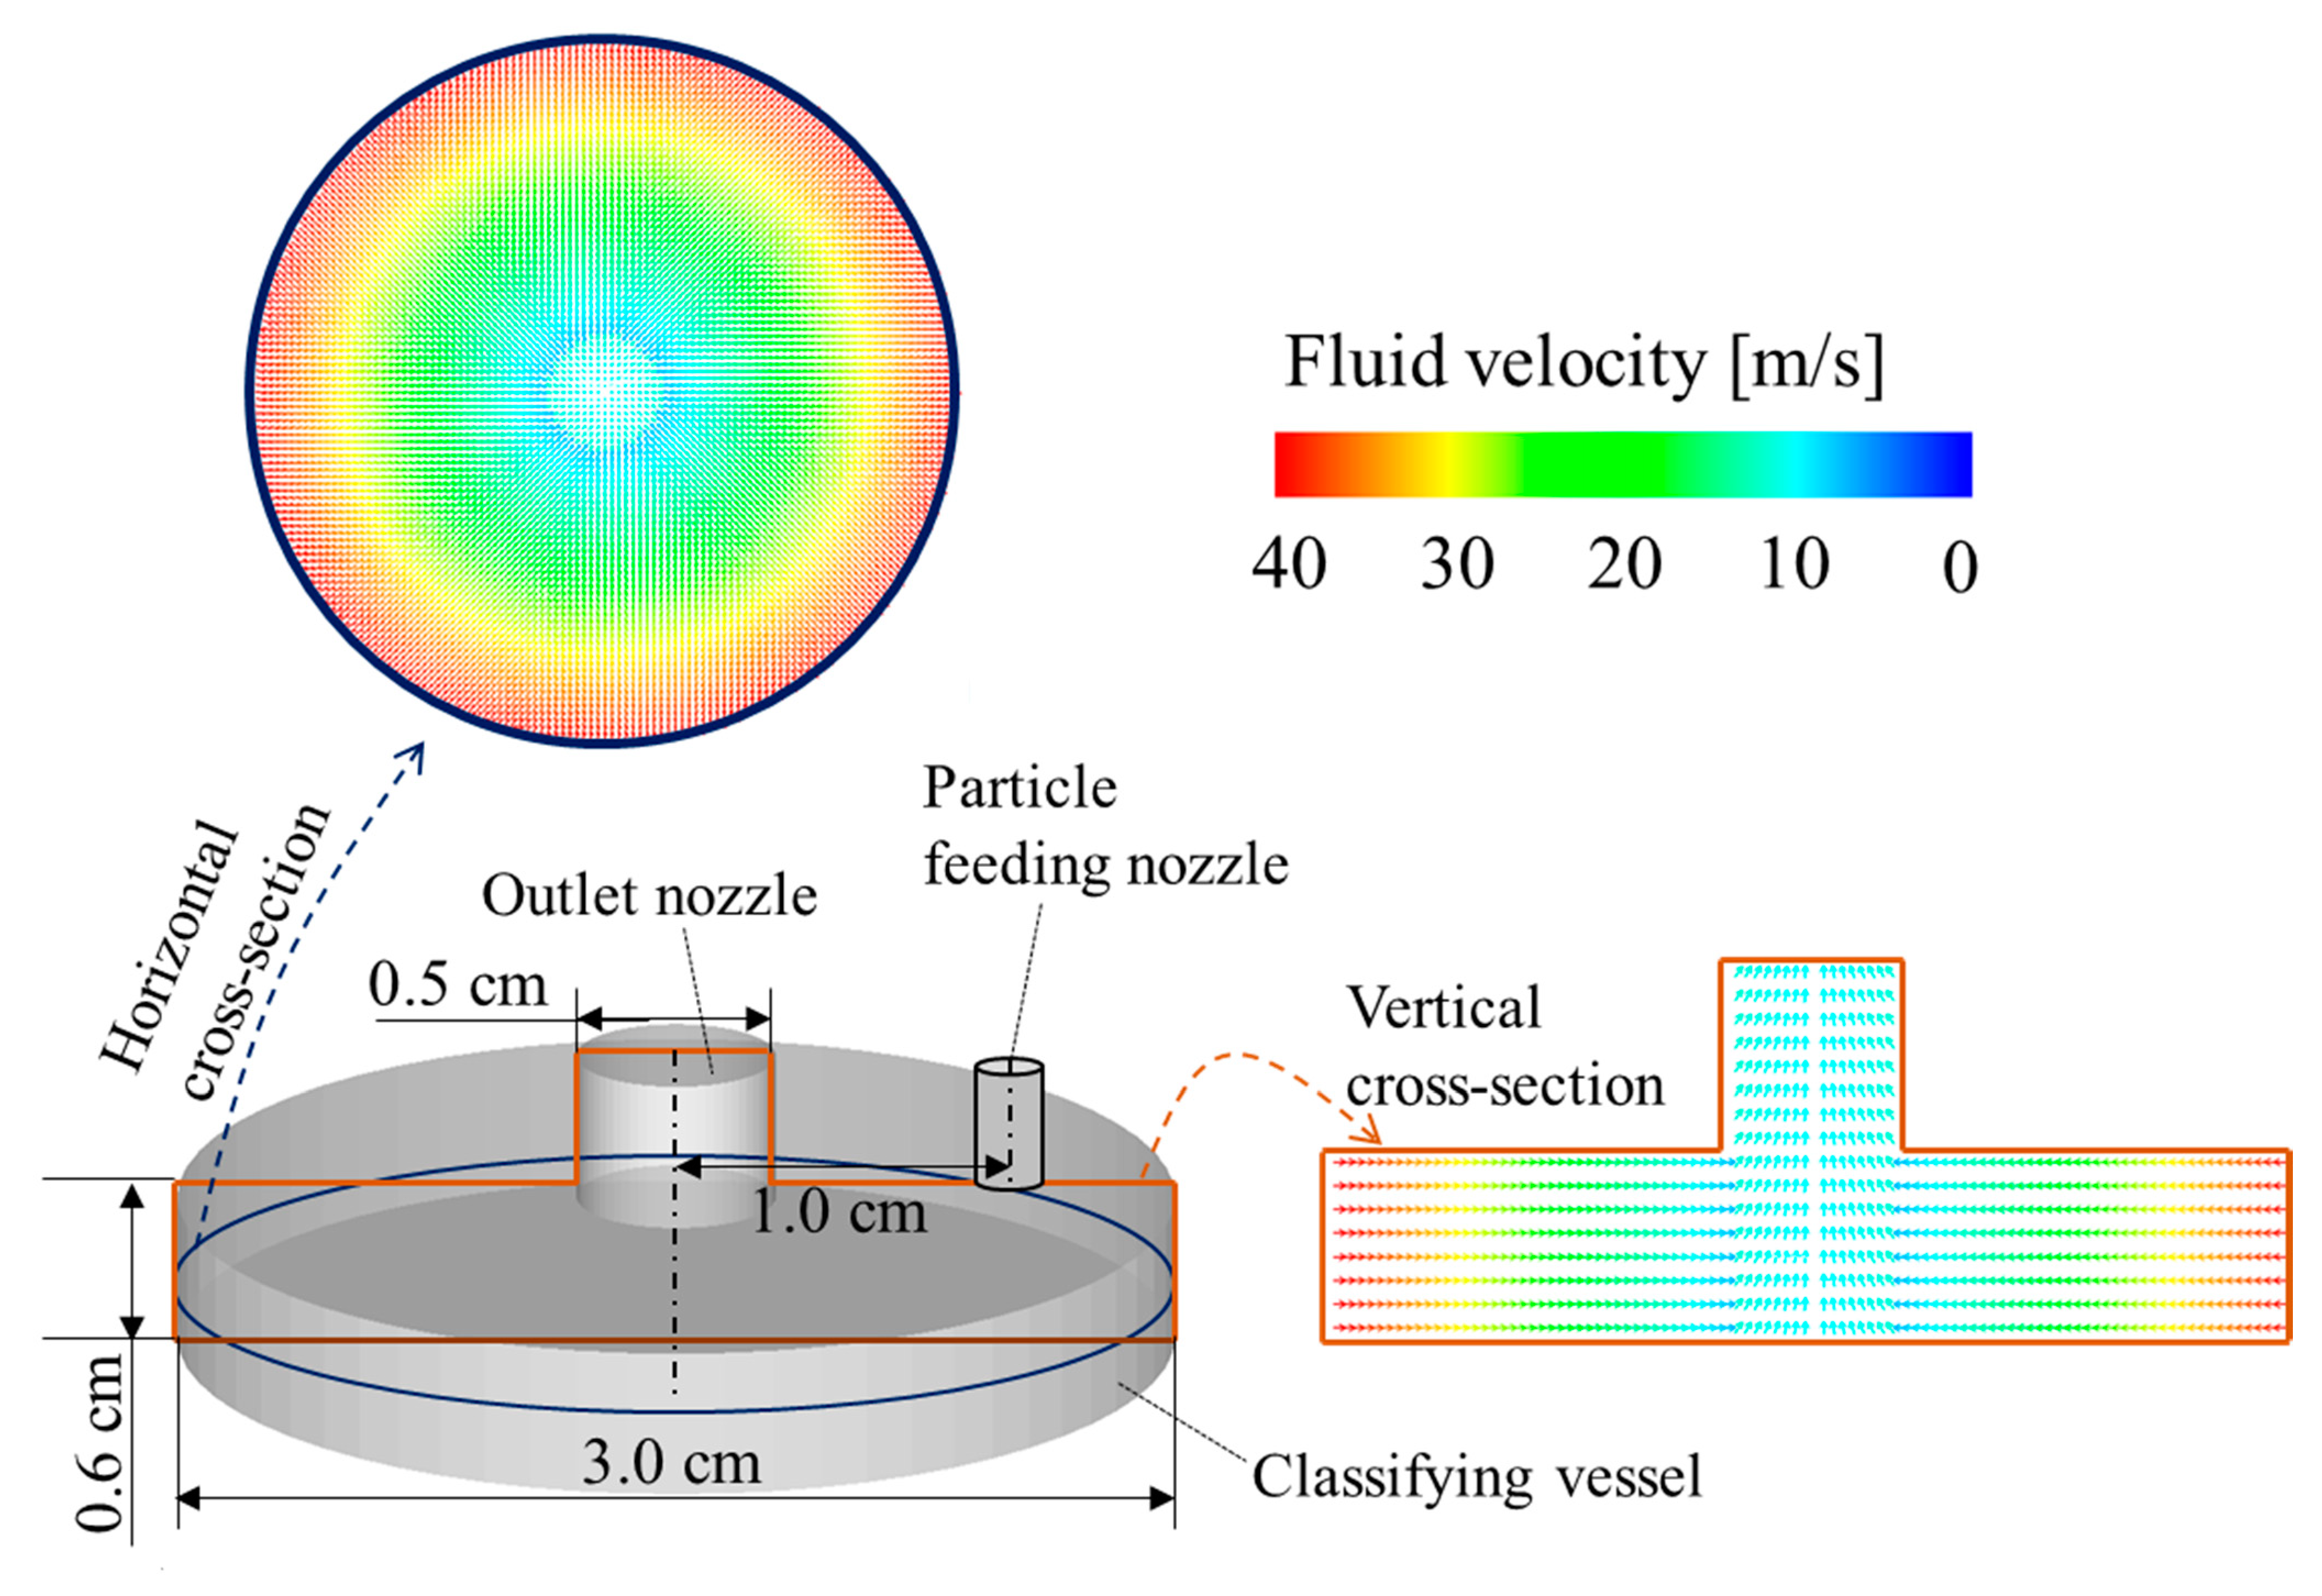
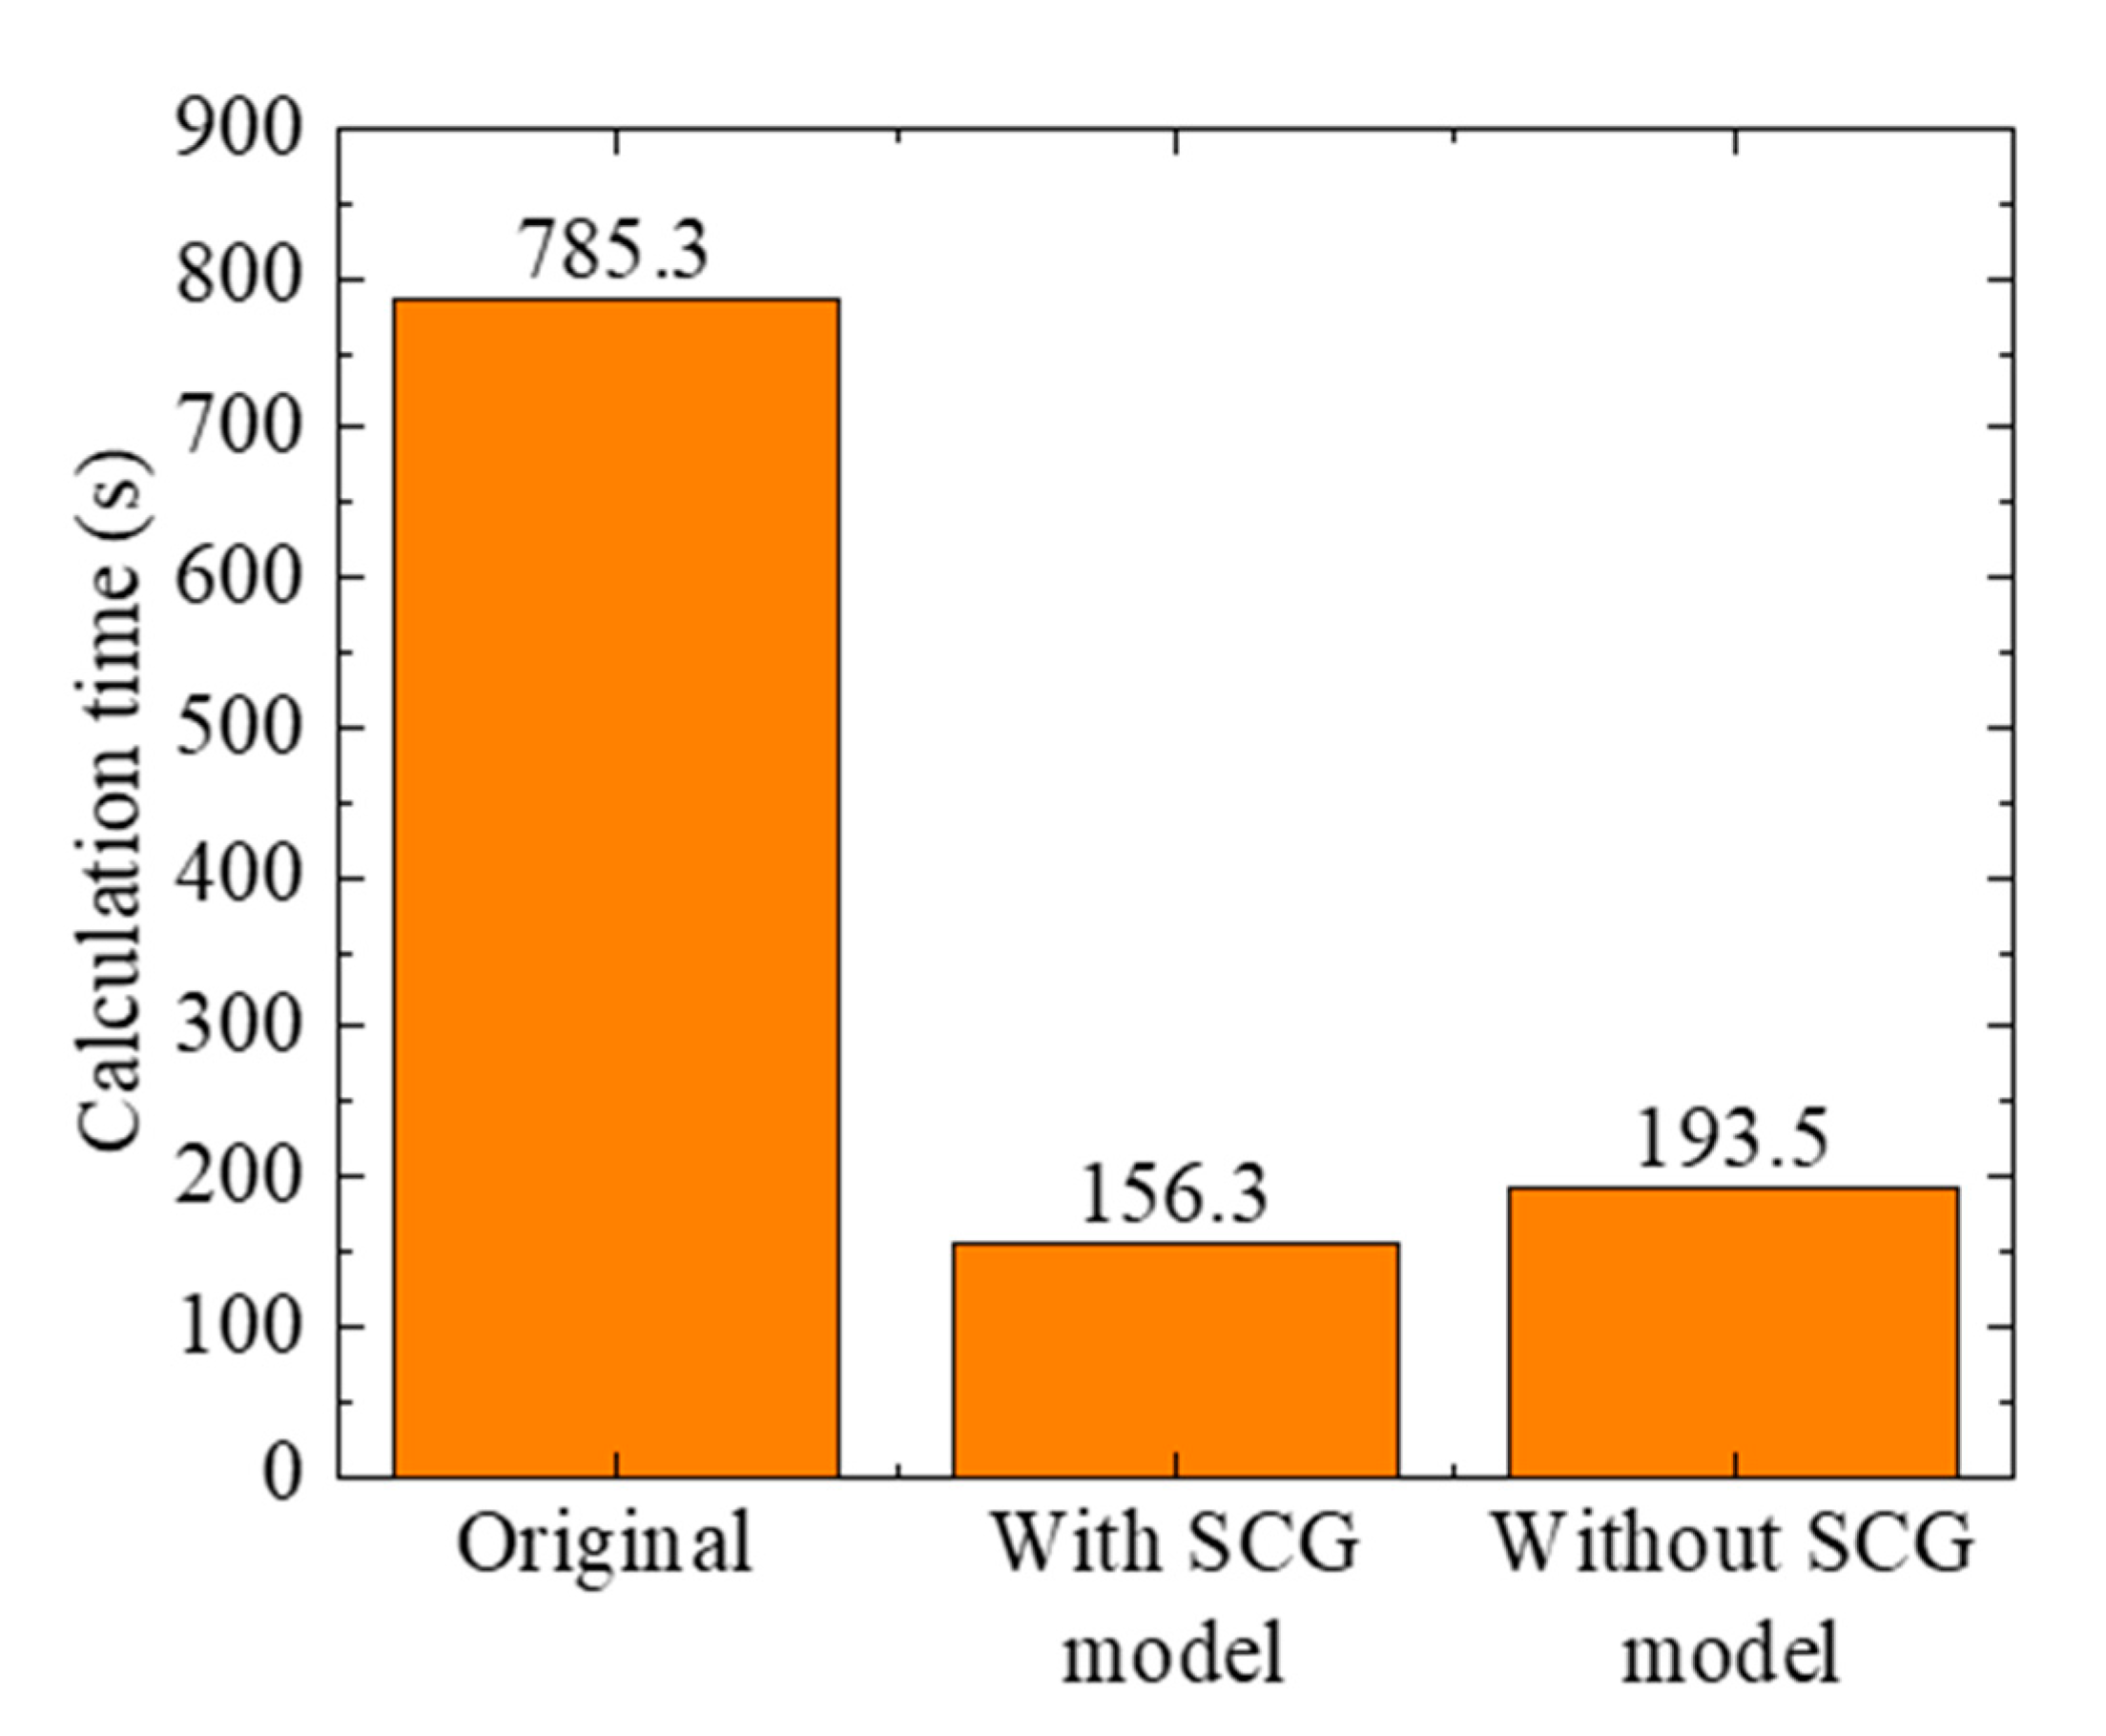
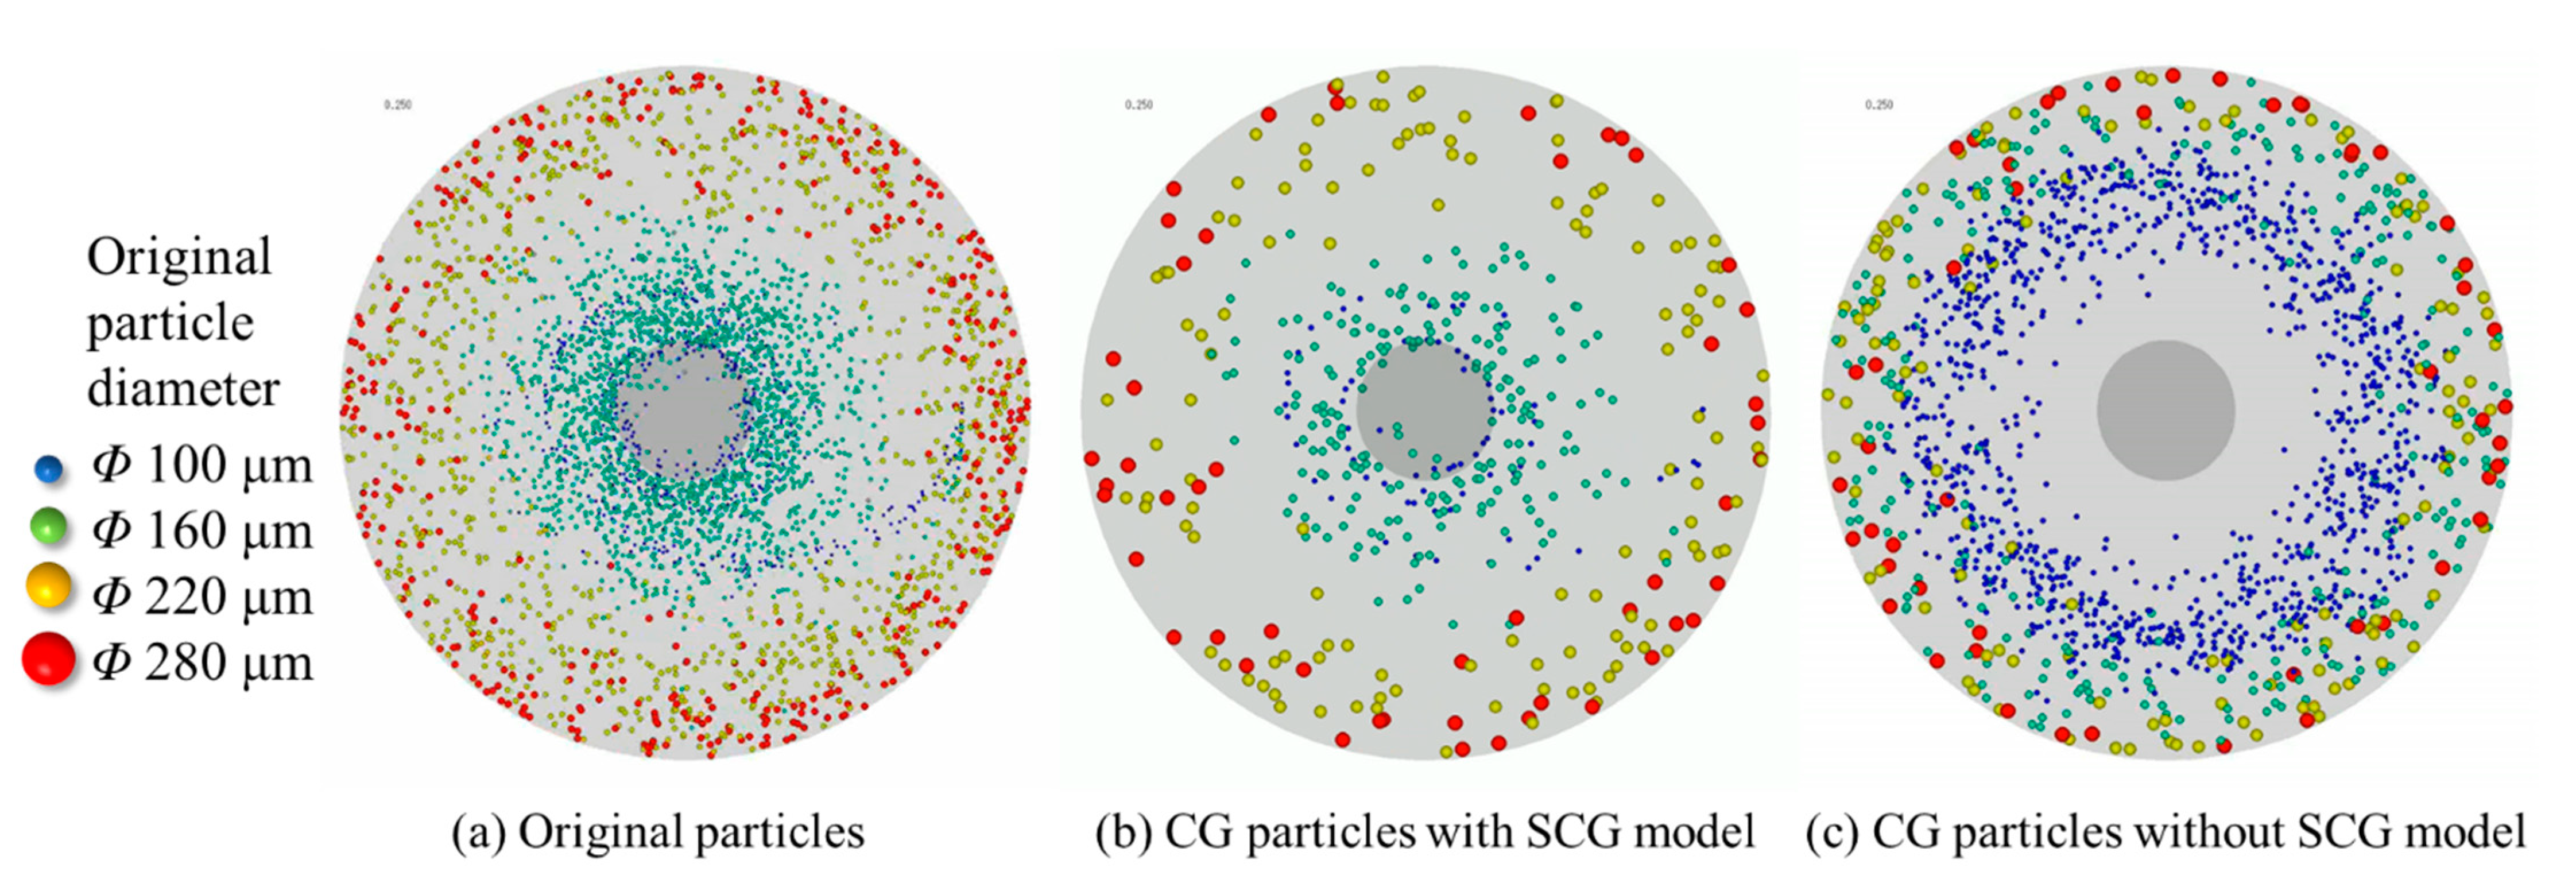
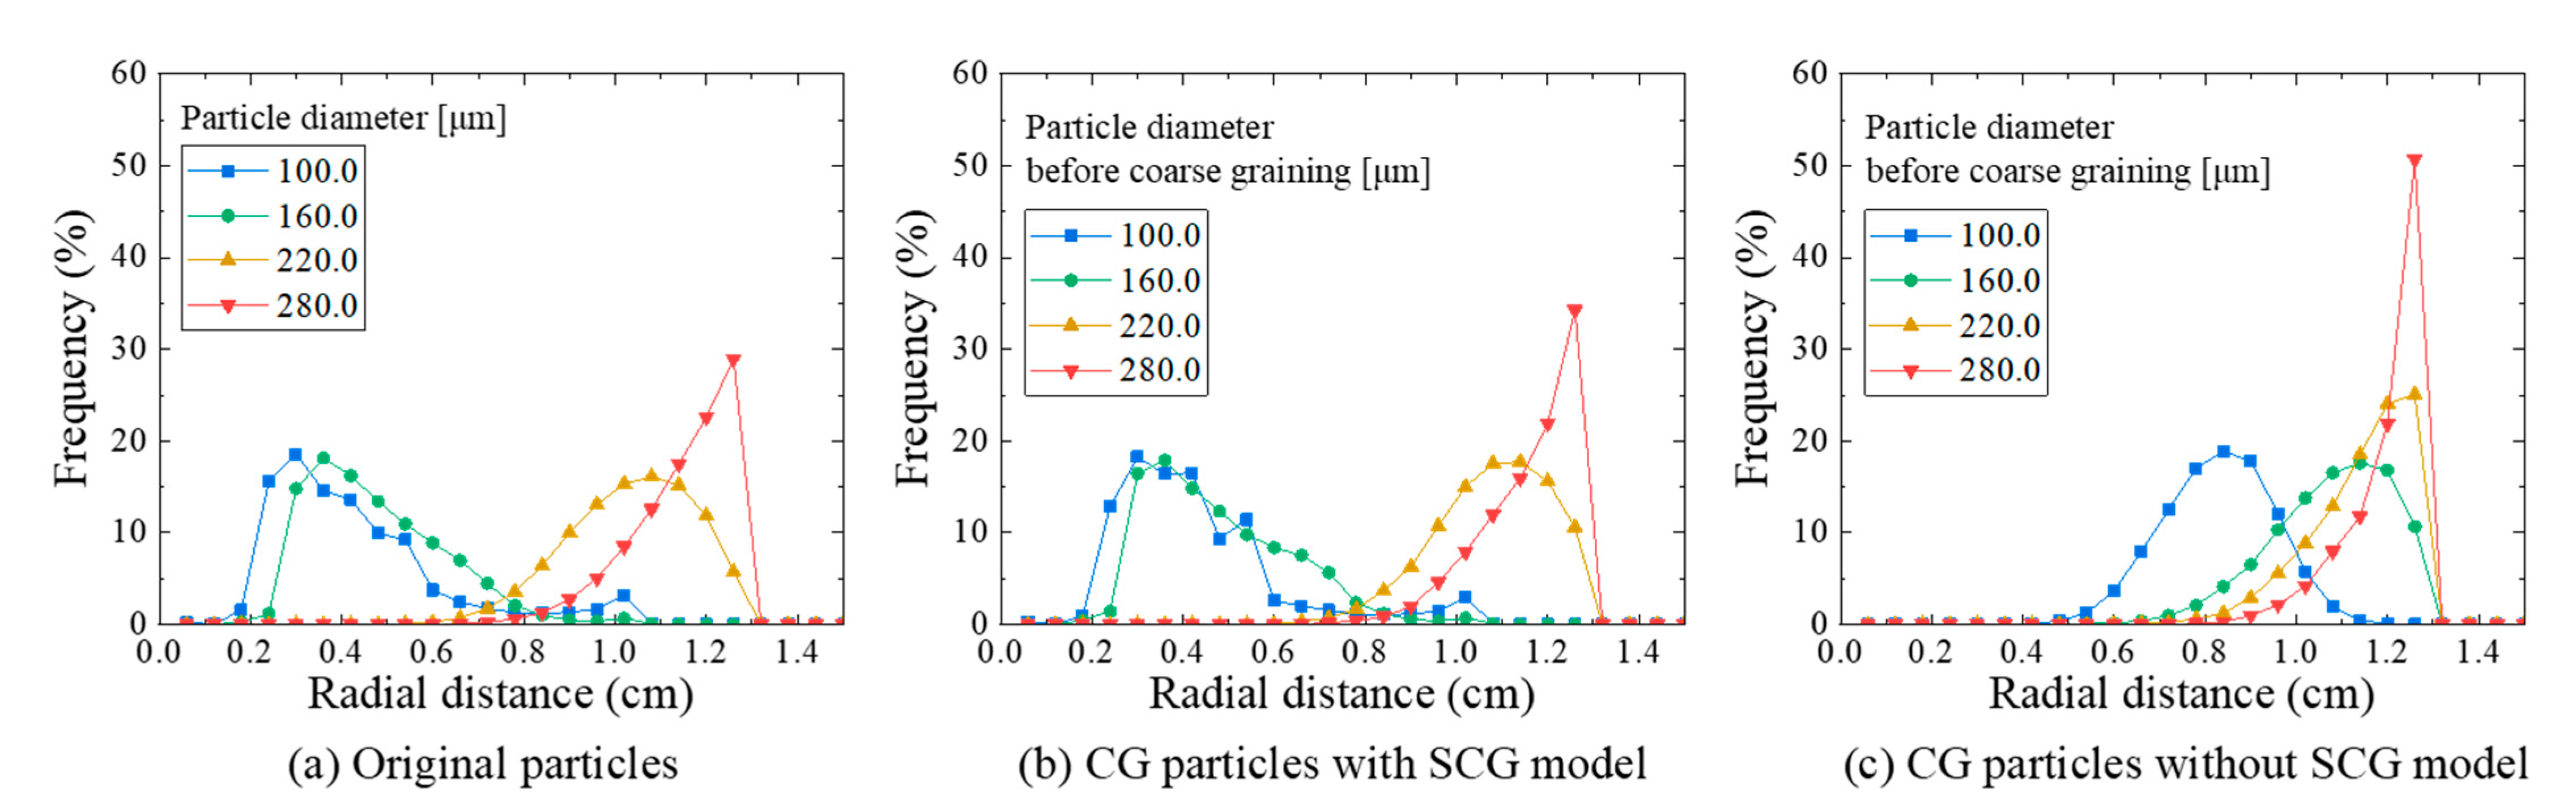
5. Comparison of Particle Behavior in Classifier

The behaviors of a number of CG particles in a classifier are compared with the behaviors of original particles to confirm the usability of the SCG model for representing the particle behavior as closely as possible to the real dilute systems. Figure 7 shows the geometry of the classifier and fluid velocity field in the classifier. The CG and the original particles are fed from the upper wall of the classifying vessel, and the 7.0 m/s feeding velocity is given to all of the particles. The flow field is created by superposing the forced-vortex field with the flow field toward the classifying vessel’s center. In this case, the rotational speed of the forced-vortex is set to 5000 rpm, and the speed of the field toward the center is set to five times of the flow velocity in the forced-vortex field. Further, the 1.0 m/s constant vertical flow velocity is set where the radial distance from the center is below the outlet nozzle radius, and the classified smaller particles are drained from the outlet nozzle.
Table 3 shows the simulation conditions. The particles with four different diameters are used to observe the classifying behavior. The volume ratio for each particle diameter is the same, and the total feeding volume of the CG particles and the original particles are also the same. The diameters of the CG particles are set to twice the diameters of the original particles. The CG particle densities are calculated by Equation (7). The fluid density and viscosity are set to 1.2   kg / m 3 and 1.8 × 10 5   Pa · s, respectively.
Figure 8 shows the comparison of the calculation time for representing the behaviors of the original particles and the CG particles with and without the SCG model for 0.1 s. The calculation time for representing the behavior of the CG particles with the SCG model is approximately one-fifth shorter than that of the original particles. This indicates that the SCG model can reduce the calculation time.
Figure 9 shows three patterns of particle behaviors in the classifier after 0.25 s passed: the original particle behavior and the CG particle behaviors with the SCG model and without the SCG model. The motions of the original particles are different depending on each particle diameter; the particles’ existing radial distances increase with the increase of the particle diameter due to the centrifugal forces being strengthened. Additionally, a part of the smaller particles (100.0 and 160.0 mm) is drained from the outlet nozzle. The CG particle motions with the SCG model are similar to the original particles. However, the CG particles without the SCG model revolve at the places of the longer radial distances than the original particles and the particles are rarely drained from the outlet nozzle. To confirm the similarity in particle behavior, radial distance distributions are calculated. Figure 10 shows the radial distance distributions for each particle diameter of the original particles and the CG particles with the SCG model and without the SCG model. The distributions are cumulated for 0.1 s after 0.2 s passed. The radial distance distributions of the original particles are roughly separated by the particle diameters: the smaller particles (100.0 and 160.0 mm) revolve at the place of the shorter radial distance, while the larger particles (220.0 and 280.0 mm) revolve at the place of the longer radial distance. Namely, the original particles are classified by the classification effect, and the classifying particle diameter of the original particles is between 160.0 and 220.0 mm. The radial distance distributions of the CG particles with the SCG model are similar to those of the original particles for all particle diameters, while those of the CG particles without the SCG model differ from the original particles. This indicates that the SCG model can analyze the classification effect and the motion of the particles in the classifier, and that the SCG model could be applied to simulate a real dilute system that has a number of particles and different particle diameters. Moreover, the Stokes number S t is approximately 10–100 in the simulation conditions of this section. It is suggested that the SCG model can be applied even though particle collisions occasionally occurred.

6. Conclusions

We developed the simple coarse-grain (SCG) model for the fluid drag force, intending to analyze the particle behavior in the dilute particle-concentration systems by using the DEM simulation. In the SCG model, the CG particles moved in the same way and speeds of the original particles in fluid flow by changing the CG particle density to follow ρ p d 2 = const . The features of the SCG model are summarized as follows:
(1)
The model can be implemented without changing simulation codes because the CG particle density is only changed to follow ρ p d 2 = const .;
(2)
Physical meaning of the model is simple because the CG particle density is only modeled such that the acceleration of the CG particles is the same as that of the original particle;
(3)
The model is specialized to the particle behavior in the dilute particle-concentration systems in which the particles rarely collide.
Furthermore, it was confirmed that the behaviors of the CG particles coincided with those of the original particles in the uniform, the vortex flow fields, and in the classifier. Therefore, the particle behavior in dilute particle-concentration systems would be analyzed more simply with the proposed SCG model. In the future, we will confirm that the SCG model can used to represent the particle behaviors in actual processes.

Author Contributions

Writing—Original Draft Preparation, K.K.; Software, K.S. and K.K.; Investigation, K.S. and K.K.; Supervision, S.I., R.S., K.O. and J.K; Writing—review & editing, K.S., S.I., R.S., K.O. and J.K. All authors have read and agreed to the published version of the manuscript.

Funding

This research was funded by “Development of magnetic material technology for high efficiency motors” commissioned by the New Energy and Industrial Technology Development Organization (NEDO).

Institutional Review Board Statement

Not applicable.

Informed Consent Statement

Not applicable.

Acknowledgments

This paper is based on a part of results obtained from the future pioneering program “Development of magnetic material technology for high efficiency motors” commissioned by the New Energy and Industrial Technology Development Organization (NEDO).

Conflicts of Interest

The authors declare no conflict of interest.

Appendix A

The mass-equivalent model, in which the CG particle densities are changed such that the CG particle masses are equal to the original particle one, is also conceivable. Thus, the CG particle behaviors using the mass-equivalent model compared with the original particle behavior on the uniform flow field is in the same manner of the discussion in Section 4. Figure A1 and Figure A2 show the particle behaviors and particle speeds, respectively. It is found that the movements of the CG particles are different from that of the original particle.
Figure A1. Comparison of particle behaviors on uniform flow field represented by DEM when the CG particle masses equal to the original particle.
Processes 09 01098 g0a1
Figure A2. Comparison of particle speeds on uniform flow field represented by DEM when the CG particle masses equal to the original particle.
Processes 09 01098 g0a2

References

  1. Barrios, G.; de Carvalho, R.M.; Kwade, A.; Tavares, L.M. Contact parameter estimation for DEM simulation of iron ore pellet handling. Powder Technol. 2013, 248, 84–93. [Google Scholar] [CrossRef]
  2. Elskamp, F.; Kruggel-Emden, H. Review and benchmarking of process models for batch screening based on discrete element simulations. Adv. Powder Technol. 2015, 26, 679–697. [Google Scholar] [CrossRef]
  3. Wu, K.; Sun, W.; Liu, S.; Zhang, X. Study of shear behavior of granular materials by 3D DEM simulation of the triaxial test in the membrane boundary condition. Adv. Powder Technol. 2021, 32, 1145–1156. [Google Scholar] [CrossRef]
  4. Ishihara, S.; Kushimoto, K.; Kano, J. Analysis of the Effect of Ventilation Bars on the Packing Structure of Sinter Bed by DEM Simulation. Energies 2020, 13, 3836. [Google Scholar] [CrossRef]
  5. Kobayakawa, M.; Miyai, S.; Tsuji, T.; Tanaka, T. Interaction between dry granular materials and an inclined plate (comparison between large-scale DEM simulation and three-dimensional wedge model). J. Terramech. 2020, 90, 3–10. [Google Scholar] [CrossRef]
  6. Paulick, M.; Morgeneyer, M.; Kwade, A. Review on the influence of elastic particle properties on DEM simulation results. Powder Technol. 2015, 283, 66–76. [Google Scholar] [CrossRef]
  7. Kushimoto, K.; Ishihara, S.; Pinches, S.; Sesso, M.L.; Usher, S.P.; Franks, G.V.; Kano, J. Development of a method for determining the maximum van der Waals force to analyze dispersion and aggregation of particles in a suspension. Adv. Powder Technol. 2020, 31, 2267–2275. [Google Scholar] [CrossRef]
  8. Taya, S.; Natsui, S.; De Castro, J.A.; Nogami, H. Numerical Analysis of Raceway Formation in Isothermal and Non-reactive Packed Bed. ISIJ Int. 2020, 60, 2669–2677. [Google Scholar] [CrossRef]
  9. Ono, K.; Kushimoto, K.; Ishihara, S.; Kano, J. Development of the Simulation for Deformation Behavior of Metal Particles by Distinct Element Method. J. Soc. Powder Technol. Jpn. 2019, 56, 58–65. [Google Scholar] [CrossRef] [Green Version]
  10. Murugaratnam, K.; Utili, S.; Petrinic, N. A combined DEM–FEM numerical method for Shot Peening parameter optimisation. Adv. Eng. Softw. 2015, 79, 13–26. [Google Scholar] [CrossRef]
  11. Natsui, S.; Hirai, A.; Terui, K.; Kashihara, Y.; Murao, A.; Miki, Y.; Nogami, H. Method for Simulating Gas Permeability of a Coke Bed Including Fines Based on 3D Imaging on the Coke Particle Morphology. ISIJ Int. 2021, 61, 1814–1825. [Google Scholar] [CrossRef]
  12. Ishihara, S.; Kano, J. Development of ADEM-SPH Coupling Model for Analysis of Solid to Liquid Phase Transition Behaviors. ISIJ Int. 2020, 60, 1469–1478. [Google Scholar] [CrossRef]
  13. Cundall, P.A.; Strack, O.D.L. A discrete numerical model for granular assemblies. Géotechnique 1979, 29, 47–65. [Google Scholar] [CrossRef]
  14. Washino, K.; Hsu, C.-H.; Kawaguchi, T.; Tsuji, Y. Similarity Model for DEM Simulation of Fluidized Bed. J. Soc. Powder Technol. Jpn. 2007, 44, 198–205. [Google Scholar] [CrossRef]
  15. Sakano, M.; Yaso, T.; Nakanishi, H. Numerical simulation of two-dimensional fluidized bed using discrete element method with imaginary sphere model. Jpn. J. Multiph. Flow 2000, 14, 66–73. [Google Scholar] [CrossRef]
  16. Kuwagi, K.; Takeda, H.; Horio, M. The similar particle assembly (SPA) model: An approach to large-scale discrete element (DEM) simulation. In Proceedings of the International Conference on Fluidization Engineering XI, Ischia, Naples, 9–14 May 2004; pp. 243–250. [Google Scholar]
  17. Mokhtar, M.A.; Kuwagi, K.; Takami, T.; Hirano, H.; Horio, M. Validation of the similar particle assembly (SPA) model for the fluidization of Geldart’s group A and D particles. AIChE J. 2011, 58, 87–98. [Google Scholar] [CrossRef]
  18. Lin, J.; Luo, K.; Wang, S.; Hu, C.; Fan, J. An augmented coarse-grained CFD-DEM approach for simulation of fluidized beds. Adv. Powder Technol. 2020, 31, 4420–4427. [Google Scholar] [CrossRef]
  19. Sakai, M.; Abe, M.; Shigeto, Y.; Mizutani, S.; Takahashi, H.; Viré, A.; Percival, J.R.; Xiang, J.; Pain, C.C. Verification and validation of a coarse grain model of the DEM in a bubbling fluidized bed. Chem. Eng. J. 2014, 244, 33–43. [Google Scholar] [CrossRef]
  20. Hilton, J.E.; Cleary, P. Comparison of non-cohesive resolved and coarse grain DEM models for gas flow through particle beds. Appl. Math. Model. 2014, 38, 4197–4214. [Google Scholar] [CrossRef]
  21. Hu, C.; Luo, K.; Wang, S.; Sun, L.; Fan, J. Influences of operating parameters on the fluidized bed coal gasification process: A coarse-grained CFD-DEM study. Chem. Eng. Sci. 2019, 195, 693–706. [Google Scholar] [CrossRef]
  22. Sakai, M.; Koshizuka, S.; Takeda, H. Development of Advanced Representative Particle Model-Application of DEM Simulation to Large-scale Powder Systems. J. Soc. Powder Technol. Jpn. 2006, 43, 4–12. [Google Scholar] [CrossRef] [Green Version]
  23. Jiang, Z.; Rai, K.; Tsuji, T.; Washino, K.; Tanaka, T.; Oshitani, J. Upscaled DEM-CFD model for vibrated fluidized bed based on particle-scale similarities. Adv. Powder Technol. 2020, 31, 4598–4618. [Google Scholar] [CrossRef]
  24. Di Renzo, A.; Napolitano, E.; Di Maio, F. Coarse-Grain DEM Modelling in Fluidized Bed Simulation: A Review. Processes 2021, 9, 279. [Google Scholar] [CrossRef]
  25. Nagata, Y.; Minagawa, M.; Hisatomi, S.; Tsunazawa, Y.; Okuyama, K.; Iwamoto, M.; Sekine, Y.; Tokoro, C. Investigation of optimum design for nanoparticle dispersion in centrifugal bead mill using DEM-CFD simulation. Adv. Powder Technol. 2019, 30, 1034–1042. [Google Scholar] [CrossRef]
  26. Washino, K.; Chan, E.L.; Kaji, T.; Matsuno, Y.; Tanaka, T. On large scale CFD–DEM simulation for gas–liquid–solid three-phase flows. Particuology 2020. [Google Scholar] [CrossRef]
  27. Queteschiner, D.; Lichtenegger, T.; Pirker, S.; Schneiderbauer, S. Multi-level coarse-grain model of the DEM. Powder Technol. 2018, 338, 614–624. [Google Scholar] [CrossRef]
  28. Che, H.; O’Sullivan, C.; Sufian, A.; Smith, E.R. A novel CFD-DEM coarse-graining method based on the Voronoi tessellation. Powder Technol. 2021, 384, 479–493. [Google Scholar] [CrossRef]
  29. Chu, K.; Chen, J.; Yu, A. Applicability of a coarse-grained CFD–DEM model on dense medium cyclone. Miner. Eng. 2016, 90, 43–54. [Google Scholar] [CrossRef]
  30. Chan, E.L.; Washino, K. Coarse grain model for DEM simulation of dense and dynamic particle flow with liquid bridge forces. Chem. Eng. Res. Des. 2018, 132, 1060–1069. [Google Scholar] [CrossRef]
  31. Nakamura, H.; Takimoto, H.; Kishida, N.; Ohsaki, S.; Watano, S. Coarse-grained discrete element method for granular shear flow. Chem. Eng. J. Adv. 2020, 4, 100050. [Google Scholar] [CrossRef]
  32. Crowe, C.T.; Schwarzkopf, J.D.; Sommerfeld, M.; Tsuji, Y. Multiphase Flows with Droplets and Particles, 2nd ed.; CRC Press: New York, NY, USA, 2011; pp. 26–29. [Google Scholar]
Figure 1. Initial positions of original and CG particles and schematic diagram of uniform flow field.
Processes 09 01098 g001
Figure 2. Comparison of particle behaviors on uniform flow field represented by DEM with and without the SCG model.
Processes 09 01098 g002
Figure 3. Comparison of the particle speeds on uniform flow field represented by DEM with and without the coarse-grain model.
Processes 09 01098 g003
Figure 4. Initial positions of the original and the CG particles and schematic diagram of vortex flow field.
Processes 09 01098 g004
Figure 5. Comparison of the particle trajectories from 0.0 to 3.0 s on vortex flow field represented by DEM with and without the SCG model.
Processes 09 01098 g005
Figure 6. Comparison of the particle speeds in vortex flow field represented by DEM with and without the SCG model.
Processes 09 01098 g006
Figure 7. Geometry of the classifier and the flow field.
Processes 09 01098 g007
Figure 8. Comparison of calculation time for representing the behaviors of the original particles and the CG particles with and without the SCG model for 0.1 s.
Processes 09 01098 g008
Figure 9. Snapshot of particle behaviors in the classifier after 0.25 s passed.
Processes 09 01098 g009
Figure 10. Radial distance distributions for each particle diameter in the classifier.
Processes 09 01098 g010
Table 1. Simulation conditions (uniform flow field).
Particle Diameter [mm]Particle Density [g/cm3]
Without SCG ModelWith SCG Model
1.0 (original particle)1.01.0
2.01.00.25
4.01.00.0625
8.01.00.015625
Table 2. Simulation conditions (vortex flow field).
Particle Diameter [μm]Particle Density [g/cm3]
Without SCG ModelWith SCG Model
10.0 (original particle)1.01.0
20.01.00.25
40.01.00.0625
80.01.00.015625
Table 3. Simulation conditions for particles in the classifier.
Original particle
Diameter100, 160, 220, 280μm
Density0.1g/cm3
CG particles with SCG model
Diameter200, 320, 440, 560μm
Density0.025g/cm3
CG particles without SCG model
Diameter200, 320, 440, 560μm
Density0.1g/cm3
Publisher’s Note: MDPI stays neutral with regard to jurisdictional claims in published maps and institutional affiliations.

