Article

Impact of Abiotic Stresses (Nitrogen Reduction and Salinity Conditions) on Phenolic Compounds and Antioxidant Activity of Strawberries

by
José L. Ordóñez-Díaz
1,*,
Vanessa Cardeñosa
1,
José M. Muñoz-Redondo
1,
Federico Ferreres
2,
Gema Pereira-Caro
1,
Evangelina Medrano
3,
José M. Moreno-Rojas
1,* and
Diego A. Moreno
4
1
Department of Food Science and Health, Andalusian Institute of Agricultural and Fishering Research and Training (IFAPA) Alameda del Obispo, Avda. Menéndez-Pidal s/n., 14004 Córdoba, Spain
2
Department of Food Technology and Nutrition, Molecular Recognition and Encapsulation, Grupo REM, Campus de los Jerónimos, Universidad Católica de Murcia (UCAM), 30107 Guadalupe, Murcia, Spain
3
Department of Agri-Food Engineering and Technology, Andalusian Institute of Agricultural and Fishering Research and Training (IFAPA) La Mojonera, Camino San Nicolás 1, La Mojonera, 04745 Almería, Spain
4
Phytochemistry and Healthy Foods Lab., Department of Food Science and Technology, CEBAS-CSIC, Campus de Espinardo-Edificio 25, 30100 Murcia, Spain
*
Authors to whom correspondence should be addressed.
Processes 2021, 9(6), 1044; https://doi.org/10.3390/pr9061044
Submission received: 4 May 2021 / Revised: 1 June 2021 / Accepted: 9 June 2021 / Published: 15 June 2021
(This article belongs to the Special Issue Phenolic Profiling and Antioxidant Capacity in Agrifood Products)

Abstract

:
This study evaluated the phenolic profile and the antioxidant capacity of strawberries (Fragaria x ananassa Duch., cv. Primoris) cultivated under reduction of nitrogen and adverse irrigation conditions (high salinity), such as those prevailing in Almeria (south-eastern Spain). The phenolic compound and anthocyanin profiles were analysed by HPLC-DAD-ESI/MSn, and the antioxidant activity. Nineteen phenolic compounds were quantified, mainly ellagitannins, anthocyanins, and flavan-3-ols. The total phenolic content ranged from 731 to 1521 mg/100 g of dried weight. The flavan-3-ols group compounds from the strawberries were positively affected by saline stress, especially the afz-(e)Catechin content in the first sampling. The reduction of nitrogen and the adverse irrigation conditions for the cultivation of strawberries (cv. Primoris) partially affected the phenolic composition, with the harvesting dates having a greater influence.

1. Introduction

In recent decades, researchers and food manufacturers have become increasingly interested in bioactive compounds because of their abundance in our diet, as well as the recommendations to consume a diet rich in fruits and vegetables containing antioxidants that counteract the oxidative damage to biological targets [1,2,3,4]. Their consumption is associated with the prevention of human diseases, such as cardiovascular diseases, chronic inflammation, or cancer [4,5,6].
Strawberry (Fragaria x ananassa Duch.) is one of the most usually consumed berries, eaten either fresh or processed [7,8], and is an important source of nutrients and bioactive compounds, such as organic acids, vitamins, or phenolic compounds [9,10]. The wide array of phenolic compounds in this fruit include hydroxycinnamic acids (p-coumaric), hydroxybenzoic acids (gallic and ellagic acids), hydrolysable tannins (ellagitannins), flavan-3-ols (catechins), flavonols (quercetin, kaempferol, and myricetin), and anthocyanins, with pelargonidin–3–glycoside as the major compound [11]. Among them, anthocyanins are quantitatively the main phenolic compounds in strawberries and are responsible for their bright red color and significantly affect therefore their acceptability and organoleptic characteristics such as visual quality (good color or undesirable browning) and taste (astringency or flavor) [12,13].
Several factors may affect the phenolic contents of fruit, including genotype, physiological status (e.g., ripeness at harvest), environmental parameters during growth, as well as postharvest processing and storage practices [14,15]. In general, the phenolic acid content of fruits may decrease during ripening, whereas anthocyanin levels may increase [16]. Furthermore, these contents are also affected by environmental factors such as pedoclimatic or agronomic factors, including types of growth conditions under protected greenhouses or in open fields, or their cultivation under conventional production systems or ecological production, and hydroponics [17].
Previous research has reported fruits being obtained that are enriched in bioactive compounds through genetic engineering [18]. However, other alternatives to improve crops and fruit quality by means of enriching the edible organs with bioactive phytochemicals using agronomical practices and avoiding the genetic manipulation of the plants are of increasing interest for a more sustainable approach [13,19,20,21,22,23].
Saline stress is a common situation in the agroecosystems of the Mediterranean basin, where soil-water availability is a limiting factor. Meanwhile, mineral nutrients are essential for plant development; one of them, nitrogen (N), is among the most important components of amino acids, proteins, nucleic acids, chlorophylls, and other metabolites critical for plant survival [24]. However, the nitrogen supply is limited due to the pollution of aquatic systems (aquifers) or soils, particularly in sensitive ecological areas as Almería (south-eastern Spain). Based on this situation, several studies have reported the effect of salt stress and nitrogen supply on nutritional and phytochemical content through cultivation practices. Changes in the nitrogen supply affected the organoleptic properties of strawberries, such as their firmness or soluble solid contents [25]. Another study showed an increase in phenolic compounds induced by salt stress in aromatic plants [26] and medicinal herbs [27], while these compounds were higher in tomato fruits when they had a lower supply of nitrogen [28].
Besides, it is essential to search for an alternative harvesting period for strawberries to avoid the production peaks in Spain from March to May while keeping a high-quality product on the market and improving the existing fruit offer for a longer time. In this context, the aim of this research was to evaluate the phenolic profile and the antioxidant capacity of strawberries (cv. Primoris) cultivated under conditions of reduced nitrogen and adverse irrigation (high salinity) similar to those prevailing in Almería (south-eastern Spain).

2. Materials and Methods

2.1. Fruit Samples

Strawberry samples of Fragaria x 
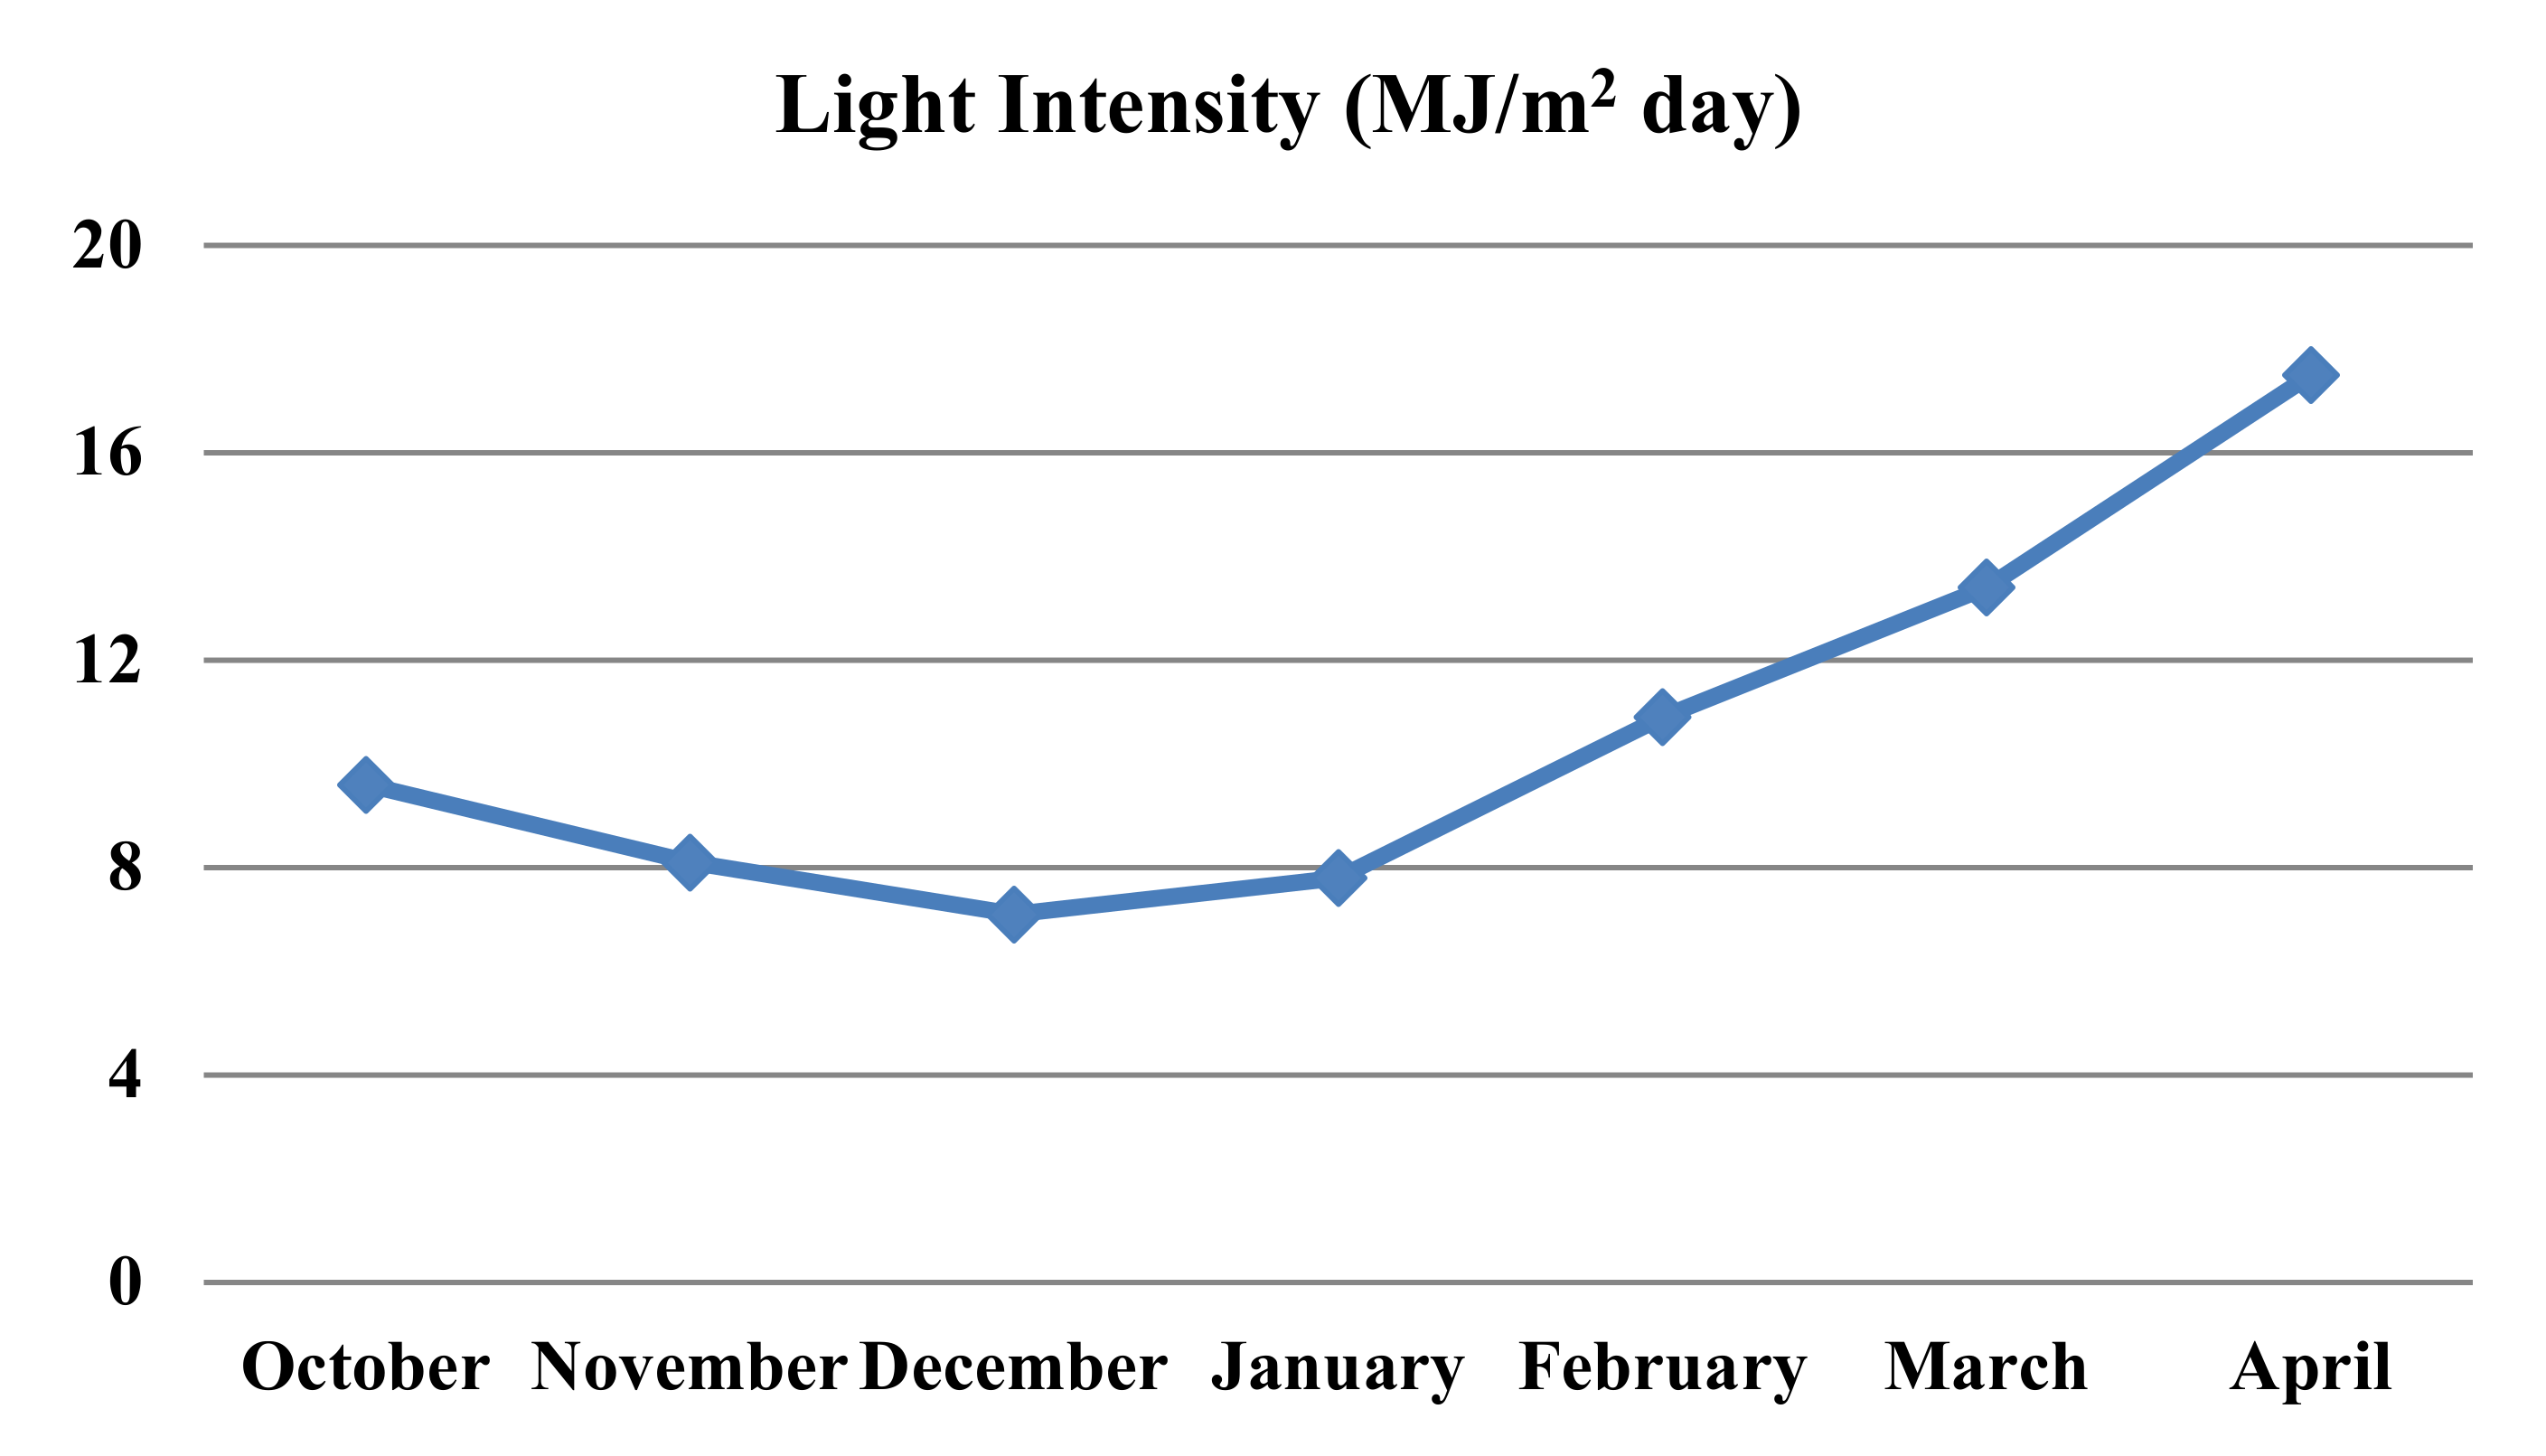
ananassa Duch cv. Primoris were collected from a cultivar area at the “La Mojonera” IFAPA (Almería, Spain, latitude 36°45′ N, longitude 2°42′ W). The plants were raised in a plastic-covered greenhouse (960 m2) from October 2011 to April 2012. The conditions of the hydroponic system and irrigation used to cultivate the strawberry plants were a basic solution with an electrical conductivity (EC) of 1.7 dS/m, 9 mmol/L of nitrogen (N), by using potassium nitrate and calcium nitrate fertigation, and 2 mmol/L of NaCl (r.a.) (added to the irrigation water) during the first steps of development (60 days after transplanting, DAT) [29]. After that period, four different treatments were applied, as shown in Table 1.
Treatments were randomised in a factorial design with 2 factors (N and NaCl) and 2 levels, and 3 replicates were performed per treatment (with 10 strawberries per plot, collected on 3 sampling dates: 16 January, 22 March, and 29 April 2012). All the fruits were collected at commercial maturity, defined as a homogeneous (red) color for the strawberry, which was considered as optimum ripeness. Thus, the fruits were selected using a Minolta CR-400 colorimeter (Minolta, Osaka, Japan), setting the parameter b* in a range between 20 and 30 as an indicator of commercial maturity.

2.2. Chemicals and Reagents

We purchased 2,2–azino–bis (3–ethylbenzothiazoline–6–sulfonic acid) diammonium salt (ABTS), ellagic acid, rutin, and 2,2-Diphenyl-1-picrylhydrazyl (DPPH) from Sigma-Aldrich (Steinheim, Germany). HPLC grade methanol and formic acid were supplied by Scharlau (Sentmenant, Spain). From Fluka Chemika (Neu-Ulm, Switzerland), 6–hydroxy–2,5,7,8–tetramethylchroman–2–carboxylic acid (Trolox) was obtained. Cyanidin–3–glucoside was acquired from Polyphenols AS (Sandnes, Norway).
The Milli-Q water was obtained using an Elix3 Millipore water purification system (Molsheim, France).

2.3. Extraction of Phenolic Compounds

The extraction of the phenolic compounds was performed following the method described by Sánchez-Rodríguez et al. [13], with some modifications. Thus, 0.1 g of lyophilised sample was extracted with 1.5 mL of the mixed solvent of methanol/water/formic acid (50:48:2 v/v/v) by 1h of sonication. After, samples were macerated overnight and were sonicated for 1 h. The extract was centrifuged at 12,000 rpm for 5 min (model EBA 21; Hettich Zentrifugen) and filtered through a 0.22 µm PVDF membrane (Millipore Millex–GV syringe filter). The extracts were transferred into amber glass vials and stored at −80 °C until their analysis.

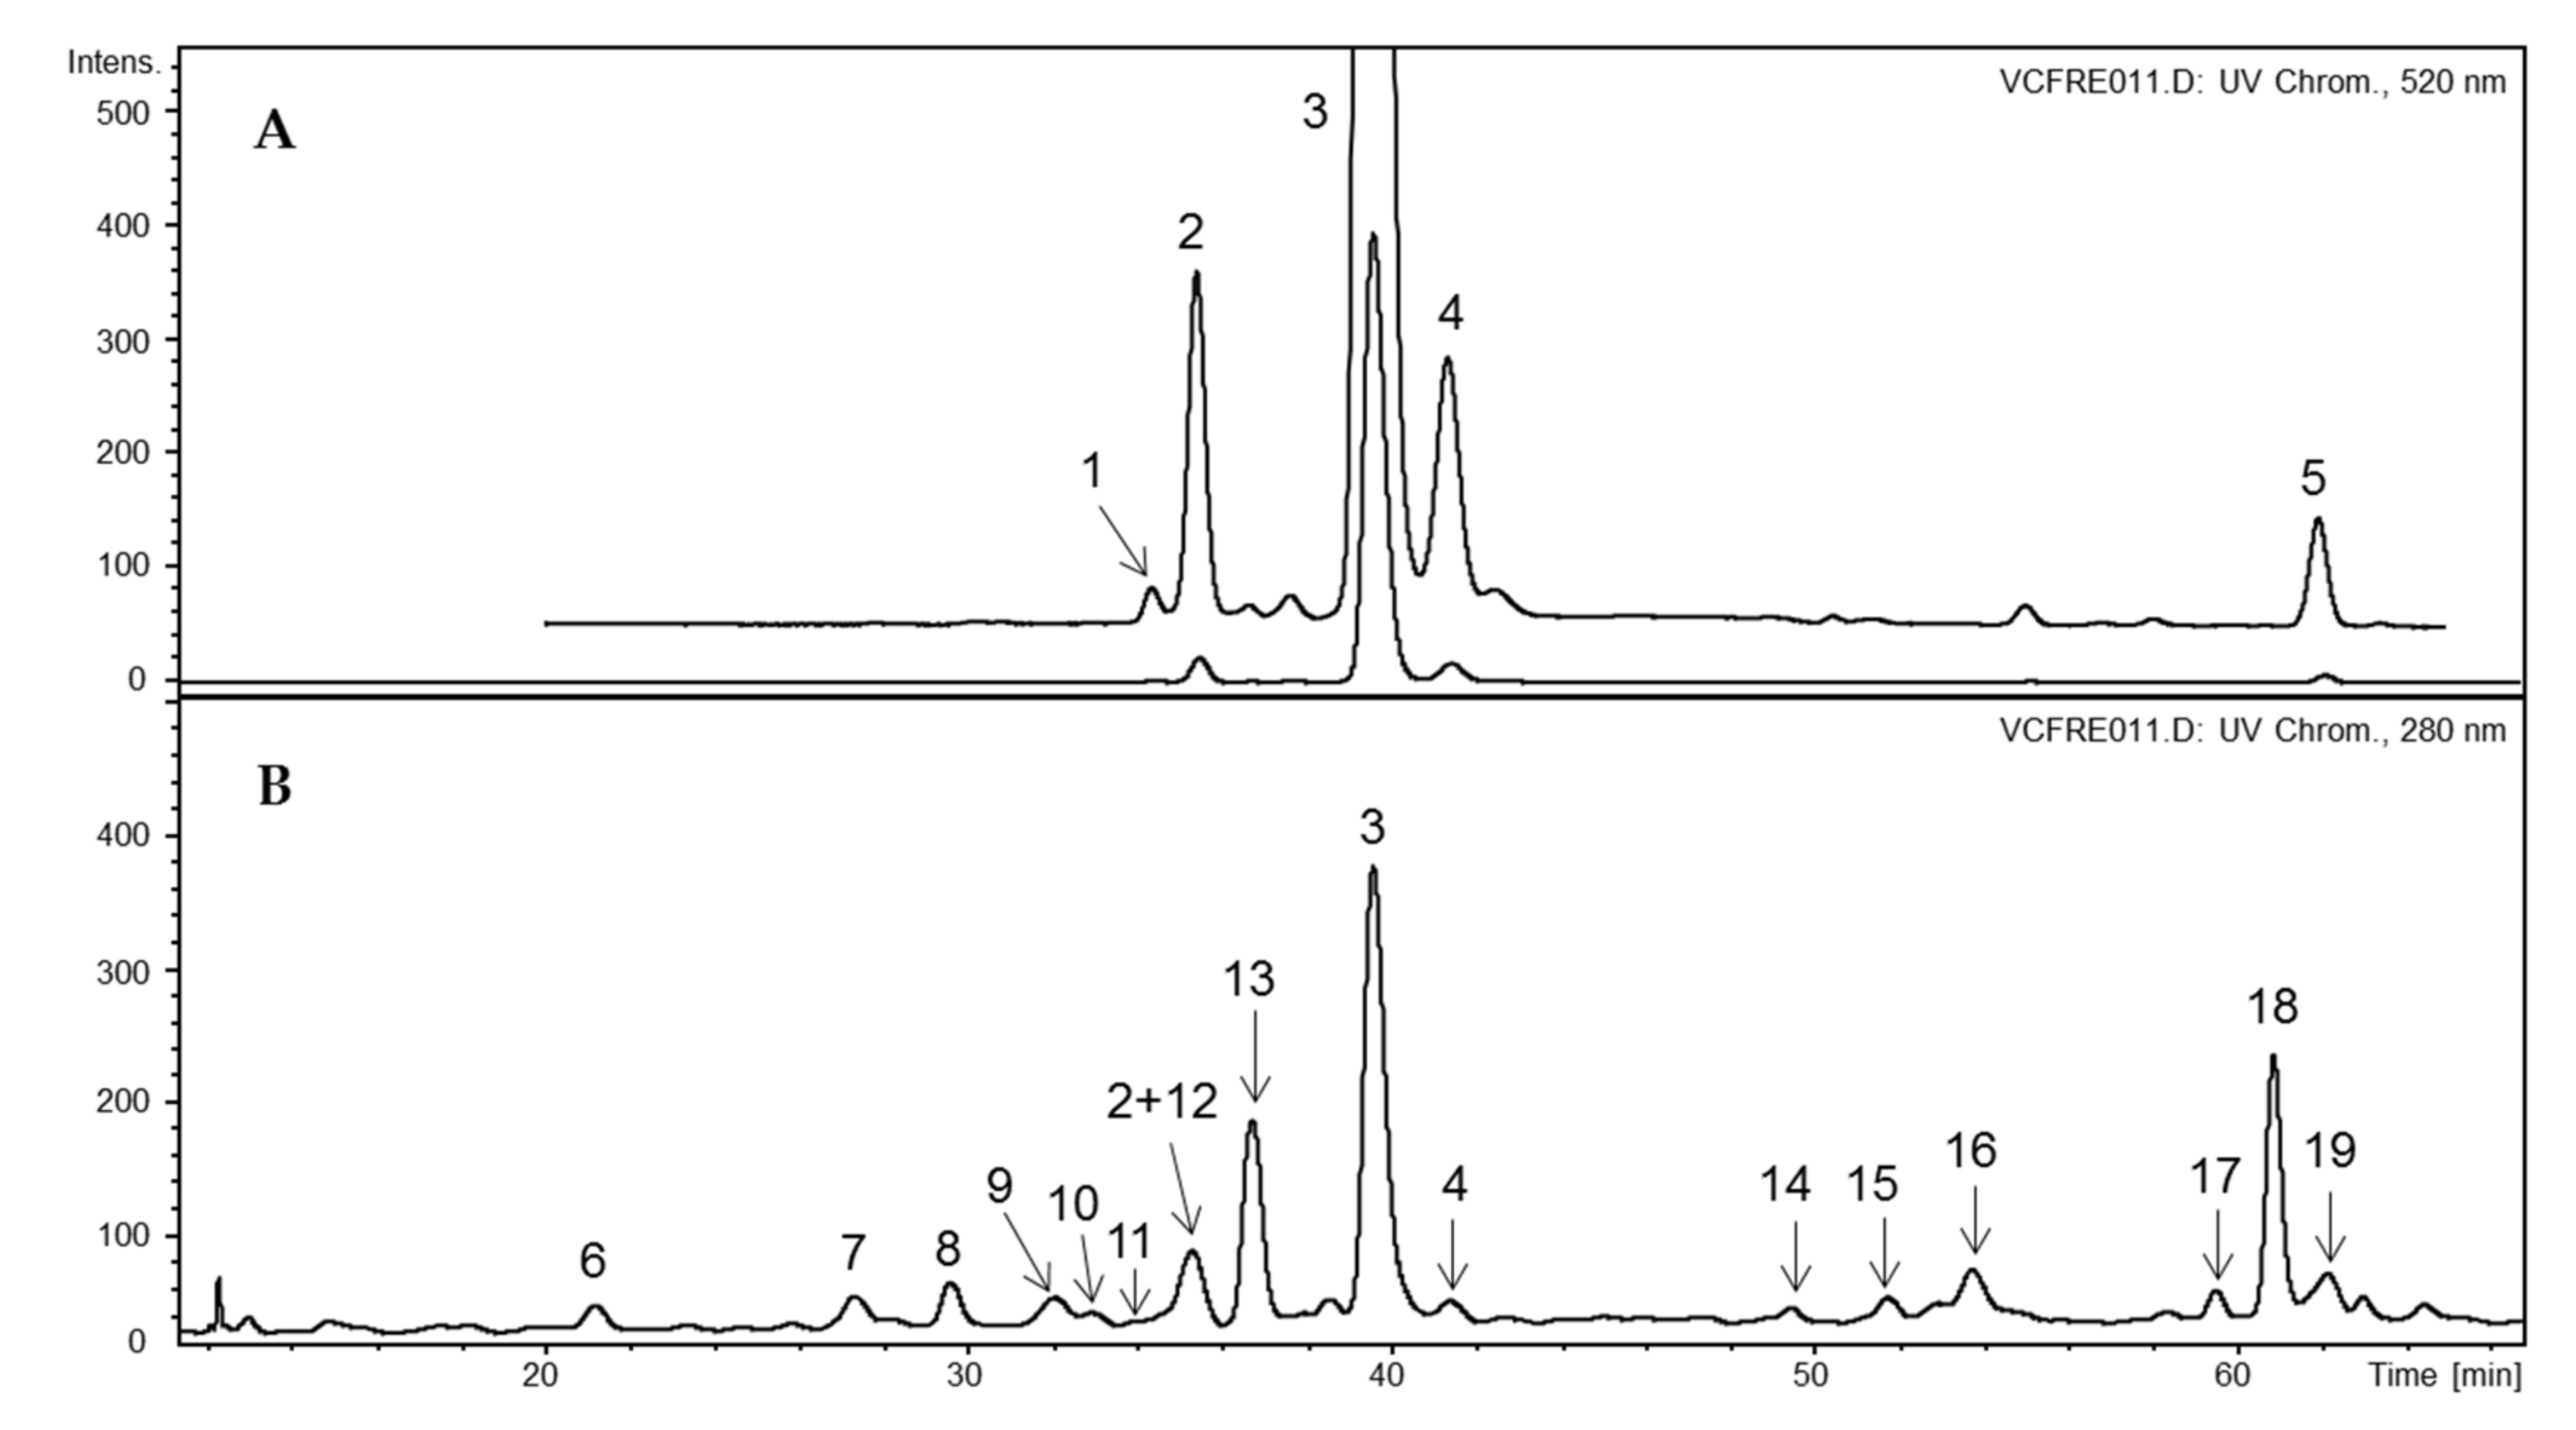
2.4. HPLC-DAD-ESI/MSn Identification and Quantification of Phenolic Compounds

The phenolic compounds were analysed following the method reported by Gironés-Vilaplana et al. [30]. The HPLC-DAD-ESI/MSn analyses were performed using an Agilent HPLC 1100 series model equipped with a photodiode array detector and a mass detector in series (Agilent Technologies, Waldbronn, Germany). The equipment consisted of a binary pump (model G1312A), an autosampler (model G1313A), a degasser (model G1322A), and a photodiode array detector (model G1315B). The HPLC system was controlled by ChemStation software (Agilent, version 08.03). The chromatographic analyses were performed on a Luna C18 column (250 × 4.6 mm, 5 mm particle size; Phenomenex, Macclesfield, UK). Water/formic acid (99:1, v/v) and acetonitrile were used as the mobile phases A and B, respectively, with a flow rate of 1 mL/min. The linear gradient started with 8% solvent B, reaching 15% at 25 min, 22% at 55 min, and 40% at 60 min, which was maintained to 70 min. The injection volume was 20 µL.
The mass detector was an ion trap spectrometer (model G2445A) equipped with an electrospray ionization interface controlled by LCMSD software (Agilent, version 4.1). The ionization conditions were a capillary temperature of 350 °C and voltage of 4 kV. The nebulizer pressure and nitrogen flow rate were 65.0 psi and 11 L/min, respectively. The full-scan mass covered the range of m/z from 100 to 1200. Collision-induced fragmentation experiments were performed in the ion trap using helium as the collision gas, with voltage ramping cycles from 0.3 to 2 V. The mass spectrometry data were acquired in the positive ionization mode for anthocyanins and in the negative ionization mode for the other phenolic compounds. The MSn was carried out in the automatic mode on the more abundant fragment ion in MS(n−1). Tentative identification was based on full-scan, data-dependent MS scanning from 100 to 1200 m/z, MSn fragmentation, and comparisons of the retention time and absorption with available standards.
For the quantification, all samples were also centrifuged for 5 min at 10,500 rpm. Each supernatant was filtered through a 0.45-μm PVDF filter (Millex HV13, Millipore, Bedford, Mass., USA) before injection into the HPLC system, as described by Gironés-Vilaplana et al. [30]. Chromatograms were recorded at 280, 320, 360, and 520 nm. Anthocyanins were quantified as cyanidin 3–O–glucoside at 520 nm, flavonols and xanthone derivatives as quercetin 3-O-glucoside at 360nm, ellagic acid derivatives as ellagic acid 3–O–glucoside at 360 nm, and cinnamic acids as 5–O–caffeoylquinic acid at 320 nm [31,32].

2.5. DPPH, ABTS, and Superoxide Radical (O2) Scavenging Activity, Assays of Antioxidant Capacity

Antioxidant capacity methods were determined spectrophotometrically in 96-well micro-plates (Nunc, Roskilde, Denmark) using an Infinite® M200 microplate reader (Tecan, Grödig, Austria). The assays were performed in triplicate.

2.5.1. DPPH Assay

The determination of antioxidant capacity using DPPH radical was performed by measuring the absorption at 515 nm after 50 min of reaction [33,34]. The results were expressed as μmol equivalent of Trolox per 1 g of dried weight.

2.5.2. ABTS+ Assay

The analysis of antioxidant capacity using the ABTS+ radical was performed as described by Espín et al. [33], evaluating the decrease of the absorbance at 414 nm for 50 min at 25 °C. The results were expressed as μmol equivalent of Trolox per 1 g of dried weight.

2.5.3. Superoxide Radical (O2) Assay

This antiradical activity was evaluated by monitoring the effect of the sample extracts on the O2 induced reduction of NBT at 560 nm. Superoxide radicals were generated by the NADH/PMS system following the method proposed by Ferreres et al. [35]. The results were expressed as μmol equivalent of Trolox per 1 g of dried weight.

2.6. Statistical Analysis

The data were subjected to ANOVA analysis, with a factorial design with two factors (N and NaCl) and two levels, followed by an LSD test. Values were considered statistically significant at a p-value ≤ 0.05. The statistical software Statistix 9.0 was used.

3. Results and Discussion

3.1. Characterization of Phenolic Compounds

Phenolic compounds of strawberry fruits (cv. Primoris) were analysed using HPLC-DAD-ESI-MSn. Each individual compound was tentatively identified by comparing the retention times, PDA spectra with available standards, and mass spectrometry data. In the absence of standards, the identification was also conducted on the basis of the UV and MS spectra, molecular ion identification, and comparison with literature reports.

3.1.1. ANTHOCYANINS

Figure 1A shows the chromatogram of the hydroalcoholic extract of strawberry acquired at 520 nm. Peak 1 (Rt 34.3 min) was found in trace amounts which presented a protonated molecular ion at m/z = 705, an MS2 fragment at m/z = 543 (loss of 162 amu, hexosyl radical), and also a fragment ion at m/z = 407 produced by Retro Diels–Alder (RDA) side ring fission in afzelechin (loss of 136 amu). In accordance with Lopes da Silva et al. [36], this compound was tentatively identified as afzelechin–pelargonidin 3–glucoside, which had previously been detected in strawberries with NMR [37].
Peak 2 (Rt 35.4 min) had an m/z = 449, which fragmented with a loss of 162 Da (hexosyl group) to produce an m/z = 287 (cyanidin-H) daughter ion. Besides, co-chromatography with a standard established that peak 2 was cyanidin–3–glucoside.
Peak 3 (Rt 34.3 min) was produced at m/z = 433, which upon MS2 fragmented with a loss of 162 Da (hexosyl group) to yield an m/z = 271 (pelargonidin-H) daughter ion. This compound was tentatively identified as pelargonidin 3–glucoside.
Peak 4 (Rt 41.4 min) was produced at m/z = 579, which on MS2 yielded product ions at m/z = 271 and 433, corresponding to the protonates pelargonidin and pelargonidin 3–glucoside, respectively. On the basis of its fragmentation pattern, this compound was tentatively identified as pelargonidin 3–rutinoside. These compounds (peaks 2–4) are the most abundant anthocyanin pigments described in strawberries by several authors [11,36,38].
In addition, a peak was observed at the end of the chromatogram (peak 5, Rt 62.0 min) that can match pelargonidin aglycon, m/z = 271, and was probably produced as a result of hydrolysis during sample preparation (Table 2).
In the chromatogram at 280 nm (Figure 1B), several phenolic compounds were identified (6−19), as previously reported in strawberries [11,39,40].

3.1.2. FLAVAN-3-OLS

Peaks 7−9 (Rt 27.3, 29.5, and 32.0 min, respectively) had an m/z = 577 amu, which produced major fragment ions at m/z = 559, 451, 425 (base peak is produced by RDA in the catechin, loss of 152 amu) and 289 [catechin–H]. Thus, these three peaks were tentatively identified as procyanidin dimer isomers of [(epi)catechin–(epi)catechin].
Peaks 10 and 11 (Rt 32.9 and 33.9 min, respectively) had a [M − H] at m/z 865 am and showed fragment ions at m/z = 739, 695, and 577 (Table 2). Taking into account the characteristic fragmentation pattern, these peaks were tentatively identified as procyanidin trimer isomers [(epi)catechin–(epi)catechin–(epi)catechin]. These five flavan–3–ols (peak 7−11) had previously been reported in berries by Hellström et al. [40] and Kajdžanoska et al. [41].
Peak 13 (Rt 36.7 min) had an m/z = 561, which on MS2 yielded product ions at m/z = 543 ([M − H-18]), 435 (heterocyclic ring fission (HRF) mechanisms), 407 (RDA), 289 [catechin-H], and 271 (Quinone-Methide (QM) cleavage), in keeping with published data [39] (Table 2). Thus, this compound has been tentatively identified as (epi)afzelechin–(epi)catechin.

3.1.3. CONJUGATED FORMS OF ELLAGIC ACID

Peaks 15, 16, and 18 (Rt 51.7, 53.7, and 60.8 min, respectively) had a deprotonated molecular ion at m/z = 935, and MS fragmentations showed ions at m/z = 633 (a loss of 302 amu) and 301. These peaks were tentatively identified as three isomers of galloyl–bis–HHDP–glucose, which has been reported in berries [41,42].
Peak 6 (Rt 21.1 min) had a deprotonated molecular ion at m/z = 783 and showed in their MS fragmentations a loss of 302 amu and ions at m/z = 301, which are base peaks that indicate ellagitannins or ellagic acid derivatives. The deprotonated molecular ion of this compound was 152 amu lower than that of peak 6 (m/z = 783), indicating a similar structure without the galloyl residue. Besides, a loss of 302 amu was observed in the fragmentation and an abundant ion at m/z = 301 (ellagic acid), previously identified in strawberry as HHDP–glucose [43,44].
Peak 12 (Rt 35.3 min) showed a [M − H] at m/z = 633 and was 302 amu lower than peaks 15, 16, and 18. The main ions were at m/z = 463 and 301 in the MS fragmentation (Table 2). This compound was tentatively identified in strawberries as HHDP–galloyl–glucose by Aaby et al. [44] and Kajdžanoska et al. [41].
Peak 19 (Rt 62.0 min), with a [M − H] at m/z = 447, showed a loss of 146 amu (rhamnosil radical) and has already been determined as ellagic acid rhamnoside in strawberry samples by several researchers [41,44].

3.1.4. HYDROXYCYNNAMIC ACID DERIVATIVES

Peak 14 showed an ion [M − H] at m/z 449 and ions at m/z 355, 329, and 269 ([M − H-180]). The MS3 ([449→355]) produces a loss of 162 amu (hexosyl radical) to give an ion at m/z = 193 ([ferulic acid-H]) (data not shown in Table 2), so it must match the ferulic acid hexose derivative detected in strawberries by Aaby et al. [44] and Kajdžanoska et al. [41].

3.1.5. FLAVONOLS

Peak 17 (Rt 59.4 min) presented a deprotonated molecular ion at m/z = 447 as compound 19, and the same fragmentation was observed. However, its UV spectrum is similar to quercetin derivatives, so it has been tentatively identified as quercetin–3–O–rhamnoside [41].

3.2. The Influence of Salinity, Nitrogen Reduction and Sampling Time on Phenolic Compounds

The strawberries (cv. Primoris) were grown under different levels of N and NaCl in the nutrient solution and harvested on 16 January, 22 March, and 29 April 2012. In accordance with results found by other authors [45,46], these three factors (salinity, nitrogen reduction, and sampling time) may influence the content of phenolic compounds in strawberries. A statistical factorial design was employed to determine whether the different treatments were able to affect the concentrations of bioactive compounds either totally or in major individual compounds. The total phenolic contents (TPC) according to treatments (salinity and nitrogen reduction) are displayed in Table 3. TPC ranged from 731 to 1521 mg/100 g of dried weight. Anthocyanins, flavan–3–ols, ellagitannins, hydroxycinnamic acid derivatives, and flavonols levels were quantified in similar concentrations to those reported in the literature [18,38].

3.2.1. Effect of Salinity and Nitrogen Reduction

The phenolic composition of the strawberries was affected under salinity stress conditions (Table 3), particularly on the second sampling date (Table 3). Regarding flavan–3–ols, the afz–(e)Catechin content increased with salinity on the first and second sampling dates. Meanwhile, dimers and total flavan–3–ols content were only higher on the second sampling date with salinity, while trimmers were unaffected. These results may be important because monomers and dimers can be better absorbed than larger oligomers and therefore have different biological activity [47]. On the other hand, the total pelargonidins (including glucoside, rutinoside, and aglycons) and anthocyanins increased with the salinity on the second sampling date as well. These results are in accordance with those observed by Keutgen and Pawelzik [45], where the effect of salinity improved the phenolic content in strawberries. Abiotic stresses such as salinity are able to induce the synthesis and accumulation of different bioactive compounds during the plants’ adaptation to stress, likely via activation of their biosynthetic pathway [24]. On the other hand, there were no statistically significant differences in the last sampling for the phenolics evaluated regarding the salinity effect, possibly explained by some kind of stress adaptation produced after a long exposure [24]. The remaining phenolic subclasses evaluated, including ellagitannins, hydroxycynnamic acid derivatives, and flavonols did not show statistically significant differences. Thus, it is important to note that there is no evidence of a negative effect on the phytochemical composition of strawberries under saline stress.
Concerning the nitrogen supply, no statistically significant differences were found in the content of phenolic compounds. Plant growth is generally improved by nitrogen fertilization; thus, a relative dilution effect may occur in plant tissues [46]. Nitrogen fertilizers are able to enhance plant foliage and may thus reduce light intensity and accumulation of compounds in shaded parts. The fruits analysed during this research were characterised by a more constant fruit composition. Therefore, strawberry cv. Primoris showed a lower susceptibility to a reduced nitrogen supply at the levels under study.
Regarding the combined effect of salinity and reduced nitrogen, slight changes in the concentration of phenolic compounds were observed on the second and third sampling dates (Table 3). This interaction showed that the treatment obtaining the higher values for the content of afz–(e)Catechin, flavan-3-ols, and total phenolics TPC was the one using salinity and the higher nitrogen concentration (N9S), followed by the samples obtained with N5 and N5S treatments. Finally, the samples obtained under the N9 treatment obtained the lowest value. On the third sampling date, the NxS interaction showed that the reduction of nitrogen under non-salinity conditions (N5) increased the content of hydroxycynnamic acid derivatives, pelargonidin, and anthocyanins, whilst there were no differences between nitrogen reduction and salinity conditions (N5S) and the control treatment (N9).

3.2.2. Effect of Sampling Date

The environmental growing conditions can also impact the levels of phenolic compounds in fruits [15,16]. In this research, the sampling date had a large effect on the bioactive compounds (Table 4).
The maximum concentration of phenolic compounds was obtained for the samples collected during the first (January) and the second sampling dates (March). Afz–(e)Catechin reached the highest value during the first sampling date (January). The second sampling date (March) showed a higher content of dimers of flavan–3–ols, flavonols, and anthocyanins, including the total pelargonidins. In general, lower concentrations of all the evaluated compounds were found on the third harvesting date, except for flavan-3-ol trimers, which were similar to those found during the second sampling date. Antioxidants, such as phenolic compounds, are involved in the reduction of reactive oxygen species and absorb excess radiation due to their mono- or polyaromatic character, making them powerful filters of ultraviolet (UV) light [15,24], thereby protecting plants from excess radiation. Pineli et al. [15] published data for strawberries showing the lowest content of anthocyanins for the month with the highest photoperiod. The decrease in total phenolics and anthocyanin contents observed in April is in agreement with these findings, which could point to a degradation of these antioxidant compounds as a result of the excessive light intensity characteristic of this month (Figure 2).

3.3. Antioxidant Capacity

The strawberries antioxidant capacity was measured using different radicals: ABTS, DPPH, and O2. Those methodologies evaluate the antioxidant capacity of different foods and plants [48]. The antioxidant capacity values are presented in Table 5.
Concerning ABTS or O2, there were no significant differences for the treatments under study. Thus, it is relevant to note that there was no evidence of saline stress and nitrogen reduction having a negative effect on the bioactive compounds of strawberries.
With regard to the DPPH method, the reduction in nitrogen supply increased the antioxidant capacity on the second sampling date (Table 5). Broadly, strawberries with the highest antioxidant values were produced under reduced nitrogen supply and non-salinity conditions (N5) and N9S treatment (Table 5).
In general, growing environmental conditions may affect the levels of phenolic compounds in strawberries and therefore affect their antioxidant capacity. In this study, the ABTS and DPPH values were higher in March, showing that seasonal differences had a strong impact on the antioxidant capacity (Table 6).

4. Conclusions

This study evaluated the effect of salinity and nitrogen supply on the phenolic profile and antioxidant capacity of strawberries (cv. Primoris). The content of bioactive compounds was most noticeable on the intermediate sampling date (March), the reduced nitrogen supply increasing the antioxidant capacity and the salinity improving the levels of health-promoting compounds by means of higher contents of flavan-3-ols, anthocyanins, and the total phenolics. Overall, the salinity conditions and the reduced nitrogen supply did not have a negative impact on the phytochemical quality of the fruits. The strawberry variety cv. Primoris showed good stability to the stress conditions regarding the parameters under study.

Author Contributions

Conceptualization, E.M., J.M.M.-R. (José M. Moreno-Rojas), and D.A.M.; methodology, J.L.O.-D., V.C., F.F., and G.P.-C.; formal analysis, J.L.O.-D., V.C., J.M.M.-R. (José Manuel Muñoz-Redondo), F.F., G.P.-C., J.M.M.-R. (José M. Moreno-Rojas), and D.A.M.; investigation, J.L.O.-D., V.C., J.M.M.-R. (José Manuel Muñoz-Redondo), F.F., G.P.-C., J.M.M.-R. (José M. Moreno-Rojas), and D.A.M.; resources, E.M., J.M.M.-R. (José M. Moreno-Rojas), and D.A.M.; data curation, J.L.O.-D., V.C., J.M.M.-R. (José Manuel Muñoz-Redondo), F.F., J.M.M.-R. (José M. Moreno-Rojas), and D.A.M.; writing—original draft preparation, J.L.O.-D., J.M.M.-R. (José M. Moreno-Rojas), and D.A.M.; writing—review and editing, J.L.O.-D., J.M.M.-R. (José M. Moreno-Rojas), and D.A.M.; supervision, F.F., J.M.M.-R. (José M. Moreno-Rojas), and D.A.M.; project administration, E.M., J.M.M.-R. (José M. Moreno-Rojas), and D.A.M.; funding acquisition, E.M., J.M.M.-R. (José M. Moreno-Rojas), and D.A.M. All authors have read and agreed to the published version of the manuscript.

Funding

This research was funded by the project “Desarrollo de Diferentes Técnicas y Productos Agroalimentarios de Origen Vegetal (PP.TRA.TRA2010.12)”, which was co-financed (80%) by the European Regional Development Fund within the FEDER Operational Program of Andalusia 2014–2020.

Institutional Review Board Statement

Not applicable.

Acknowledgments

V. Cardeñosa was granted to IFAPA for the fellowship obtained for the development of her PhD thesis. Part of this study was also funded by the project “Group of Excellence” (04486/GERM/06) from the Regional Agency for Science and Technology of Murcia (Fundación Séneca).

Conflicts of Interest

The authors declare no conflict of interest.

References

  1. Mateos, R.; Lecumberri, E.; Ramos, S.; Goya, L.; Bravo, L. Determination of malondialdehyde (MDA) by high-performance liquid chromatography in serum and liver as a biomarker for oxidative stress: Application to a rat model for hypercholesterolemia and evaluation of the effect of diets rich in phenolic antioxidants from fruits. J. Chromatogr. B Analyt. Technol. Biomed. Life Sci. 2005, 827, 76–82. [Google Scholar]
  2. Schreckinger, M.E.; Wang, J.; Yousef, G.; Lila, M.A.; de Mejia, E.G. Antioxidant capacity and in Vitro inhibition of adipogenesis and inflammation by phenolic extracts of Vaccinium floribundum and Aristotelia chilensis. J. Agric. Food Chem. 2010, 58, 8966–8976. [Google Scholar] [CrossRef]
  3. Del Rio, D.; Rodriguez-Mateos, A.; Spencer, J.P.E.; Tognolini, M.; Borges, G.; Crozier, A. Dietary (Poly) phenolics in Human Health: Structures, Bioavailability, and Evidence of Protective Effects Against Chronic Diseases. Antioxid. Redox Signal. 2013, 18, 1818–1892. [Google Scholar] [CrossRef] [PubMed] [Green Version]
  4. Samtiya, M.; Aluko, R.E.; Dhewa, T.; Moreno-Rojas, J.M. Potential Health Benefits of Plant Food-Derived Bioactive Components: An Overview. Foods 2021, 10, 839. [Google Scholar] [CrossRef] [PubMed]
  5. Dobani, S.; Latimer, C.; McDougall, G.J.; Allwood, J.W.; Pereira-Caro, G.; Moreno-Rojas, J.M.; Ternan, N.G.; Pourshahidi, L.K.; Lawther, R.; Tuohy, K.M.; et al. Ex vivo fecal fermentation of human ileal fluid collected after raspberry consumption modifies (poly)phenolics and modulates genoprotective effects in colonic epithelial cells. Redox Biol. 2021, 40, 101862. [Google Scholar] [CrossRef]
  6. Ordóñez, J.L.; Pereira-Caro, G.; Ludwig, I.; Muñoz-Redondo, J.M.; Ruiz-Moreno, M.J.; Crozier, A.; Moreno-Rojas, J.M. A critical evaluation of the use of gas chromatography-and high performance liquid chromatography-mass spectrometry techniques for the analysis of microbial metabolites in human urine after consumption of orange juice. J. Chromatograph. A 2018, 1575, 100–112. [Google Scholar] [CrossRef] [PubMed]
  7. Hancock, J.F.; Sjulin, T.M.; Lobos, G.A. Strawberries. In Temperate Fruit Crop Breeding, 1st ed.; Hancock, J.F., Ed.; Springer: Dordrecht, The Netherlands, 2008; pp. 393–437. [Google Scholar]
  8. Ordóñez, J.L.; Sainz, F.; Callejón, R.M.; Troncoso, A.M.; Torija, M.J.; García-Parrilla, M.C. Impact of gluconic fermentation of strawberry using acetic acid bacteria on amino acids and biogenic amines profile. Food Chem. 2015, 178, 221–228. [Google Scholar] [CrossRef] [PubMed]
  9. Capocasa, F.; Diamanti, J.; Tulipani, S.; Battino, M.; Mezzetti, B. Breeding strawberry (Fragaria X ananassa Duch) to increase fruit nutritional quality. BioFactors 2008, 34, 67–72. [Google Scholar] [CrossRef]
  10. Giampieri, F.; Tulipani, S.; Alvarez-Suarez, J.M.; Quiles, J.L.; Mezzetti, B.; Battino, M. The strawberry: Composition, nutritional quality, and impact on human health. Nutrition 2012, 28, 9–19. [Google Scholar] [CrossRef]
  11. Kajdžanoska, M.; Petreska, J.; Stefova, M. Comparison of different extraction solvent mixtures for characterization of phenolic compounds in strawberries. J. Agric. Food Chem. 2011, 59, 5272–5278. [Google Scholar] [CrossRef]
  12. Tomás-Barberán, F.A.; Espín, J.C. Phenolic compounds and related enzymes as determinants of quality in fruits and vegetables. J. Sci. Food Agric. 2001, 81, 853–876. [Google Scholar] [CrossRef]
  13. Sánchez-Rodríguez, E.; Ruiz, J.M.; Ferreres, F.; Moreno, D.A. Phenolic profiles of cherry tomatoes as influenced by hydric stress and rootstock technique. Food Chem. 2012, 134, 775–782. [Google Scholar] [CrossRef]
  14. Tulipani, S.; Marzban, G.; Herndl, A.; Laimer, M.; Mezzetti, B.; Battino, M. Influence of environmental and genetic factors on health-related compounds in strawberry. Food Chem. 2011, 124, 906–913. [Google Scholar] [CrossRef]
  15. De Pineli, L.L.; Moretti, C.L.; Rodrigues, J.S.; Ferreira, D.B.; Chiarello, M.D. Variations in antioxidant properties of strawberries grown in Brazilian savannah and harvested in different seasons. J. Sci. Food Agric. 2012, 92, 831–838. [Google Scholar] [CrossRef]
  16. Manach, C.; Scalbert, A.; Morand, C.; Rémésy, C.; Jiménez, L. Polyphenols: Food sources and bioavailability. Am. J. Clin. Nutr. 2004, 79, 727–747. [Google Scholar] [CrossRef] [Green Version]
  17. Crecente-Campo, J.; Nunes-Damaceno, M.; Romero-Rodríguez, M.A.; Vázquez-Odériz, M.L. Color, anthocyanin pigment, ascorbic acid and total phenolic compound determination in organic versus conventional strawberries (Fragaria × ananassa Duch, cv Selva). J. Food Compos. Anal. 2012, 28, 23–30. [Google Scholar] [CrossRef]
  18. Crespo, P.; Giné Bordonaba, J.; Terry, L.A.; Carlen, C. Characterisation of major taste and health-related compounds of four strawberry genotypes grown at different Swiss production sites. Food Chem. 2010, 122, 16–24. [Google Scholar] [CrossRef]
  19. De Pascale, S.; Maggio, A.; Fogliano, V.; Ambrosino, P.; Ritieni, A. Irrigation with saline water improves carotenoids content and antioxidant activity of tomato. J. Hortic. Sci. Biotech. 2001, 76, 447–453. [Google Scholar] [CrossRef]
  20. Moreno, D.A.; López-Berenguer, C.; Martínez-Ballesta, M.C.; Carvajal, M.; García-Viguera, C. Basis for the new challenges of growing broccoli for health in hydroponics. J. Sci. Food Agric. 2008, 88, 1472–1481. [Google Scholar] [CrossRef]
  21. Cardeñosa, V.; Girones-Vilaplana, A.; Muriel, J.L.; Moreno, D.A.; Moreno-Rojas, J.M. Influence of genotype, cultivation system and irrigation regime on antioxidant capacity and selected phenolics of blueberries (Vaccinium corymbosum L.). Food Chem. 2016, 202, 276–283. [Google Scholar] [CrossRef]
  22. Ordóñez-Díaz, J.L.; Pereira-Caro, G.; Cardeñosa, V.; Muriel, J.L.; Moreno-Rojas, J.M. Study of the Quality Attributes of Selected Blueberry (Vaccinium corymbosum L.) Varieties Grown under Different Irrigation Regimes and Cultivation Systems. Appl. Sci. 2020, 10, 8459. [Google Scholar] [CrossRef]
  23. Ordóñez-Díaz, J.L.; Hervalejo, A.; Pereira-Caro, G.; Muñoz-Redondo, J.M.; Romero-Rodríguez, E.; Arenas-Arenas, F.J.; Moreno-Rojas, J.M. Effect of Rootstock and Harvesting Period on the Bioactive Compounds and Antioxidant Activity of Two Orange Cultivars (‘Salustiana’ and ‘Sanguinelli’) Widely Used in Juice Industry. Processes 2020, 8, 1212. [Google Scholar] [CrossRef]
  24. Taiz, L.; Zeiger, E. Plant Physiology, 5th ed.; Sinauer Associates Inc.: Sunderland, MA, USA, 2010; pp. 334–341. [Google Scholar]
  25. Cardeñosa, V.; Medrano, E.; Lorenzo, P.; Sánchez-Guerrero, M.C.; Cuevas, F.; Pradas, I.; Moreno-Rojas, J.M. Effects of salinity and nitrogen supply on the quality and health-related compounds of strawberry fruits (Fragaria × ananassa cv. Primoris). J. Sci. Food Agric. 2015, 95, 2924–2930. [Google Scholar] [CrossRef]
  26. Baâtour, O.; Mahmoudi, H.; Tarchoun, I.; Nasri, N.; Trabelsi, N.; Kaddour, R.; Zaghdoudi, M.; Hamdawi, G.; Ksouri, R.; Lachaâl, M.; et al. Salt effect on phenolics and antioxidant activities of Tunisian and Canadian sweet marjoram (Origanum majorana L.) shoots. J. Sci. Food Agric. 2013, 93, 134–141. [Google Scholar] [CrossRef]
  27. Colla, G.; Rouphael, Y.; Cardarelli, M.; Svecova, E.; Rea, E.; Lucini, L. Effects of saline stress on mineral composition, phenolic acids and flavonoids in leaves of artichoke and cardoon genotypes grown in floating system. J. Sci. Food Agric. 2013, 93, 1119–1127. [Google Scholar] [CrossRef]
  28. Bénard, C.; Gautier, H.; Bourgaud, F.; Grasselly, D.; Navez, B.; Caris-Veyrat, C.; Weiss, M.; Génard, M. Effects of low nitrogen supply on tomato (Solanum lycopersicum) fruit yield and quality with special emphasis on sugars, acids, ascorbate, carotenoids, and phenolic compounds. J. Agric. Food Chem. 2009, 57, 4112–4123. [Google Scholar] [CrossRef] [PubMed]
  29. D’Anna, F.; Incalcaterra, G.; Moncada, A.; Miceli, A. Effects of different electrical conductivity levels on strawberry grown in soilless culture. Acta Hortic. 2003, 609, 355–360. [Google Scholar] [CrossRef]
  30. Gironés-Vilaplana, A.; Baenas, N.; Villaño, D.; Speisky, H.; García-Viguera, C.; Moreno, D.A. Evaluation of Latin-American fruits rich in phytochemicals with biological effects. J. Funct. Foods 2014, 7, 599–608. [Google Scholar] [CrossRef]
  31. Burin, V.M.; Arcari, S.G.; Costa, L.L.F.; Bordignon-Luiz, M.T. Determination of some phenolic compounds in red wine by RP-HPLC: Method development and validation. J. Chromatogr. Sci. 2011, 49, 647–651. [Google Scholar] [CrossRef] [PubMed]
  32. Biswas, N.; Balac, P.; Narlakanti, S.K.; Haque, E.; Hassan, M.M. Identification of Phenolic Compounds in Processed Cranberries by HPLC Method. J. Nutr. Food Sci. 2013, 3, 1–6. [Google Scholar] [CrossRef] [Green Version]
  33. Espín, J.C.; Soler-Rivas, C.; Wichers, H.J.; García-Viguera, C. Anthocyanin-based natural colorants: A new source of antiradical activity for foodstuff. J. Agric. Food Chem. 2000, 48, 1588–1592. [Google Scholar] [CrossRef]
  34. Gironés-Vilaplana, A.; Mena, P.; Moreno, D.A.; García-Viguera, C. Evaluation of sensorial, phytochemical and biological properties of new isotonic beverages enriched with lemon and berries during shelf life. J. Sci. Food Agric. 2014, 94, 1090–1100. [Google Scholar] [CrossRef] [PubMed]
  35. Ferreres, F.; Fernandes, F.; Oliveira, J.M.A.; Valentão, P.; Pereira, J.A.; Andrade, P.B. Metabolic profiling and biological capacity of Pieris brassicae fed with kale (Brassica oleracea L. var. acephala). Food Chem. Toxicol. 2009, 47, 1209–1220. [Google Scholar] [CrossRef] [PubMed]
  36. Da Silva, F.L.; Escribano-Bailón, M.T.; Pérez Alonso, J.J.; Rivas-Gonzalo, J.C.; Santos-Buelga, C. Anthocyanin pigments in strawberry. LWT 2007, 40, 374–382. [Google Scholar] [CrossRef]
  37. Fossen, T.; Rayyan, S.; Andersen, Ø.M. Dimeric anthocyanins from strawberry (Fragaria ananassa) consisting of pelargonidin 3-glucoside covalently linked to four flavan-3-ols. Phytochemistry 2004, 65, 1421–1428. [Google Scholar] [CrossRef] [PubMed]
  38. Aaby, K.; Mazur, S.; Nes, A.; Skrede, G. Phenolic compounds in strawberry (Fragaria x ananassa Duch.) fruits: Composition in 27 cultivars and changes during ripening. Food Chem. 2012, 132, 86–97. [Google Scholar] [CrossRef] [PubMed]
  39. Gu, L.; Kelm, M.A.; Hammerstone, J.F.; Beecher, G.; Holden, J.; Haytowitz, D.; Prior, R.L. Screening of Foods Containing Proanthocyanidins and Their Structural Characterization Using LC-MS/MS and Thiolytic Degradation. J. Agric. Food Chem. 2003, 51, 7513–7521. [Google Scholar] [CrossRef]
  40. Hellström, J.; Sinkkonen, J.; Karonen, M.; Mattila, P. Isolation and structure elucidation of procyanidin oligomers from Saskatoon berries (Amelanchier alnifolia). J. Agric. Food Chem. 2007, 55, 157–164. [Google Scholar] [CrossRef]
  41. Kajdžanoska, M.; Gjamovski, V.; Stefova, M. HPLC-DAD-ESI-MSn identification of phenolic compounds in cultivated strawberries from Macedonia. Maced. J. Chem. Chem. Eng. 2010, 29, 181–194. [Google Scholar] [CrossRef] [Green Version]
  42. Määttä-Riihinen, K.R.; Kamal-Eldin, A.; Törrönen, A.R. Identification and quantification of phenolic compounds in berries of Fragaria and Rubus species (family rosaceae). J. Agric. Food Chem. 2004, 52, 6178–6187. [Google Scholar] [CrossRef]
  43. Seeram, N.P.; Lee, R.; Scheuller, H.S.; Heber, D. Identification of phenolic compounds in strawberries by liquid chromatography electrospray ionization mass spectroscopy. Food Chem. 2006, 97, 1–11. [Google Scholar] [CrossRef] [Green Version]
  44. Aaby, K.; Ekeberg, D.; Skrede, G. Characterization of phenolic compounds in strawberry (Fragaria x ananassa) fruits by different HPLC detectors and contribution of individual compounds to total antioxidant capacity. J. Agric. Food Chem. 2007, 55, 4395–4406. [Google Scholar] [CrossRef]
  45. Keutgen, A.J.; Pawelzik, E. Quality and nutritional value of strawberry fruit under long term salt stress. Food Chem. 2008, 107, 1413–1420. [Google Scholar] [CrossRef]
  46. Stefanelli, D.; Goodwin, I.; Jones, R. Minimal nitrogen and water use in horticulture: Effects on quality and content of selected nutrients. Food Res. Int. 2010, 43, 1833–1843. [Google Scholar] [CrossRef]
  47. Buendía, B.; Gil, M.I.; Tudela, J.A.; Gady, A.L.; Medina, J.J.; Soria, C.; López, J.M.; Tomás-Barberán, F.A. HPLC-MS analysis of proanthocyanidin oligomers and other phenolics in 15 strawberry cultivars. J. Agric. Food Chem. 2010, 58, 3916–3926. [Google Scholar] [CrossRef] [PubMed]
  48. Moon, J.K.; Shibamoto, T. Antioxidant assays for plant and food components. J. Agric. Food Chem. 2009, 57, 1655–1666. [Google Scholar] [CrossRef] [PubMed]
Figure 1. HPLC chromatograms at 520 nm (A) and 280 nm (B) of hydroalcoholic extracts from strawberry fruits.
Processes 09 01044 g001
Figure 2. Average light intensity measured by a pyranometer during the cultivation time for the months between October (2011) and April (2012).
Processes 09 01044 g002
Table 1. Concentration of nutrients (N and NaCl) and abbreviations.
Agronomic FactorsAbbreviationConcentration of N (mmol/L)Concentration of NaCl (mmol/L)
ControlN992
Reduced N supplyN552
Salinity StressN9S97
Reduced N and Salinity stressN5S57
Table 2. Identification of phenolic compounds of hydroalcoholic extract from strawberry fruits a using HPLC-DAD-ESI-MSn.
Compounds bRt (min)Vis-UV (nm)[M + H]+, m/zMS2[M + H]+, m/z (%) c
Anthocyanins
1(e)afz–Plg 3–glc34.3----705543(100), 407(6), 313(4)
2Cy 3–glc35.4280, 320sh, 408sh, 516449287(100)
3Plg 3–glc39.5278, 330, 428, 502433271(100)
4Plg 3–rut41.4276, 332, 430, 504579433(90), 271(100)
5Plg62.0384, 360, 426sh, 506271
Rt (min)Vis-UV (nm)[M − H], m/zMS2[M − H], m/z (%)
Flavan-3-ols
7(e)Cat–(e)Cat isom27.3285577559(55), 451(65), 425(100), 289(15)
8(e)Cat–(e)Cat isom29.5280577559(100), 451(28), 425(55), 289(27)
9(e)Cat–(e)Cat isom32.0280577559(70), 451(30), 425(100), 289(30)
10(e)Cat–(e)Cat–(e)Cat isom32.9280865847(90), 739(100), 713(50), 695(85), 577(60)
11(e)Cat–(e)Cat–(e)Cat isom33.9----865847(98), 739(75), 713(80), 695(70), 577(100)
13(e)afz–(e)Cat36.7316561543(100), 435(25), 425(24), 407(10), 289(40), 271(15)
Conjugated forms of ellagic acid
6bis–HHDP–glc21.1274783481(100), 301(85)
12HHDP–gall–glc35.3---633463 (35), 301(100)
15gall–bis–HHDP–glc isom51.7260sh, 288sh935633(100), 301(8)
16gall–bis–HHDP–glc isom53.7268sh935633(100), 301(10)
18gall–bis–HHDP–glc isom60.8258, 292935633(100), 301(15)
19Ellg-rhmn62.0----447301(100)
Hydroxycynnamic acid derivatives
14Fer–hex der.49.4310sh, 330449355(42), 329(75), 269(100)
Flavonols
17Querct–3–rhmn59.4256, 265sh, 370447301(100)
a Main fragments observed. Other ions were found but have not been included. b afz: afzelechin; Plg: pelargonidin; Cy: cyanidin; Cat: catequin; HHDP: hexahydroxydiphenic acid; Ellg: ellagic acid; Fer: ferulic acid; Querct: quercetin; gall: galloyl; glc: glucosyl; rhmn: rhamnosyl; hex: hexosyl; isom: isomer; der: derivative. c relative abundance of ions expressed in %.
Table 3. Effect of variables on the sums of compounds pertaining to each polyphenol subclass. Concentrations are expressed in mg/100 g of dried weight a.
SamplesTPCAnthocyaninsFlavan–3–olsEllagitaninsHydroxycynnamic Acid DerivatesFlavonols
TotalPgTotTotalDimersTrimersAfz–(e)CatTotalGHHDP–glcTot
N91192309.57296.54195.0588.634.66101.76485.58438.0122.8414.91
N51170346.97332.92193.2179.367.34106.52407.50372.2720.7122.40
N9S1139353.94336.64220.2986.557.15126.60397.83353.8819.7315.90
N5S1219339.82324.97214.0089.267.06117.68435.31421.5618.9320.81
Nitrogennsnsnsnsnsnsnsnsnsnsns
Salinitynsnsnsnsnsns*nsnsnsns
N*Snsnsnsnsnsnsnsnsnsnsns
SamplesTPCAnthocyaninsFlavan–3–olsEllagitaninsHydroxycynnamic Acid DerivatesFlavonols
TotalPgTotTotalDimersTrimersAfz–(e)CatTotalGHHDP–glcTot
N9993c359.49344.34163.73c85.0210.5768.14 c514.09346.7021.7325.21
N51247 b461.30441.33199.00b102.7113.6182.68 bc524.30350.3527.2532.40
N9S1521 a489.96471.60235.28a112.6612.61110.01 a737.53412.0627.4530.65
N5S1283 b479.60460.78218.18ab109.819.2399.13 ab403.48223.0524.5127.90
Nitrogennsnsnsnsnsnsnsnsnsnsns
Salinity*******ns***nsnsnsns
N*S**nsns*nsns*nsnsnsns
SamplesTPCAnthocyaninsFlavan–3–olsEllagitaninsHydroxycynnamic Acid DerivatesFlavonols
TotalPgTotTotalDimersTrimersAfz–(e)CatTotalGHHDP–glcTot
N9744203.24 b191.34 b131.9476.7212.3142.90392.38269.718.599.98 b
N5830271.96 a257.62 a123.6468.856.8347.96407.20279.6711.5415,69 a
N9S854256.31 a240.61 a153.1291.3411.8649.92352.70236.1112.5012.93 ab
N5S731214.04 b199.97 b142.4581.3411.7149.40350.75243.3312.5711.08 b
Nitrogennsnsnsnsnsnsnsnsnsnsns
Salinitynsnsnsnsnsnsnsnsnsnsns
N*Sns***nsnsnsnsnsnsns*
a Mean values. TPC: Total phenolics content; PgTot: Total pelargonidins; GHHDP-glcTot: Total gall-bis-HHDP-glc isom. Different letters within a column indicate significant differences by LSD test. *, **, ***, ns, non-significant, and significant at p < 0.05, p < 0.01, p < 0.001, respectively. N9: 9 mmol/L of N + 2 mmol/L of NaCl; N5: 5 mmol/L of N + 2 mmol/L of NaCl; N9S: 9 mmol/L of N + 7 mmol/L of NaCl; N5S: 5 mmol/L of N + 7 mmol/L of NaCl.
Table 4. Effects of temporal variations on the phenolic compounds evaluated in strawberry fruits. Concentrations are expressed in mg/100 g of dried weight a.
CompoundsSamplesSD
16 January22 March29 April
AnthocyaninsTotal337.58 b447.59 a236.39 c***
PgTot322.77 b429.51 a222.39 c***
Flavan–3–olsTotal205.64 a204.05 a137.79 b***
Dimers85.95 b102.55 a79.56 b**
Trimers6.55 b11.51 a10.68 a**
Afz–(e)Cat113.14 a89.99 b47.55 c***
EllagitaninsTotal431.56 a356.73 ab282.38 b**
GHHDP–glcTot 396.43 a312.73 ab257.21 b*
Hydroxycynnamic acid derivates20.55 a25.24 a11.30 b**
Flavonols18.35 b29.04 a12.42 b***
TPC1180 a1261 a789b***
a Mean values. TPC: Total phenolics content; PgTot: Total pelargonidins; GHHDP-glcTot: Total gall-bis-HHDP-glc isom; SD: Sampling date; Different letters within a column indicate significant differences by LSD test. ns: non-significant. *, **, ***: significant at p < 0.05, p < 0.01, p < 0.001, respectively.
Table 5. Effect of variables on the antioxidant capacity measured in strawberry extracts.
16 January
ABTS (µmol trolox/g DW) aDPPH (µmol trolox/g DW) aO2 (% Inhibition) a
N9149.2687.5793.66
N5150.1092.9292.83
N9S173.7088.6993.11
N5S147.9294.4893.03
Nitrogennsnsns
Salinitynsnsns
N*Snsnsns
22 March
N9175.37106.49 b93.71
N5201.84125.12 a94.57
N9S201.01118.68 a94.03
N5S194.8112.77 b92.51
Nitrogenns*ns
Salinitynsnsns
N*Sns***ns
29 April
N9160.6788.6092.98
N5172.44100.8393.51
N9S165.5697.5394.00
N5S160.1289.6093.45
Nitrogennsnsns
Salinitynsnsns
N*Snsnsns
a Mean values. Different letters within a column indicate significant differences by LSD test. ns: non-significant. *, **, ***: significant at p < 0.05, p < 0.01, p < 0.001, respectively. N9: 9 mmol/L of N + 2 mmol/L of NaCl; N5: 5 mmol/L of N + 2 mmol/L of NaCl; N9S: 9 mmol/L of N + 7 mmol/L of NaCl; N5S: 5 mmol/L of N + 7 mmol/L of NaCl.
Table 6. Effects of temporal variations on the antioxidant capacity measured in strawberry extracts.
Sampling DateABTS (µmol trolox/g DW)DPPH (µmol trolox/g DW)O2 (% Inhibition)
16th January155.25 b90.92 b93.16
22th March193.26 a115.76 a93.71
29th April164.70 b94.14 b93.48
SD******ns
SD: Sampling date; DW: dried weight; Different letters within a column indicate significant differences by LSD test. ns: non-significant. *, **, ***: significant at p < 0.05, p < 0.01, p < 0.001, respectively.
Publisher’s Note: MDPI stays neutral with regard to jurisdictional claims in published maps and institutional affiliations.

