Article

Influence of the Application of a Sound Field on the Flow State Reduction of Newman Fine Iron Ore

School of Metallurgical Engineering, Anhui University of Technology, Ma’anshan 243002, China
*
Author to whom correspondence should be addressed.
Processes 2021, 9(4), 725; https://doi.org/10.3390/pr9040725
Submission received: 24 March 2021 / Revised: 9 April 2021 / Accepted: 13 April 2021 / Published: 20 April 2021

Abstract

:
To improve the fluidization of the fluidized bed in ironmaking, the particle loss and bonding during the fluidized bed are largely removed by changing the properties of the particle surface or by adding an external field. Currently, the vibration, magnetic, sound, and electric fields have been commonly applied to provide external energy to the fluidization bed systems. In this work, experiments are conducted for Newman ore particles under the application of an external sound field at a reduction temperature of 1023 K, linear velocity of 0.6 m/s, duration of 60 min, pressure of 0.2 MPa, and typical mineral powder particle size of 80–100 mesh, with H2 used as the reducing gas. The power and frequency of the ultrasonic field are varied, and the effects of sound field are evaluated by the comparative analysis of the effects of the sound field with different powers of sound fields and application times on the metallization rate and binder ratio of the samples. The acoustic pressure and frequency were varied to determine the critical speed and influence on the bed and to study the interactions of the iron ore powder particles in the sound field and the bonding mechanism of the particles. The results of this paper reproduce the actual particle fluidization process and analysis of the interactions of the particles in the sound field well. The influence of the external sound field on the gas-solid flow was studied from the perspective of macroscopic motion and force analysis.

1. Introduction

The promulgation and implementation of new environmental protection laws and the policy of reducing metallurgical production capacity poses a great challenge for the survival of smelting processes with high emissions, high energy consumption and high pollution. Additionally, the upsizing of blast furnaces and the strengthening of smelting lead to higher requirements for the quality of coke, giving rise to increasingly smaller room for decreasing the proportion of high-quality coking coal and other coking coal during coking and coal blending.
Due to the above considerations, fluidization technology has received increasing attention in the ironmaking industry. Fluidized bed ironmaking technology can directly use iron ore powder as the raw material to eliminate the process of coking and sintering. Thus, it is expected to realize the rational utilization of domestic composite cogeneration ore and reduce the dependence on imported iron ore [1,2,3]. At the same time, because the fluidization process does not require coke, it can reduce the dependence on coking coal and avoid the environmental pollution caused by coking. Fluidized bed ironmaking can also be used for the treatment of complex symbiotic iron ore. Fluidization enables good mixing of the gas and solid phases, which enhances the heat and mass transfer and improves kinetic conditions, leading to increased production efficiency and reduced environmental pollution [4,5,6]. However, the implementation of this process in the industry must still overcome the problem of the bonding of fine iron ore in the fluidized bed reduction process [7,8,9,10] that not only limits the improvement of the reduction rate of ore powder, but also affects the continuous operation of the process. The problem of bond loss not only deteriorates the dynamic condition of the fluidization process, but also affects its continuous operation and diminishes its advantages.
To improve the fluidization state and eliminate the above undesirable phenomena, researchers have mainly studied the following three aspects in recent years: optimization of the bed design (e.g., by adding various built-in accessories), modification of the material or addition of fluidized particles, and application of an external field to the fluidized bed (e.g., the vibrational, magnetic, sound, electric, and centrifugal fields). There exists some research on improving the fluidization quality of viscous particles by using a vibrational force field [11,12,13,14,15]. Mori et al. [15] first applied a new type of vibrated fluidized bed to study the vibration fluidization of single and multi-component fine particles. Zhu Qingshan, Li Hongzhong et al. [15] carried out experimental research on the fluidization mechanism of ultrafine particles in a magnetic field, and they found that the magnetic field could effectively eliminate the channel flow in the fluidized bed so that a stable fluidization operation could be realized. However, magnetic fluidization is only effective for ferromagnetic particles or mixed particles with ferromagnetic particles and not for non-ferromagnetic particles. The introduction of a sound field can not only improve the mass transfer and heat transfer efficiency, but also significantly reduce the size of agglomerates and the initial fluidization velocity, thus significantly improving the fluidization quality. The present work focuses on the study of the reduction effect of Newman ore under the action of a sound field.

2. Experiment

2.1. Experimental Materials

The reduced iron ore powder in this experiment was Newman ore and its chemical composition and scanning electron microscope diagram are shown in Table 1 and Figure 1, respectively. The size range of the selected Newman ore was 80–100 mesh. H2 was used as the reducing gas, N2 was used as the shielding gas, and the purity was 99.99%. TFe is the total iron content.

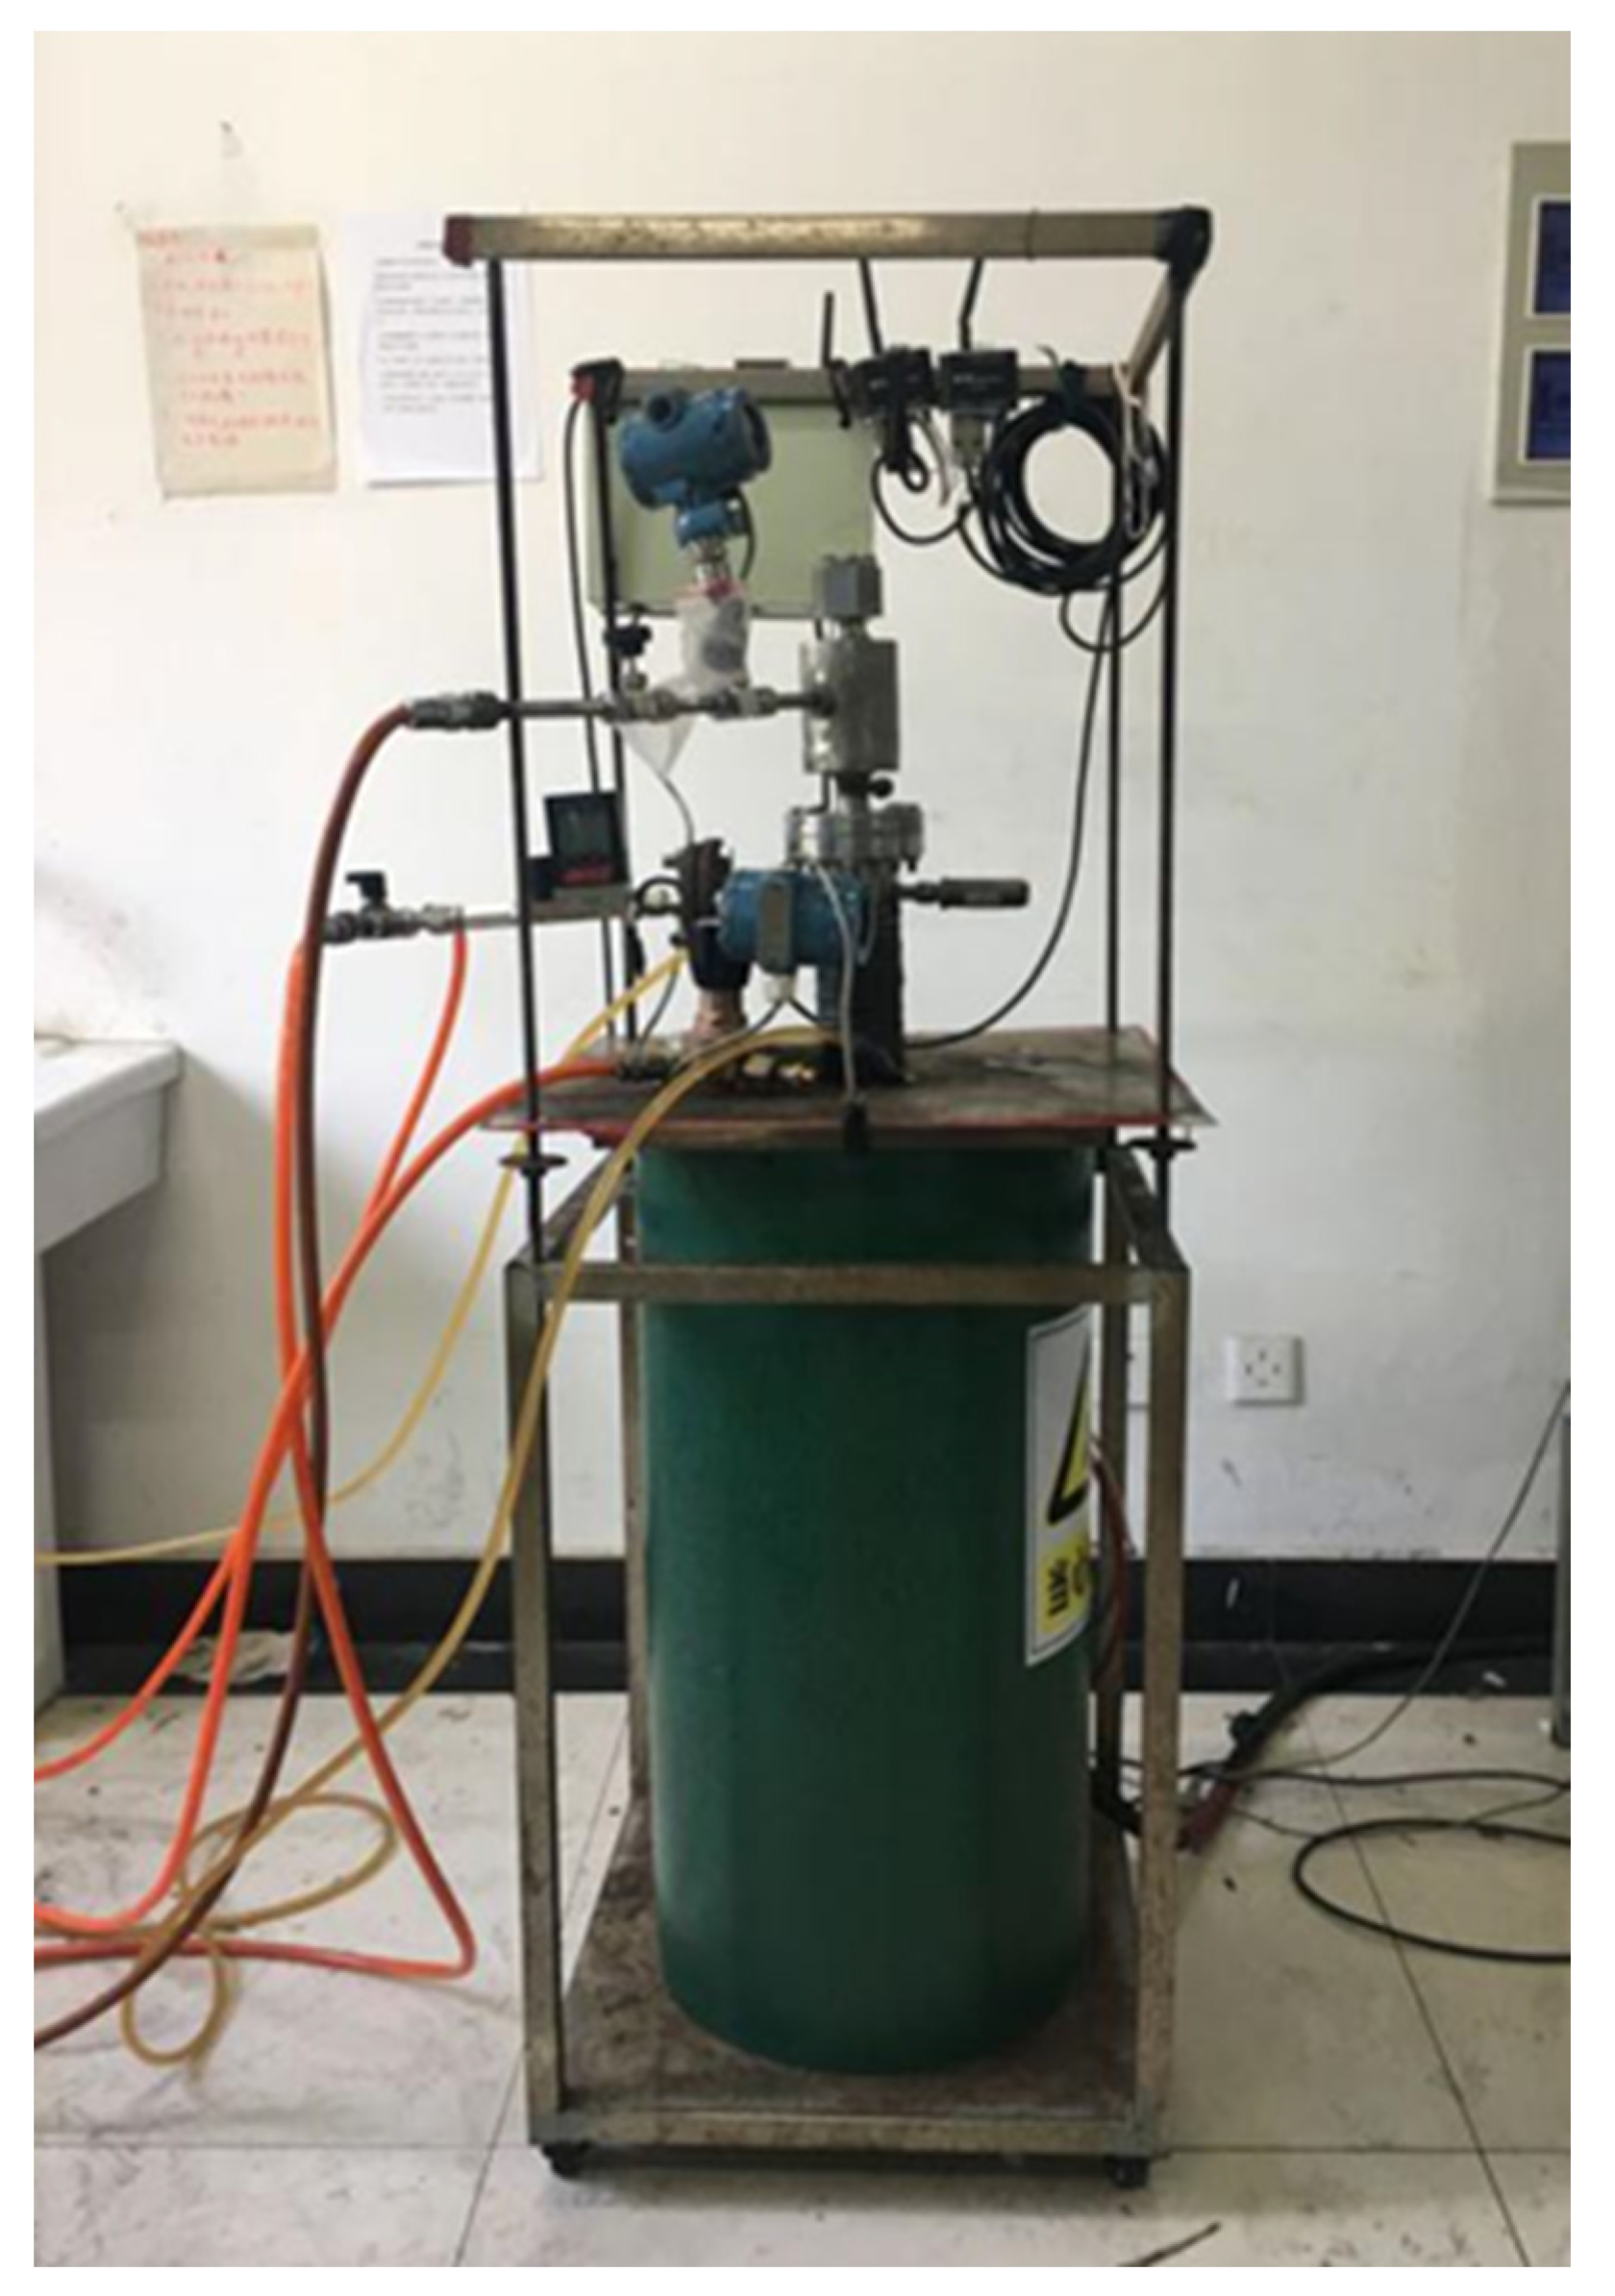
2.2. Experimental Equipment

The main device used in this study was a fluidized bed with an applied sound field (Shanghai in Chian Wuyi wy32003 signal generator) (Figure 2 and Figure 3). It was mainly composed of a fluidized bed, acoustic duct, acoustic generation system, and test system. Double stainless steel tubes were used as the reactor in the fluidized bed, and the inner tube was a fluidized bed. The gas entered the fluidized bed after preheating through the interlayer space between the outer and the inner tubes. The outer tube contained a heating cabinet. The flow rates of CO, H2 and N2 were adjusted and controlled by multiple flow meters so that the gas entering the fluidized bed could meet the composition and linear velocity requirements of the experiment. The gas mass flow controller was used to control the flow at the inlet of the fluidized bed through the iron ore inner tube. The velocity of the fluidized bed inlet line was controlled by a gas mass flow controller, and the reduction temperature of the fluidized bed was measured by a thermocouple. Prior to the experiment, inert gas was introduced to check the air tightness of the device. The sound wave generating system consisted of a signal generator and a loudspeaker. The generator was used to obtain the positive dark wave of a specific frequency, which was amplified by a power amplifier and then sent to the loudspeaker to generate sound wave. The sound wave entered the fluidized bed through an acoustic waveguide. After each experiment, inert gas was added to protect the reduced ore powder from oxidation. To evaluate the fluidized reduction viscosity, a pressure sensor was used to measure the bed pressure difference ΔP, and the fluidized reduction viscosity was evaluated using an observation window.

2.3. Experimental Scheme and Procedure

Prior to the start of the experiment, N2 was introduced into the fluidized bed. After the air was discharged, the outlet valve was closed, the pressure of the fluidized bed was increased to 0.5–0.6 MPa, and the air tightness of the equipment was checked. Then, the fluidized bed started to heat up. When the reduction temperature reached the target experimental temperature, the N2 valve was closed, and the reduction gas used in the experiment was passed through the system. During this process, the pressure was controlled by the tightness of the valve, and the experiment started when the pressure stabilized at the set pressure. In the experiment, the reduction temperature, linear velocity, pressure, and other related factors were set to the specified values, and the reduction experiment was carried out using H2 as the reducing gas. The metallization rate and bonding ratio of Newman ore for the process durations of 10, 20, 40 and 60 min were obtained with sound field power levels of 150, 300, 500 and 1000 W, respectively. We illustrated the experimental procedure, using the conditions of a sound field with an input power of 150 W and a duration of 10 min as an example. First, the fluidized bed was heated to the set temperature, and then the mineral powder (20 g) was weighed and added into the conical flask. After the temperature of the fluidized bed was reached, the air was discharged into the N2, and the air tightness of the device was checked. Then, data measurement software was used to adjust the gas flow rate, and at the same time, the H2 reducing gas was introduced to maintain the fluidized bed temperature at approximately 1023 K during the reduction, which was carried out for 60 min. A sound field with a power of 150 W was applied for 10 min, starting at approximately 20 min after the beginning of reduction. After the end of reduction, N2 was passed for 5 min to protect the ore powder from oxidation. After cooling to room temperature, the bonded and unbonded mineral powder in the fluidized bed was removed, and the bonding ratio was calculated. The adhesion ratio is the ratio of the binding mass of the reducing powder to the total mass of the reducing powder. A smaller adhesion ratio indicates better fluidization. Then, the reduced samples were analyzed by the potassium dichromate volumetric method and the ferric chloride titration method. Finally, the metallic iron (MFe) and total iron (TFe) contents and the metallization rate η were calculated. The metallization rate is calculated as follows:
η = M F e T Fe
where η represents the metallization rate; MFe stands for metal iron (g); and TFe stands for total iron (g).
The bonding ratio is calculated as follows:
Ω = Msticking/Mtotal
In the formula, Mtotal is the total quantity of the reduced materials, which is used to evaluate the quality of the reduced total materials of fine iron ore (g); Ω is the binding ratio; and Msticking refers to the amount of reduced adhesive substance, which is used to evaluate the quality of the reduced adhesive substance of fine iron ore (g).
The total mass of the material after reduction can be calculated as follows:
Mtotal = Msticking + Munsticking
In order to reduce the experimental error, we repeated the measurement twice and finally took the average value as the final experimental result. The pressure in the experiment was not expressed as an absolute value, and the atmosphere was set to 0 MPa. Because of the five factors of fine iron ore powder caking flow loss—the reduction temperature, reduction time and reduction pressure, reduction of the gas linear velocity, and pressure reduction gas species—through the orthogonal experiment, we concluded that a reduction temperature of 1023 k, linear velocity of 0.6 m/s, reduction time of 60 min, reduction pressure of 0.2 MPa, and reducing gas of H2 were the optimal operating parameters, which we used to analyze the bonding mechanism of fine iron ore and the influence of the sound field on the cohesive force of the Newman mine flow loss.
A higher metallization rate indicates better quality of the reduced ore powder. Therefore, the metallization rate and adhesion ratio were selected as the indices to determine the fluidized reduction effect.

3. Experimental Results and Discussion

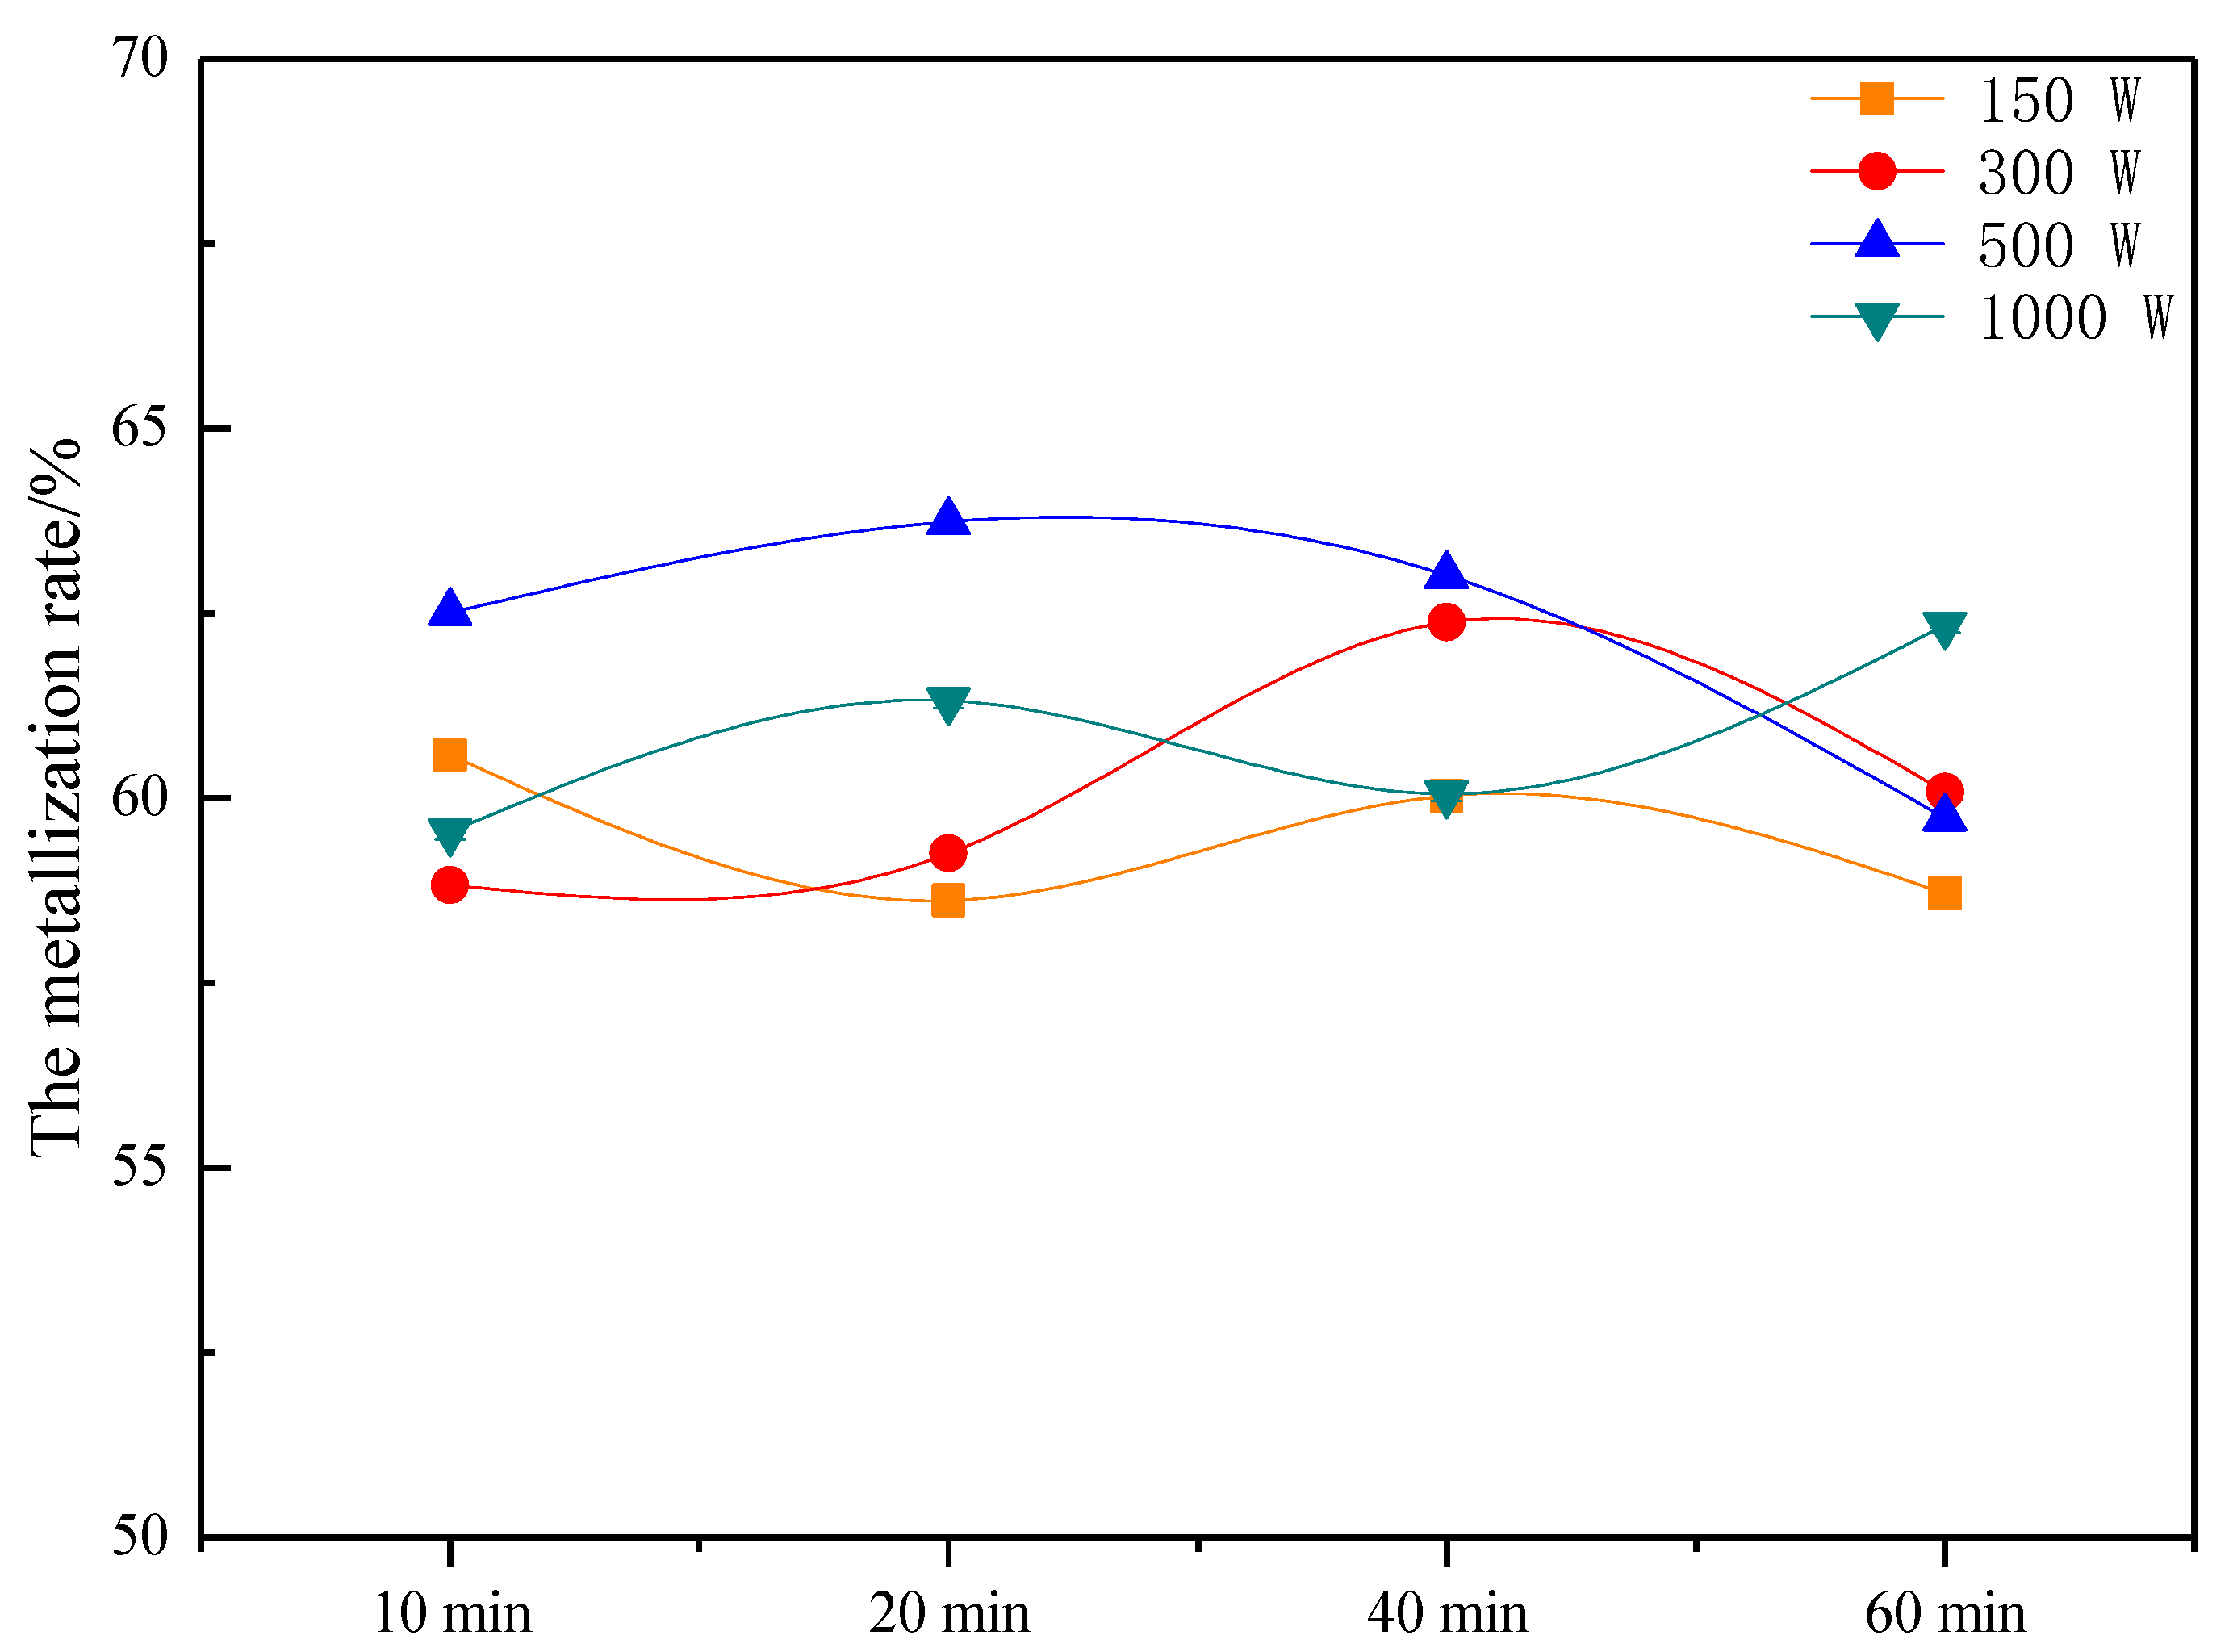
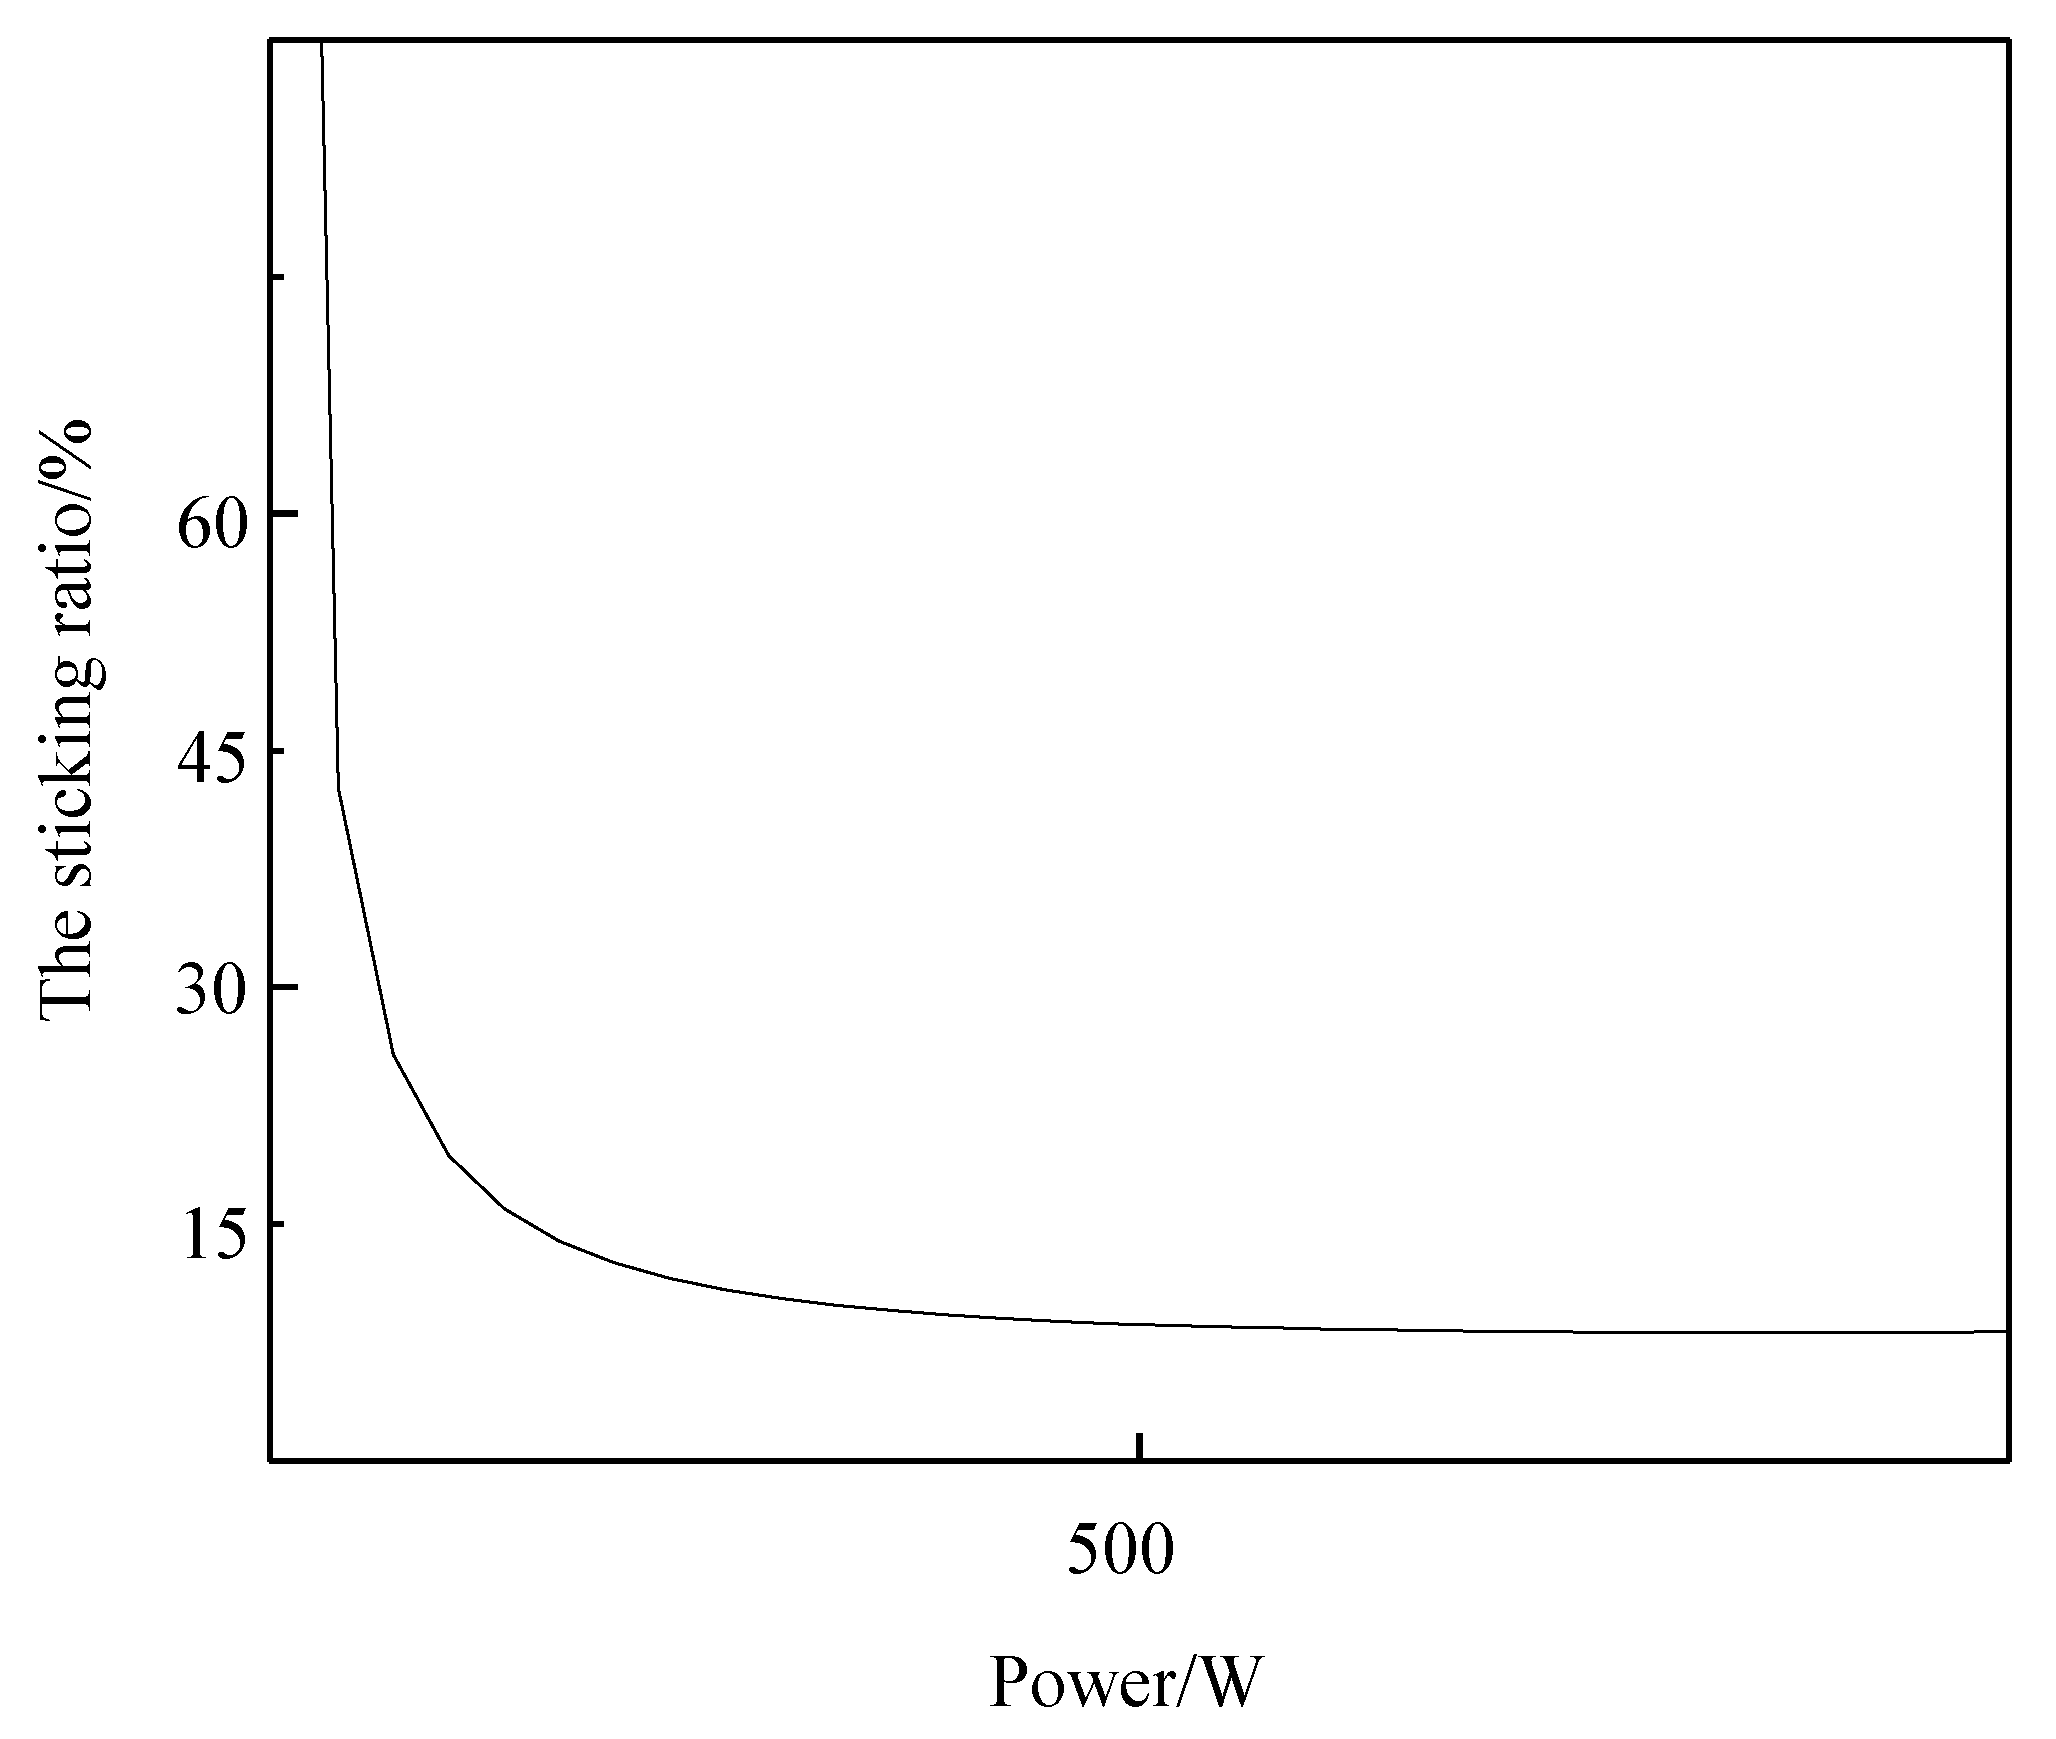
3.1. Influence of the Acoustic Power on the Reduction of Iron Ore Powder

Under the reduction temperature of 1023 K, linear velocity of 0.6 m/s, reduction time of 60 min, standard pressure, H2 as the reducing gas, and the absence of a sound field, the metallization rate of the Newman ore and the bond ratio were obtained as 58.97% and 45.39%, respectively. The measured metallization rate and bond ratio obtained with the addition of sound fields of different powers and times are shown in Table 2 and Table 3.
An examination of the data presented in Table 2 and Table 3 shows that upon the addition of the sound field, the metallization rate of the Newman ore increased slightly, while the bond ratio significantly decreased. To more intuitively reflect this change, the obtained results are plotted in Figure 4, Figure 5 and Figure 6.
As can be observed from Figure 4, after the addition of the sound field, the metallization rate of the Newman ore increased, but the increase was small, and a few samples even showed a decreased metallization rate. Moreover, the metallization rate of the Newman ore with different power sound fields showed fluctuations with respect to the ultrasonication time such that no meaningful systematic dependence on the ultrasonication time could be deduced from the data. Therefore, it can be concluded that the sound field had little effect on the metallization rate of the Newman ore.
Based on the analysis of Figure 5 and Figure 6, the following conclusions can be drawn: (1) The sound field significantly improved the fluidized state of the fluidized bed, and the bond ratio of the ore powder decreased strongly from 45.39% to less than 30%. (2) The optimal application time of the sound field was between 20 and 40 min. For the addition of the 150, 300, 500, and 1000 W sound fields, the optimal times were approximately 33, 25, 25, and 20 min, respectively. After the duration of the sound field application exceeded the optimal time, the bond ratio rose slightly. (3) Better results were obtained with the application of greater sound field power, with the bond ratio of the Newman mine ore decreasing monotonically with the increasing power of the sound field. However, the reduction of the bond ratio was small for powers greater than 500 W. In practical production, considering the economic cost, the sound field power should be set to approximately 500 W.

3.2. Influence of the Acoustic Frequency on the Fluidization Characteristics of Iron Ore Powder Particles

The acoustic frequency is also an important parameter affecting the particle fluidization quality in an acoustic fluidized bed. When an acoustic wave travels in a fluidized bed, the cross-sectional area of the bed is very small compared with that of a sphere centered around a loudspeaker, and the acoustic wave can be regarded as a plane wave. The effect of the acoustic frequency on the fluidized bed particle concentration is more complex. First, the attenuation of the acoustic wave in the medium is related not only to the frequency, but also to the temperature and pressure of the atmosphere. Acoustic attenuation can be calculated using Equations (4) and (5):
α classic + α running = ( 1.60 ± 0.01 ) × 10 8 [ 0.33 T T + 110 . 4 ] f 2 p *
α vibration = 868.6 μ maximum f r σ × ( f f r ) 2 1 + ( f f r ) 2
where α is the attenuation caused by acoustic absorption in dB/100 m; T is the absolute temperature in K; P* is the relative atmospheric pressure; μmaximum is the maximum intensity loss per wavelength; fr is the relaxation frequency with great loss per unit wavelength (Hz); and f is the frequency of the sound wave in Hz.
According to Equations (4) and (5), the attenuation increases and the sound pressure decreases with a higher acoustic frequency, which is not conducive to enhanced fluidization due to the sound field. The increase in the frequency will increase the acceleration of medium particles and particle vibrations and will promote the overcoming of the attractive interparticle forces. Therefore, assuming that attenuation factors are taken into account and sound pressure levels of a sufficient intensity are maintained, an increased acoustic frequency is conducive to reducing the bubble size and obtaining more uniform particle dispersion.
For a sound pressure level of 100 dB and acoustic frequencies in the 50–500 Hz range, the relationship between the minimum fluidization velocity and acoustic frequency is shown in Table 4 and Figure 7. It was observed that the minimum fluidization velocity was the lowest for the frequency of approximately 150 Hz, and the minimum fluidization velocity increased for frequencies higher or lower than 150 Hz. This is mainly because when the frequency of a sound wave is too low, the vibration period is too long, which causes the particles to quickly restore the bond after the initial disturbance. When the frequency is too high, the vibration period is too short, which causes the particles to not follow, both of which weaken the effect of the sound wave and even have no effect when the frequency is too low or too high. When the frequency changes in the range of 150 Hz, the fluidization of ultrafine particles in the process of fluidization has been eliminated, while channeling, surge, and other fluidization phenomenon can achieve complete fluidization, and the fluidization quality is very good. However, when the frequency is lower than or higher than 150 Hz, the fluidization phenomena such as piston flow and flow channel appear in the process of fluidization, and the fluidization quality decreases. Therefore, there is an optimal range of the influence of the frequency on particle fluidization. If the frequency is too high or too low, the effect of the sound waves will be reduced or even eliminated entirely.
Figure 8 shows the distribution of the iron ore powder particles for a bed height of 130 mm, sound pressure of 100 dB, and frequency variation from 50 to 500 Hz. It is observed from the figure that the acoustic frequency had no obvious effect on the particle concentration in the bed wall area. There was an optimal frequency range for the effect on the particle concentration in the central region. When the frequency varied from 100 Hz to 400 Hz, the particle dispersion in the center area was more uniform, the bubble size was smaller, and the particle concentration was larger. When the frequency was higher than 400 Hz or lower than 100 Hz, the acoustic wave had no effect on the particle concentration distribution.

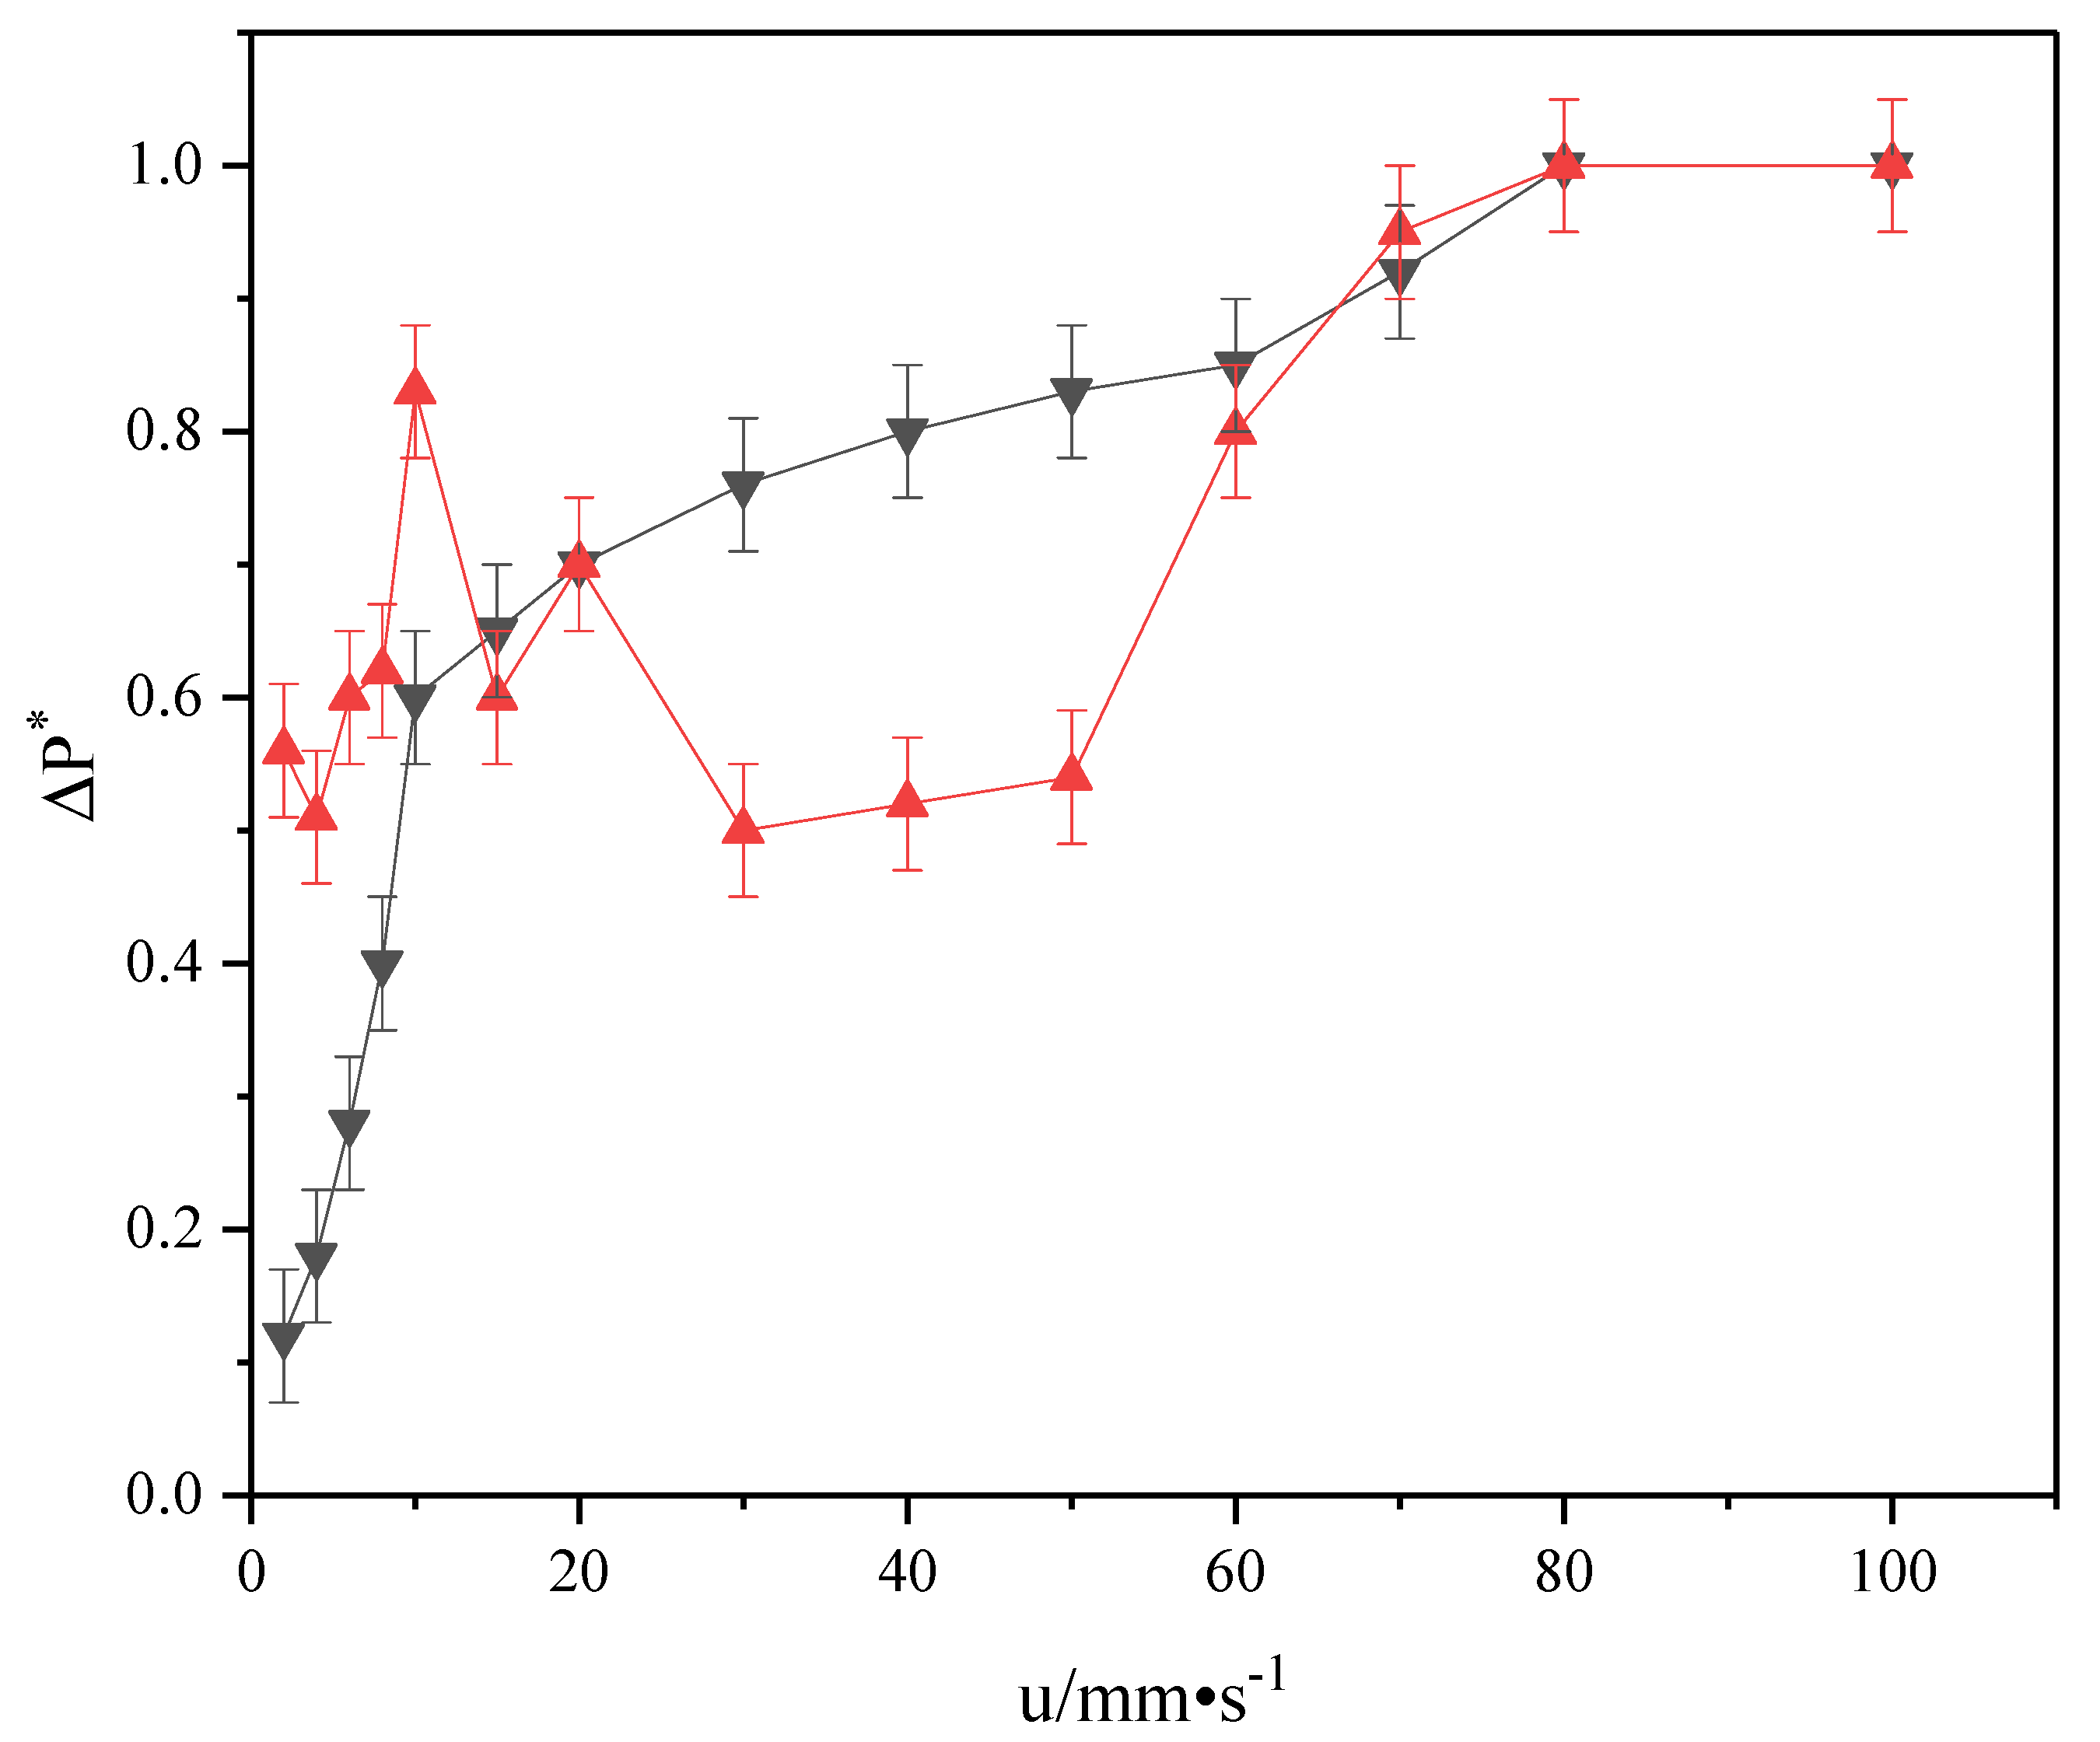
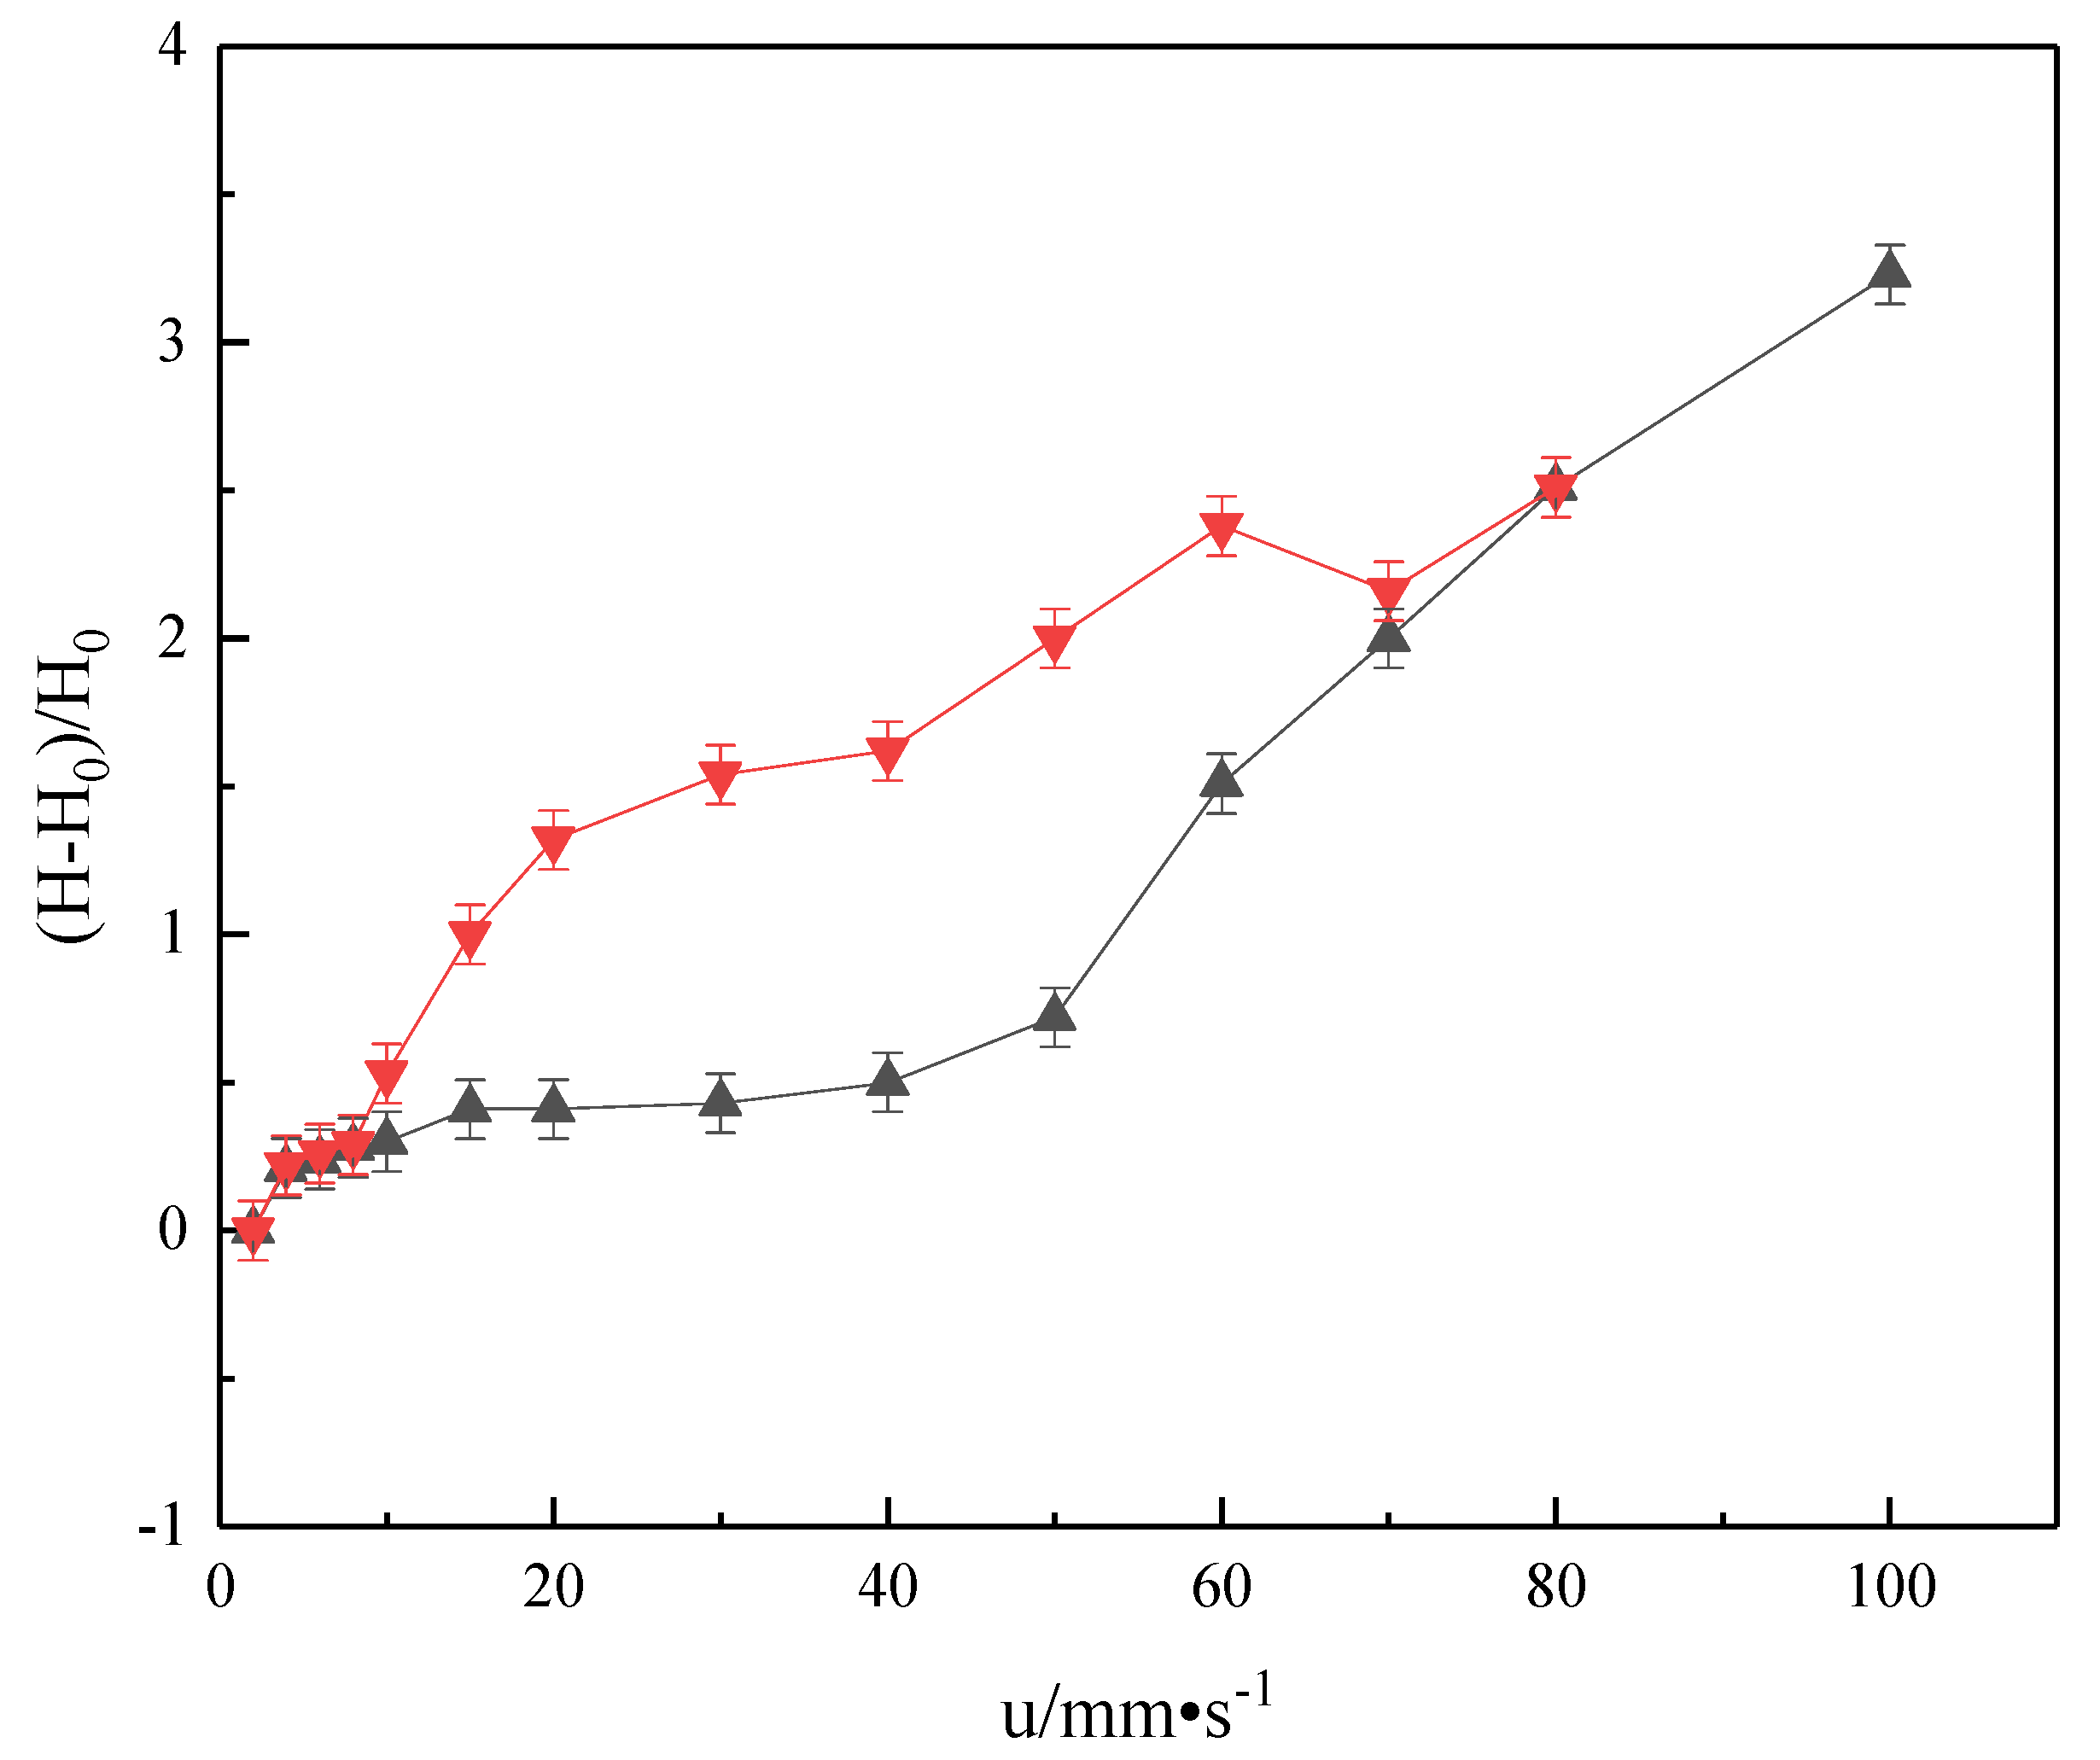
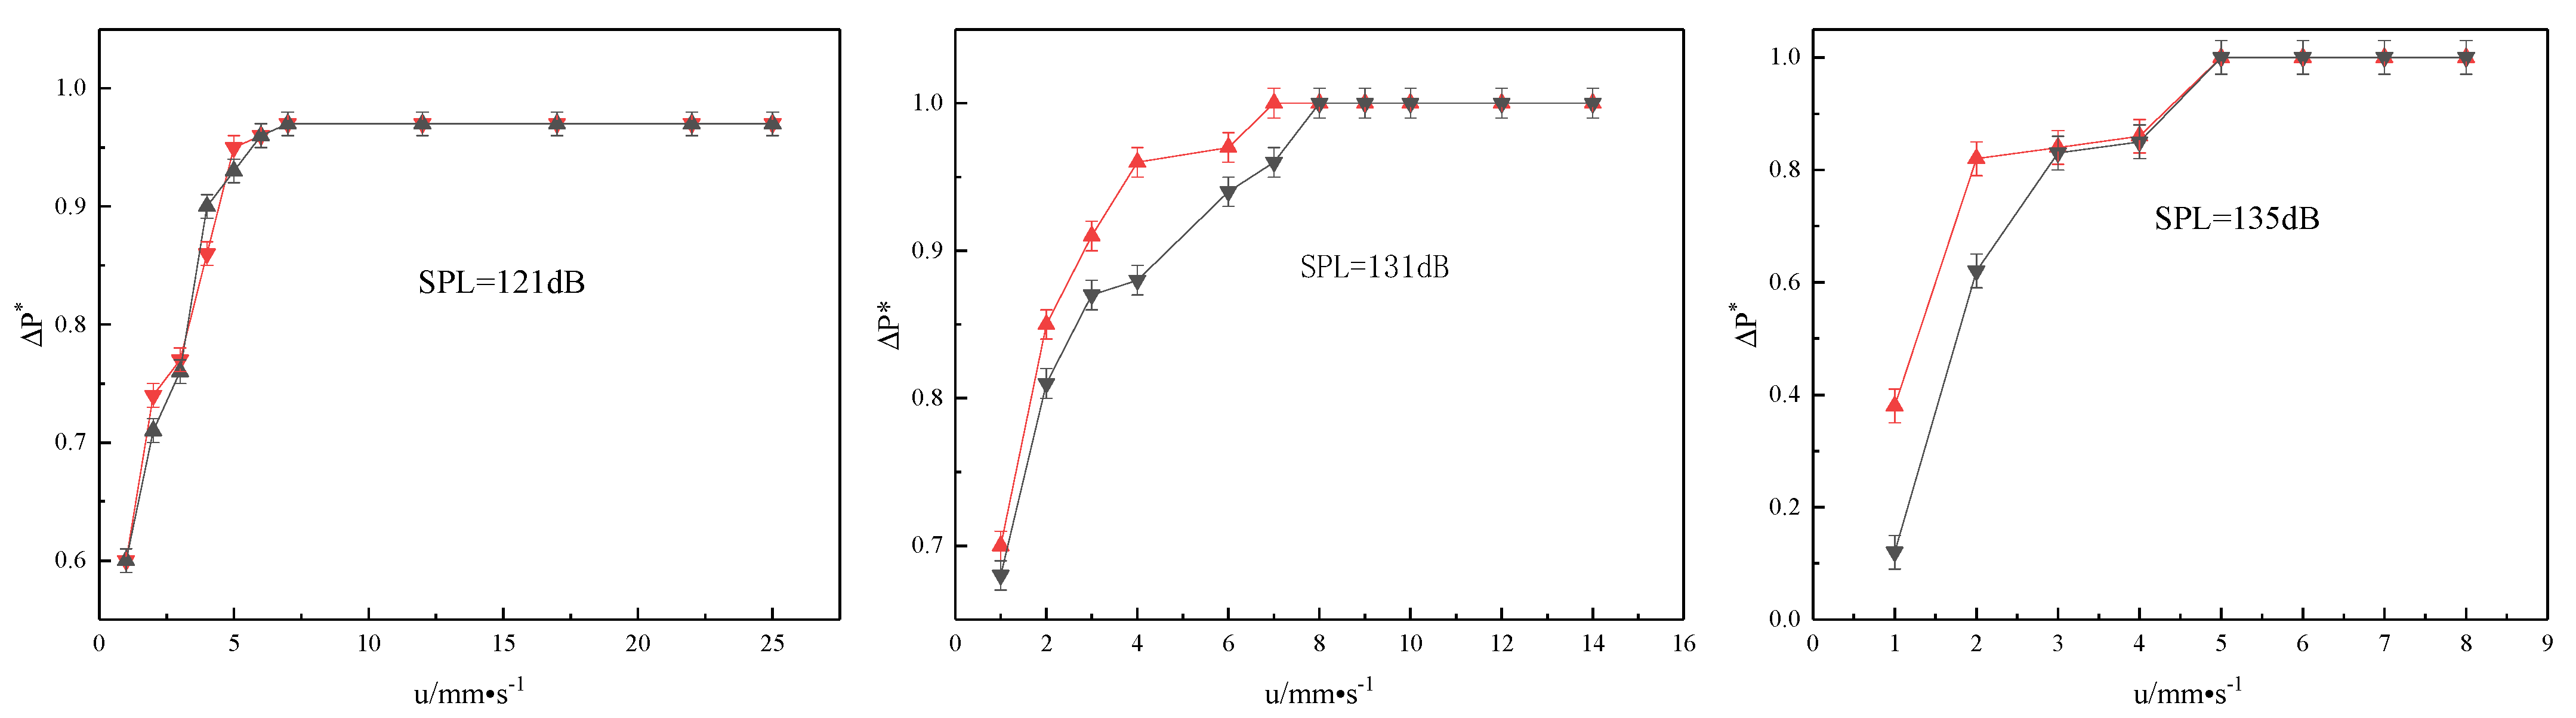
3.3. Influence of the Sound Pressure on the Fluidization Characteristics of the Iron Ore Powder Particles

Figure 9 and Figure 10 show the pressure drop and expansion curves of the fine iron ore powder particles in the fluidization in the absence of a sound field. As can be observed from Figure 9, after gas entered the bed, the bed pressure drop would initially rise rapidly due to the poor permeability of the ultrafine powder. After rising to a certain height, the piston was destroyed and fell onto the distribution plate in a block shape. Gas flowed through the gap between the blocks, forming the groove flow, and the bed pressure drop reached the minimum value. Then, the pressure drop increased slightly, indicating that the gully flow was stable during this period of time. At the same time, we also observed from Figure 10 that the bed height did not change much within this range of the gas velocity. Continuing to increase the gas velocity due to the action of the airflow, the powder would form small clusters in the trench flow, and the bed pressure drop rose. When the gas velocity exceeded approximately 80 mm·s−1, all of the material was fluidized, and the pressure drop did not change, but the bed pressure was reduced to the theoretical pressure due to the removal of the powder. The results show that in the absence of the sound field, the fluidization process of the iron ore powder was similar to that of the other ultrafine powders and still proceeded through the three stages of piston flow, channel flow, and agglomeration fluidization.
Figure 11 shows the pressure fall–velocity and the expansion rate–velocity curves of the fine iron ore particles in fluidization for the acoustic frequency of 120 Hz and the sound pressures of 121, 131, and 135 dB. Under the above conditions, due to the addition of acoustic waves, there was no piston flow in the fluidization process, and the channel flow was well suppressed or even eliminated. As observed from the figure, except for the sound pressure of 121 dB, the gully flow was absent when the sound pressure was greater than 130 dB. A comparison of Figure 9 and Figure 11 clearly shows that the introduction of an acoustic wave significantly reduced the minimum fluidization velocity of the particles, and the turning point of the pressure drop curve was sharper, indicating that the size of agglomeration was greatly reduced and uniform after the introduction of acoustic waves.

4. Sound Field Inhibits the Bonding Loss of the Flow Mechanism

4.1. Characteristics of the Sound Field in the Fluidized Bed

4.1.1. Fluidization Characteristics

Levy et al. [16] concluded that acoustic waves can stimulate the vibration of bed materials, enhance the force between the particles to help destroy large clusters, and promote the stable fluidization of the bed. They analyzed the distribution law of the particle concentration in a fluidized bed under the application of a sound field and the effects of the operating gas velocity, as well as the effects of the intensity and frequency of the applied sound field on the particle concentration. It was found that with increasing sound pressure, the vibration velocity of the airflow and the shear action increase, the initial fluidization velocity of particles decreases significantly, and the bed is easy to fluidize. With the increasing acoustic frequency, the minimum fluidization velocity first decreases and then increases. For a low sound wave frequency, the vibration period is long, and the bed is affected by isolated rather than continuous sound waves. The increase in the frequency will increase the vibration acceleration of medium particles, weaken the interparticle forces, and help to reduce the bubble size. A larger sound pressure corresponds to a greater amplitude of acoustic wave vibration and airflow vibration velocity. This leads to larger particle displacement per unit of time, a smaller bubble size, higher bubble disintegration and regeneration frequencies, and a higher particle concentration. Increasing the sound pressure level can also reduce the uplift of fine particles [17].

4.1.2. Energy Transfer

Herrera and Levy [18] used a one-dimensional virtual fluid to simulate constant velocity acoustic waves and theoretically described the transmission of standing waves through the whole bed. Guo et al. [19] experimentally studied the influence of the acoustic frequency and acoustic pressure level on the fluidization state of nano and microparticles and predicted the influence of acoustic waves on the change of the agglomeration size through the energy conservation equation.
According to the Stokes–Kirchhoff formula [20], the absorption coefficient of a sound wave is proportional to the square of the sound wave frequency. As the frequency increases, the acoustic attenuation increases, and the acoustic energy acting on the particles decreases. Guo et al. [19] pointed out that the transmission of sound energy depends on a momentum exchange. The energy produced by sound waves increases with the increasing sound pressure, and therefore, a higher sound pressure is more conducive to the particle vibration acceleration. With the increase in the sound pressure level, the size of the particle clusters decreases. It was also found that the particle size decreases with the increasing acoustic frequency when the acoustic frequency is lower than the critical frequency and increases with the increasing acoustic frequency when the acoustic frequency is greater than the critical frequency. The acoustic energy in an acoustic field-assisted fluidized bed can be calculated by the following formula [18]:
E ac = π 4 d 2 p I = π 4 d 2 p k a 10 ( 12 + spl ) ( f f c ) n exp ( spl spl c spl c )
Roy et al. [21] studied the transmission of sound waves in a fluidized bed and obtained the natural frequency fn of the particle vibration:
f n = 1 4 L RT ρ g ε b ( 1 ε b ) ρ p
where L is the height of the static bed, R is the gas constant (286.7 J/(kg·K)), T is the absolute temperature of the fluidized bed (assumed to be 298 K), and ρg and pp are the densities of the gas and particles, respectively, and are 1.185 kg/m3 and 2500 kg/m3, respectively. The bed voidage εb is 0.4. For 10 μm particles, the resonant frequency is approximately 100 Hz. When the sound wave frequency is greater than the resonant frequency, the attenuation coefficient of the sound wave in the fluidized bed increases significantly with the increasing frequency, and the sound pressure decreases rapidly.

4.2. External Force of Iron Ore Powder Particles in the Sound Field

The difference between the fluidized fine particles of the iron ore powder and the common granular materials is that the particles are small and there is a very strong attractive force between the particles. Therefore, to understand the fluidized characteristics of the fine particles and the bonding and agglomeration behavior in the fluidized bed, it is necessary to analyze the interaction between the particles in depth.

4.2.1. Viscous Force

In the gas-solid fluidized system, the small size and physical properties of particles make it necessary to consider the Van der Waals force between the particles in the analysis of particle interactions. For the two-dimensional numerical simulation study, the following assumptions were made: (1) The gas was a dry gas, and the particles were dry particles. Therefore, the liquid bridging force, electrophoresis force, and electrostatic force between particles were not considered. (2) In the calculation of the viscous force between the particle and the wall, only the Van der Waals interactions between the particle and the upper, lower, left, and right walls were considered, and the viscous force between the particle and the front and rear walls was ignored [22].
The Van der Waals force between particle I and particle J is calculated as
F vd , ij = H a , p d p 24 h ij 2
The Van der Waals force between particle I and the wall is calculated as
F vd , iw = H a , w d p 12 h iw 2
In the formula, Ha is the Hamaker constant, usually in the order of 10−20 J, hij is the distance between the surface of particle I and particle j, and hiw is the distance between the surface of particle I and the wall:
h ij = ( x i x j ) 2 + ( y i y j ) 2 d p
d p = 2 d i d j d i + d j
It is observed from the above formula that the Van der Waals force is related to the particle–particle or particle–wall distance. Since Hij or Hiw is in the denominator, if its value is close to zero, the viscous force will be infinite, and the particle bonding is not in agreement with the experimental data. Therefore, the minimum distance hij or hiw, when no bonding occurs between cohesive particles, is set as the shear distance or separation distance, usually 4.0 × 10⁻¹⁰ m. When the particle–particle distance or particle–wall distance is less than the shear distance and particle collision deformation occurs, the viscous force is no longer calculated according to the Van der Waals formula; rather, the surface viscous force model is adopted:
F ad = d p γ π
where γ is the surface energy constant per unit area:
γ = H a 24 π h ct 2
In the formula, hct is the shear distance, which is 4.0 × 10⁻¹⁰ m.
Therefore, the viscous force between particles and between particles and the wall surface is, as shown in Figure 12, the following:
F co { F vd       h ij   or   h iw 4.0 × 10 10   m F ad       h ij   or   h iw < 4.0 × 10 10   m

4.2.2. Van der Waals forces

Van der Waals interactions give rise to mutual attraction between molecules. This force was first proposed by Van der Waals to explain the deviation of the behavior of gases from the ideal gas law under high pressure by assuming an attractive interaction between the gas molecules [23,24]. The following is a brief introduction to the calculation of the Van der Waals attraction:
F cw = AS f 6 π z 0 3 = h ω S f 8 π 2 z 0 3
where A is the Hamaker constant, determined by material properties, h ω is the Lifshitz constant, fs is the corresponding area, and Z0 is the shortest distance between two solids.
From the formula for the Van der Waals attraction, it can be seen that the particle spacing Z0 is the most important parameter for determining the Van der Waals attraction between solids, and any effect that increases Z0 will significantly reduce the viscous force, therefore affecting the fluidization behavior of the powder. Experiments have shown that Van der Waals forces are significant only when the particles are close enough together to be separated by molecular-scale distances (e.g., 0.2–1 nm) [25]. The factors affecting particle spacing can be divided into two categories: surface roughness and the use of isolators.
a.
Effect of Surface Roughness
A rough particle surface is a problem encountered in particle preparation, and its influence is only analyzed here. Figure 13 and Figure 14 represent different roughness conditions of the particles.
The surface of real particles is very complex, but for the effect of particle spacing, it can be divided into two categories. The first case is shown in Figure 13, where the surface roughness limits the proximity of two particles and makes the effective spacing larger. The second case is shown in Figure 14 and is completely opposite to the situation in Figure 13. By contrast, roughness makes particles come in closer contact, which may increase the overall Van der Waals force, such as at a high temperature. On the other hand, in the case of elastic deformation, although the contact surface is increased, the adhesive force will not increase because the particles will return to their original state once the adhesive is separated.
b.
Use of Isolators
Isolators may be either small molecules attached to the interacting particles or small particles. The use of small molecule isolators enables the gas used to fluidize the powder to have an effect on convection, even when in the absence of capillary condensation. For the small particles used as isolators, the comparison between the size of the added fine particles and the fluidized particles plays the key role. When the size of the added particles is equal to the particle gap, the added particles can act as a bridge between adjacent particles, thus increasing their viscosity. When the addition of fine particles is properly selected to make the particles with larger particle spacing, the viscosity will also be reduced, and the otherwise difficult-to-fluidize particles will be fluidized. Therefore, the exact effect after the addition of fine particles depends on the specific system studied.

4.2.3. Electrostatic Force

Generally, when two solids come into contact, they can charge each other [26,27]. The contact potential difference between two solids is given by
U = 1 2
where 1 and 2 are two kinds of electron affinity for solid contact.
The contact between solids will generate an electrostatic attraction between solids. In this case, due to the mutual attraction of induced charges, the attraction between charged particles and uncharged particles can be calculated by the classic Coulomb equation:
F e = Q 2 [ 1 z ( R 2 + z 2 ) 1 / 2 ] 16 π ε 0 z 2
where Q is the charge of the particle; R is the particle radius; Z is the adhesion distance; and ε0 is the dielectric constant in the vacuum. For the latter contact charged case, such as between the particle and the bed wall, the calculation formula of the electrostatic attraction is [28] as follows:
F w = π ε 0 R ( Δ U ) 2 z
where ΔU is the contact potential difference.

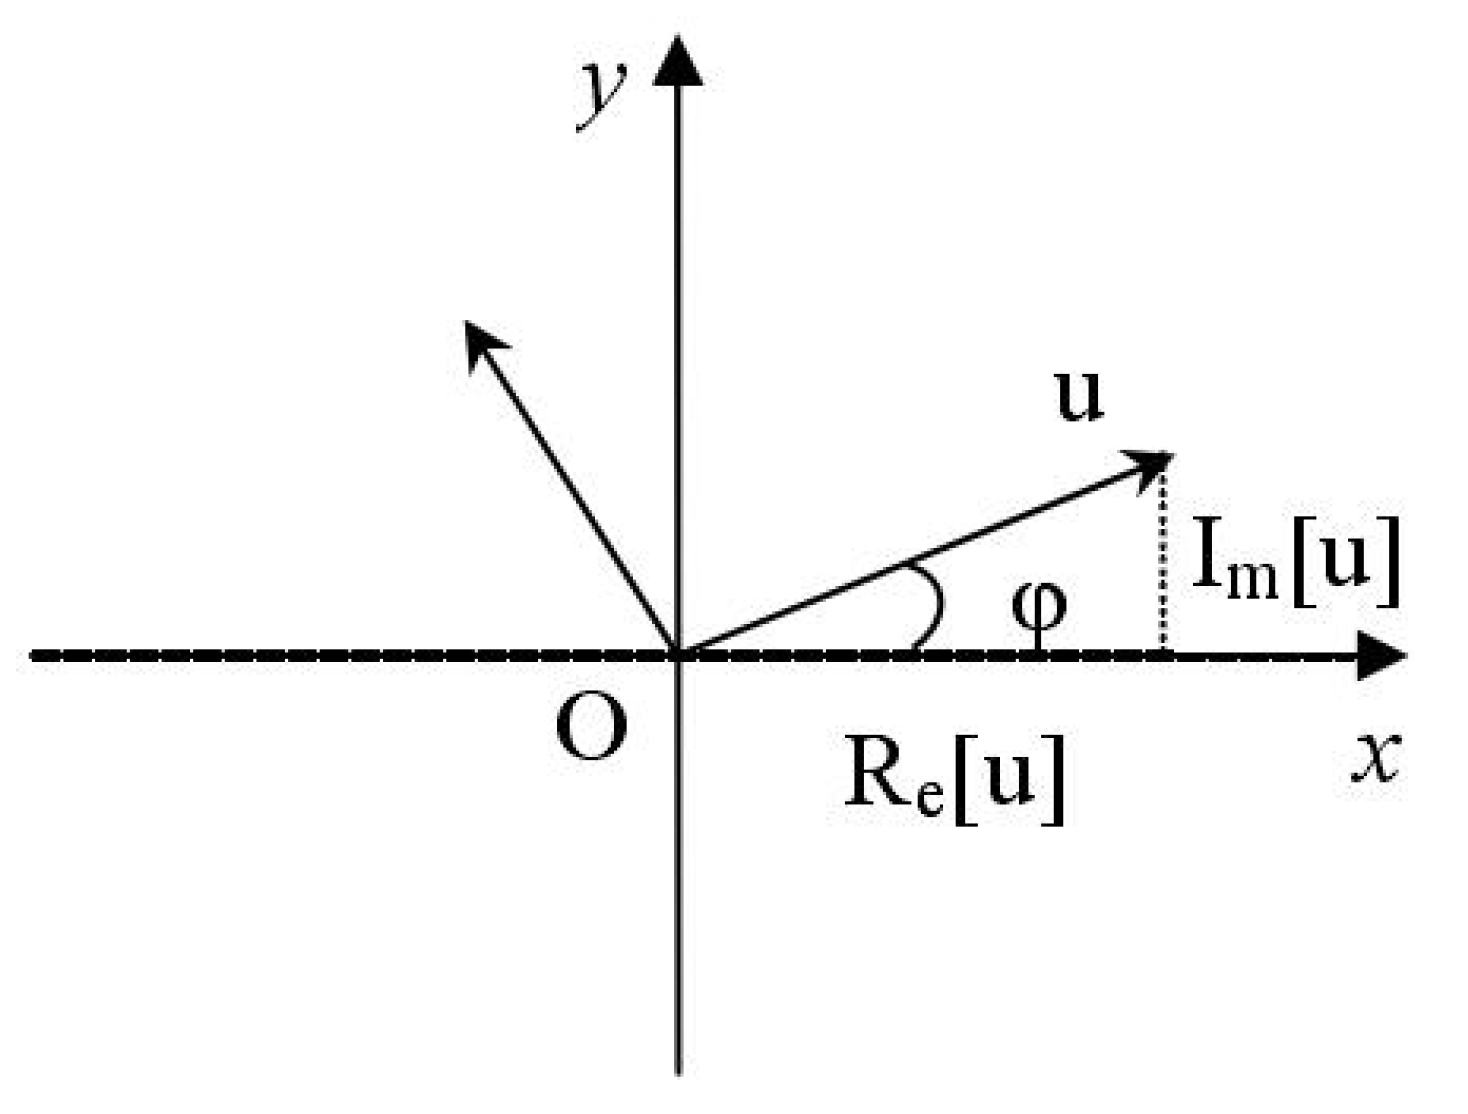
4.2.4. Acoustic Force

We could first make the following assumptions: the sound pressure of the external sound field is far lower than the atmospheric pressure, the relationship between the parameters is linear, and the ultrasonic field is represented by plane wave propagation. Based on linear acoustics, the sound pressure level is expressed as [29]
spl = 20 lg ( μ ac 2 μ ref )
where spl is the sound pressure level in decibels, μref is the reference speed (4.83 × 10⁻⁸ m/s), and μac is the acoustic velocity. The speed of sound increases exponentially with the sound pressure, as shown in Figure 15.
Energy attenuation will occur when an acoustic wave propagates in a gas medium, and therefore, the one-dimensional damped wave propagation equation is adopted, as shown in Figure 16. In this equation, the classical attenuation coefficient is proportional to the square of the frequency, as shown in Equation (21). Taking the cosine propagation of the sound wave along the x-axis as an example, the particle velocity of the plane wave is given by
μ ac ( x , t ) = u ac , max cos ( ω t kx + φ ) e α x
α = b ω 2 2 ρ c 0 3
ω = 2 π f
k = 2 π f c 0
where μac,max is the peak velocity of the acoustic wave, α is the attenuation coefficient of the sound wave in the unit direction ω is the angular velocity, k is the wave number of the damped wave, φ is the phase angle, ρ is the density of the gas, and c0 is the speed of sound at 15 degrees Celsius and one standard atmosphere. The order of magnitude of the general b value is usually 10−5 kg/(m·s).
After the sound field is applied in the fluidized bed, the acoustic wave affects the state of convection in that the gas molecules propagate vibrationally from the position of the particles. Thus, the gas molecules can pick up the acoustic wave energy provided to the particle. Finally, the acoustic wave interacts with the particles. This force can be regarded as an aerodynamic force generated by the ultrasonic field, and the acoustic velocity is the additional pulsating velocity of the gas velocity. Therefore, the force can be calculated by the equation of the force between the gas and the particles [30].
If the particle is assumed to be in a state of stress equilibrium before the ultrasonic effect, the acoustic force can be expressed as follows:
F ac = β v p 1 ε g ( μ ac v p )
where vp is the volume of a single particle, μac is the acoustic velocity, vP is the particle velocity, and β is the gas-solid correlation coefficient. In the sound field, the relationship between the sound energy and sound pressure is shown as follows:
E SCU = 1 4 π d p 2 k a 10 ( 12 + SPL ) f f c n e ( SPL SPL C ) / SPL C
We can substitute Equation (19) into Equations (4)–(20) to obtain the relationship between the sound energy and sound velocity:
E SCU = 1 4 π d p 2 k a 10 12 ( u ac 2 u ref ) 20 f f c n e lg ( u ac 2 u ref ) 20 SPL C
It is observed from the above formula that the sound energy increases exponentially with the sound speed. This implies that when the sound energy is raised to a certain value, the growth range of the sound speed with the sound energy growth will be greatly reduced. It is found from Equation (24) that the acoustic force absorbed by the particle is directly proportional to the sound velocity. Therefore, it can be considered that when the sound field energy reaches a certain value, the influence of the sound field on the fluidization effect of the fluidized bed will be reduced, as shown in Figure 17.
According to the experimental results and Equation (26), we could get the influence of different power on the fluidization effect, as shown in Figure 17. In the experiment, we measured the influence of four kinds of sound field power on the convection effect. It was found that when the power exceeded 500 W, the reduction of the bond ratio of the Newman ore was obviously decreased by increasing the sound field power. This is in agreement with the above theoretical analysis.

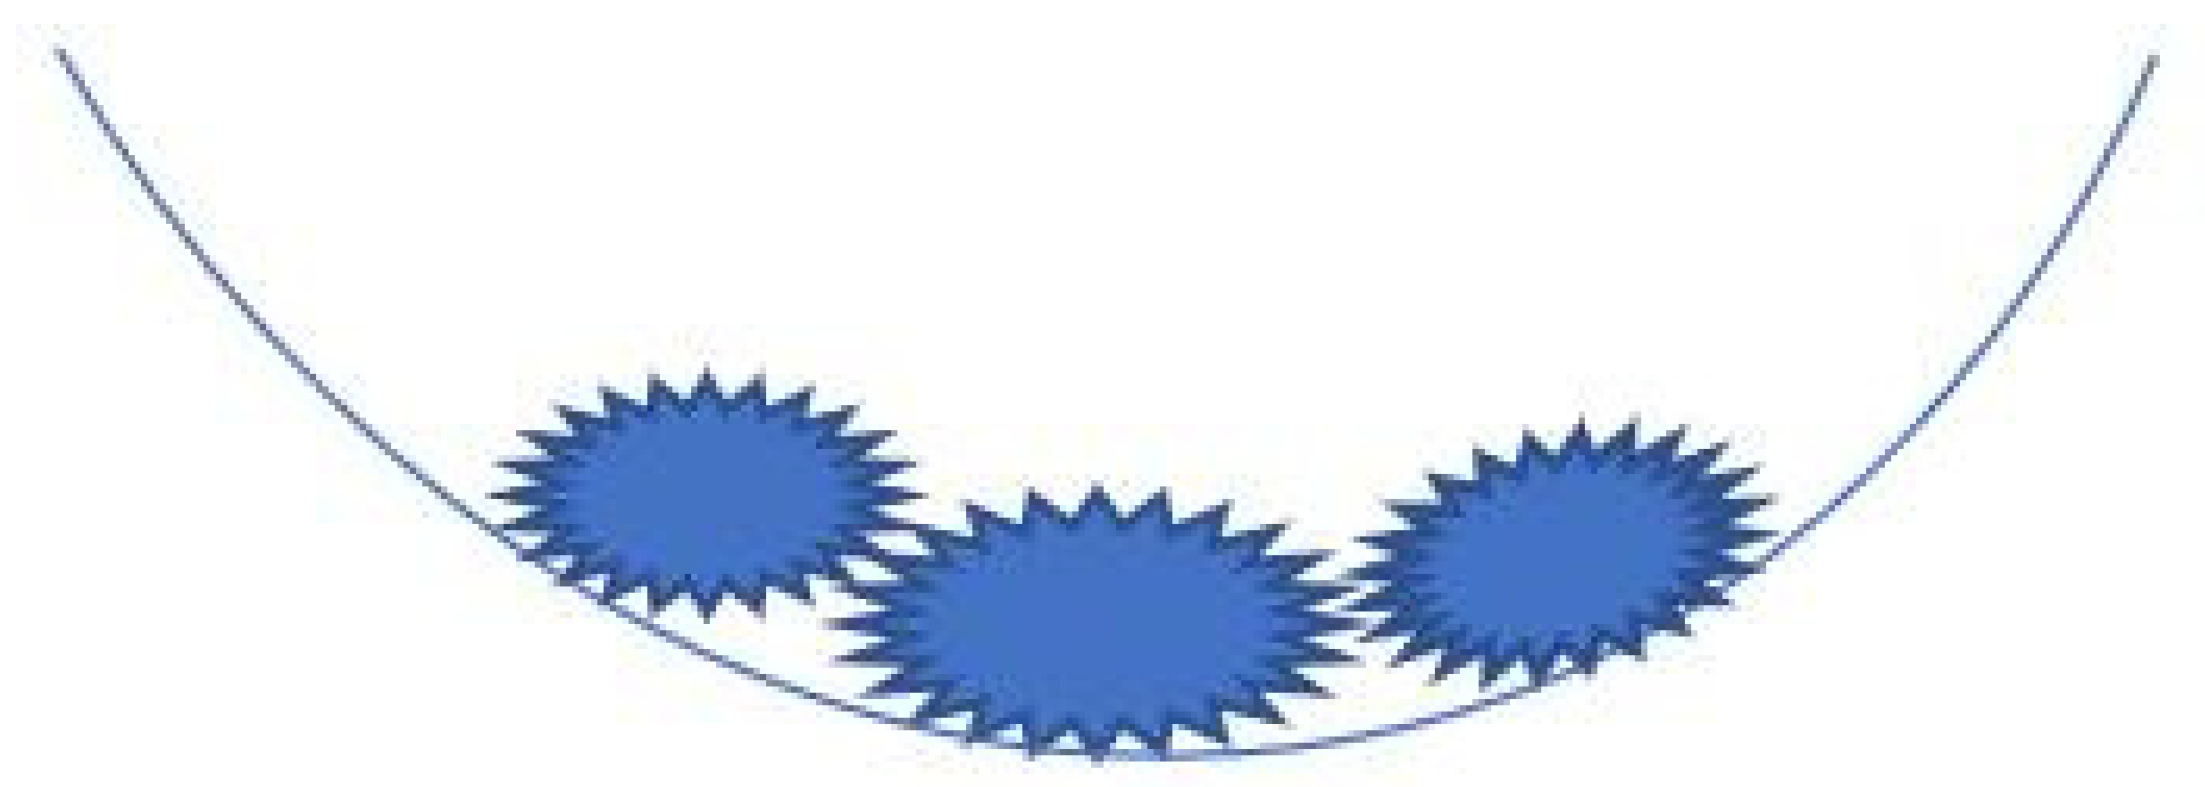
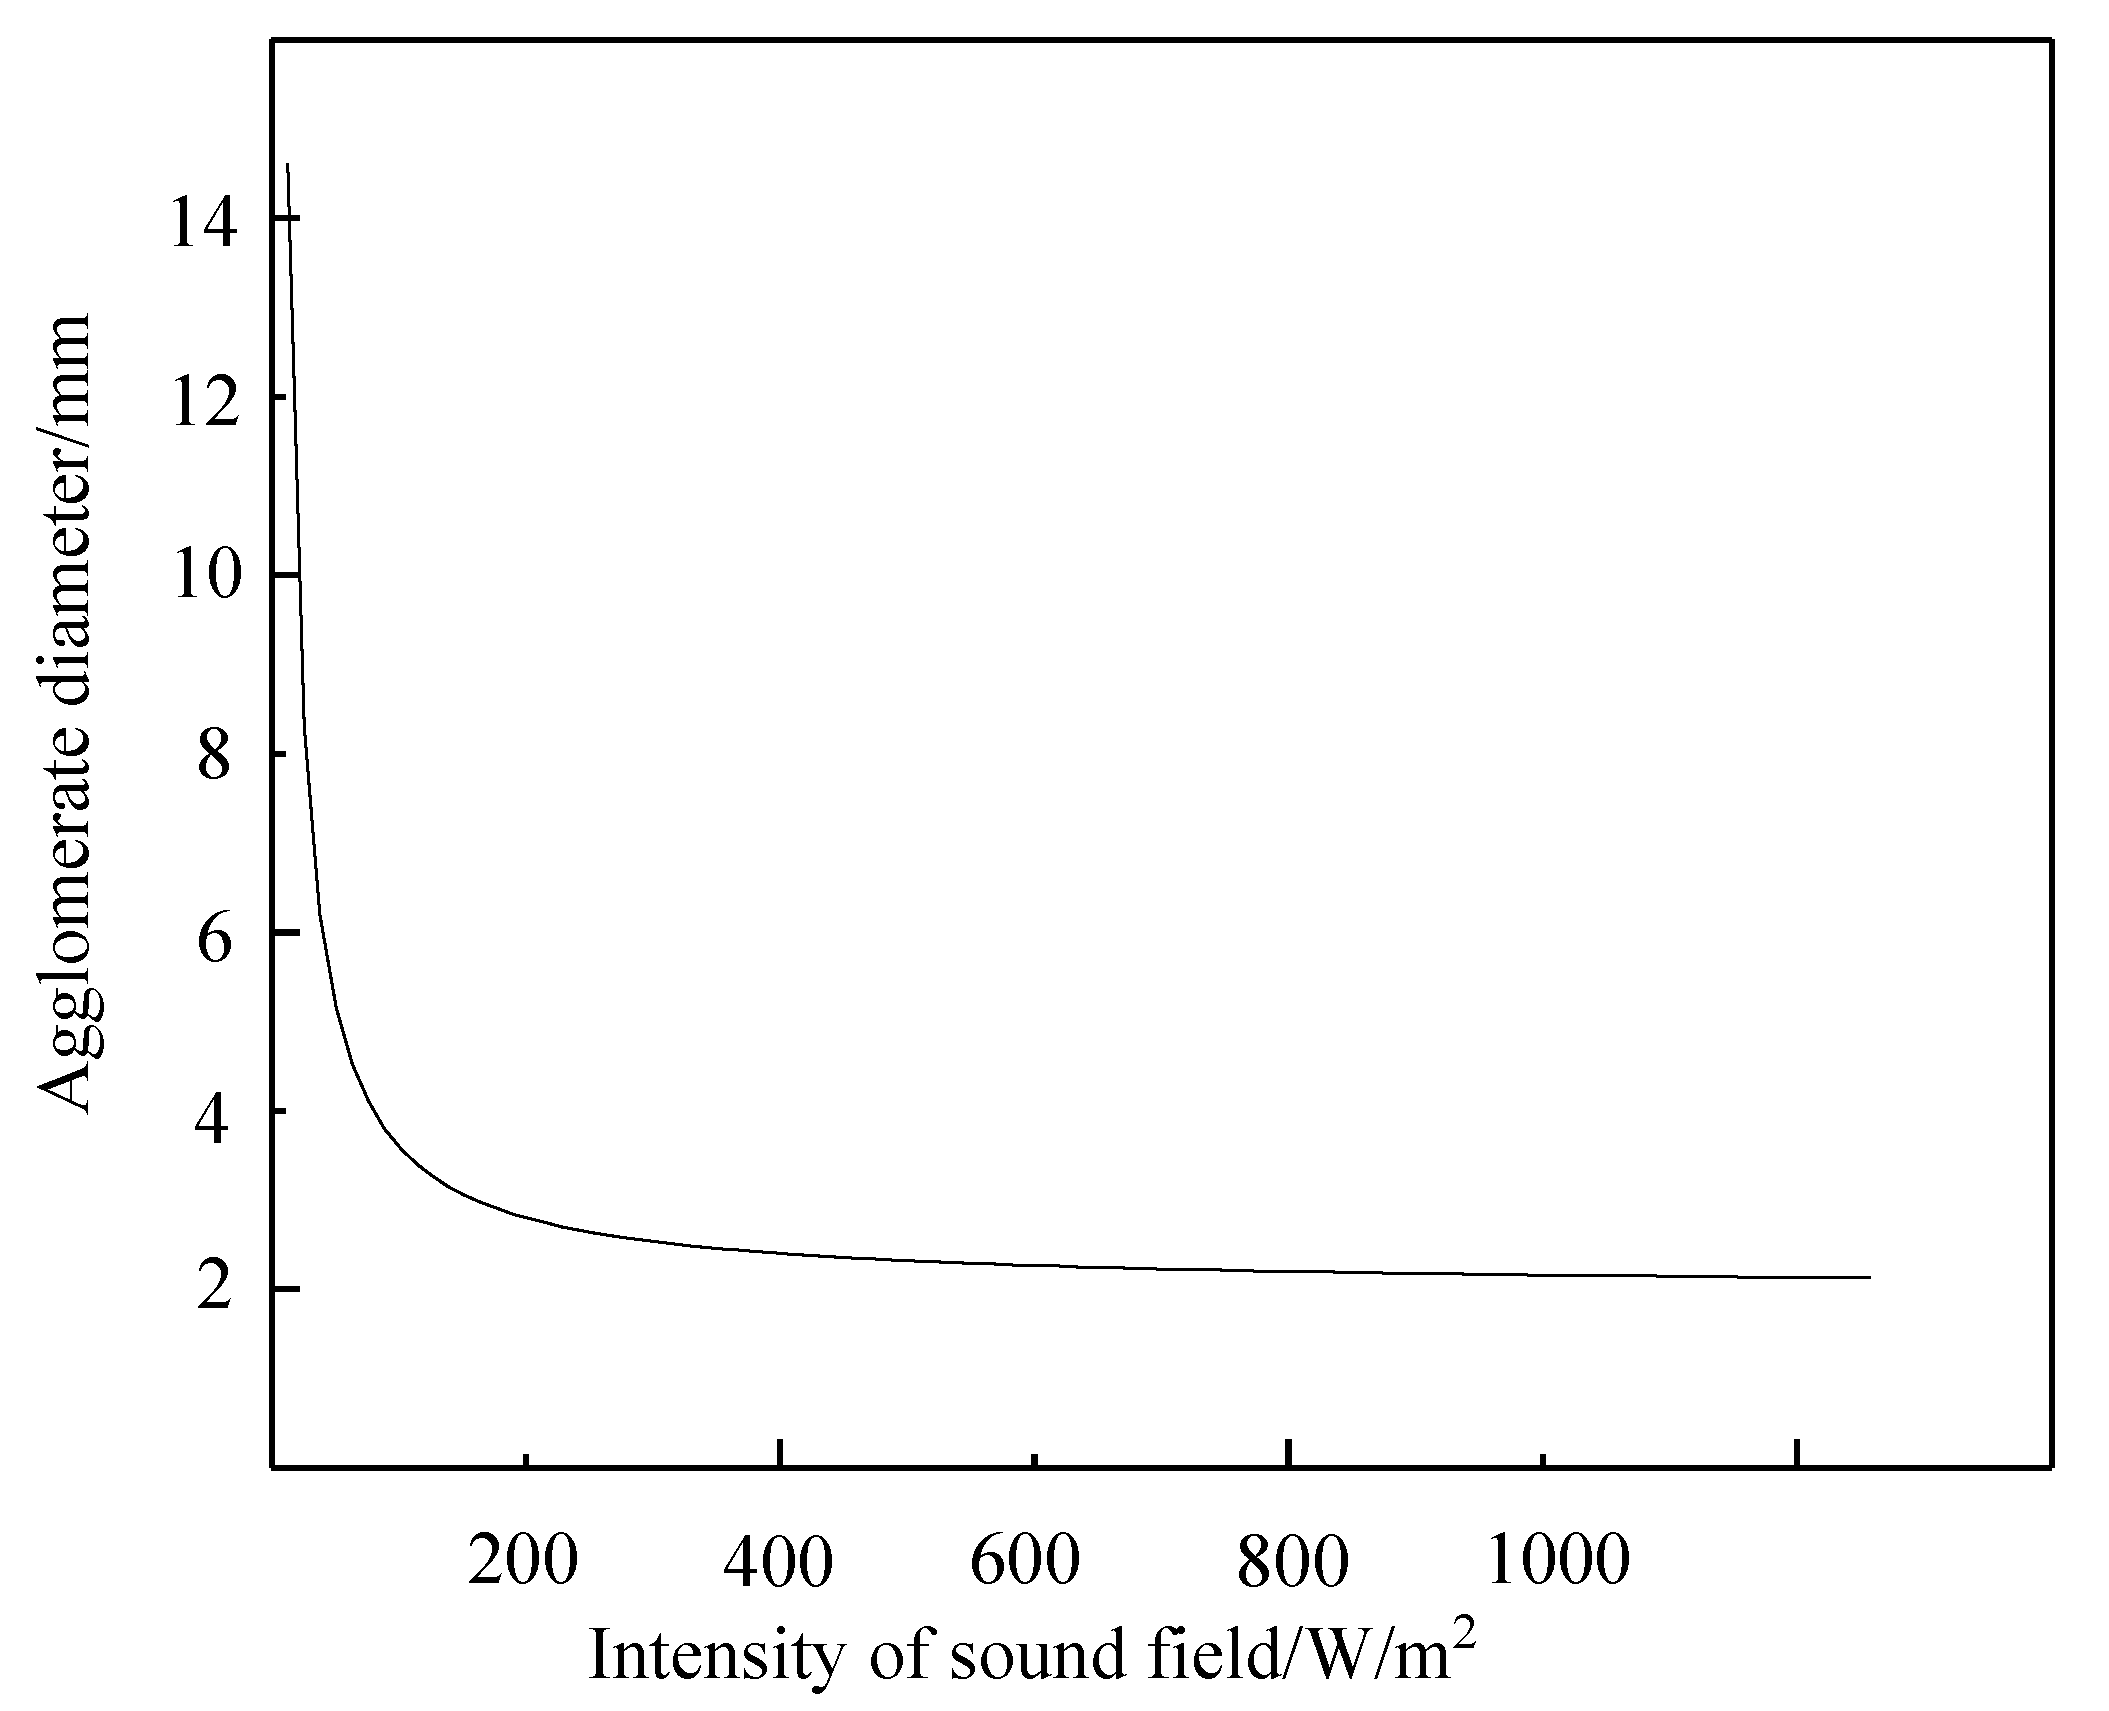
4.3. Breaking of the Cluster due to the Application of the Sound Field

Clusters are the main cause of bond flow loss. Clusters usually move as a whole under the action of acoustic waves [31]. Experiments show that at a certain apparent gas velocity, the viscous particles are fluidized in the form of clusters, and the clusters are broken after the introduction of acoustic fields. Therefore, cluster fragmentation can be used to illustrate fluidization characteristics, as shown in Figure 18. When the sound field is added, the particles will vibrate under the action of acoustic force, and the particles will collide with the air distribution plate, forming a high void area on the surface area of the air distribution plate. This helps the gas enter the bed and makes it easier for the air flow to blow up the bed. Deformation or even separation of the particles and aggregates will occur when the agglomerates collide or rub with the wall surface. Therefore, in this case, the bed can be regarded as an elastomer [32]. It is observed from Figure 18a that in the absence of a sound field, the particles are large and large agglomerates are formed while, as shown in Figure 18b, after the application of the sound field, the number of small particles clearly increases. This is because upon the application of the ultrasonic field, particles are acted on by an external force, breaking up the agglomerates into small particle clusters.
Whether or not a cluster is broken depends on the balance of forces acting on the cluster. For energy balance analysis, the following assumptions are made: (1) The agglomerates are spherical with a diameter da1, and (2) two clusters of the same size are formed after the cluster is broken.
In a viscous particle fluidized bed, the forces acting on the clusters are due to the laminar shear energy (Elam), the kinetic energy of the clusters (Ekin), and the acoustic field energy (Esou). All of these can break the cluster. When the sum of these three energies is equal to the cohesive energy of the cluster (Ecoh), the cluster is in equilibrium.
(1) Energy generated by laminar shear. In a low-speed fluidized bed, the agglomeration movement in the fluid is subjected to the shear action of the fluid on the agglomeration, and its energy expression [32] is
E lam = 3 π uu mf , a d a 1 2
where μ is the gas velocity and umf,a is the minimum fluidization velocity of the cluster.
(2) Kinetic energy of the cluster. Clusters have kinetic energy when moving in the fluid, and the expression is as follows:
E kin = π 6 d a 1 3 ρ a 1 u 2 2
where, da1 is the aggregate diameter and ρa1 is the cluster density.
(3) Energy of the sound field. The propagation mode of the sound wave is simple harmonic, and the sound energy transfer in the sound field is carried out by momentum exchange. The medium of propagation is air. The acoustic field energy acting on the cluster [33] is
E sou = 1 8 π d a 1 2 ρ f ω 2 A 2 c
where ω is the angular velocity; A is the amplitude; c is the speed of sound; and ρf is the fluid density.
(4) Energy required to break the cluster. When the particle cluster is broken from the middle, the cluster needs to overcome the work done on it by the viscous force. According to literature [34], it can be seen that
E coh = π 96 d a 1 2 1.61 ε a 1.48 1 ε a ε a A H d p 1 Z 0
where ε a is the bed void fraction; AH is the Hamaker constant; Z0 is the initial spacing of two aggregates when they are just broken; and dp is the mean diameter of the particles.
When the energy is in balance, the following is true:
E lam + E kin + E sou = E coh
Substituting Equations (27)–(30) into Equation (31) obtains the following relationship:
d a 1 = 1 96 1.61 ε a 1.48 1 ε a ε a A H d p 1 z 0 ρ f ω 2 A 2 c / 8 3 uu mf , a ρ a 1 u 2 / 12
According to the formula (32), we draw the relationship between the sound field intensity and the agglomeration diameter, as shown in Figure 19.
The fluidization of iron ore powder is consistent with Equation (26).
In a fluidized bed, the clusters reach dynamic equilibrium. It is observed from Equation (32) that in addition to the effect of the fluidized bed itself on particle agglomerations, the effect of the sound field on agglomerations is also obvious. When the sound field frequency is fixed, with the increase of the sound field power, the intensity of the sound field per unit area of agglomerated iron ore powder increases, the agglomerate diameter decreases, and the iron ore powder fluidizes, which is consistent with Equation (26). As can be seen from the Figure 19, as the diameter of the particle clusters decreases, the number of air molecules impacting on the surface of the clusters decreases, and the acoustic field energy obtained from the clusters decreases and is lower than the acoustic energy required to break up the particles. At a certain frequency, different SPL values correspond to different maximum cluster diameters. A larger SPL corresponds to smaller cluster diameters and promotes bed fluidization. Conversely, a smaller SPL leads to a larger agglomerate diameter and hinders bed fluidization. It can be seen that the application of a sound field in the reduction process of iron ore powder can effectively reduce the bond loss and improve the fluidization quality.

5. Conclusions

  • The addition of an acoustic field in the iron ore powder reduction process can significantly reduce the bond ratio and improve the fluidization quality;
  • The bond ratio decreases with increasing sound field power. When the sound field power is large, the bond ratio’s decrease becomes smaller;
  • A higher sound pressure corresponds to a lower critical fluidization velocity and better fluidization quality. An optimal range of frequencies is identified, with the lowest critical fluidization velocity and highest fluidization quality of the iron ore powder particles obtained in the frequency range of 100–150 Hz. When the frequency is below 100 Hz or above 150 Hz, the critical fluidization velocity increases and the effect of the sound wave is weakened;
  • The energy provided by the sound field can break the large agglomerates into small clusters, which is conducive to the fluidization of fine iron ore particles.

Author Contributions

Conceptualization, Q.X. (Qiyan Xu); methodology, Q.X. (Qiyan Xu); software, Z.G., Z.W.; validation, Q.X. (Qiyan Xu), B.W. and Q.X. (Qian Xie); formal analysis, Z.G.; investigation, Q.X. (Qian Xie); resources, Q.X. (Qiyan Xu); data curation, Z.G.; writing—original draft preparation, Z.W.; writing—review and editing, Z.G.; visualization, B.W.; supervision, Z.G.; project administration, Q.X. (Qiyan Xu); funding acquisition, Q.X. (Qiyan Xu). All authors have read and agreed to the published version of the manuscript.

Funding

This work was supported by NSFC-Xinjiang Joint Fund: U2003124, the National Natural Science Foundation of China: Nos. 51974001 and 51704003 and the University outstanding young talents funding program: No. gxyq2019016.

Institutional Review Board Statement

Not applicable.

Informed Consent Statement

Informed consent was obtained from all subjects involved in the study.

Data Availability Statement

Not applicable.

Acknowledgments

This work was supported by the National Natural Science Foundation of China (No. U2003124, No. 51974001, and No. 51704003) and the university’s outstanding young talents funding program (No. gxyq2019016).

Conflicts of Interest

The authors declare no conflict of interest.

References

  1. Xu, Q.Y.; Gu, Z.H.; Li, Z.P.; Zhang, Y.Y.; Wang, H.C. Effects of pressure and plastic addition on sticking of fine iron ore particles in fluidized bed reduction. J. Iron Steel Res. Int. 2020, 28, 140–151. [Google Scholar] [CrossRef]
  2. Xu, Q.; Li, Z.; Gu, Z. Experimental Investigation of the Fluidization Reduction Characteristics of Iron Particles Coated with Carbon Powder under Pressurized Conditions. Molecules 2020, 25, 1810. [Google Scholar] [CrossRef] [PubMed] [Green Version]
  3. Xu, Q.; Liu, Z.; Li, Z.; Wang, J.; Zhou, L. The Effect of Carbon Dissection of Waste Plastics on Inhibiting the Adhesion of Fine Iron Ore Particles during Hydrogen Reduction. Metals 2018, 8, 523. [Google Scholar] [CrossRef] [Green Version]
  4. Xu, Q.; Li, Z.; Gu, Z.; Yin, Z. Optimization of fluidized reduction conditions for Brazilian iron ore powder. Iron Steel Vanadium Titanium 2020, 41, 99–104. [Google Scholar]
  5. Xu, Q.; Ma, H.; Wang, H.; Fu, Y.; Wang, J. Optimization Study on inhibition of particle adhesion by fluidized reduced iron ore powder. Anhui Univ. Technol. (Nat. Sci. Ed.) 2017, 34, 111–114. (In Chinese) [Google Scholar]
  6. Zhang, B.; Gong, X.Z.; Wang, Z.; Guo, Z.C. Relation between Sticking and Metallic Iron Precipitation on the Surface of Fe2O3 Particles Reduced by CO in the Fluidized Bed. ISIJ Int. 2011, 51, 1403–1409. [Google Scholar] [CrossRef] [Green Version]
  7. Yang, M.; Xiao, W.D.; Zhang, P. Processing mineralogy study on lead and zinc oxide ore in Sichuan. Metals 2016, 6, 93. [Google Scholar] [CrossRef] [Green Version]
  8. Xue, Q.; Ma, Y.J.; Lei, J.F.; Yang, R.; Wang, C. Evolution of microstructure and phase composition of Ti-3Al-5Mo-4.5V alloy with varied β phase stability. J. Mater. Sci. Technol. 2018. [Google Scholar] [CrossRef]
  9. Xu, Q.Y.; Li, Z.P.; Liu, Z.Z.; Wang, J.J. The Effect of Pressurized Decarbonization of CO on Inhibiting the Adhesion of Fine Iron Ore Particles. Metals 2018, 8, 525. [Google Scholar] [CrossRef] [Green Version]
  10. Piotrowski, K.; Mondal, K.; Lorethova, H.; Stonawski, L.; Szymański, T.; Wiltowski, T. Effect of gas composition on the kinetics of iron oxide reduction in a hydrogen production process. Int. J. Hydrogen Energy 2005, 30, 1543–1554. [Google Scholar] [CrossRef]
  11. Suzuki, K.; Fujigami, A.; Yamazaki, R.; Jimbo, G. Characteristics of vibro-fluidized bed for drying of wetted and agglomerated particles. J. Chem. Eng. Jpn. 1980, 13, 495–498. [Google Scholar] [CrossRef]
  12. Beeckmans, J.M.; Chu, J.C.H. Solids mixing kinetics and segregation in a vibrostabilized fluid bed. Can. J. Chem. Eng. 1987, 65, 536–540. [Google Scholar] [CrossRef]
  13. Erdesz, K.; Mujumdar, A.S. Hydrodynamic aspects of conventional and vibrofluidized beds-a comparative evaluation. Powder Technol. 1986, 46, 167–172. [Google Scholar] [CrossRef]
  14. Tang, H.; Zhao, J. study on agglomeration behavior of fine powder in vibrated fluidized bed. Chem. Ind. Eng. 1996, 13, 6–10. [Google Scholar]
  15. Mori, S.; Yamamoto, A.; Haruta, T.; Yamada, T.; Mizutani, E. Vibro-Fluidization of very fine particles. In Fluidization ’88-Scince and Technology, CJF-3 Symposium; Kwauk, M., Kunii, D., Eds.; Academic Press: Beijing, China, 1988; pp. 75–81. [Google Scholar]
  16. Levy, E.K.; Shnitzer, I.; Masaki, T.; Salmento, J. Effect of an Acoustic Field on Bubbling in a Gas Fluidized Bed. Powder Technol. 1997, 90, 53–57. [Google Scholar] [CrossRef]
  17. Chirone, R.; Massimilla, L.; Russo, S. Bubble-free Fluidization of a Cohesive Powder in an Acoustic Field. Chem. Eng. Sci. 1993, 48, 41–52. [Google Scholar] [CrossRef]
  18. Herrera, C.A.; Levy, E.K.; Ochs, J. Characteristics of Acoustic Standing Waves in Fluidized Beds. AIChE J. 2002, 48, 503–513. [Google Scholar] [CrossRef]
  19. Guo, Q.J.; Yang, X.P.; Shen, W.Z.; Liu, H. Agglomerate Size in an Acoustic Fluidized Bed with Sound Assistance. Chem. Eng. Process. 2007, 46, 307–313. [Google Scholar] [CrossRef]
  20. Xu, X. Acoustics Basis; Science Press: Beijing, China, 2003; pp. 236–242. [Google Scholar]
  21. Roy, R.; Davison, J.F.; Tuponogov, V.G. The Velocity of Sound in Fluidized Beds. Chem. Eng. Sci. 1990, 45, 3233–3245. [Google Scholar] [CrossRef]
  22. Dahneke, B. The Influence of Flattening on the Adhesion of Particles. J. Colloid Interface Sci. 1972, 40, 1–13. [Google Scholar] [CrossRef]
  23. Overbeek, J.T. Colloid Science; Elsevier: Amsterdam, The Netherlands, 1952; Volume 1, p. 245. [Google Scholar]
  24. Van Der Waals, J.D. The Effects of Corporate Environmental Practices on Financial Performance of Global Companies. Ph.D. Thesis, Leiden University, Leiden, The Netherlands, 1873. [Google Scholar]
  25. Visser, J. Lockedness profile for non-homogeneous liberation of symmetrical particles. Powder Technol. 1989, 58, 11–15. [Google Scholar]
  26. Harper, W.R. The generation of static charge. Adv. Phys. 1957, 6, 365–417. [Google Scholar] [CrossRef]
  27. Montgomery, D.J. Static electrification of solids. Solid State Phys. 1959, 9, 139–197. [Google Scholar]
  28. Visser, J. Surface and Colloid Science; Matijevic, E., Ed.; Wiley: New York, NY, USA, 1976; Volume 8. [Google Scholar]
  29. Ma, D. The Theoretical Basis of Modern Acoustics; Science Press: Beijing, China, 2004; Volume 3. [Google Scholar]
  30. Munjiza, A.; Andrews, K.R.F. NBS Contact Detection Algorithm for Bodies of Similar Size. Int. J. Numer. Methods Eng. 1998, 43, 131–149. [Google Scholar] [CrossRef]
  31. Rietema, K. Powders, What Are They? Powder Technol. 1984, 37, 5–23. [Google Scholar] [CrossRef]
  32. Morooka, S.; Kusakabe, K.; Kobata, A.; Kato, Y. Fluidization state of ultrafine powders. J. Chem. Eng. Jpn. 1988, 21, 41–46. [Google Scholar] [CrossRef] [Green Version]
  33. Wu, Y. University Physics; Tongji University Press: Shanghai, China, 2002. [Google Scholar]
  34. Xu, C.; Zhu, J. Experimental and theoretical study on the agglomeration arising from fluidization of co-hesive particles-effects of mechanical vibration. Chem. Eng. Sci. 2005, 60, 6529–6541. [Google Scholar] [CrossRef]
Figure 1. SEM image of the Newman ore before reduction.
Processes 09 00725 g001
Figure 2. Experimental equipment.
Processes 09 00725 g002
Figure 3. Experimental setup. (a) Fluidized bed. (b) Reactor. Reproduced with permission from Qiyan Xu, Molecules; published by MDPI, 2020. 1. Gas mixing and preheating chamber. 2. Gas mixing hole. 3. Fluidized bed. 4. K-type thermal couple. 5. Pressure sensor. 6. Gravity filter. 7. Feeding and sampling port. 8. Pressure seal cap. 9. Temperature change recorder. 10. Gas analyzer. 11. H2 gas analysis recorder. 12. CO2gas analysis recorder. 13. CO gas analysis recorder. 14. Pressure change analysis recorder. 15. Computer. 16. Gas dryer. 17. Gasholder. 18. Pressure display. 19. CO2/COgas cylinders. 20. H2 gas cylinders. 21. N2 gas cylinders. 22. Booster pump. 23. heating furnace. 24. Gas valve.
Processes 09 00725 g003
Figure 4. Changes of the metallization rate over time under different applied power.
Processes 09 00725 g004
Figure 5. Changes of the bond ratio over time under different applied power.
Processes 09 00725 g005
Figure 6. Changes of the ultrasonic field bond ratio over time with different applied power.
Processes 09 00725 g006
Figure 7. Influence of the frequency on the minimum fluidization velocity.
Processes 09 00725 g007
Figure 8. Radial distribution of the particle concentration at different acoustic frequencies.
Processes 09 00725 g008
Figure 9. Pressure drop velocity curve of the bed in the silent field.
Processes 09 00725 g009
Figure 10. Bed expansion velocity curve in the silent field.
Processes 09 00725 g010
Figure 11. Bed pressure drop–velocity curve under different sound pressures.
Processes 09 00725 g011
Figure 12. Relationship curve between the viscous force and the distance between particles.
Processes 09 00725 g012
Figure 13. Surface roughness limits particle proximity.
Processes 09 00725 g013
Figure 14. Surface structure enhances tight contact.
Processes 09 00725 g014
Figure 15. Curve of the relation between the sound velocity and sound pressure.
Processes 09 00725 g015
Figure 16. Particle velocity decomposition of a plane acoustic wave.
Processes 09 00725 g016
Figure 17. The functional relationship between the power and bond ratio.
Processes 09 00725 g017
Figure 18. SEM comparison diagram without adding an ultrasonic field (a) and adding a sound field (b).
Processes 09 00725 g018
Figure 19. The relation between the intensity of the sound field and the diameter of the agglomeration.
Processes 09 00725 g019
Table 1. Chemical composition of the Australian Newman mineral powder (mass %).
Composition TFe SiO2 CaO MgO Al2O3 S P
Content (%) 62.5 4.37 0.07 0.10 2.08 0.099 0.088
Table 2. Metallization rate table for different time and power values.
Time10 min20 min40 min60 min
Power
150 w60.5858.6160.0358.71
300 w58.8259.2562.3860.08
500 w62.5163.7463.0159.73
1000 w59.5461.3260.0662.34
Table 3. Bonding ratios of different times and powers.
Time10 min20 min40 min60 min
Power
150 w28.1424.3223.8124.11
300 w23.5417.8519.9219.71
500 w20.8216.6117.3117.29
1000 w19.7615.8916.8816.93
Table 4. The relation table of minimum fluidization speed and frequency.
Frequency50100150200300400500
Fluidization Velocity0.0610.0570.0510.0530.0570.0620.065
Publisher’s Note: MDPI stays neutral with regard to jurisdictional claims in published maps and institutional affiliations.

