Article

Effects of Swirl and Boiling Heat Transfer on the Performance Enhancement and Emission Reduction for a Medium Diesel Engine Fueled with Biodiesel

1
School of Mechanical and Transportation, Guangxi University of Science and Technology, Liuzhou 545006, China
2
Institute of the New Energy and Energy-Saving & Emission-Reduction, Guangxi University of Science and Technology, Liuzhou 545006, China
3
Department of Numerical Control Technology, Guangxi Mechanical and Electrical Technician College, Liuzhou 545005, China
*
Author to whom correspondence should be addressed.
Processes 2021, 9(3), 568; https://doi.org/10.3390/pr9030568
Submission received: 9 February 2021 / Revised: 13 March 2021 / Accepted: 16 March 2021 / Published: 23 March 2021
(This article belongs to the Special Issue Optimization Technology of Greenhouse Gas Emission Reduction)

Abstract

:
In order to improve the accuracy of numerical simulation, a new heat transfer model is developed by using a modular approach in the Anstalt für Verbrennungskraftmaschinen (AVL)-Boost software. The improved heat transfer model mainly considers the effects of the swirl and boiling heat transfer inside the engine. In addition, a chemical kinetics mechanism including 475 reactions and 134 species is employed to predict the combustion of diesel engines fueled with biodiesel. The result shows that the boiling heat transfer will occur, especially in the high-temperature area. Analysis shows that the improved model is reliable and its precision is increased. Finally, the perturbation method is employed to investigate the relatively important inputs as the complex nonlinear function with a lot of output data and input data produced by the improved model. The relative effects of different parameters such as EGR, injection mass, injection timing, compression ratio, inlet air pressure, fuel injection pressure, exhaust pressure and inlet air temperature on performance and emission characteristics are compared. The eight parameters are investigated on four outputs of brake power, Brake Specific Fuel Consumption (BSFC), NOx and HC. The injected fuel mass plays an important role in emissions and performance. The EGR, compression ratio and inlet air pressure have a great effect on the HC and NOx emission.

1. Introduction

Due to the high economy and reliability of diesel engines, they are used as the main power source and widely used in the ship, construction machinery and heavy-duty trucks [1,2]. With the increase in diesel engines, the particulate matter (PM) and NOx emissions from diesel engines have posed a threat to our health and ecosystem [3]. The international community is paying more and more attention to it. At the same time, the demand for engine performance and emissions is stronger and stronger. Thus, it requires us to investigate the knowledge of in-cylinder phenomena including chemical kinetics that determine the formation of different emissions, spatially-varying and temporally in-cylinder charge conditions, EGR, heat release rates, selective catalyst reduction and so on [4]. However, the new technology makes it more complex to adjust all input parameters [5]. It is necessary to further optimize the performance and emission characteristics of diesel engines with the new technologies [6,7].
The diesel engine can convert chemical energy into thermal energy, mechanical energy or other energy to meet their respective demands. Many scholars and engine manufactures have found that biodiesel fuel is an environment-friendly fuel [8]. However, there are significant differences in physicochemical properties, atomization and combustion characteristics between biodiesel and diesel [7]. It needs thorough theory and experimental study when biodiesel has been widely applied and realized highly effective and pure burning in the engine [9]. In addition, improvements in diesel energy efficiency and emission can be obtained in some areas of design and operation [10]. Meanwhile, many scholars and engine manufactures have developed many methods to reduce the emission and improve engine efficiency [11]. For instance, the exhaust valve is controlled by computer-controlled high-pressure hydraulic systems [12]. In addition, the waste heat recovery system [13], EGR and selective catalytic reduction technologies are employed for the diesel engine [14]. Nevertheless, many possible configurations for diesel engines require a shorter engine start-up time [15]. Thus, a numerical prediction model should be employed to predict the performance of diesel engines and the optimal configuration of the engine was obtained [16]. However, it is generally believed that the ideal model cannot fully and accurately reflect the characteristics of the current internal combustion engine due to its inherent limitations. For instance, the ideal model ignores the influence of many secondary considerations [17,18].
The engine prototyping and experiment in manufacturing industries in the design processes will cost a lot of money and time [19]. Thus, many scholars have carried out research on numerical simulation [20]. The cooling water system has an effect on heat transfer efficiency and combustion efficiency [21]. Previous research has focused on the development of the heat transfer model. In general, the boiling phenomena may occur in the hot spots of diesel engines due to the increasing temperature. If the boiling heat transfer in the hot spots of the diesel engine is not considered, about 33% of fuel energy is converted to heat loss from the cylinder body for large-scale diesel engines [22]. Reference [23] about 50% of fuel energy is transformed into heat loss for small-scale diesel engines. Thus, it is necessary to consider the boiling heat transfer due to the heat transfer characteristics of diesel engines. For instance, a validated single-phase boiling model had been developed by Gils et al. and was employed to investigate the boiling heat transfer of diesel engines [24]. They found that the calculation accuracy was improved when the model considered the boiling heat transfer of diesel engines. In addition, the two-phase boiling model of heat transfer coefficient had been developed by Mohummadi et al. and they found that the heat transfer coefficient obtained by the single-phase boiling model was close to the results obtained by the mixed two-phase flow analysis [25]. To better evaluate the heat transfer state of engine parts, the boiling heat transfer in the cylinder should be considered.
In order to solve this problem, the numerical method is considered an effective way to evaluate the practicability of biodiesel and it is widely used as a tool for the improvement and alternatives in the process of engine design with the limited resources [26]. However, the computational time and accuracy of the numerical model are important problems [27]. Only to ensure the error accuracy in an acceptable range can better evaluate the heat transfer state of engine parts such as cylinder liner and piston and meet the engine design and development process [28]. The swirl and boiling heat transfer in diesel engines should be considered [29]. In the hot spots of the engine, the swirl and heat transfer of nucleate boiling often occur especially in high load operation [30]. In general, the boiling heat transfer can be divided into two parts: saturated boiling and sub-cooled [31]. The film boiling on the surface tubes will result in a significant change in heat transfer and the heat flux from surface to cooling water will be reduced suddenly [32]. Thus, the surface temperature will increase rapidly and damage the engine if the temperature is too high [33]. Similarly, the swirl will occur in the combustion chamber. The zero-dimensional model can be widely employed to evaluate both the transient response and steady-state performance evaluation, in cases where the requirements for predicting results are limited. If both the issues are factored in, the given model is accurate [34].
As previously described, it needs thorough theory and experimental study when biodiesel is widely applied and realized highly effective and pure burning in the engine, because there are differences between the biodiesel and diesel in the physics and chemistry characteristic, as well as the atomization characteristic and the combustion characteristic. In the paper, an improved heat transfer model is proposed based on the basic theory and numerical method of swirl and boiling heat transfer. In order to evaluate the practicability of biodiesel, the model combined with Chemkin code is employed to simulate the cylinder combustion process of diesel engines. The experiment is carried out with a medium-speed diesel engine and the improved model is validated under the different engine conditions. Moreover, the effects of the swirl and boiling heat transfer on the combustion and emission characteristics of diesel engines fueled with biodiesel are investigated and compared. Ultimately, the relative influences of input parameters on combustion and emission characteristics are investigated based on the perturbation theory.

2. Methods and Model Validation

To simplify the simulation process, the inlet and exhaust are considered as the ideal gas. The main mathematical models are as follows.

2.1. Mathematic Modeling

The entire diesel engine layout featuring including four cylinders a detailed description of the flow path is shown in Figure 1. The air is cooled by the air cooler and enters the engine cylinder through the air intake passage. The exhaust gases are discharged and flow into the turbine inlet in the exhaust stroke. The turbine drives the turbo-compressor which delivers the compressed air to the cooler.
(1) Energy Balance
The mass and energy balance problem caused by fuel injection and blow-by is solved between the inlet valve close and the exhaust valve open. According to the First Law of Thermodynamics, the system can be regarded [35], and the expression of the open system can be expressed as:
d U c = p c d V d Q + h f , i n j d m f h B B d m B B
where pcdV is the expansion work, J; Q is the heat transfer to the piston, cylinder liner and cylinder head, J; mf is the injected fuel mass, kg; hf,inj is the specific enthalpy of fuel, J/kg; mBB is the air blow-by mass, kg; hBB is the specific enthalpy of air blow-by, J/kg; Uc is the variation of internal energy, J.
(2) Mass Balance
The leakage of gas mass results from the addition of residual gas mass and minus the short-circuit mass, fresh air mass, the exhaust gas recirculation mass during valve overlap. The fresh air mass and exhaust gas recirculation mass are obtained from experimental measurement. The residual gas mass and the short-circuit mass can be calculated by an emptying and simple filling model [10]. Thus, the mass fraction at EVO can be calculated as: When the exhaust valve opens, the mass fraction can be calculated as:
Y b , E V O = m f + m f F s + ( m E G R + m r e s ) Y b , E V O m s c Y b , I V C m B B ( Y b , I V C + Y b , E V O 2 ) m a + m f + m E G R + m r e s m s c m B B = 1 + 1 F s Y b , I V C ( m s c + m B B / 2 m f ) 1 + 1 F m s c + m B B / 2 m f
where Yb,EVO is the mass fraction at exhaust valve open, %; Fs is the stoichiometric fuel–air equivalence ratio; mres is the residual gas for the previous cycle, kg; ma is the fresh air, kg; msc is the short-circuit mass, kg; mEGR is the exhaust gas recirculation mass, kg; mres is the residual gas for the previous cycle, kg.
Similarly, the mean value of compositions is calculated for the blow-by the leakage of gas mass [11]. The composition at inlet valve close can be expressed as:
Y b , I V C = ( m r e s + m E G R ) Y b , E V O m s c Y b , I V C m a + m r e s + m E G R m s c = Y b , E V O 1 + m a m E G R + m r e s
Thus, the mass fraction [11] at exhaust valve open is expressed as:
Y b , E V O = 1 + 1 F s 1 + 1 F ( m s c + m B B / 2 m f ) 1 1 + m E G R + m r e s m a
(3) Blow-by Model
The scavenging mass flow rate is calculated according to the following equation, which was derived assuming subsonic flow consideration through the valves [36] during the valve overlapping period:
m ˙ B B = C d A r e f p R T 2 γ γ 1 [ ( p c r k p ) 2 γ ( p c r k p ) γ + 1 γ ]
where Cd is the discharge coefficient; Aref is the reference section, m2; pcrk is the crankcase pressure, Pa; γ is the adiabatic index.
To ensure the simulation result in accord with the actual cumulative blow-by, Cd is should be adjusted with experimental results [10]. In addition, the flow area of equivalent cylinders is calculated by the following equation [36]:
A r e f = z c y l Δ φ 0 Δ φ A I V C ( φ ) A E V O ( φ ) A I V C ( φ ) 2 + A E V O ( φ ) 2 d φ
where Zcyl is the number of engine cylinders; φ is the crank angle, °.
(4) AVL MCC Combustion Model
The quasi-dimensional MCC AVL combustion model in the AVL-BOOST environment, which considers the effects of the working fluid pre-mixing and diffusion combustion, is employed to predict the combustion in the cylinder [37]. The expression is expressed as:
d Q F d φ = d Q MCC d φ + d Q PMC d φ
where QF is the heat release rate, J; QMCC is the heat release rate in the diffusion combustion process, J; QPMC is the heat release rate in the pre-mixed combustion process, J.
The expression of heat release rate [38] in the diffusion combustion process is expressed as:
d Q MCC d φ = C comb ( m F Q MCC H u ) ( w air ) C E G R C Rate k V 3
where mF is the fuel evaporative mass, kg; Hu is the low calorific value, J/kg; wair is the effective air mass fraction,%; k is the turbulent energy density, kg/(m·s2); Ccomb is the combustion constant; CEGR is the combustion constant; CRate is the constant of mixing ratio.
The expression of heat release rate [39] in the pre-mixed combustion process is expressed as:
1 Q PMC d Q PMC d φ = 6.908 Δ φ C ( m + 1 ) ( φ φ B Δ φ C ) m exp [ 6.908 ( φ φ B Δ φ C ) ( m + 1 ) ]
where φB is the start of combustion angle, °; ΔφC is the difference of crank angle, °; m is the shape parameter.
(5) Heat Transfer Model
The heat transfer in the cylinder of the diesel engine is a very complicated process. The convection heat transfer is obtained from the Woschni 1978 heat transfer model [18]. The Woschni 1978 heat transfer model was published in 1978. It can be expressed as:
α w = a T c - 0 . 53 p c 0 . 8 D 0.2 [ C 1 C m + C 2 V T I V C p I V C V I V C ( p c p c , o ) ] 0.8
where αw is the heat transfer rate, W/(m·K); Tc is the engine cylinder temperature, K; Cm is the mean piston velocity, m2; pc is the cylinder pressure, Pa; D is the cylinder diameter, m; TIVC is the cylinder temperature when the inlet valve closes, K; V is the engine cylinder volume, m3; pc,o is the inverted cylinder pressure, Pa; pIVC is the cylinder pressure when the inlet valve closes, Pa; a is a curve fitted constant; C1 is the gas velocity coefficient; C2 is the model constant.
In general, five typical states are defined by the existing heat transfer characteristics and conditions: convection, developed nucleate boiling, fully developed nucleate boiling, transition boiling and film boiling. It can be found that the saturation temperature of the water is not constant and changes with pressure in the engine. The difference between the wall temperature and the water saturation temperature ΔT is the wall superheat. When ΔT < 4 K, the superheated water vaporizes when it reaches the free surface. With the increase in wall superheat, a large number of bubbles produced near the wall regime will escape from the wall into the surrounding liquid. Because the mainstream liquid is still in the supercooled state, it will condense and disappear. In the nucleate boiling state, the bubbles are continuously produced and destroyed, resulting in severe disturbances. The heat transfer efficiency is improved and the heat flux increases dramatically. When the superheat reaches ΔTD, the maximum value of heat flux is called critical heat flux. When ΔTD < ΔT, the heat flux decreased dramatically. Thus, it is very important that the boiling heat transfer is controlled within the nucleate boiling state. In the present paper, the heat transfer model considers the influence of the swirl and the boiling heat transfer of the engine. The boiling of cooling water inside the engine is subcooled flow boiling [11]. The total heat on the wall surface includes the phase transformation latent heat and the increase in the cooling water temperature [26]. The total heat transfer qtotal consists of boiling heat transfer and convective heat transfer. The qtotal is expressed as:
q t o t a l = q c + q B
where qB is the sub-cooling boiling heat transfer heat flux, W/m2; qc is the convective heat flux, W/m2.
The single-phase convective heat flux qc should be expressed as:
q c = α c ( T w T f )
where αc is the single-phase convective heat transfer coefficient.
The improved heat transfer model was proposed based on the Woschni1978 heat transfer model. It considers the swirl and boiling heat transfer in the cylinder. These improvements are performed by means of AVL-Boost software, as it is described in the references [11]. The heat transfer coefficient should be expressed as:
α c = b T c - 0 . 53 p c 0 . 8 D 0.2 [ C w 1 C m + C u C w 2 + C 2 u V T I V C p I V C V I V C ( p c p c , o ) ] 0.8
where b = 0.12 and C2u = 0.001, Cu is the instantaneous tangential gas velocity in the cylinder, Cw1 and Cw2 are fitted constants whose values are obtained from motoring tests on a specific diesel engine.
In Incropera’s opinion [40], the boiling heat transfer coefficient can be calculated by the experimental correlations and the boiling heat transfer heat flux is summarized as follows:
q B = μ L r g ( ρ L - ρ g ) δ ( c pL Δ t c wL r Pr L 1 . 7 ) 3
where δ is the surface tension of the gas–liquid interface, 10−3 N/m; Δt is the wall superheat degree, K; r is the liquid vaporization latent heat, J/kg; PrL is the Prandtl number; cpL is the specific heat capacity of saturated liquid, J/(kg·K); cwL is the combinative empirical coefficient of the liquid and heating surface.
(6) Emission Models
NO is mainly produced in the combustion process of diesel engines. The formation mainly includes the following three ways. (1) NO is generated in the high-temperature region; (2) NO is generated immediately when the fuel is ignited in the cylinder; (3) NO is produced by the nitrogen contained in the fuel. Thus, the extended Zeldovich model is employed to predict the NOx emission [41]. Similarly, the self-contained CO mechanism of the Zeldovich model is employed to predict the CO emission [41]. In addition, the Frolov Kinetic Model is employed to predict the HC emission [41]. The model mainly includes the simplified mechanisms of HC formation and HC oxidation.

2.2. Fuel Samples Preparation

The alkali catalysis was employed for the transesterification of rapeseed oil with methanol to produce the rapeseed oil methyl ester (RME) in a reactor about 1 h. RME is composed of five parts based on the fatty acid profile, including methyl linolenate (C18:3), methyl linoleate (C18:2), methyl oleate (C18:1), methyl stearate (C18:0) and methyl palmitate (C16:0). Cm:n is the shorthand of fatty acid methyl esters. m and n are the numbers of carbon atoms and double bonds, respectively. The physical properties of RME are shown in Table 1. The detailed information on RME can be found in our team’s previous work [8,14,27].

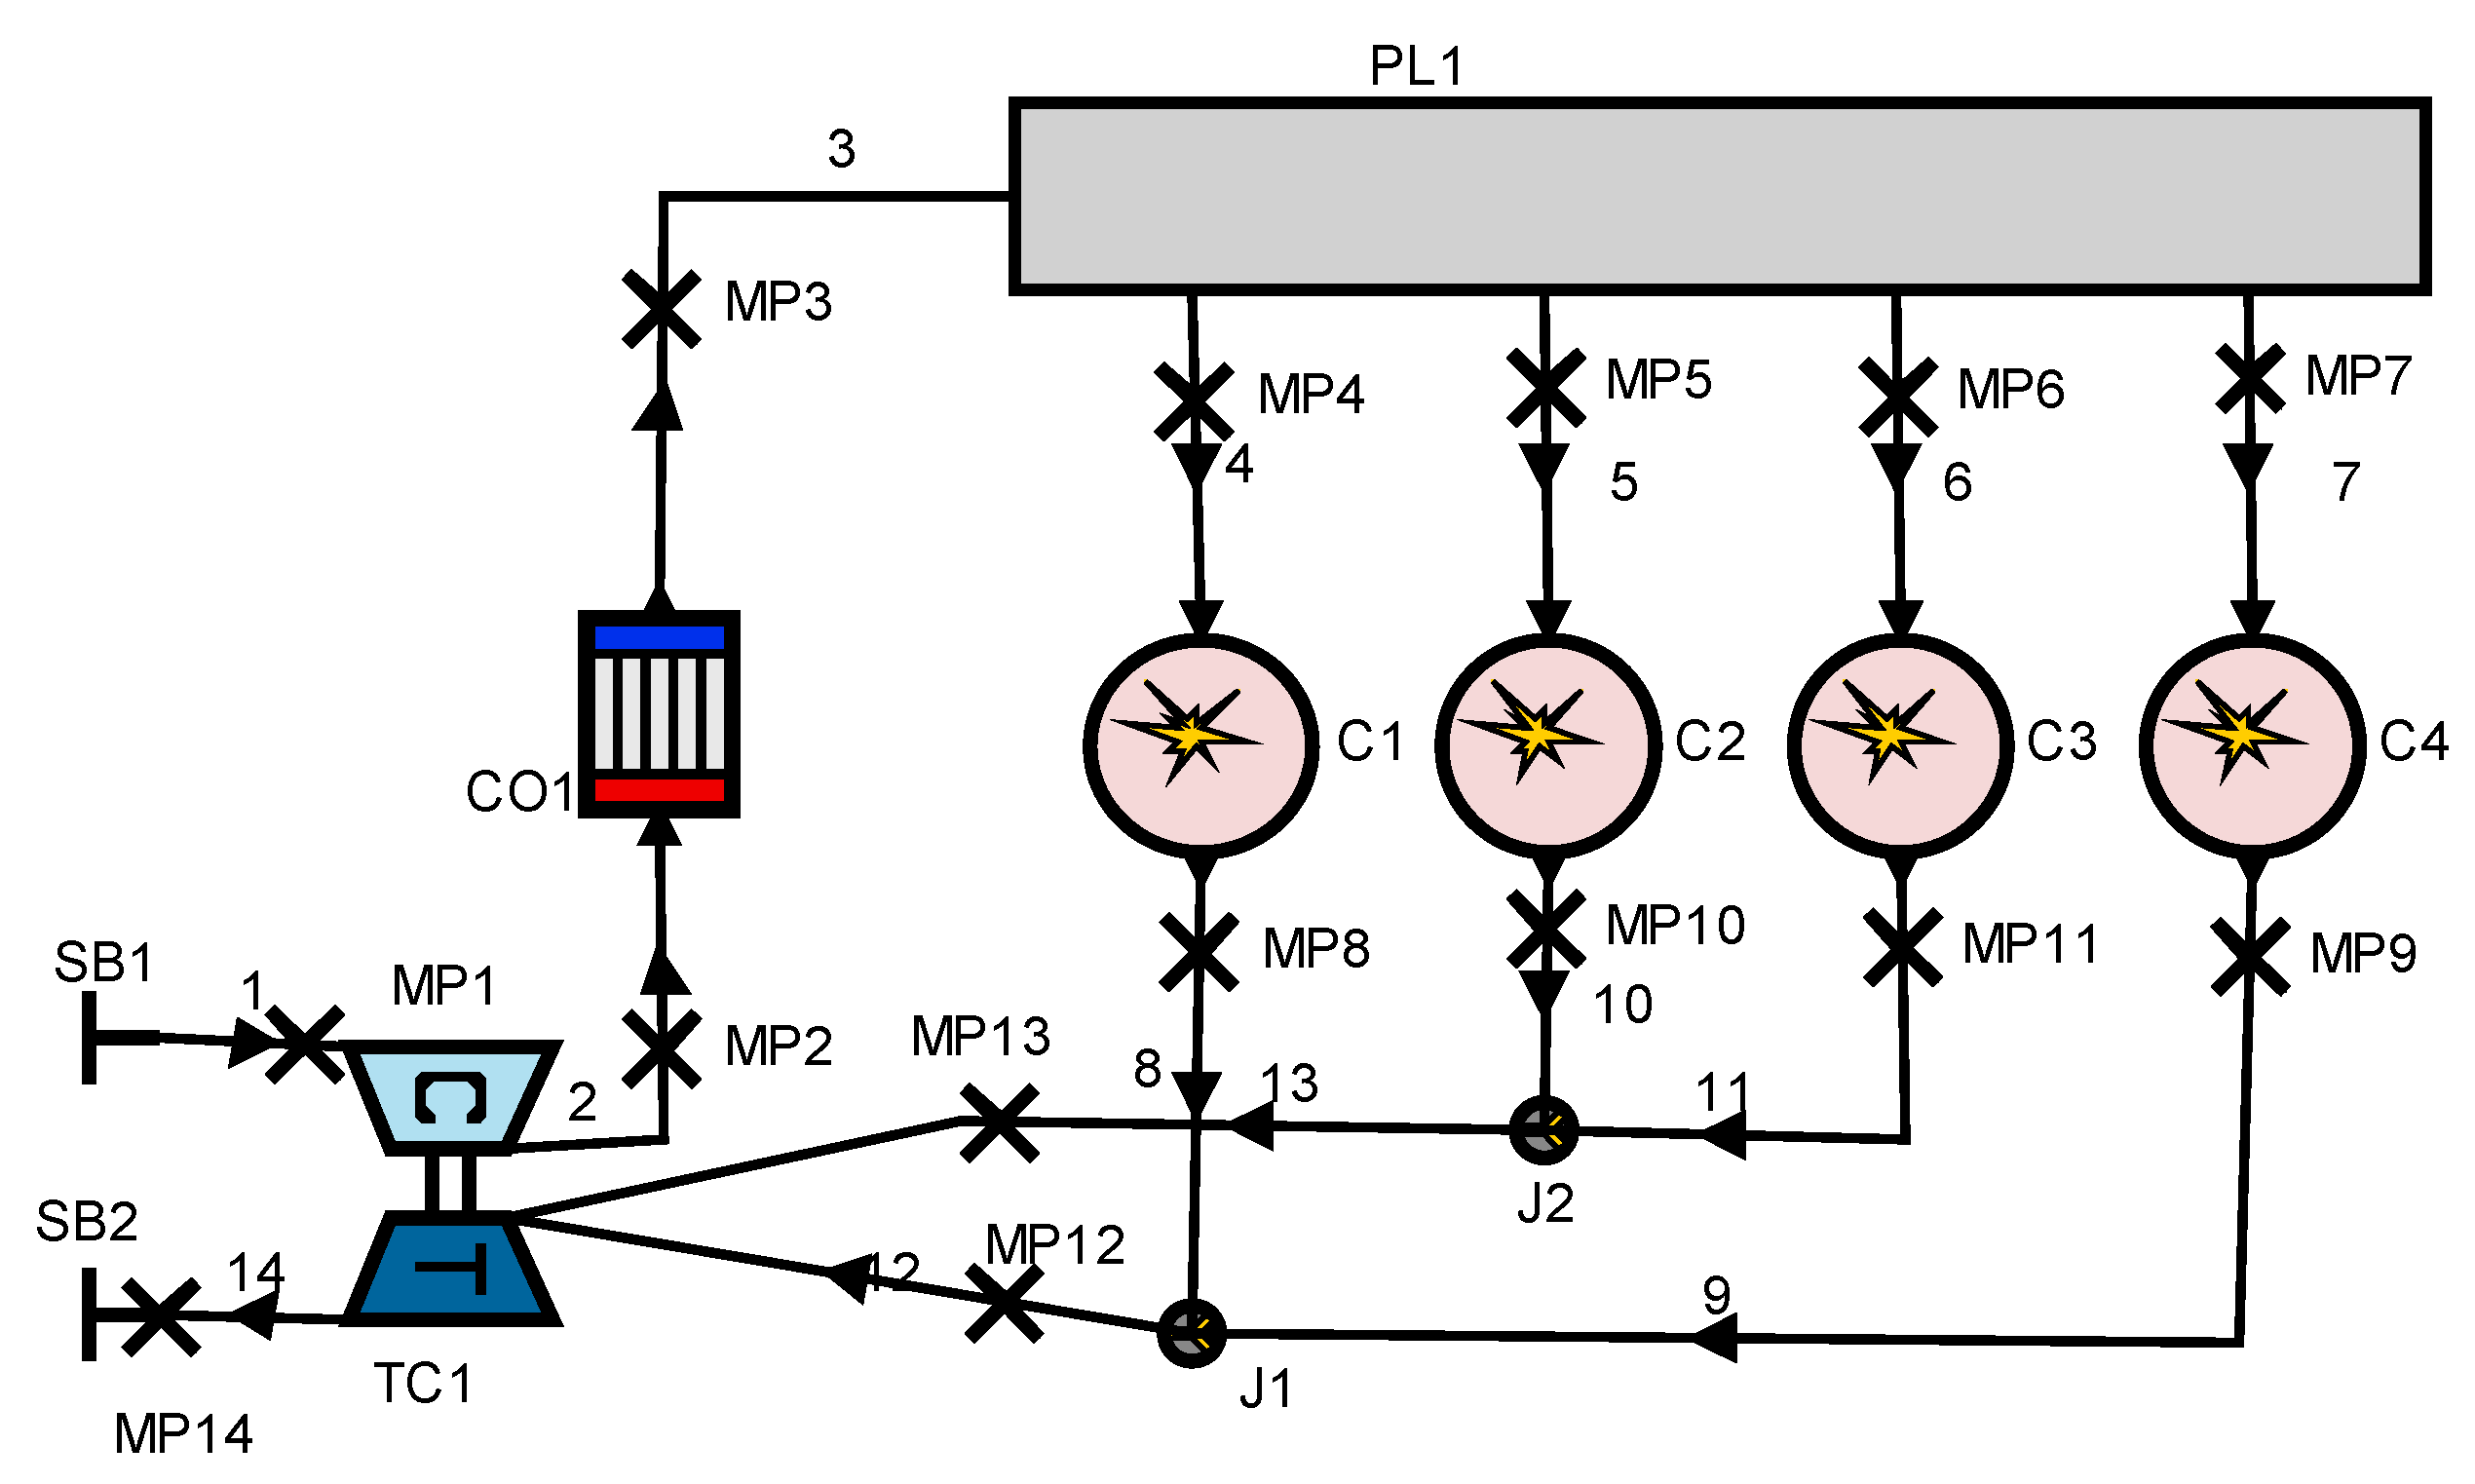
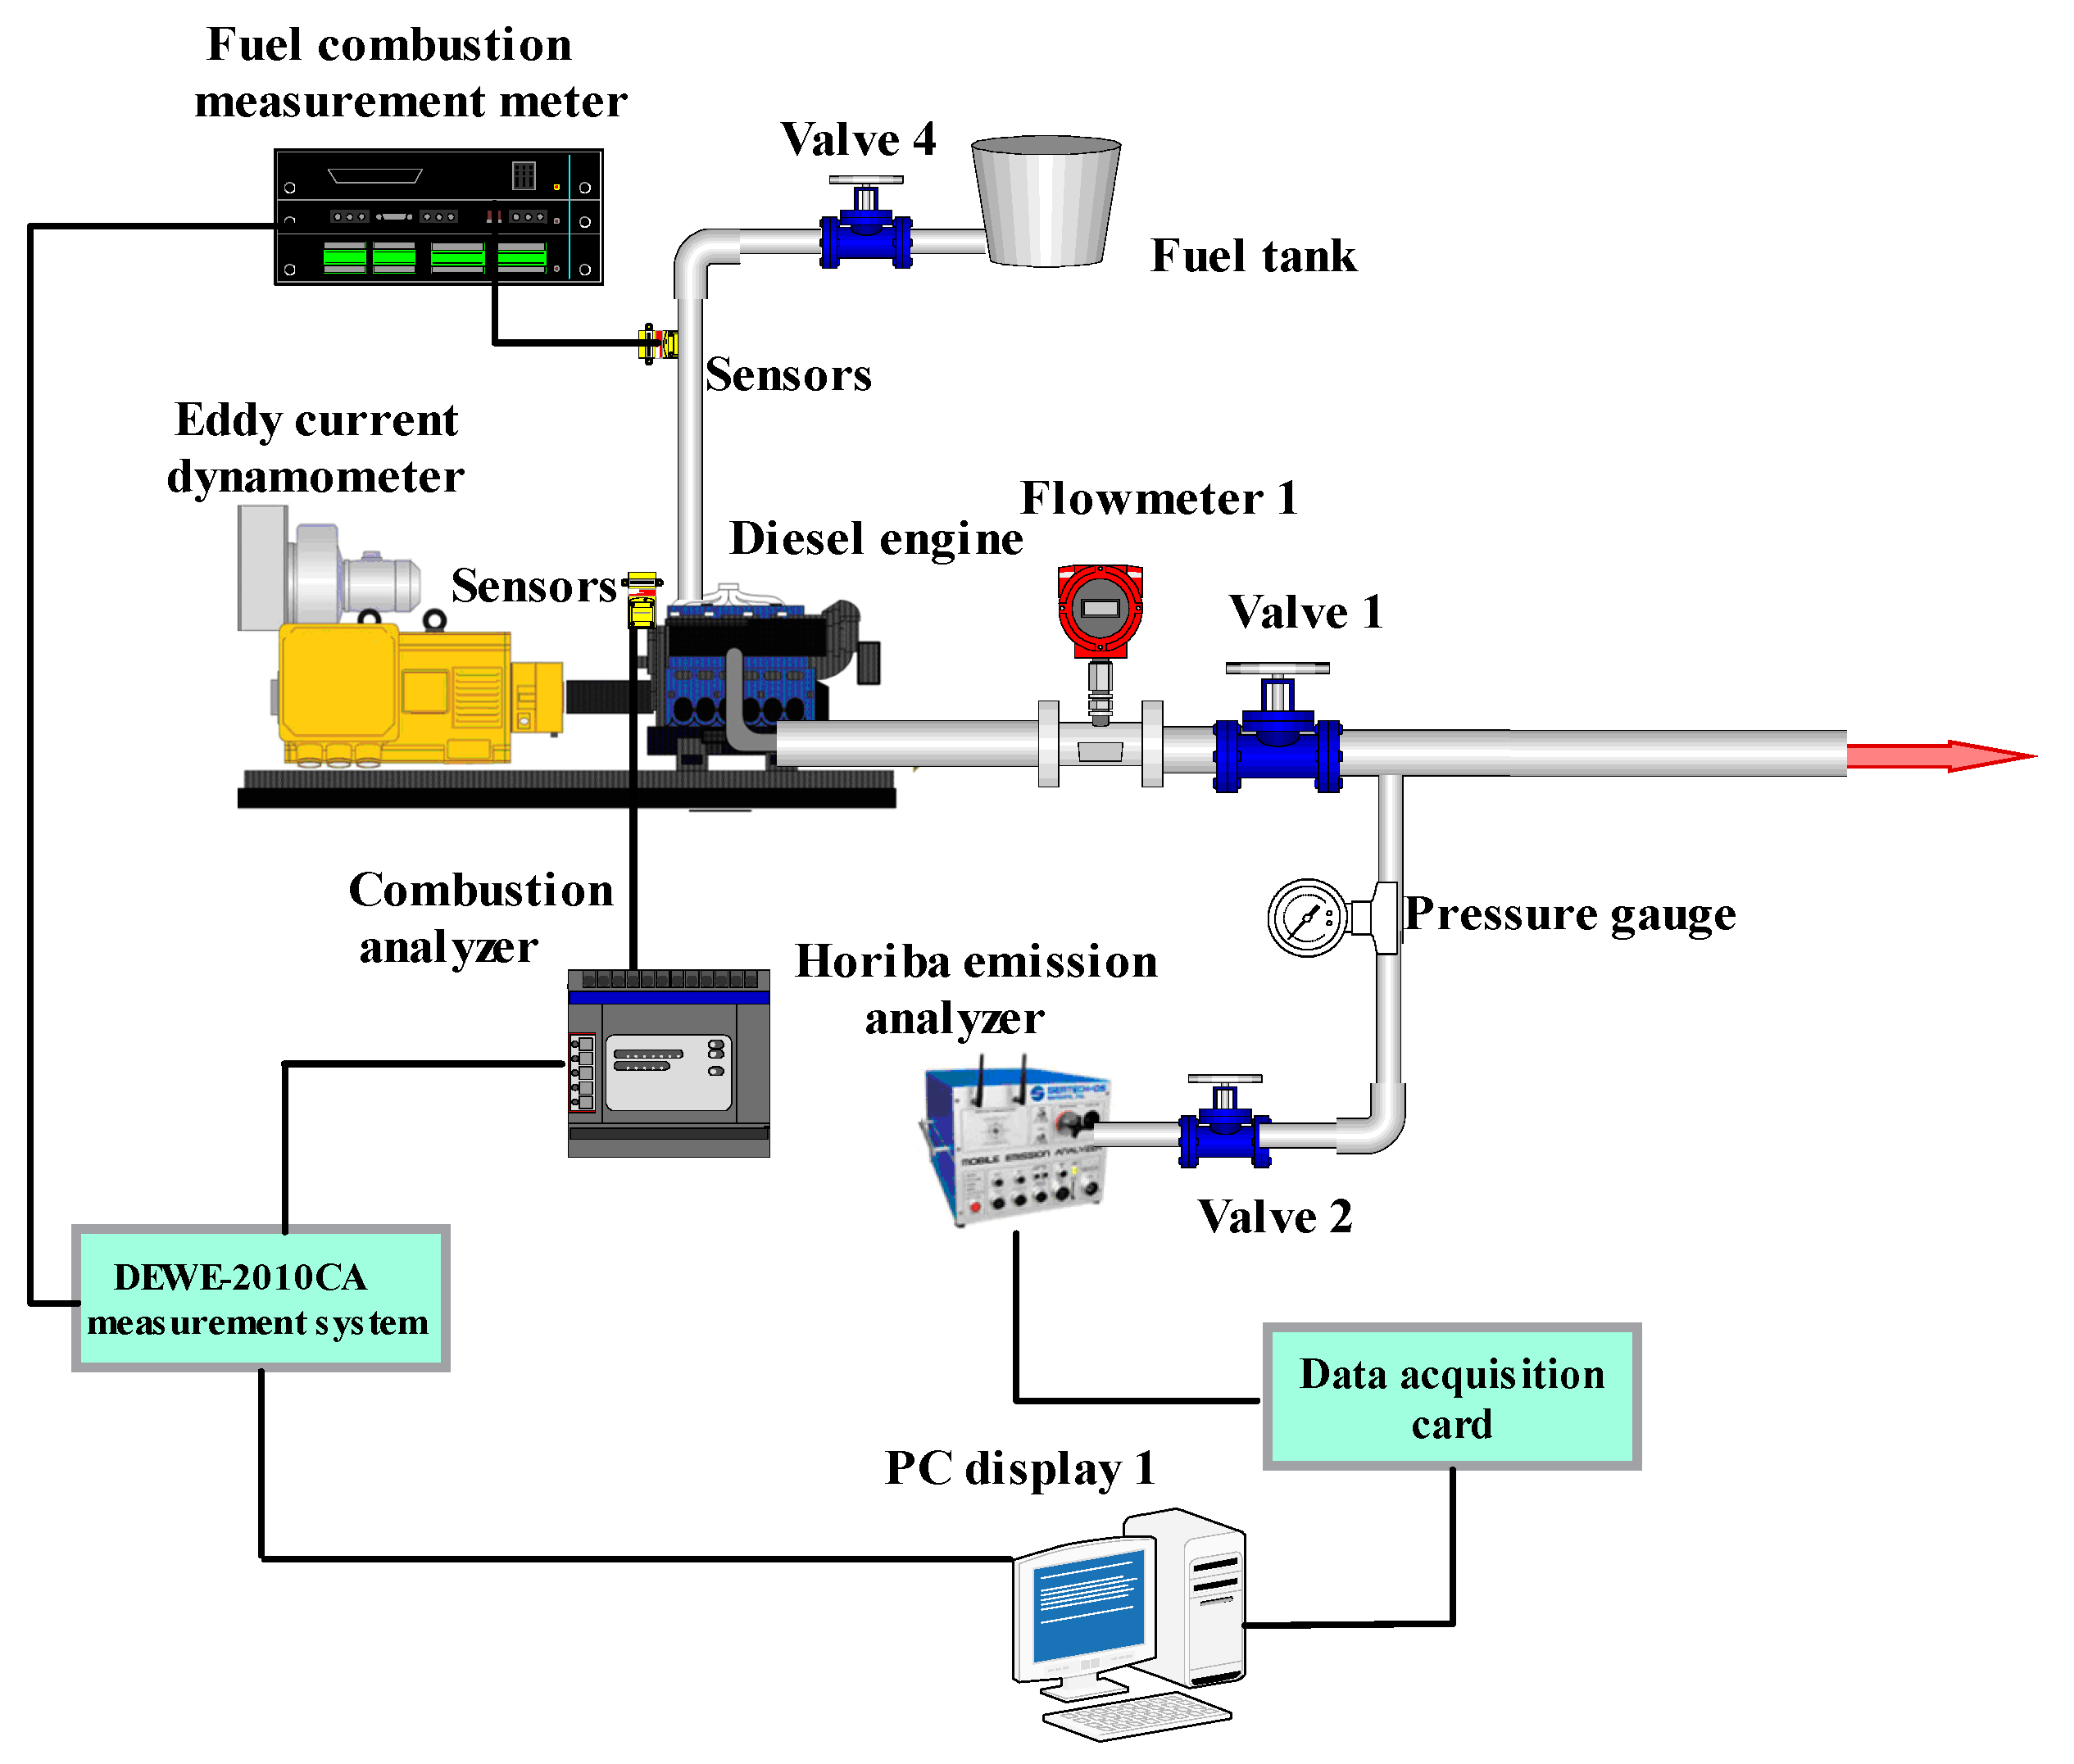
2.3. Feasibility Test

The hydraulic dynamometer is coupled to a diesel engine and the experiment is carried out in the test room. The schematic of the experimental device is shown in Figure 2. An AVL DEWE-2010CA is employed to monitor the combustion in the cylinder. A Xiangyi eddy current dynamometer is used to measure the diesel engine load. Similarly, a Horiba MEXA-1600 type metes and an AVL Dismoke-4000 are used to measure the NOx and soot emissions, respectively. In addition, the appropriate sensors are employed to measure the flow, temperature and pressure.

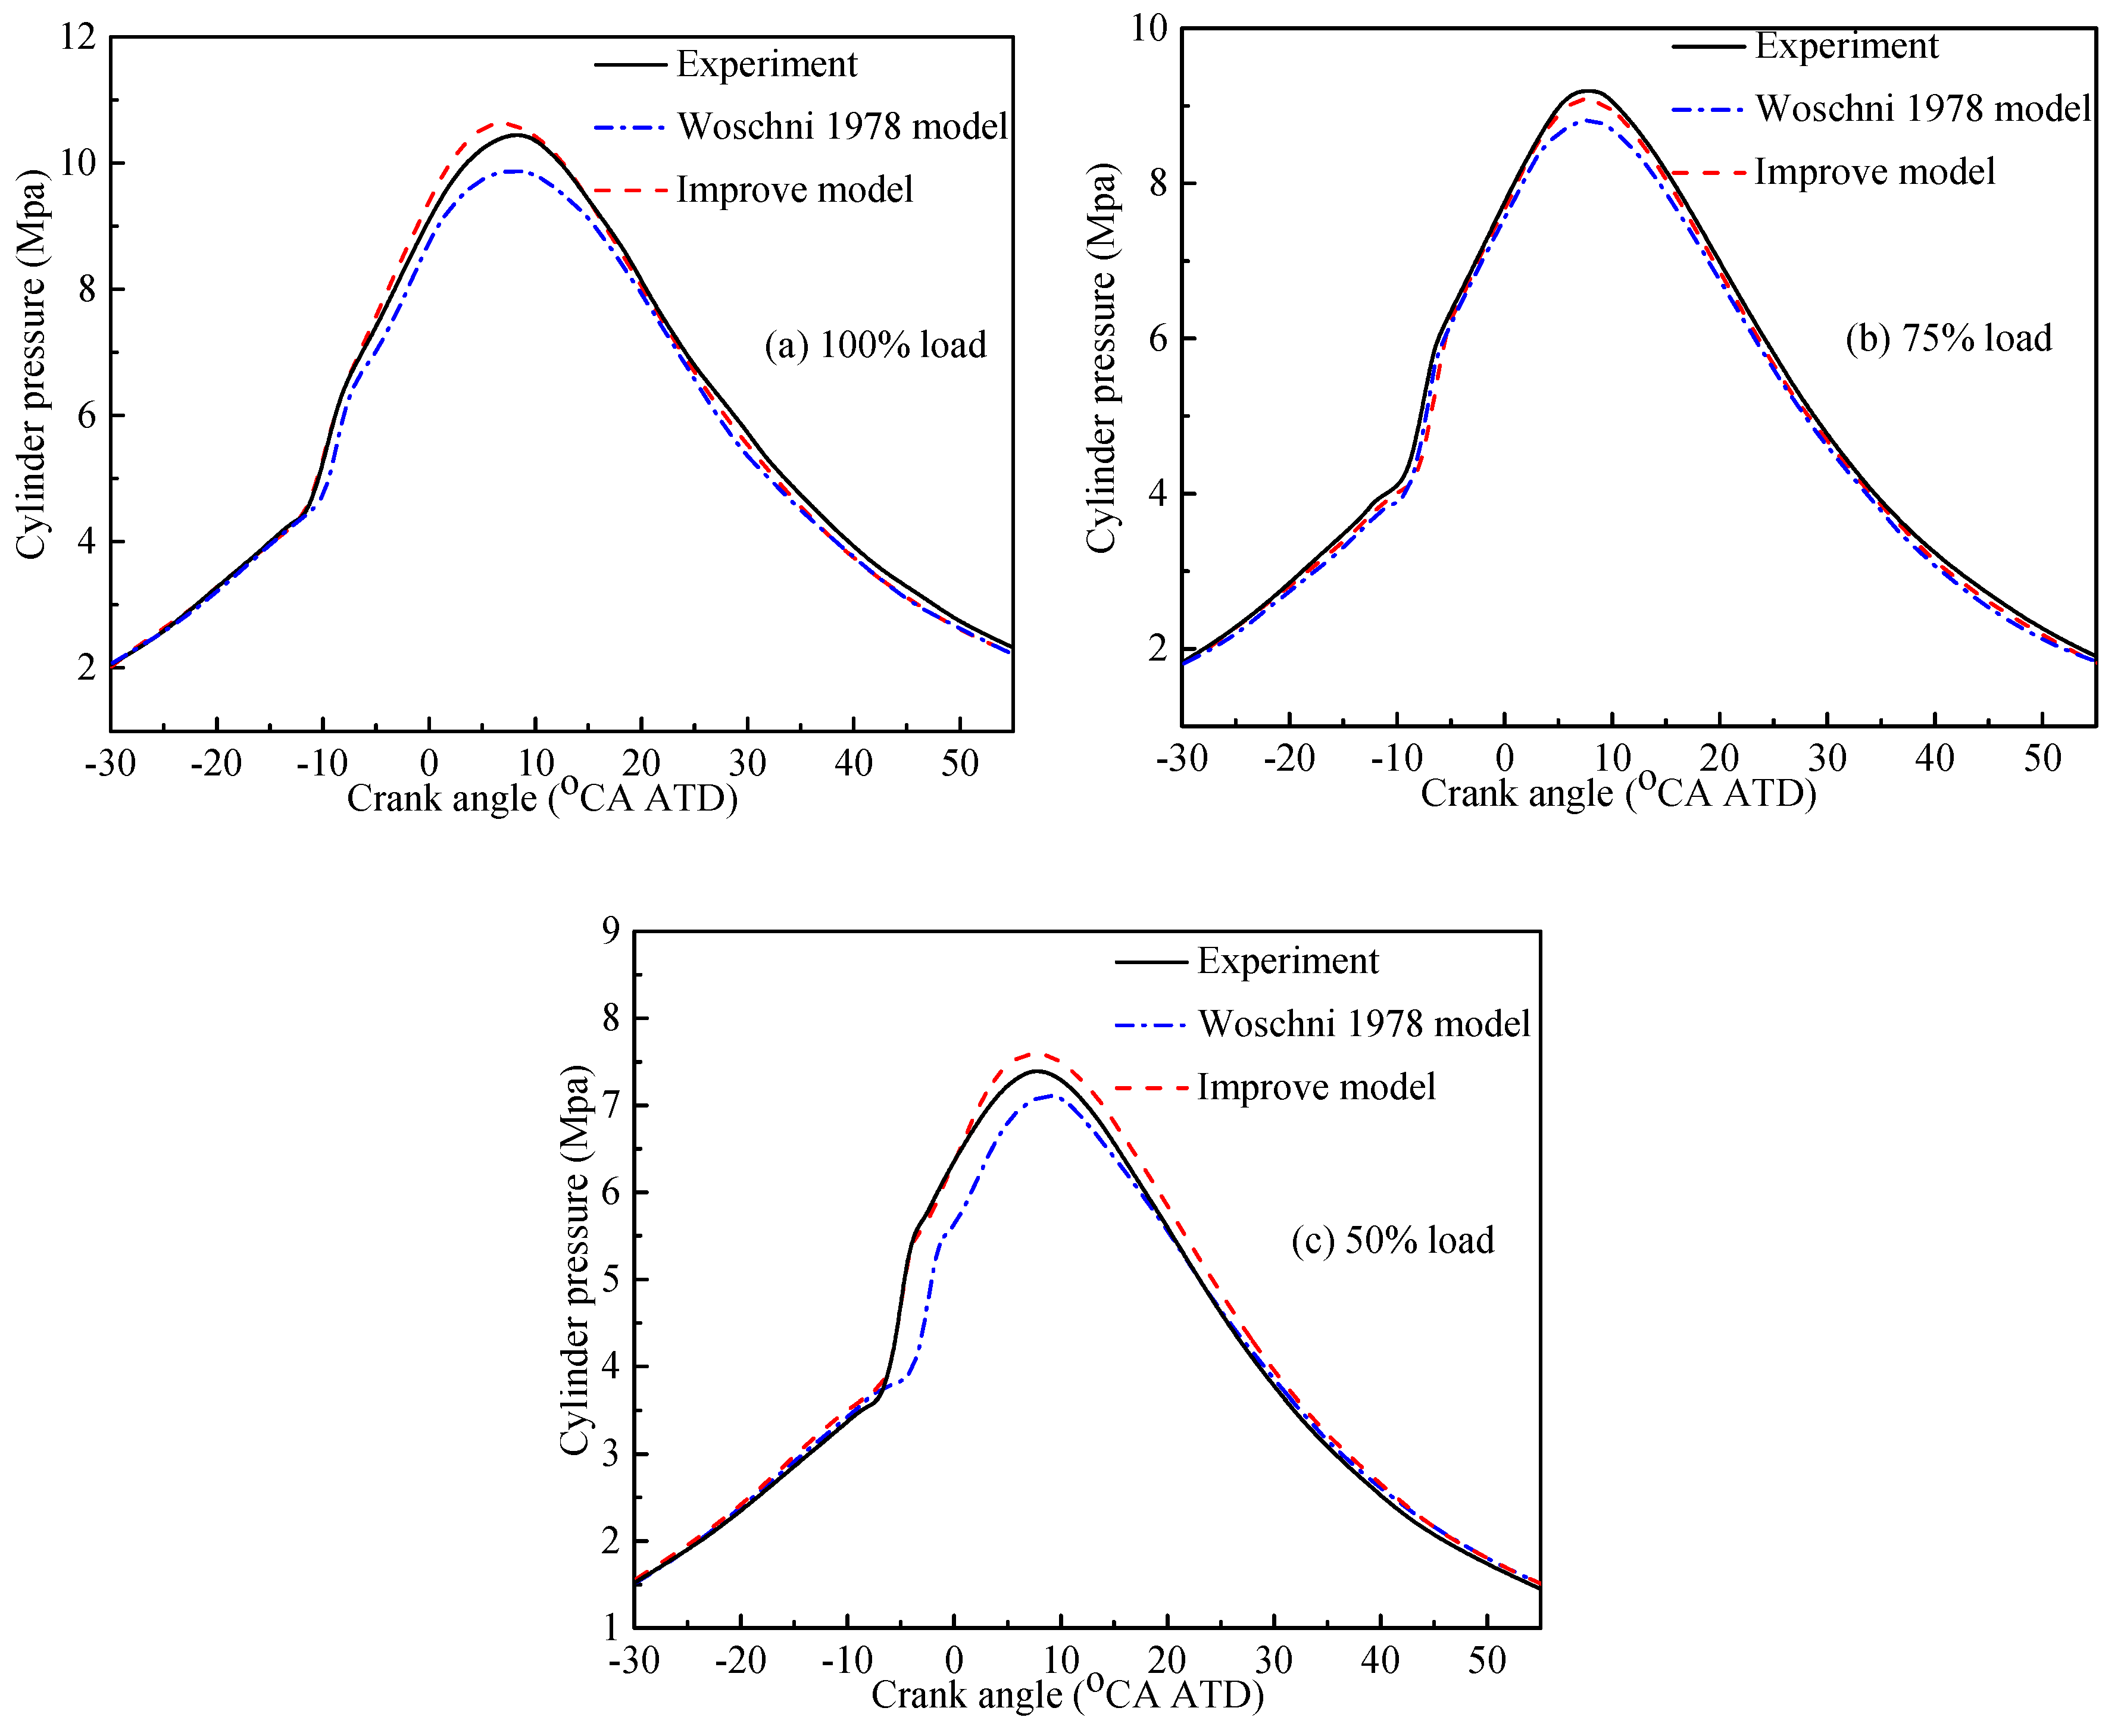
2.4. Model Validation

In order to validate the improved heat transfer model, the experiment was carried out with a four cylinders diesel engine. The following input data are employed to develop the model: the equivalent area of the exhaust and intake valves, the engine geometric data, the steady-state compressor, the ambient conditions and so on. Then the model of initial boundary conditions and input parameters of the basic parameters are shown in Table 2. The adjustment process of the sub-model was corrected and the global model validation was carried out. Thus, the experimental measurements were performed in a medium-speed direct-injection diesel with four cylinders.
As previously described, the models described in the previous section have lots of constants, and the constants should be adjusted. It is necessary to set the constant values, especially the values of the heat transfer constant Cw1 and Cw2. The calibration of the model is done using experimental measurements. The values of Cw1 and Cw2 ae adjusted by using experimental motoring tests carried out on the diesel engine to be modelled. In motoring conditions, the adjustment method is based on the sensitivity of the thermodynamic cycle according to the Lapuerta et al. studies [42]. The heat transfer to the walls could be calculated by using the energy balance equation, which provided the heat transfer experimental measurement based on in-cylinder pressure. An equivalent analysis could be finished by imposing the improved heat transfer model considering boiling and swirl and the error of heat transfer could be obtained (theoretically the heat released in a calculation step is zero). Thus, it is possible to adjust the actual values of the uncertainties so that the engine experimental heat transfer to the walls agrees with the computational results of the improved heat transfer model. Thus, the error is minimized.
The medium-speed diesel engine is widely used for the propulsion of inland river ships. In addition, the engine speed and power exist the cubic relationship. In accordance with international IS08178 standards, the diesel engine was performed at the E3 test cycle mode. The propulsion characteristic of the diesel engine was investigated at four different speed output levels of 628 rpm, 799 rpm, 909 rpm and 1000 rpm respectively, corresponding to 25%, 50%, 75% and 100% load in the study. Thus, the characterization procedure is carried out on a set of motoring tests with the measuring range and accuracy of diesel parameters as detailed in Table 3. The results obtained from the fitting process are Cw1 = 1.82 and Cw1 = 1.12.
In the calculation processes, the improved model, which considers the swirl and boiling heat transfer, is used to calculate the heat transfer. In addition, a four-component chemical kinetics mechanism including 475 reactions and 134 species was developed in our team’s previous work [14,27]. The mechanism consisting of methyl linolenate, methyl oleate, methyl stearate and methyl palmitate is used to calculate the cylinder combustion process in the paper. To validate the improved model, the experiments were carried out and the comparison of cylinder pressure at 1000 rpm under different load conditions were shown in Figure 3. It can be found that the improved model considering the swirl and boiling heat transfer can predict accurately the engine cylinder pressure compared with the Woschni 1978 model. For instance, the maximum error of the max. cylinder pressure without considering the swirl and boiling heat transfer reaches 4.2%, but the maximum error of the max. cylinder pressure with the improved model is 2.1%. Thus, the improved model shows reasonable accuracy. This is due to the fact that the improved model considers the influence of the swirl and boiling heat transfer inside the engine. Thus, the agreement between predicted and measured cylinder pressure is better.

3. Model Application

Firstly, the experiments of diesel engines fueled with biodiesel were carried out at 1000 rpm with 10%, 25%, 50, 75% and 100 loads, respectively. Then the experiments were carried out at 628, 799, 911 and 1000 rpms, corresponding to 25, 50, 75 and 100% load, respectively. Finally, the effects of the improved model on the combustion and emission characteristics of diesel engines fueled with RME were investigated in terms of Brake power, BSFC, NOx, CO and HC emissions.

3.1. Analysis on Emission and Performance Characteristics

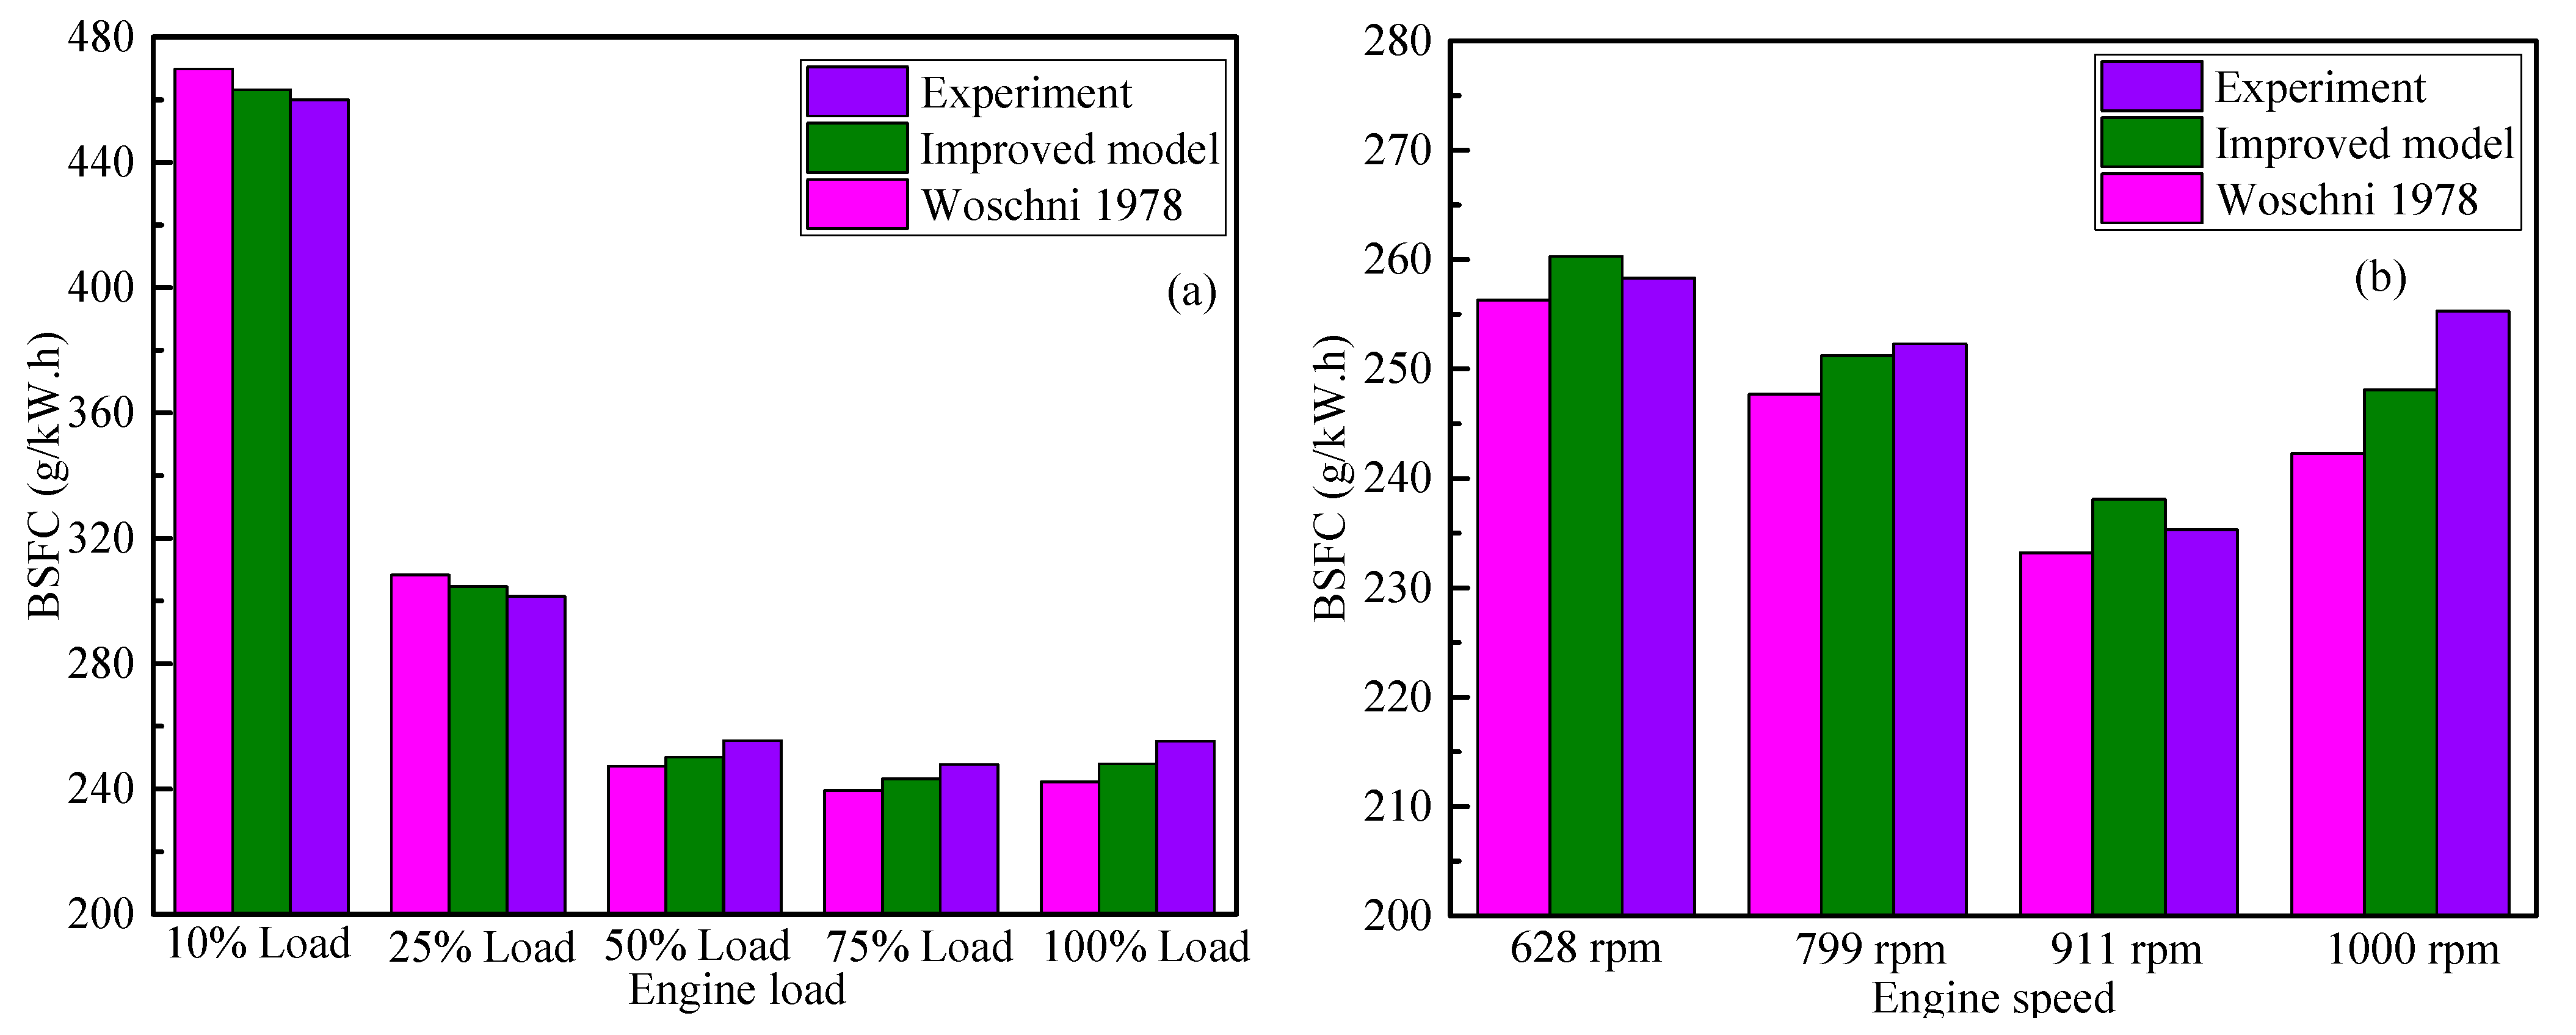
3.1.1. Brake Specific Fuel Consumption

To evaluate the characteristic, the BSFC is considered an important indicator. Figure 4a shows the comparisons of engine BSFC under different load conditions. It can be found that the BSFC firstly decreases and then increases with the increase in load when the engine speed is at 1000 rpm. In addition, Figure 4b shows that with the increase in speed, the engine load also firstly decreases and then increases. For instance, the engine BSFCs are 247.9 and 235.3 g/(kW·h) when the load is 75% and engine speed is 911 rpm, respectively. The BSFC is the lowest when the engine speed is 911 rpm or the load is 75%. This is due to the fact that the operating points are the common design points. At high load, the combustion in the cylinder becomes worse due to the insufficient oxygen. On the contrary, because of the low combustion temperature and inject pressure, the engine always gains the dropped combustion. Thus, the BSFC increases. In addition, it can be found the results predicted by the improved model is more accurate than those predicted by the model without considering the swirl and boiling heat transfer. For instance, the max error of improved model is 2.1%, but the maximum error of the original model is 3.1% compared with the experimental result. This is due to the fact that boiling phenomena often occur in high heat flux areas on the coolant side in the water-cooled cylinder head and the swirl will occur in the cylinder, then the heat transfer coefficient is improved. Thus, the improved model can improve the accuracy of heat transfer.

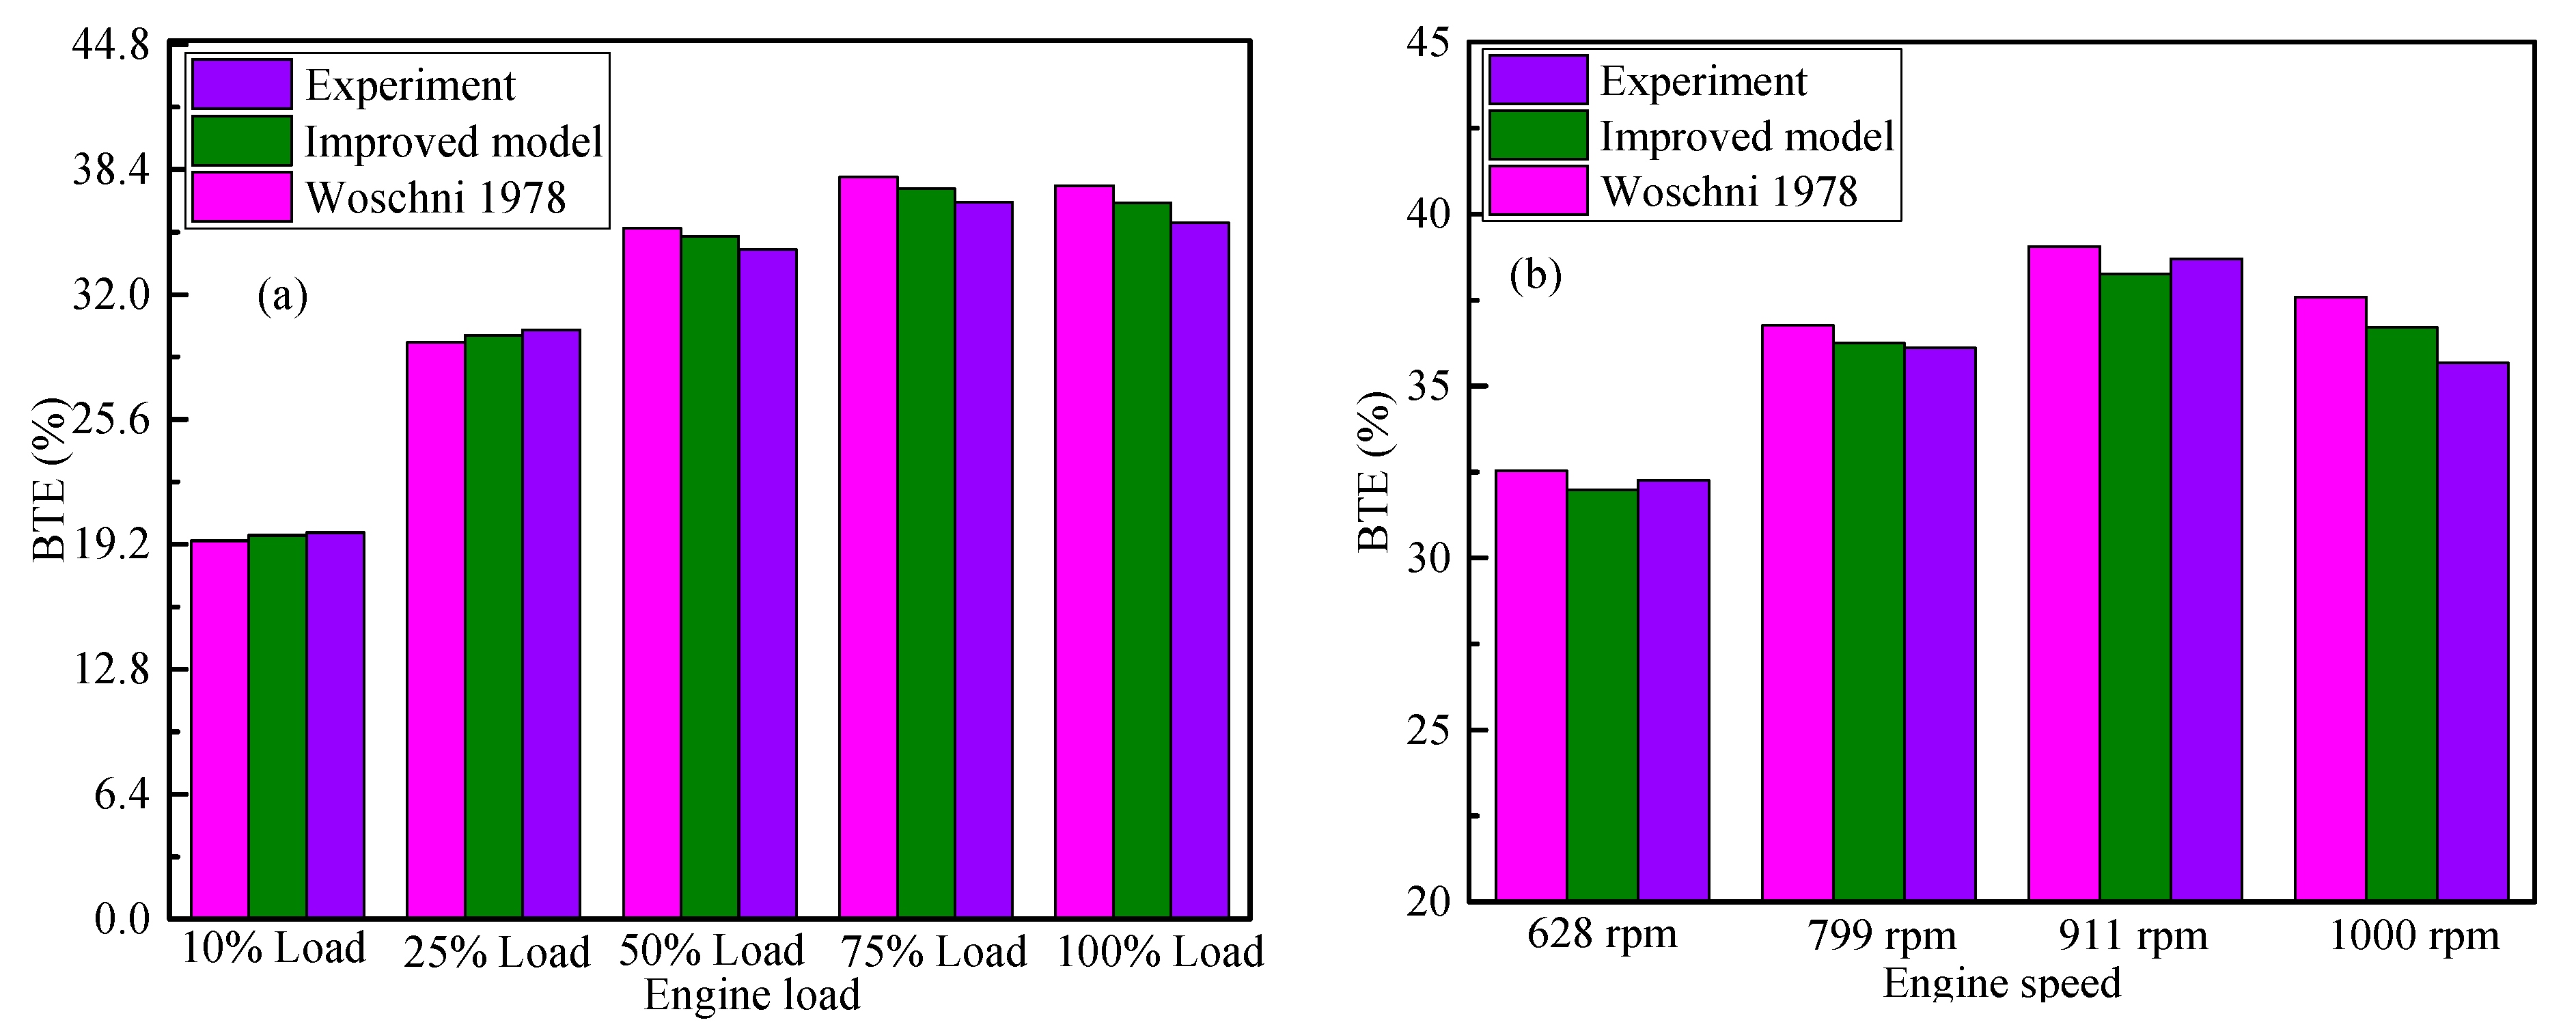
3.1.2. Brake Thermal Efficiency
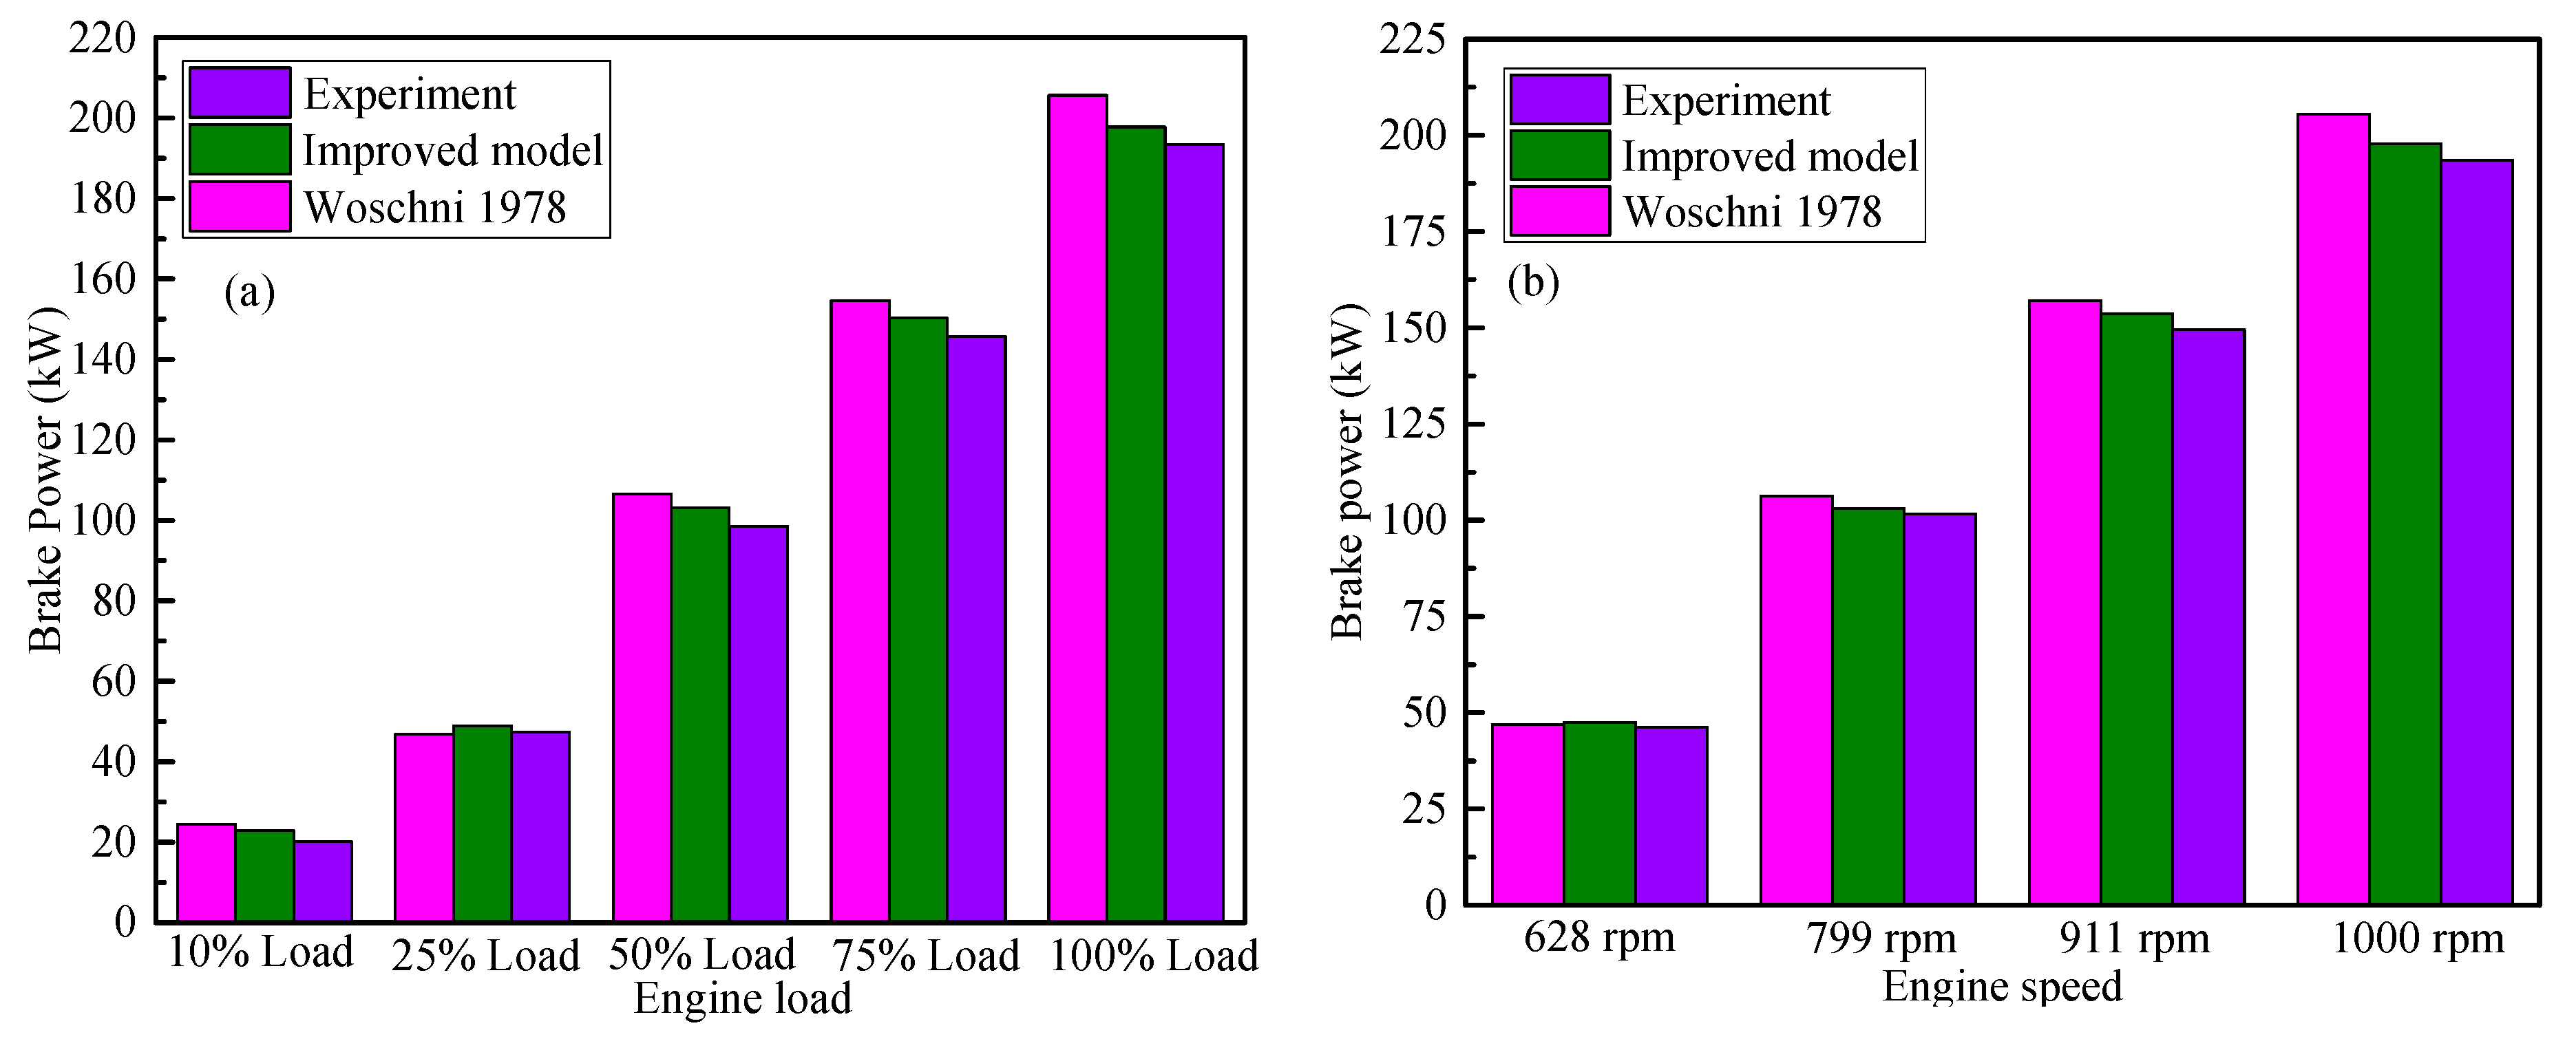
The useful power converted by the fuel combustion is defined as the brake thermal efficiency (BTE). The BTE can be calculated by the following Equation (15).
B T E = 3600 B S F C L C V
where LCV is the fuel lower calorific value.
Figure 5 shows the comparisons of engine BTE under different load conditions. It can be found that the BTE firstly increases and then decreases with the increase in engine load (see Figure 5a) and speed (see Figure 5b). When the engine speed is 911 rpm or the load is 75%, the BTE is high. The experimental max. BTE is 37.6% when the engine speed is 1000 rpm. In addition, the experimental max. BTE is 38.7% when the engine speed is 911 rpm. As previously mentioned, the BTE is low under the other condition of diesel engines, except under the engine design conditions. As previously described, the operating points are the common design points. When the BSFC is high, the BTE is low. In addition, it can be found the values of BTE predicted by the improved model is more accurate than those predicted by the model without considering the swirl and boiling heat transfer. This is due to the fact that the swirl and boiling heat transfer is considered in the model. The improved model can better predict the heat transfer coefficient. Thus, the improved model can improve the accuracy of BTE.

3.1.3. Brake Power

Figure 6 shows the comparisons of brake power under different load conditions. It can be found that the brake power increases with the increase in engine load (see Figure 6a) and engine speed (see Figure 6b). This is due to the fact that more heat energy is produced by the increased fuel mass with an increase in engine load. In addition, it can be found brake power predicted by the improved model is more accurate than that predicted by the model without considering the swirl and boiling heat transfer. For instance, the measurement value is 193.5 kW when the engine load is 100% and the speed is 1000 rpm. The error of the improved model is 1.7% compared with the measurement value. However, the error of the original model is 2.8% compared with the measurement value. In addition, the measurement value is 20.1 kW when the engine load is 10% and the speed is 1000 rpm. The error of the improved model is 1.6% compared with the measurement value. However, the error of the original model is 2.3% compared with the measurement value. Thus, the improved model considering swirl and boiling heat transfer can improve the accuracy of heat transfer.

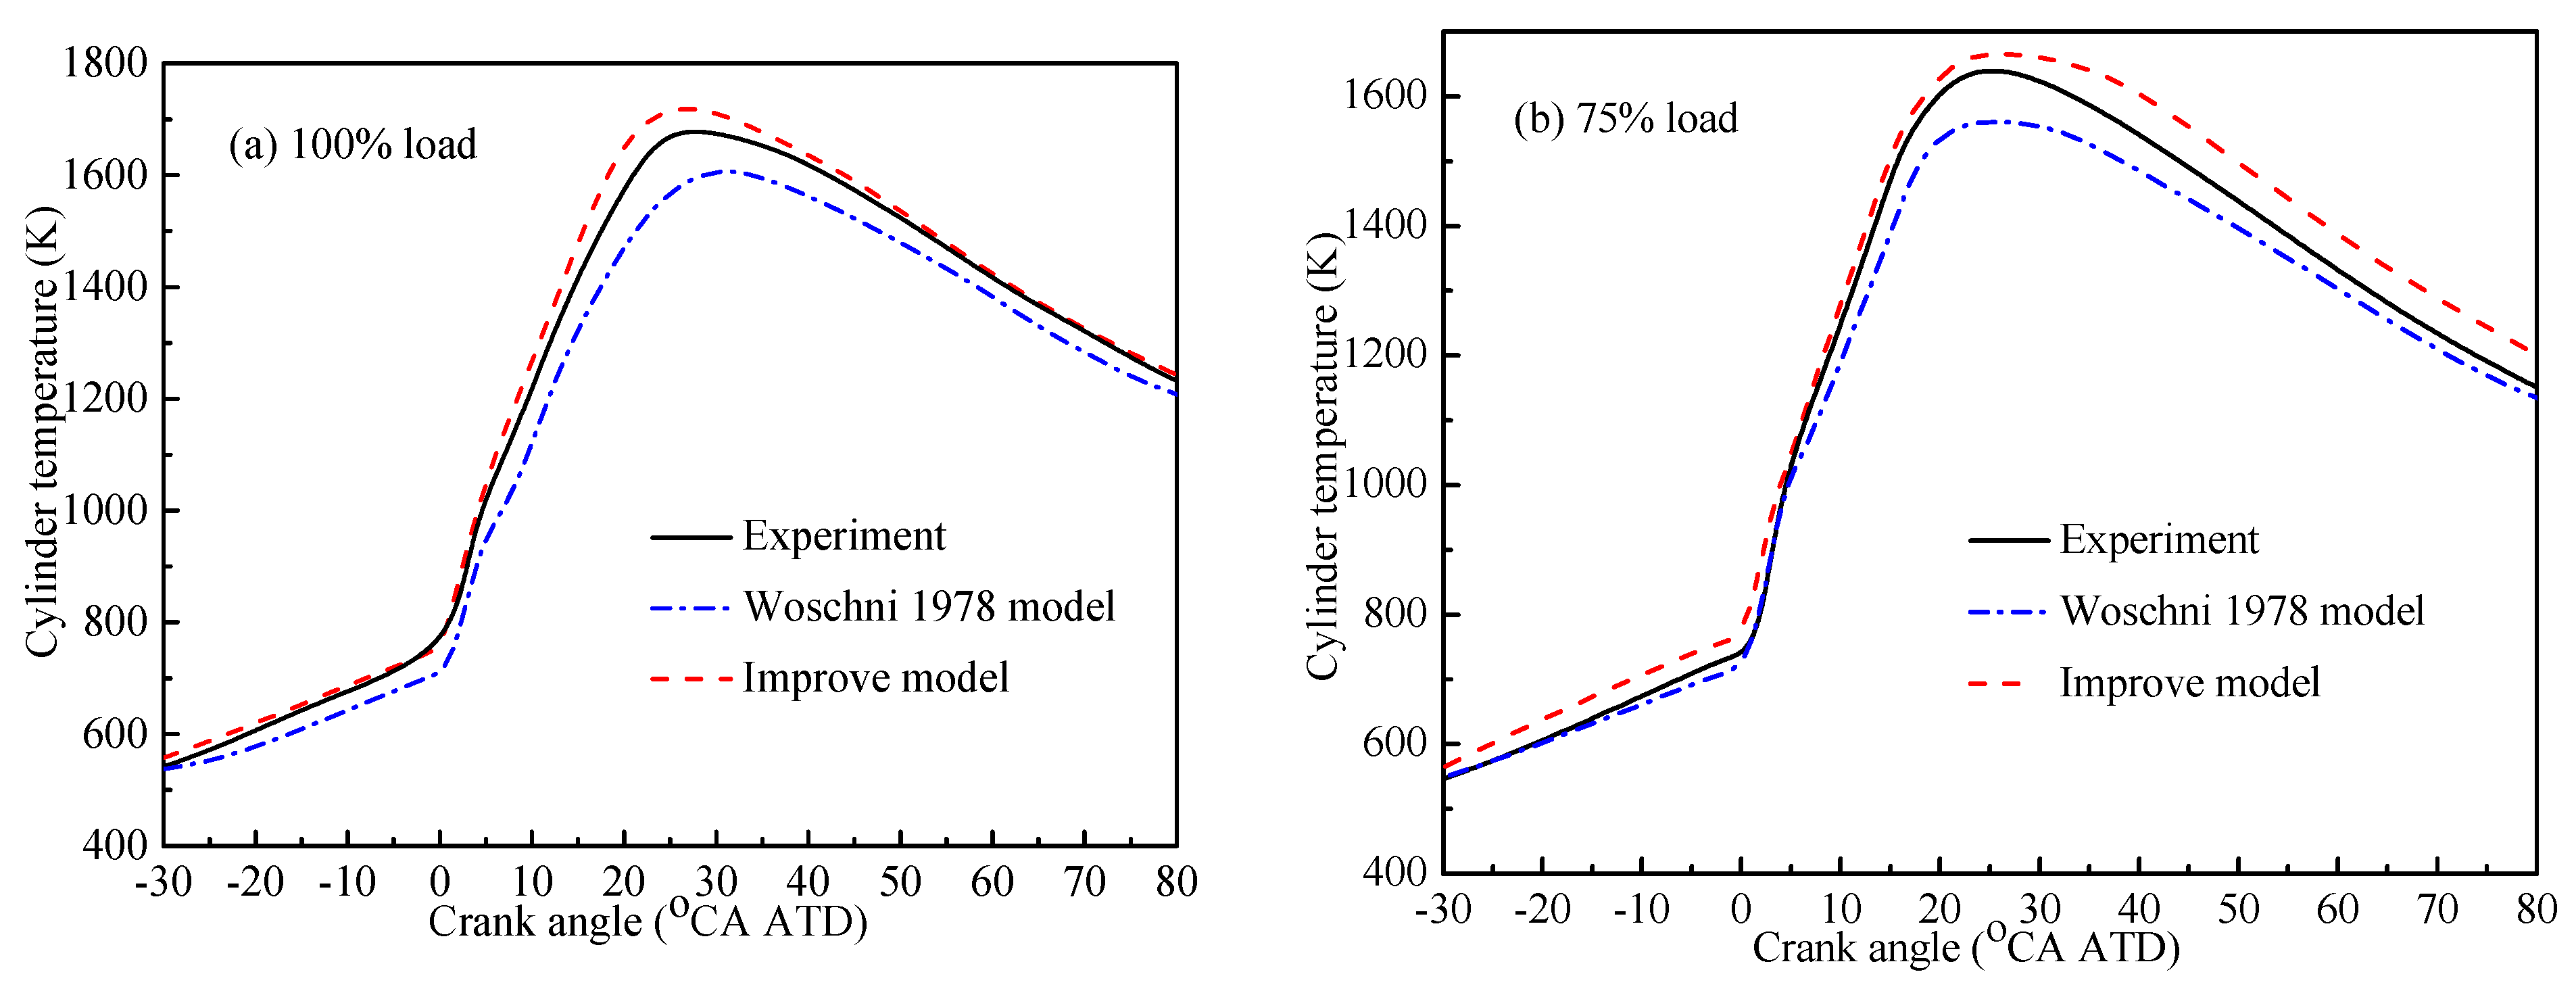
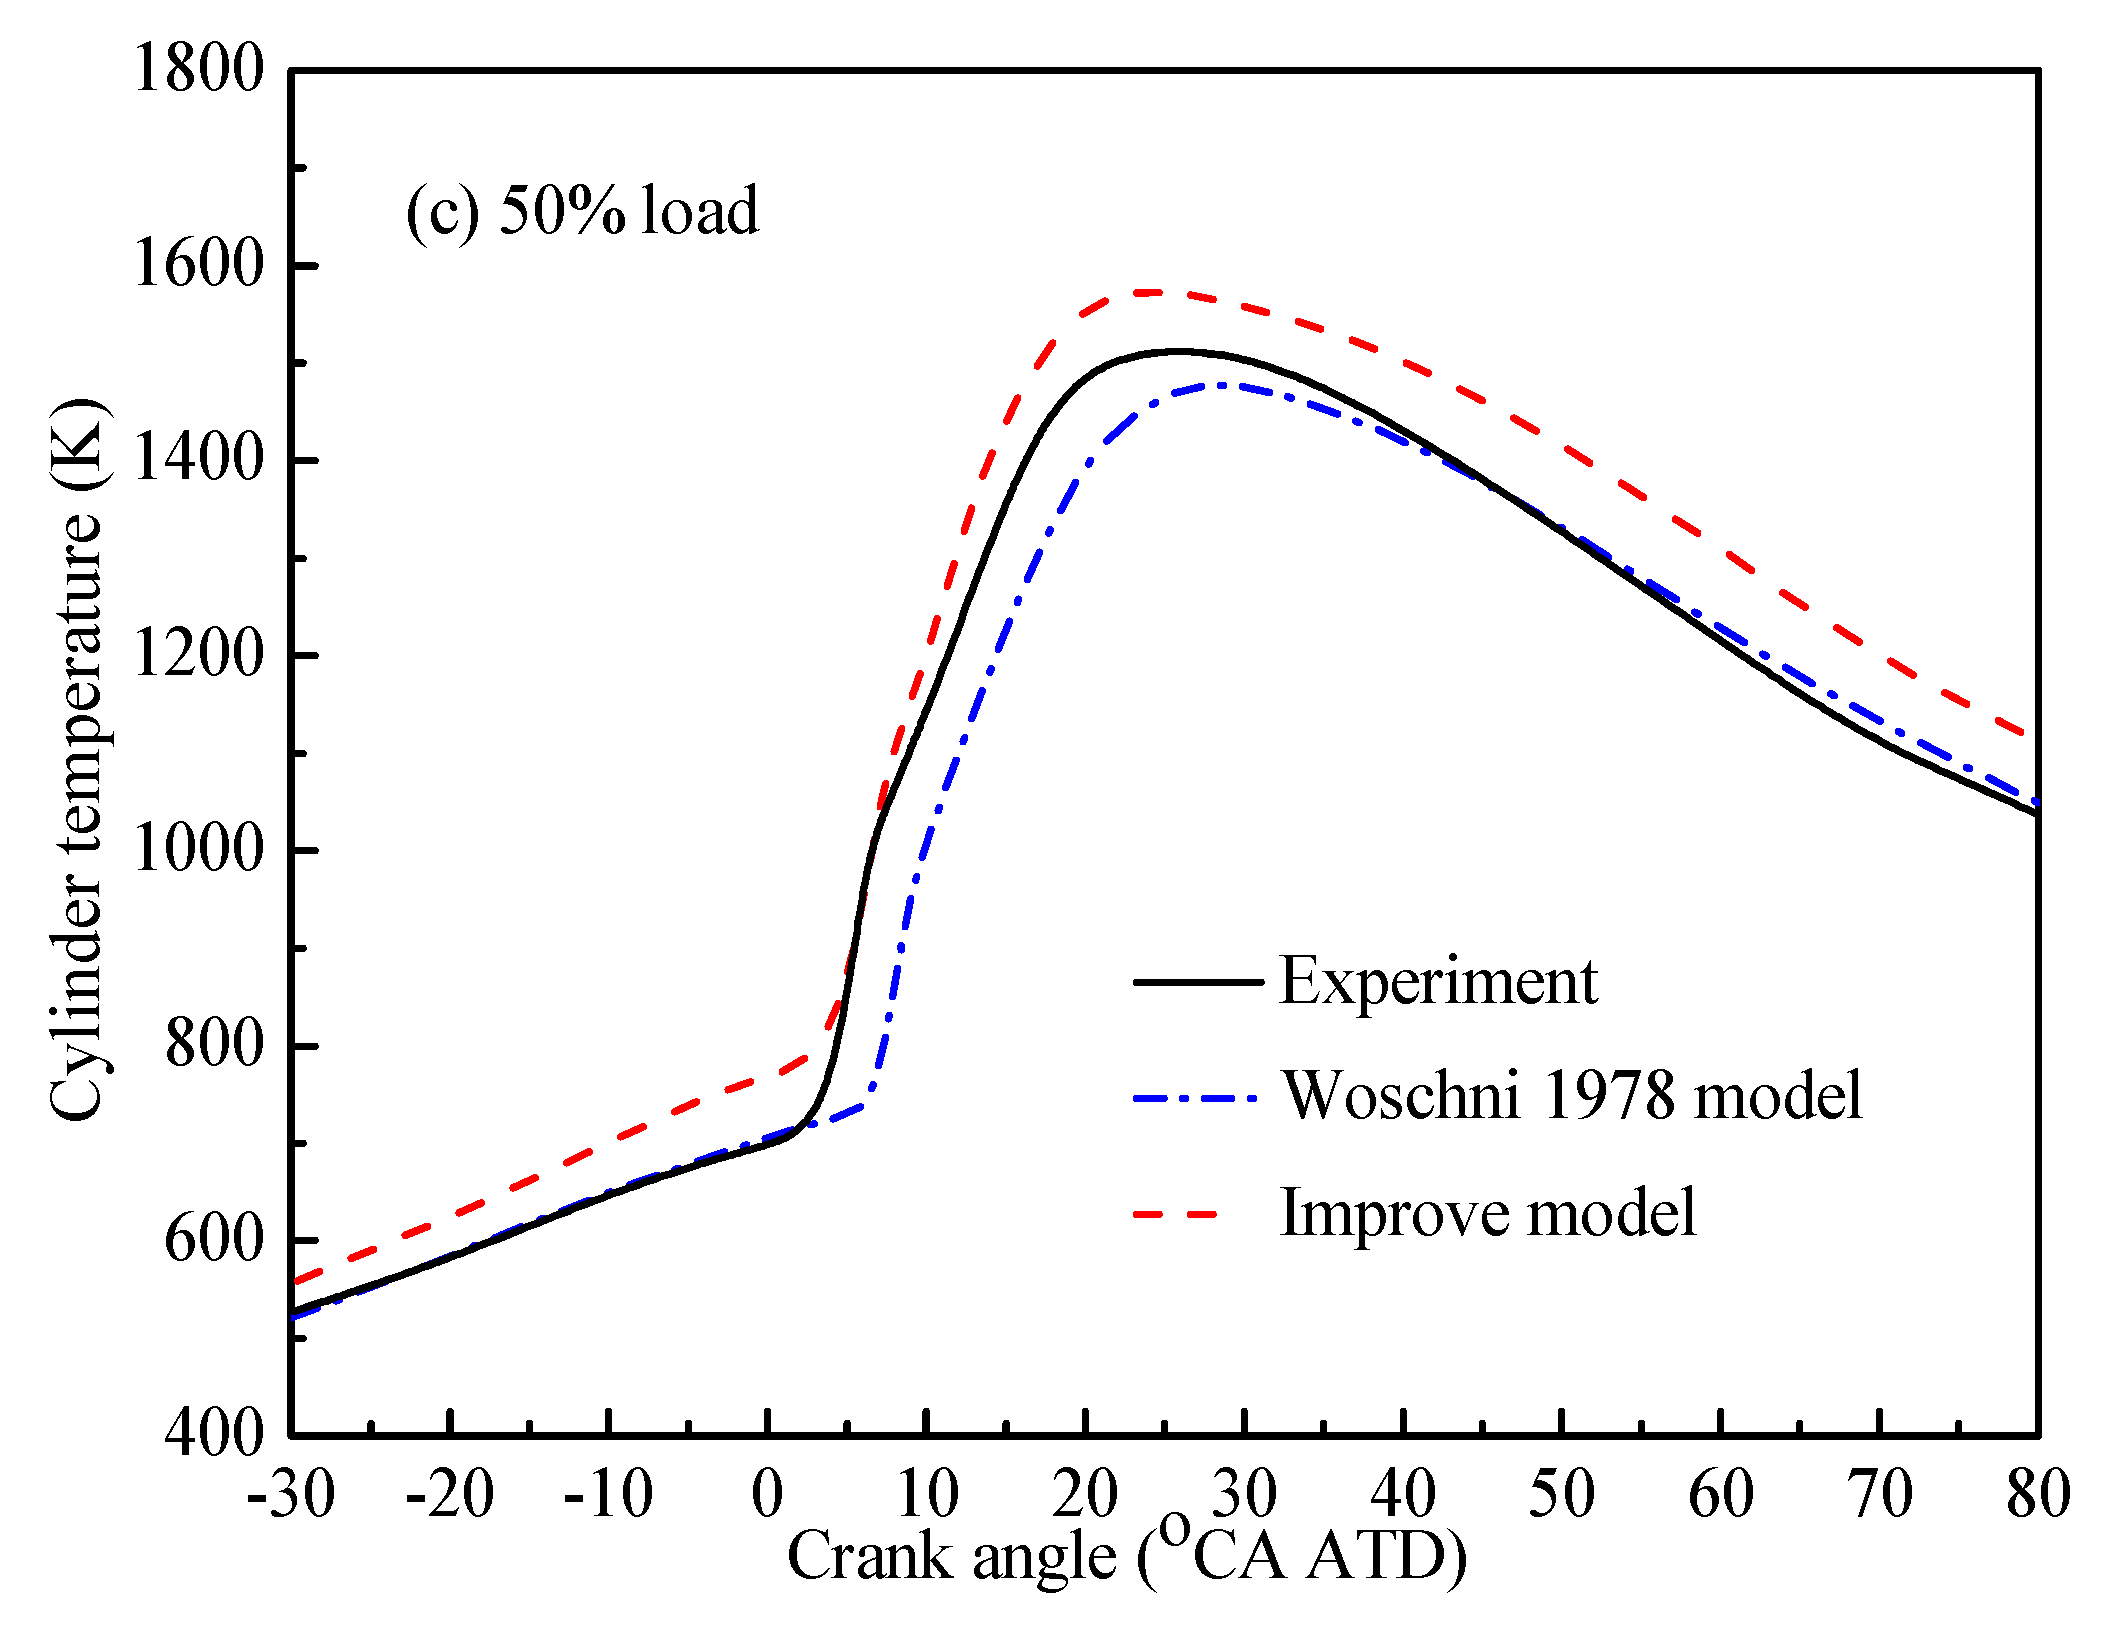
3.1.4. Cylinder Temperature
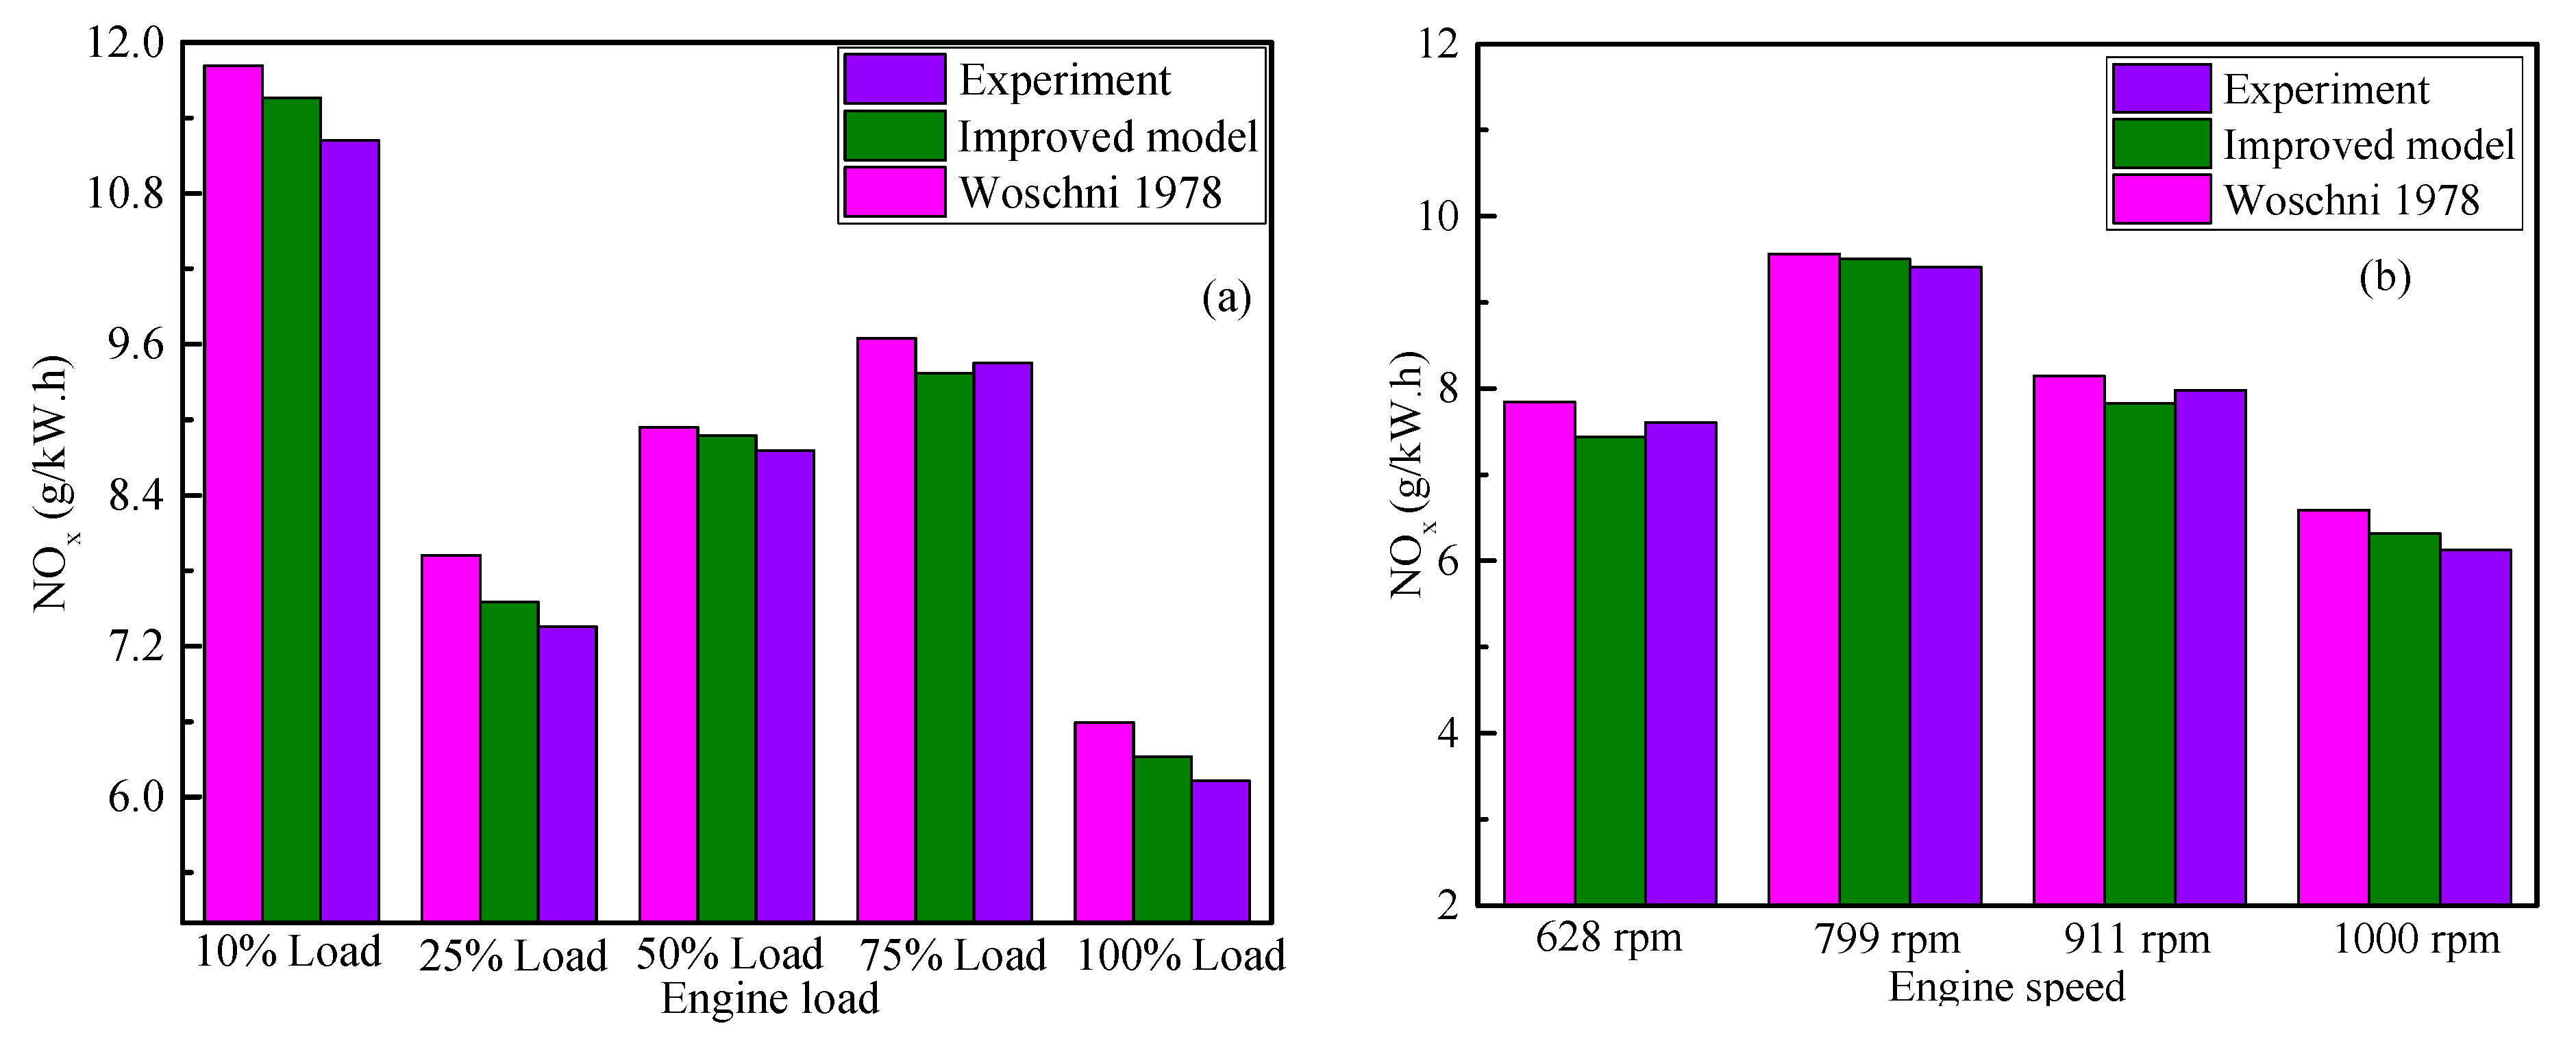
The comparison of a cylinder temperature of a diesel engine fueled with biodiesel is shown in Figure 7. It can be observed that the in-cylinder temperature significantly increases with the increase in engine load and speed. This is due to the increased fuel mass. In addition, it can be observed that the improved model can predict the cylinder temperature of diesel engines under 100% load (see Figure 7a), 75% load (see Figure 7b) and 50% load (see Figure 7c) compared to the predictive results with the experimental results. However, the improved model is more accurate. More specifically, the max. cylinder temperature predicted by the improved model is 1728 K, 1657 K and 1587 K, respectively. The corresponding errors of the improved model are 2.9%, 2.3% and 3.1% compare with the measurement value. In addition, the max. cylinder temperature predicted by the original model is 1618 K, 1548 K and 1576 K, respectively. The corresponding errors of the improved model are 3.6%, 3.5% and 3.0% compare with the measurement value. When the nucleate boiling and swirl occurs at the surface, the heat transfer in the cylinder can be calculated accurately by using the improved model. Based on the analysis above, the improved model can accurately predict the cylinder temperature of diesel engines under different conditions.

3.1.5. NOx Emission

The comparison of NOx emission diesel engine fueled with biodiesel is shown in Figure 8. It can be observed that with the increase in engine speed (see Figure 8a) and engine load (see Figure 8b), the NOx emission firstly decreases, then increases, and finally decreases. The temperature, oxygen concentration and reaction time are important for the information of NOx. At low load, the shorter combustion duration and lower cylinder temperature result in a reduction in the reaction time. However, the increased cylinder temperature is beneficial to the formation of NOx when the engine load increases. NOx emission reaches a maximum when the load is 75% and then decreases by further increasing the load. At high load, the poor oxygen zones are formed by a lot of fuel injection sprayed into the cylinder. Thus, the NOx emission is reduced. As mentioned above, the engine load increases gradually with the increase in engine speed. When the speed is 799 rpm, the NOx emission reaches a maximum and then decreased by further increasing the speed. In addition, it can be found that the heat transfer in the cylinder has a great influence on the cylinder temperature and the formation of NOx. Similarly, the improved model predicts better the NOx formation of diesel engines under different load conditions compared with the original model. More specifically, the max. errors predicted by the improved model is 3.7% and the max. errors predicted by the original model is 4.8%. Thus, the improved model can better predict the formation of NOx and the prediction error is reduced a lot. The boiling heat transfer has a great effect on the NOx formation.
The brake-specific NOx emission is an important parameter for the environmental friendliness of diesel engines. According to the Annex VI of MARPOL 73/78, the Weighting coefficient of E3 test cycle is shown in Table 4 and the brake-specific NOx emissions can be calculated by Equation (16).
W N O x = i = 1 i = n M N O x W F i i = 1 i = n P i W F i
where WNOx is the brake specific emission values, the WFi is the Weighting coefficient, Pi is the brake power, MNOx is the exhaust gas mass.
The standards of Tier I, Tier II and Tier III are 11.3 g/(kW·h), 8.98 g/(kW·h) and 2.26 g/(kW·h), respectively. According to Equation (16), the NOx emission of the weighted algorithm is 8.34 g/(kW·h). Thus, brake-specific NOx emission is satisfied with the requirement of Tier Ⅱ. Therefore, as the emission legislation is becoming stricter and stricter, the internal purification technology and exhaust gas treatment should be considered, and the regulation requirement is meet in future work.

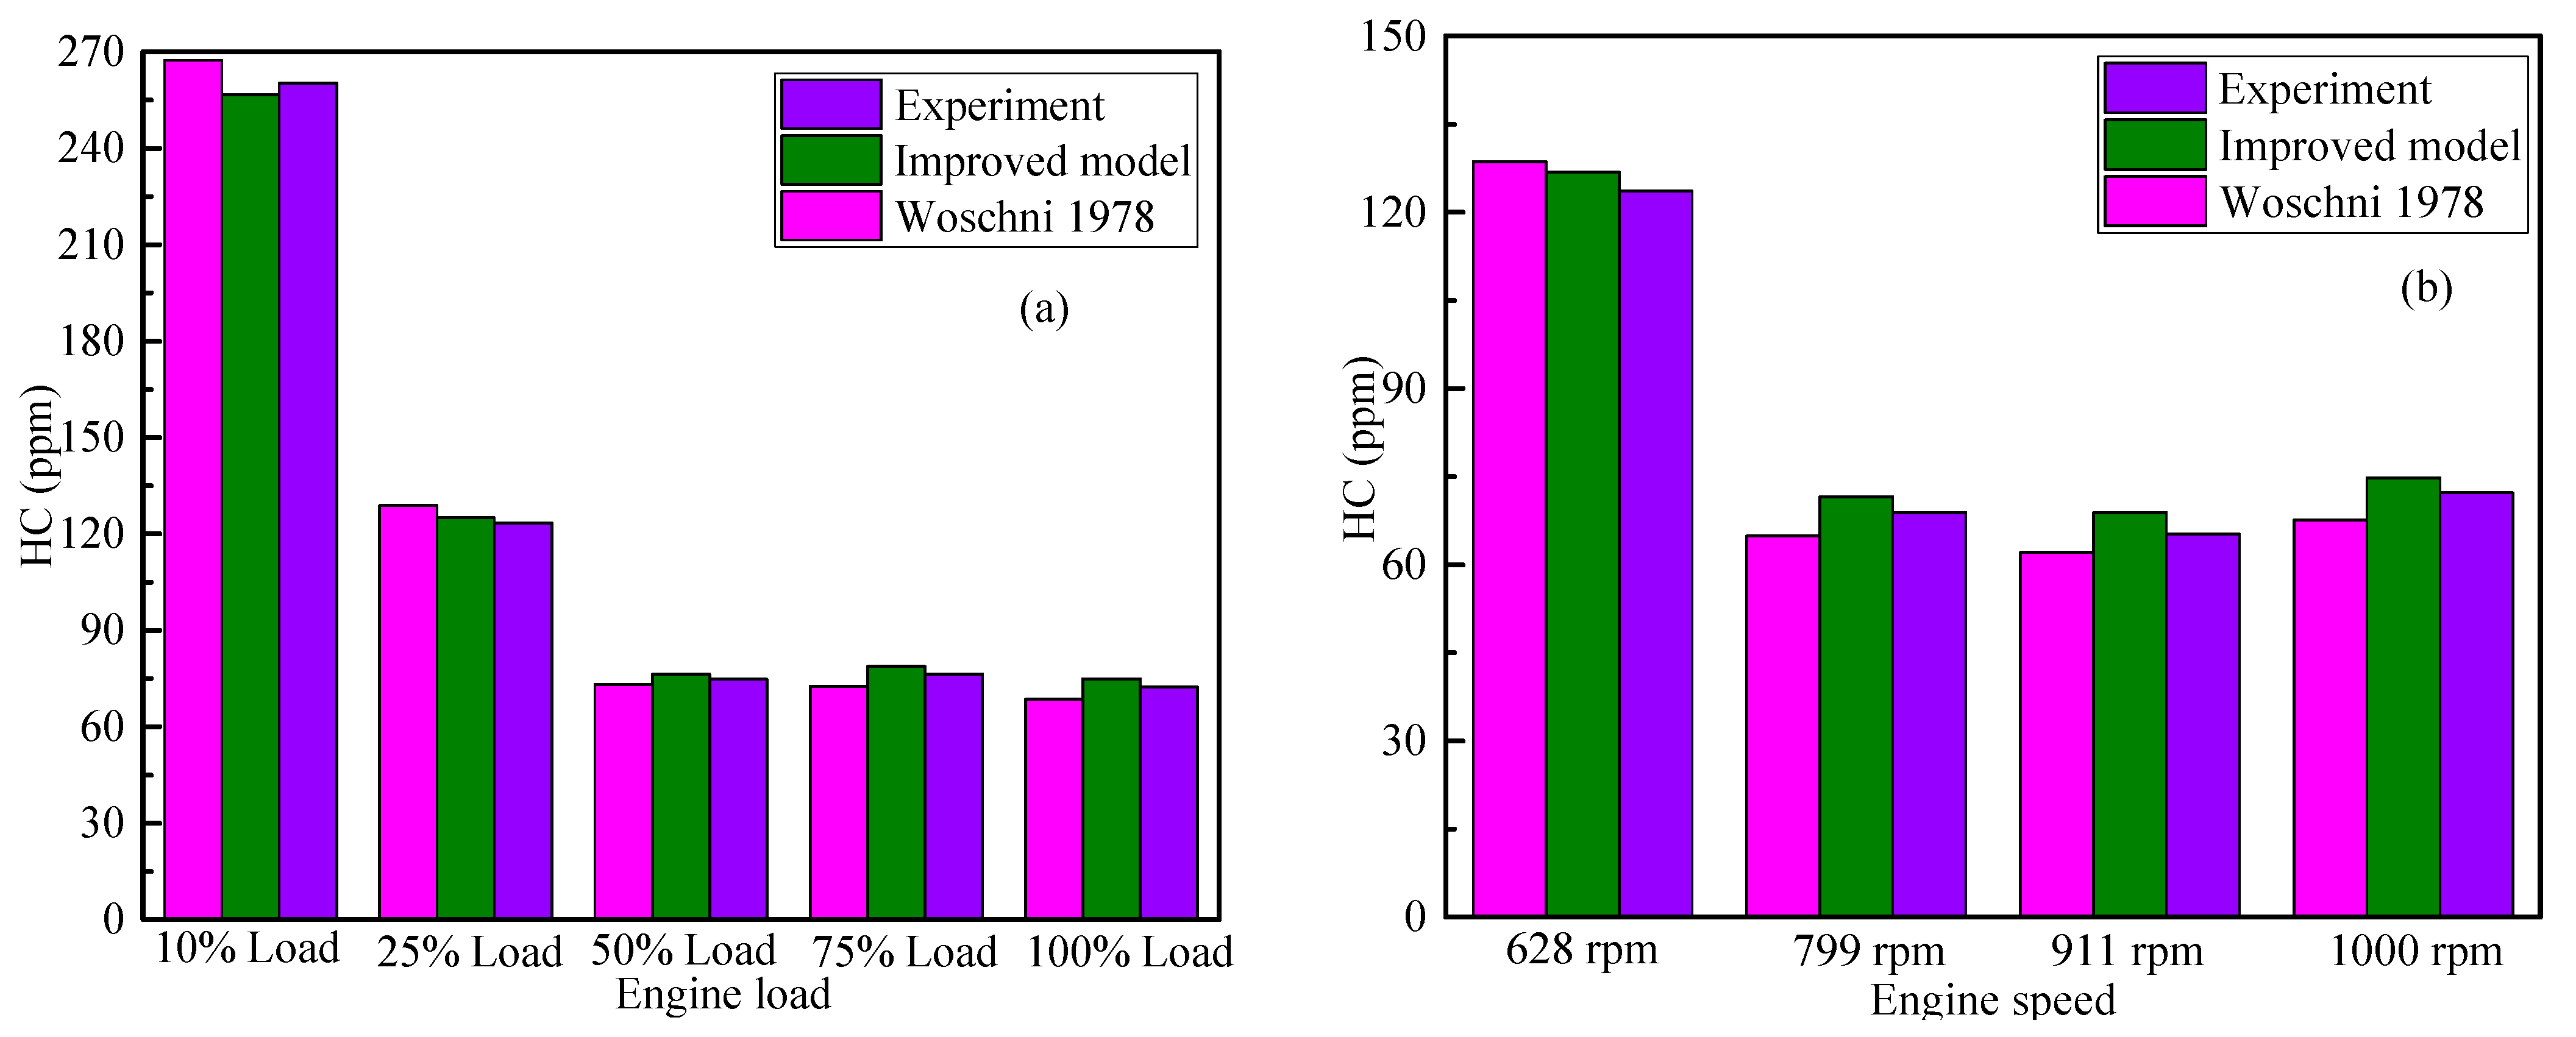
3.1.6. Hydrocarbon Emission
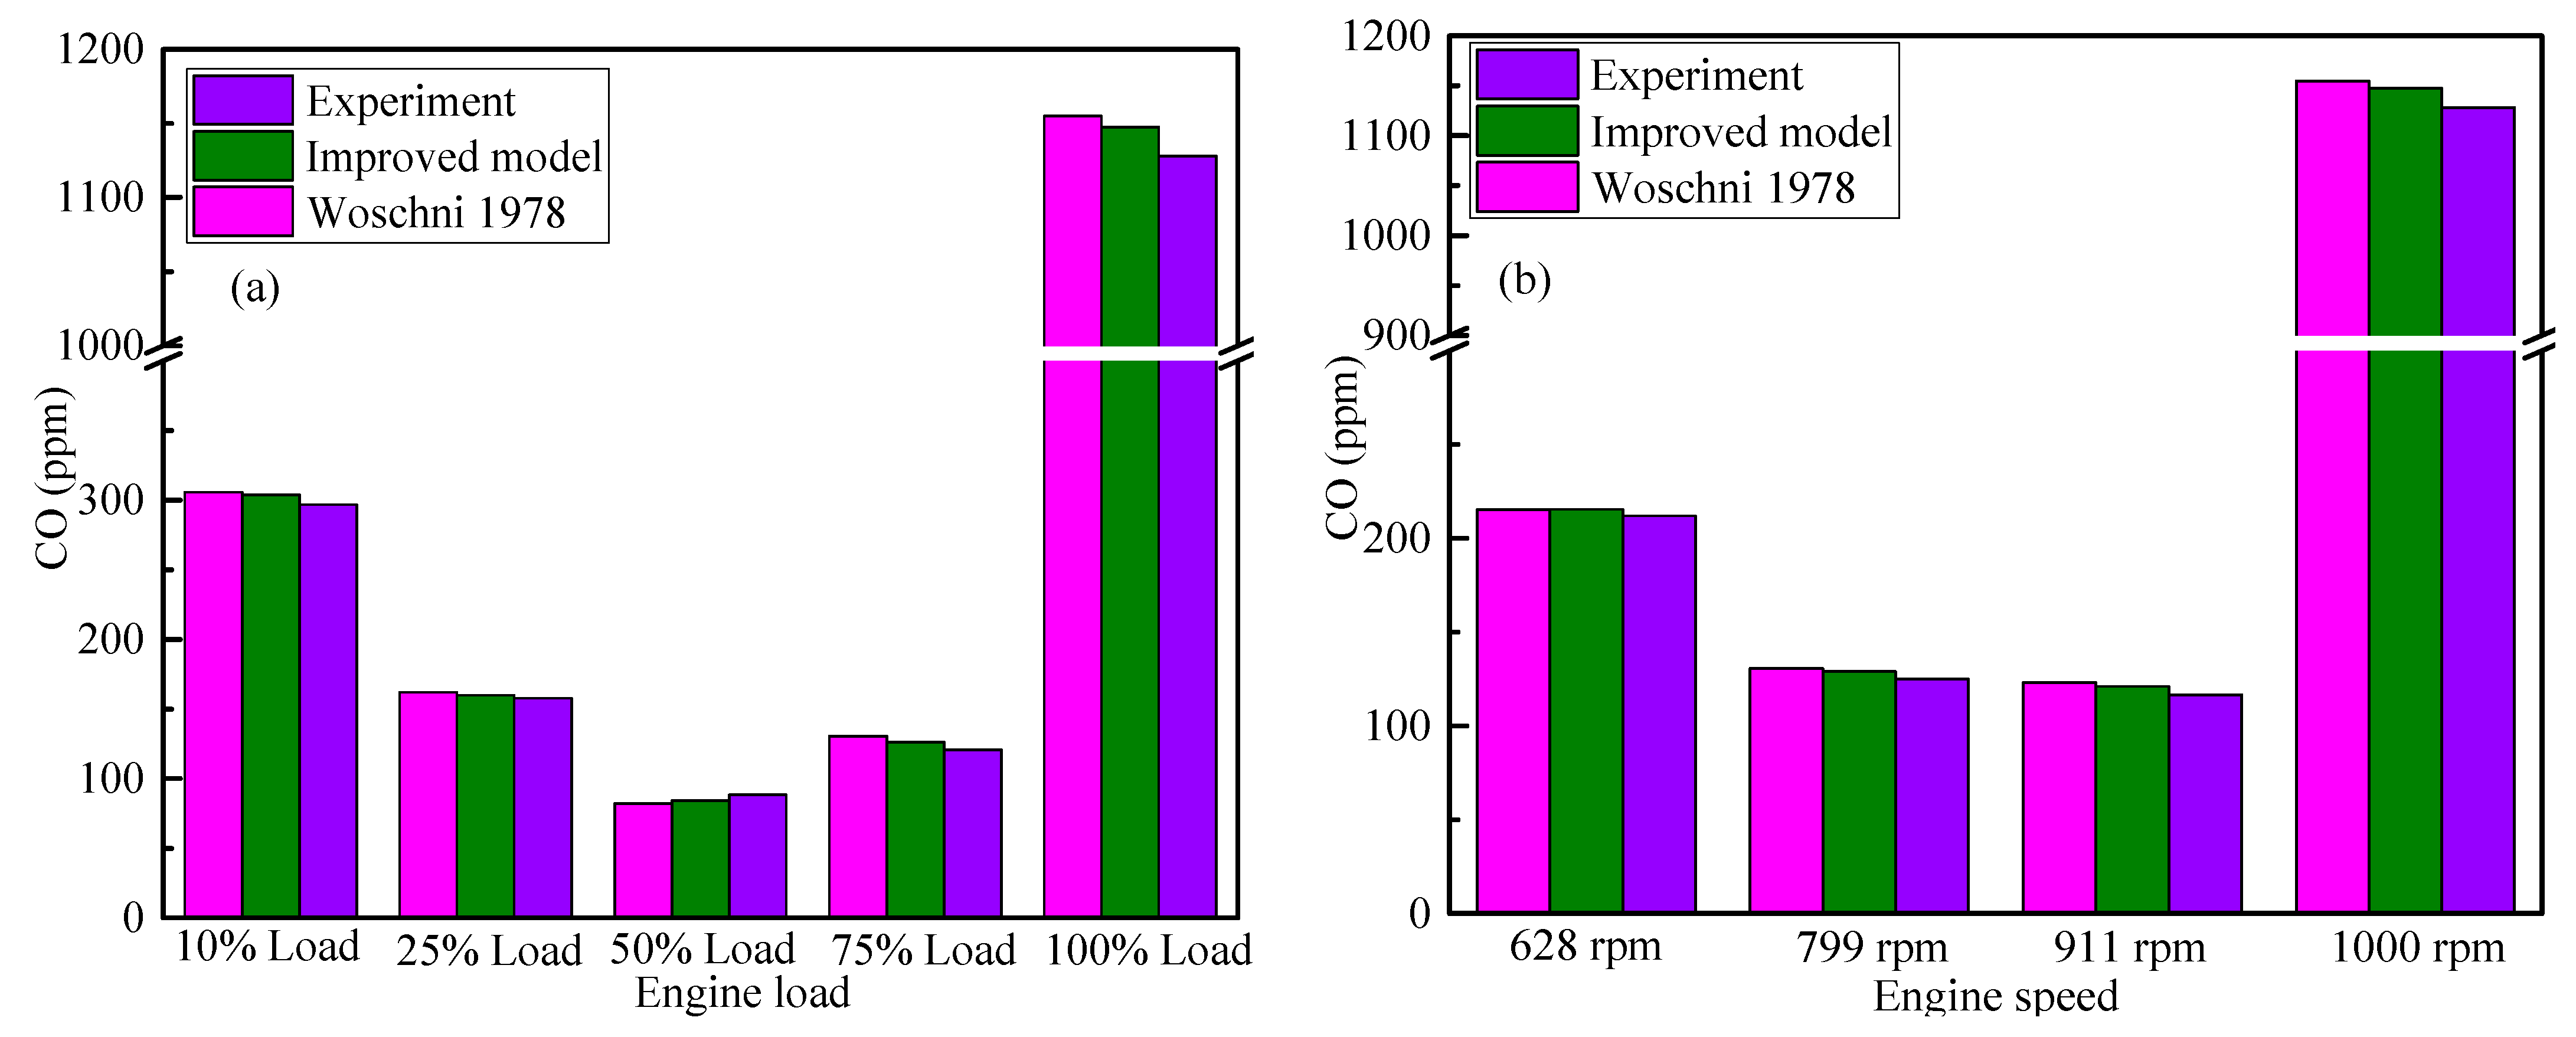
The hydrocarbon (HC) emission of diesel engines fueled with biodiesel under different conditions is shown in Figure 9. It can be found that the HC emission firstly decreases and then increase with the increase in engine speed (see Figure 9a) and engine load (see Figure 9b). At low load, the low cylinder temperature is not beneficial to the oxidation of HC. With the increase of load, more HC will be oxidized due to the increasing cylinder temperature. However, the HC formation would be dominated by the impact of bad atomization caused by the high viscosity, resulting in the increase of HC emission at low load. With the further increase of load, the atomization of the fuel is gradually improved. Thus, the HC emission is reduced. Nevertheless, at high load, the HC formation would be dominated by the impact of insufficient oxygen in the cylinder resulting in the increase of HC emission. The poor oxygen content is not favorable the HC oxidation. The improved model considering the swirl and boiling heat transfer in the cylinder agrees better with the experimental results compared with the model without considering the swirl and boiling heat transfer. More specifically, the max. errors predicted by the improved model is 3.2% and the max. errors predicted by the original model is 4.1%. Base on the analysis above, the improved model improves the calculation accuracy.

3.1.7. CO Emission

The CO is a toxic gas, and the fuel incomplete combustion will generate the CO. The oxygen content in biodiesel can promote the oxidation of CO to CO2. Thus, biodiesel can decrease harmful gas emissions. The comparisons of CO emission under different conditions are shown in Figure 10. It can be observed that with the increase in engine speed (see Figure 10a) and engine load (see Figure 10b), the CO emission firstly decreases and then increases. At low load, the low cylinder temperature is not beneficial to the oxidation of CO to CO2. With the increase in load, more CO will be oxidized due to the increasing cylinder temperature. Nevertheless, with the further increase in load, the CO formation would be dominated by the impact of insufficient oxygen in the cylinder resulting in an increase in CO emission. The improved model considering the swirl and boiling heat transfer in the cylinder agrees better with the experimental results compared with the model without considering the swirl and boiling heat transfer. More specifically, the max. errors predicted by the improved model is 3.1% and the max. errors predicted by the original model is 3.6%. Based on the analysis above, the influences of boiling heat transfer and swirl on diesel engines are very important.

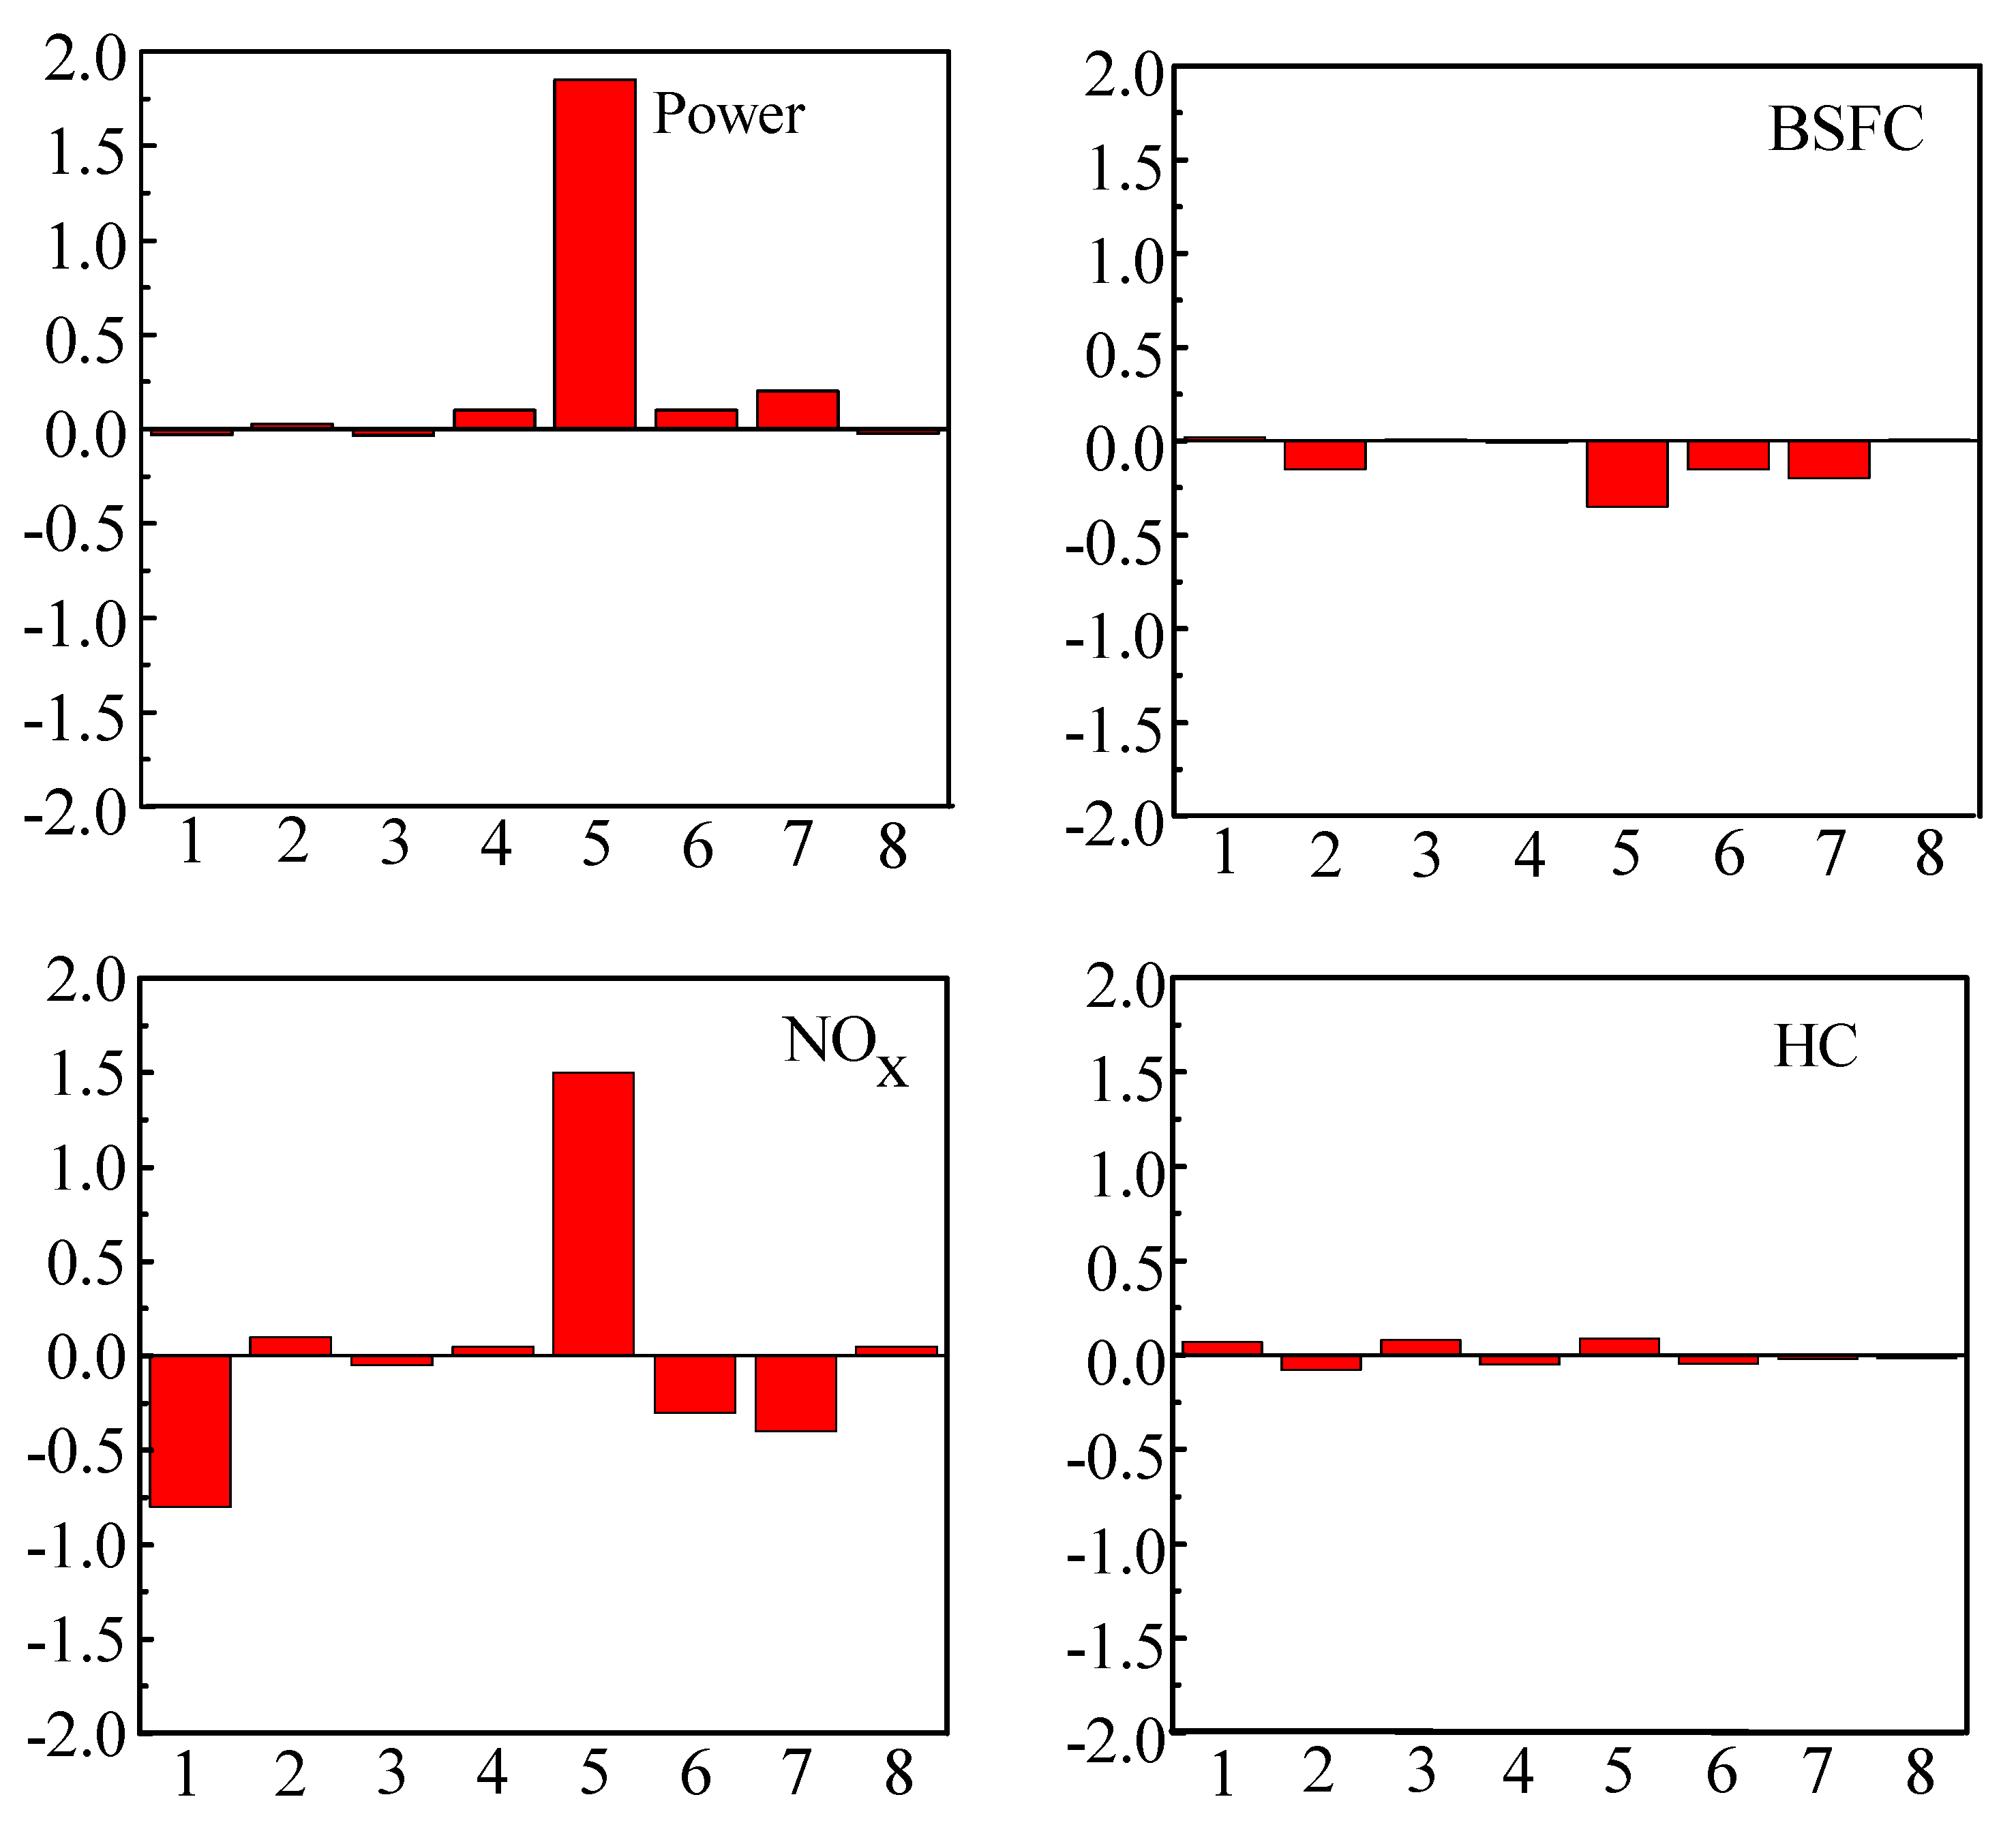
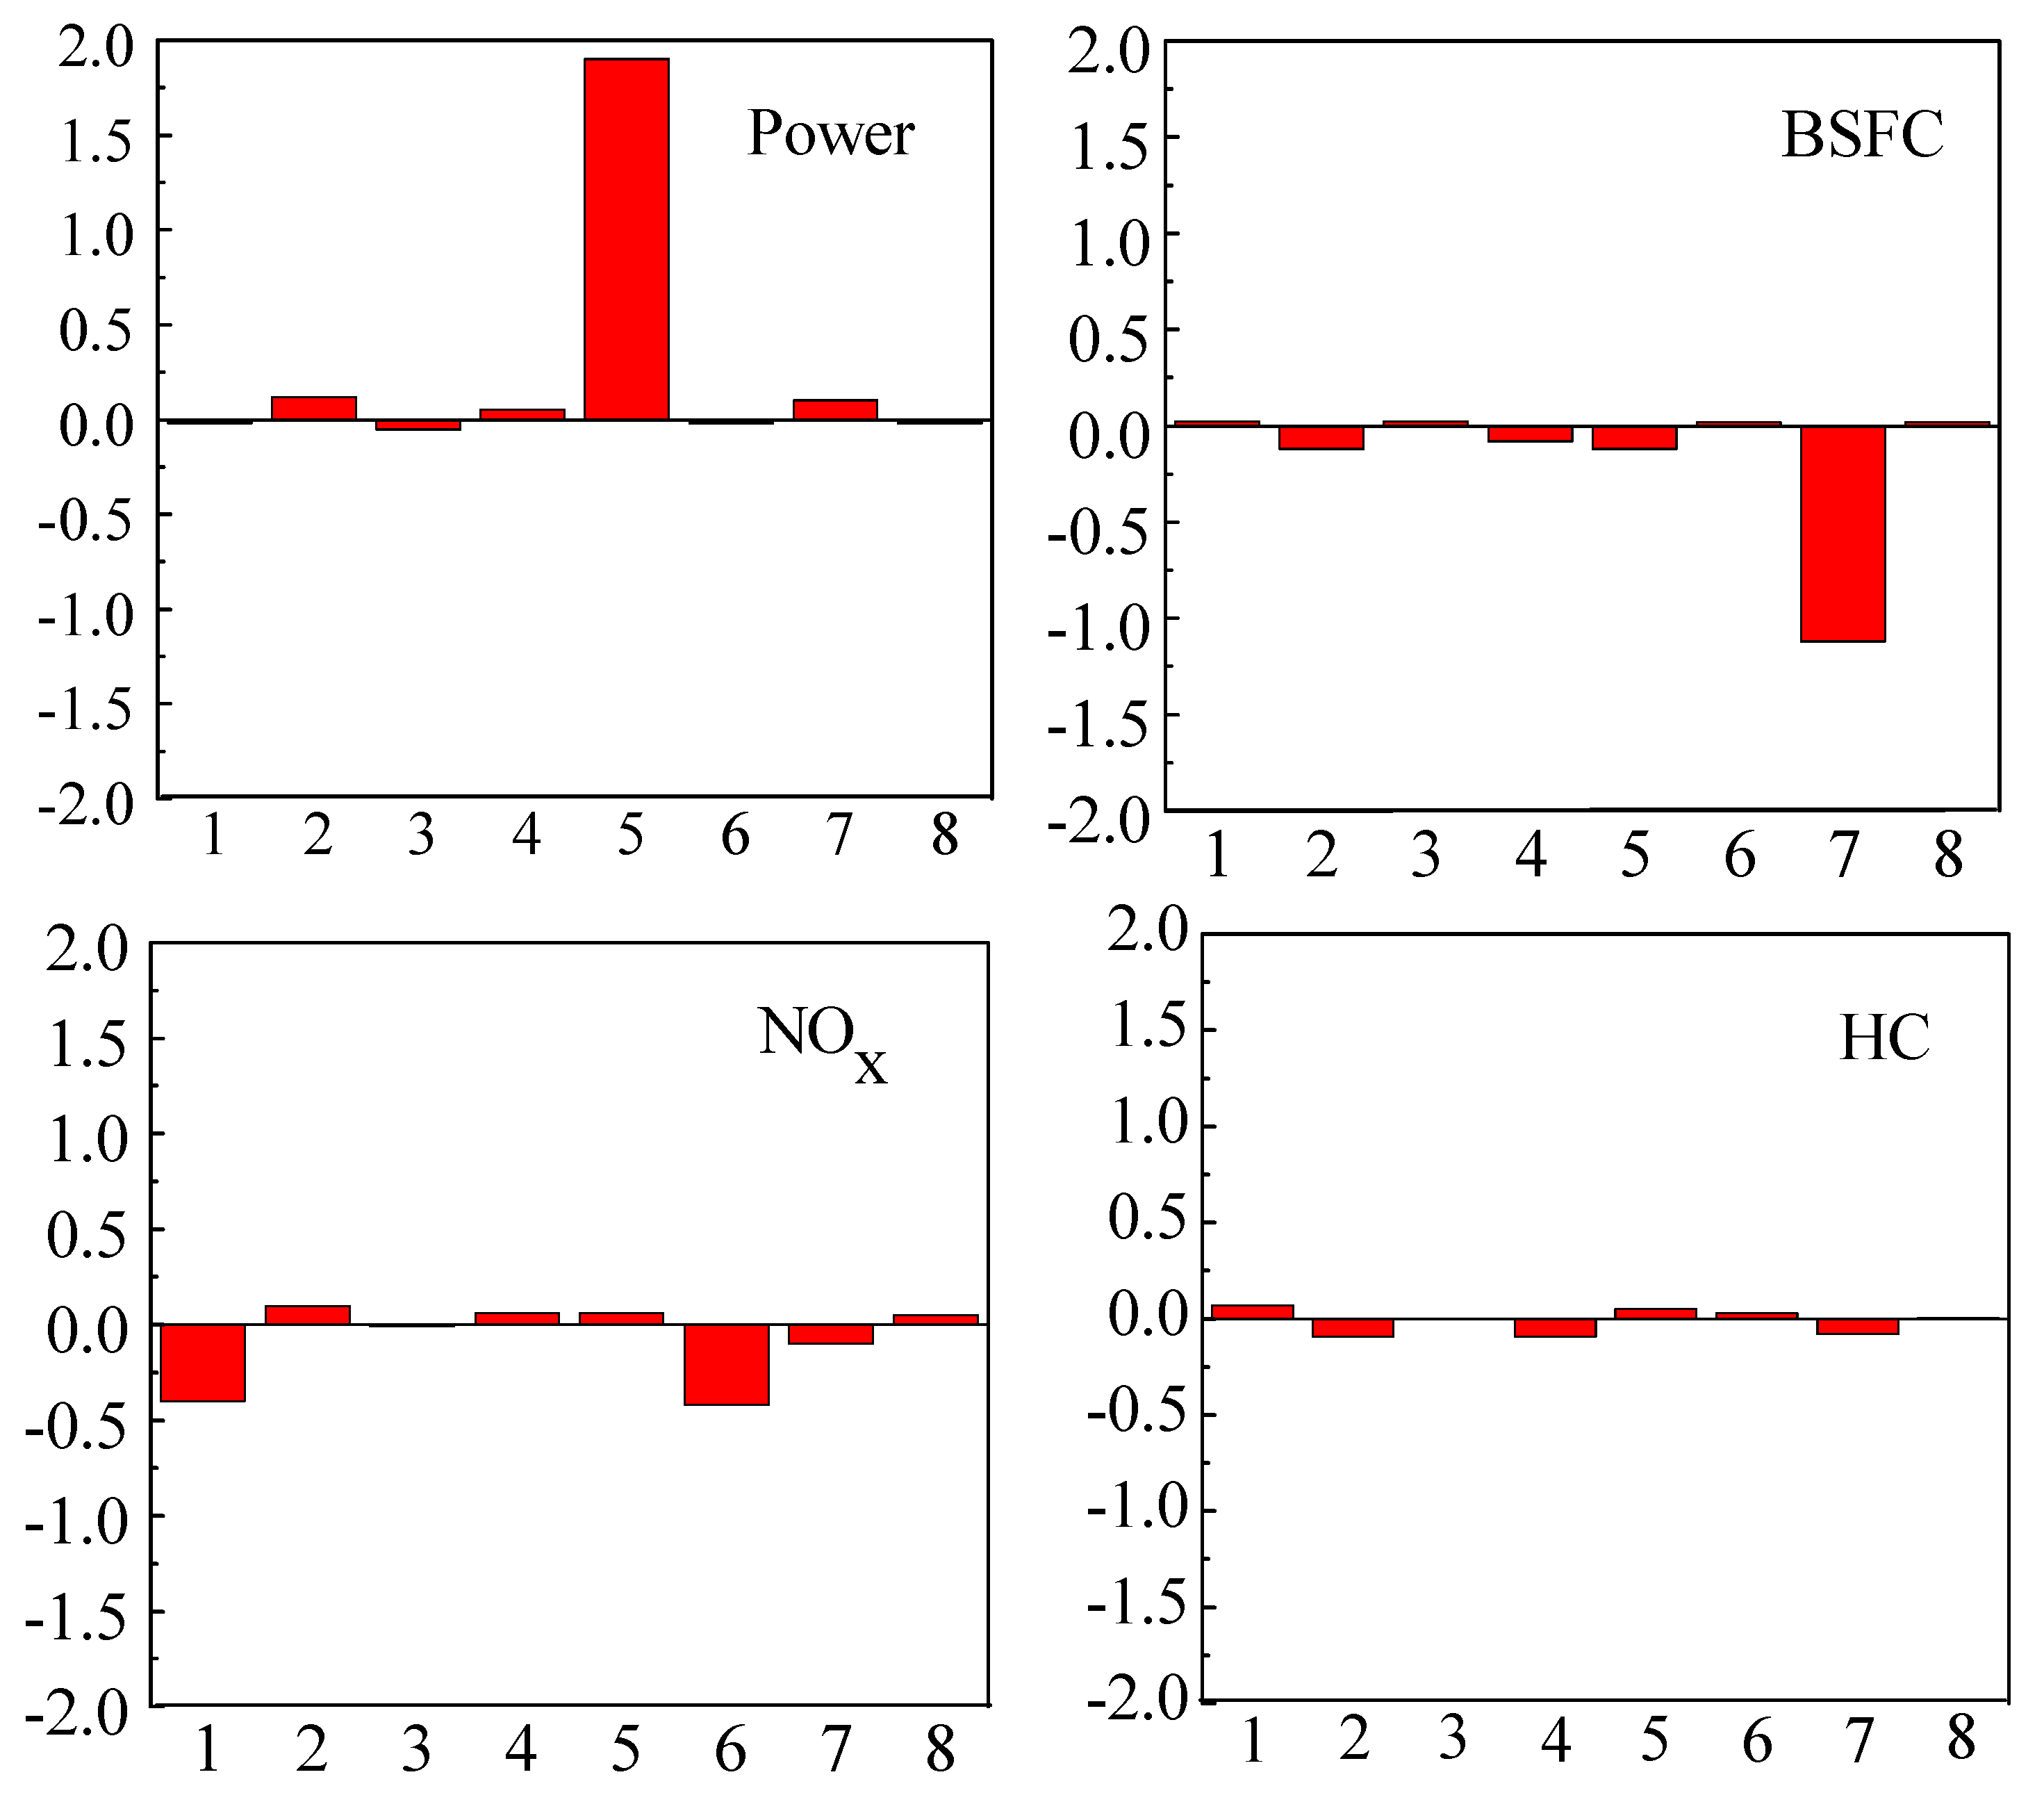
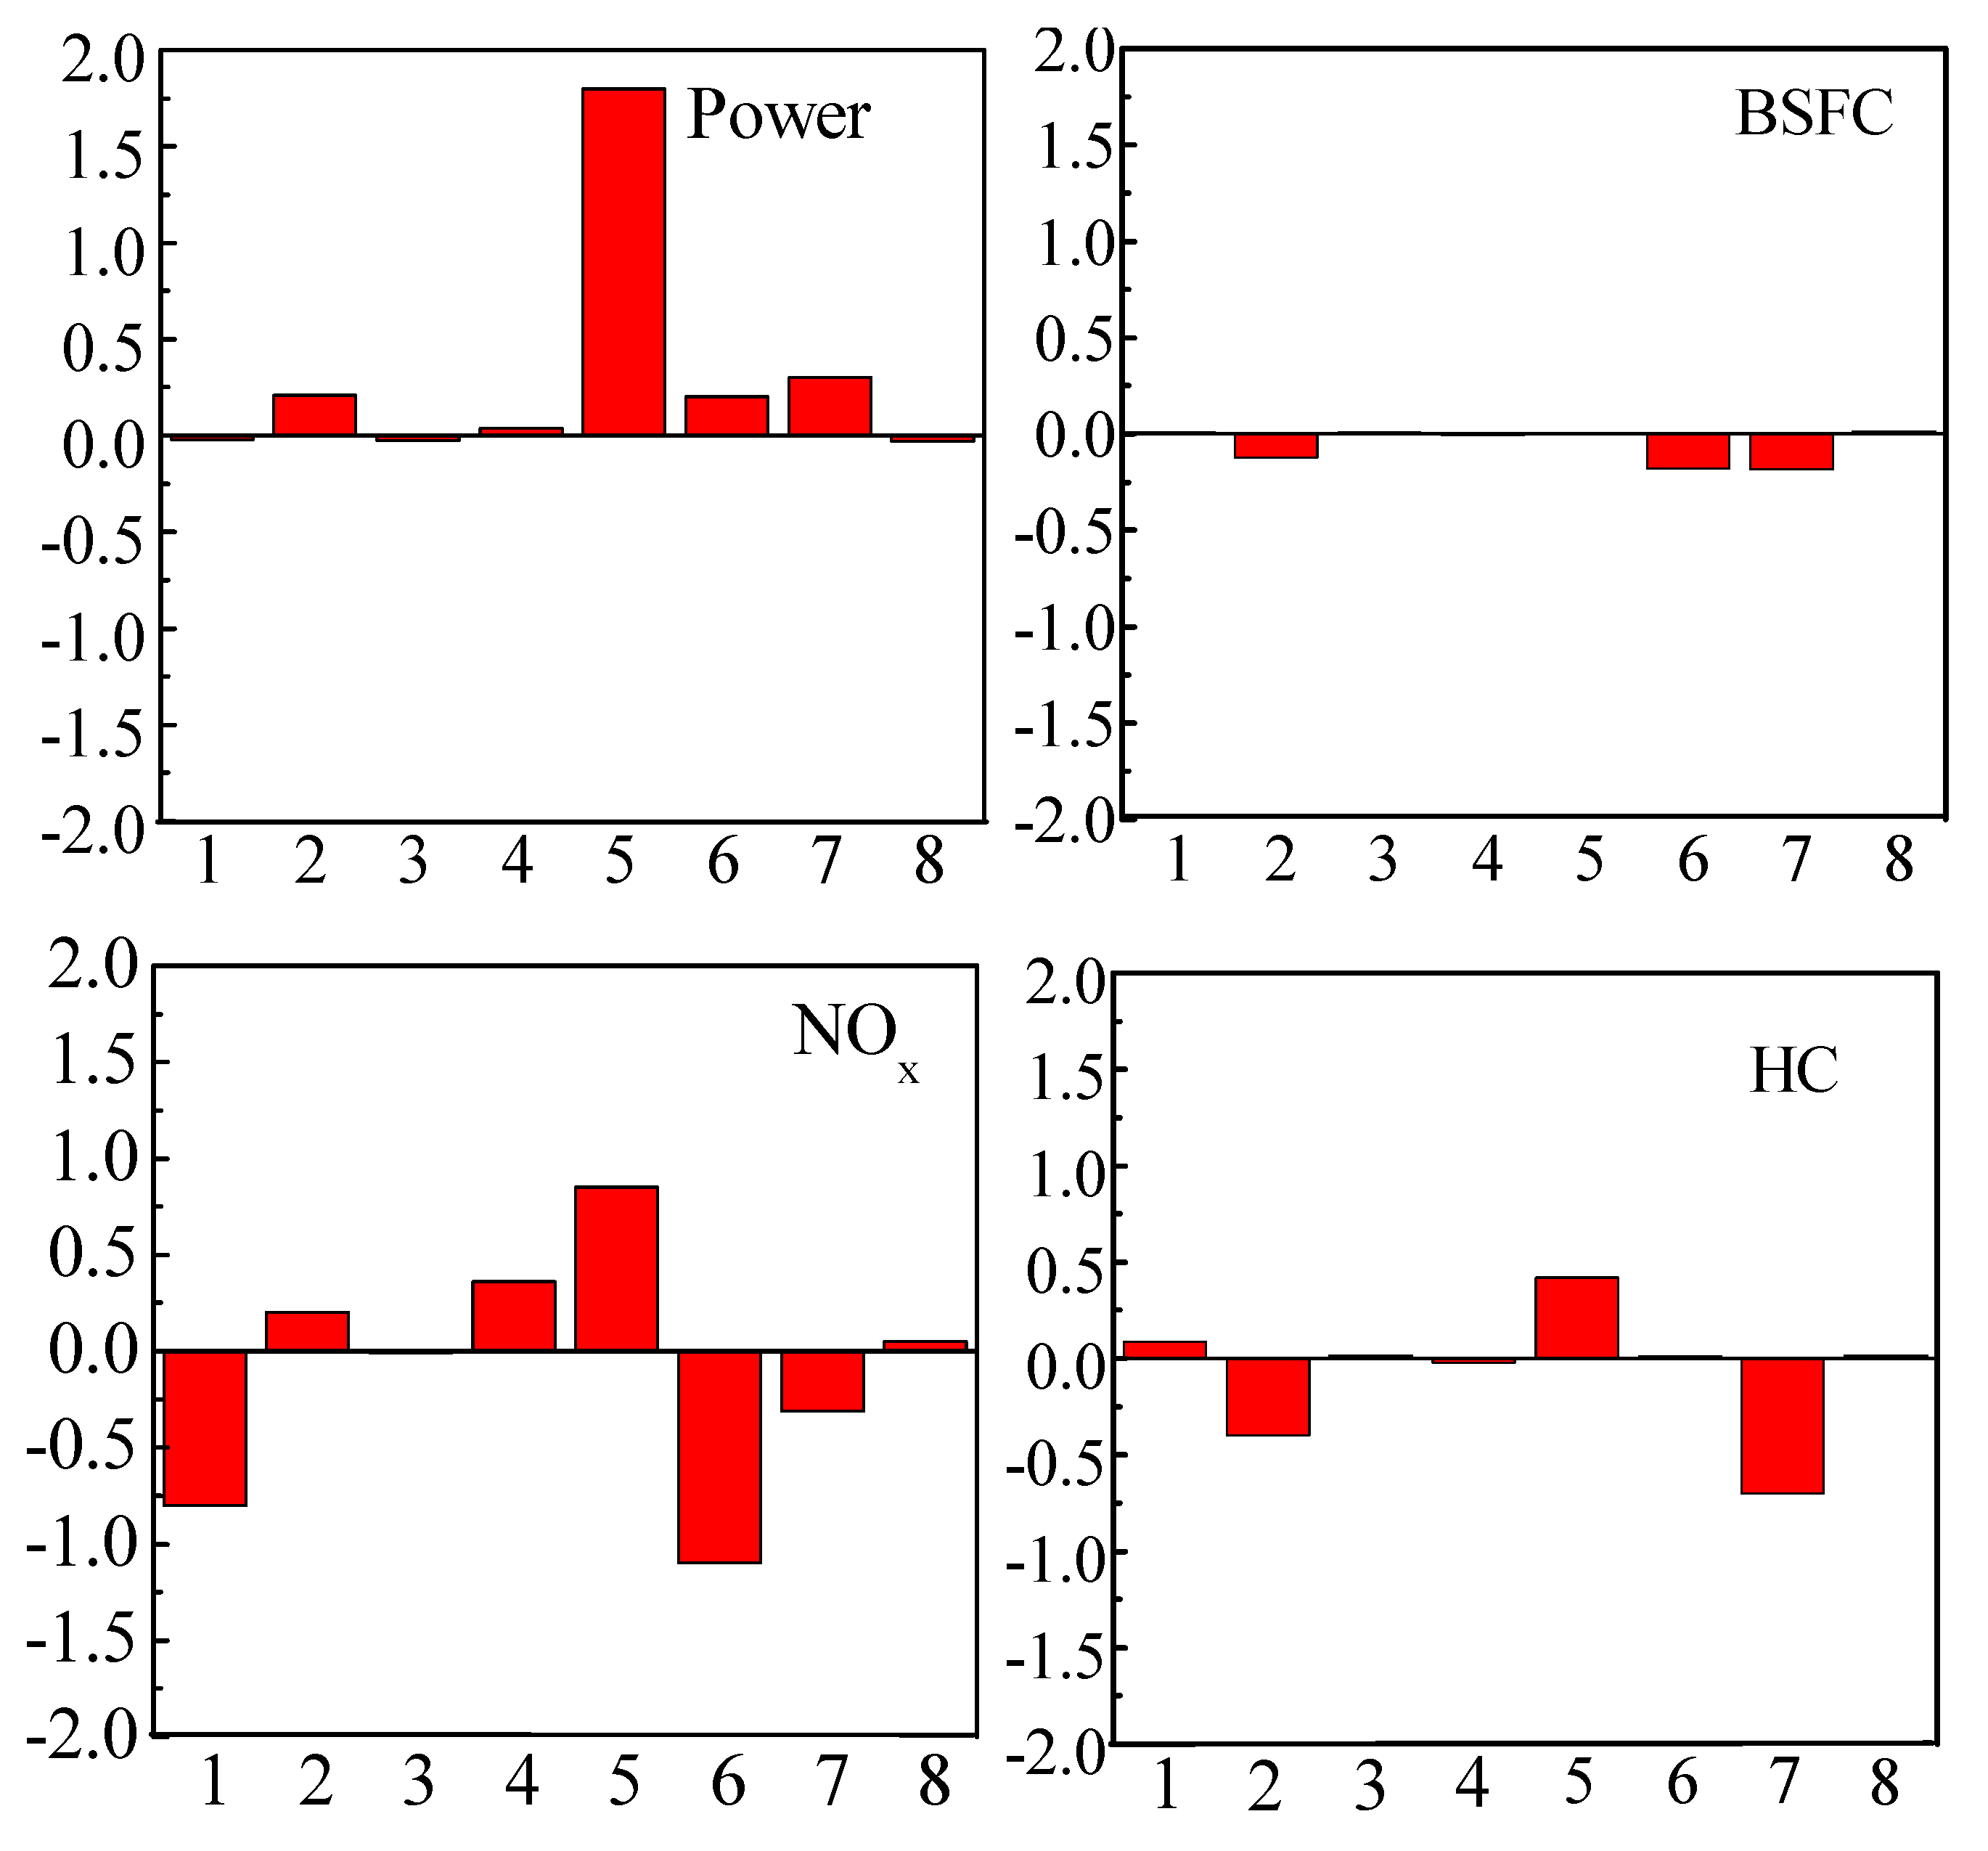
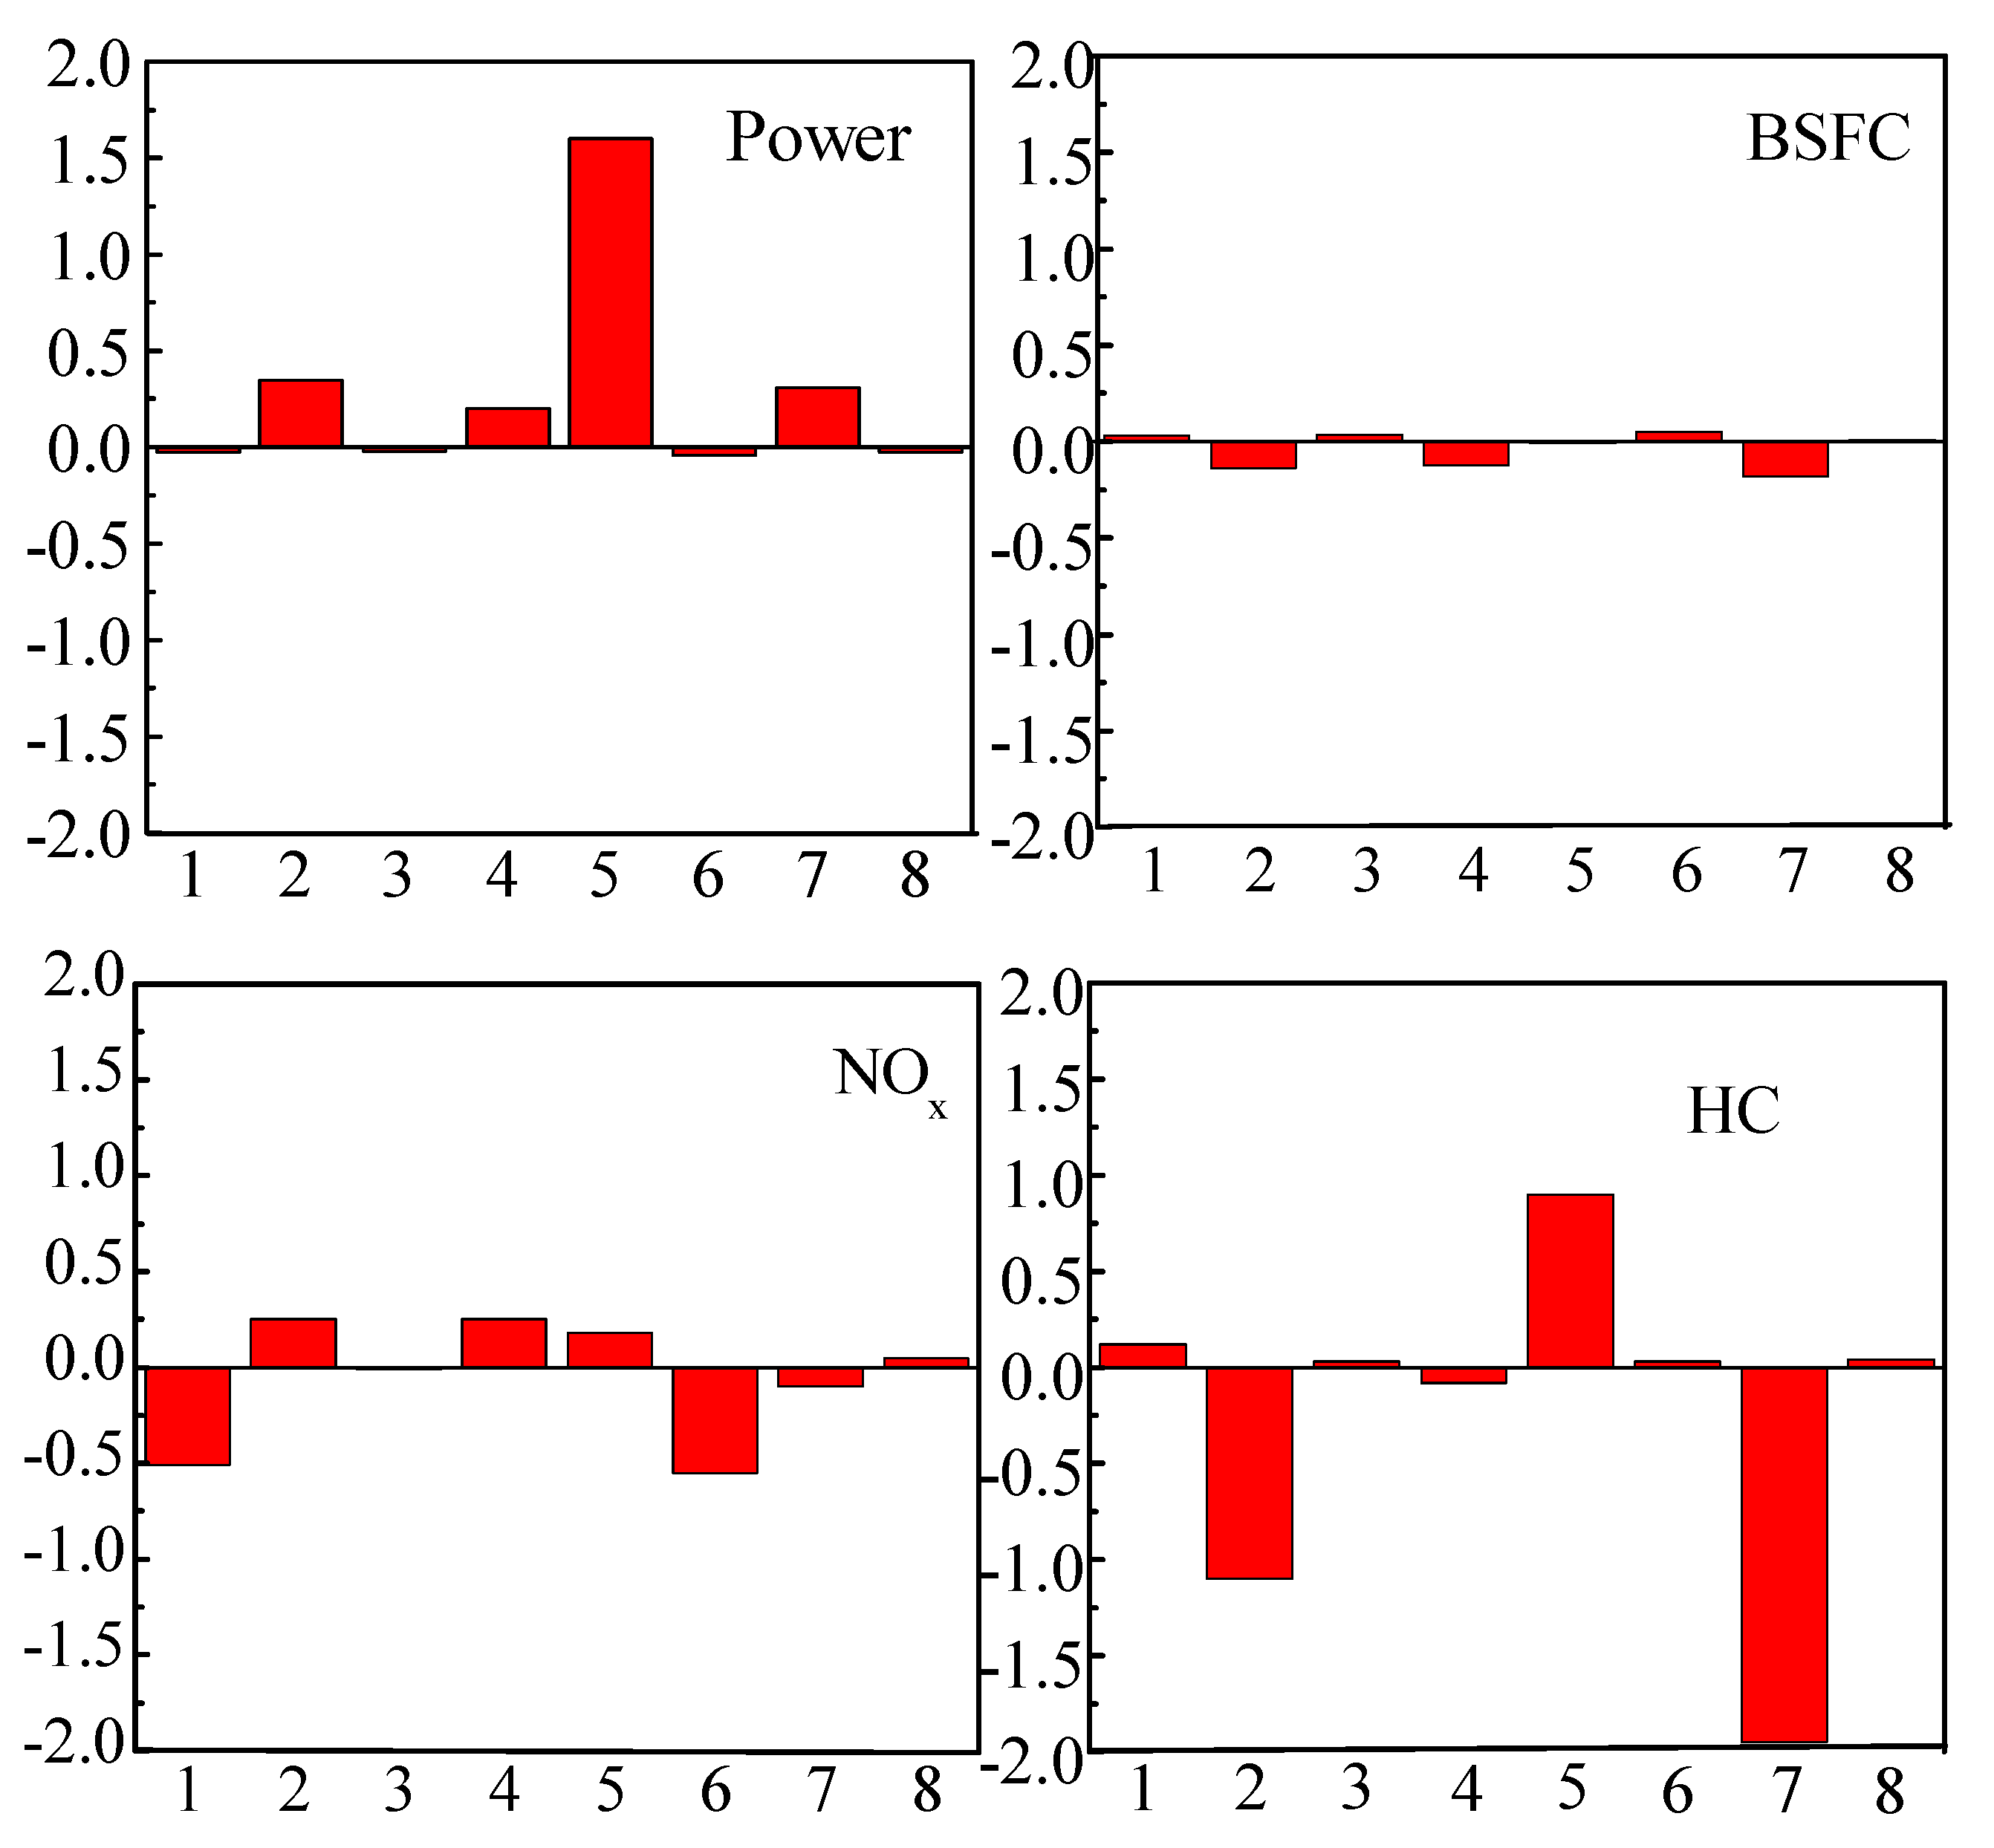
3.2. Input Parameter Analysis

The thermodynamic cycle of diesel engines is extremely complex. The influences of input parameters on the output of diesel engines are different. Thus, the perturbation method is very meaningful to investigate the relative contribution of every input on the performance and emission characteristics of diesel engines. In the study, an improved version of perturbation is developed. The relative effects of different parameters such as EGR, injection mass, injection timing, compression ratio, inlet air pressure, fuel injection pressure, fuel injection duration and inlet air temperature on performance and emission characteristics are compared.
The perturbation method is a better way to investigate the relatively important inputs as the complex nonlinear function with a lot of output data and input data. The required data are provided by using the AVL-BOOST model. Thus, 3600 operational points are generated by the improved model in the AVL-BOOST environment. The purpose is to find the relative important input factors on the different outputs of diesel engines. This formula with 8 pre-defined and 4 outputs factors was established.
Y 4 × 1 = f ( X 8 × 1 )
where Y4×1 and X8×1 are the vectors of output and input, respectively.
The upper and lower bounds for data generation are defined in Table 5. Based on the perturbation theory, the relative important input factors can be calculated by the following Equation(18):
s i j ¯ = f ¯ x × σ J ¯ σ l = k = 1 n f ( X , x j , k + σ k ) f ( X , x j , k ) σ k × σ j σ i n
where s i j ¯ is the average sensitivity factor of the jth output date relative to ith input data, σj and σi are the standard deviations, n is the divided equal intervals in the input span. A random point is selected in the defined rank. σk is the perturbation of kth interval and should be very small to keep in the respective interval.
The engine speed and equivalence ratio can be considered as the important factors affecting the engine characteristic. It is very interesting to investigate the parameter contributions on the output parameters under different conditions. The values of the y-axis in Figure 11, Figure 12, Figure 13 and Figure 14 show the relative contrition of each input on different output parameters. The relative contrition is the dimensionless quantity. The positive contribution shows the increase in the input parameter will cause an increase in the output performance index. On the contrary, the negative contribution shows that the increase in the input parameter will result in a reduction in the output performance index. Four output parameters are power, BSFC, NOx and HC. In Figure 11, Figure 12, Figure 13 and Figure 14, the numbers 1–8 represent EGR, Compression ratio, Exhaust pressure, Fuel injection pressure, Injection mass, Injection timing, Inlet air pressure and Inlet air temperature.
As can be seen in Figure 11, Figure 12, Figure 13 and Figure 14, the fuel injection mass per cycle has the most efficient contribution in almost all the output performances and is affected by injected fuel mass, more than others. Its effect improves in leaner mixtures. Additionally, inlet pressure is an effective parameter on brake power. However, the effects of inlet pressure increase on power increase are not comparable to injected fuel mass increase but its effect enhances in less lean regimes.
The BSFC is more than anything affected by inlet pressure. The increase in inlet pressure will improve the combustion and reduces the BSFC. This is due to its effects on pumping losses. Its effects are dominant in high engine speeds. Additionally, the increase in fuel mass can decrease BSFC in leaner mixtures due to its effects on power increase. In addition, the increases in compression ratio, injection pressure and injection timing will reduce the BSFC.
The NOx generation is influenced by the EGR rate more than other parameters while it will increase the soot generation, especially in less lean mixtures. Similarly, the EGR rate effects are more in lower engine speeds. The injection timing is the other parameter that can affect the NOx generation. Retarding the injection improves the NOx generation. In addition, the fuel injection mass per cycle will increase the NOx generation; also increasing the fuel injection pressure will increase the NOx generation especially in less lean operation conditions.
As it is expected, the increase in the fuel injection mass per cycle will increase the HC generation in whole engine operating conditions but low engine speed and very lean condition in which HC generation improves by increasing the fuel mass increasing. The increase in the EGR rate will increase the HC generation. Its effects are gained in very lean operation as a lower temperature is obtained in the cylinder and the rate of HC oxidization decreases. In addition, the increase in inlet pressure can also decrease the HC generation in less lean conditions. The increase in fuel injection pressure can decrease HC generation in high engine speeds. This is due to the fact that the high fuel injection pressure can decrease the duration of fuel injection and increase the maximum cylinder pressure.

4. Conclusions

Today the environmental pollution [43,44,45,46,47,48,49,50,51] and energy crisis [52,53,54,55,56,57,58] have to learn another new problem. The thermodynamic process of the diesel engine is a complicated process inside the cylinder. To evaluate the practicability of biodiesel, an improved heat transfer model is proposed and employed to investigate the combustion and emission characteristics of diesel engines. The improved heat transfer model mainly considers the influence of the swirl and boiling heat transfer inside the engine. In addition, a chemical kinetics mechanism including 475 reactions and 134 species is employed to predict the combustion. Finally, a perturbation method is employed to investigate the relatively important inputs as the complex nonlinear function with lots of output data and input data. The main conclusions are summarized as follows:
(1)
The results predicted by the improved model are more accurate than those predicted by the model without considering the swirl and boiling heat transfer. The max errors of BSFC, brake power, cylinder temperature, NOx emission, HC emission and CO emission predicted by the improved model are 2.3%, 1.7%,3.1%, 3.7%, 3.2 and 3.1%, but the maximum errors of the original model are 2.1%, 2.8%, 3.6%, 4.8%, 4.1% and 3.6% respectively compared with the experimental result.
(2)
The oxygen content of biodiesel is favorable for the oxidation of HC and the formation of NOx. However, the effect of HC formation would be dominated by the impact of bad atomization caused by the high viscosity, resulting in the increase in HC at low load.
(3)
The fuel injection mass plays an important role in emission and performance characteristics. In addition, the EGR, compression ratio and inlet air pressure have a great effect on the NOx emission. The increase in inlet pressure and compression ratio will decrease the BSFC. The inlet air pressure, compression ratio and fuel injection pressure can improve the fuel combustion and reduce the HC emission. In the case of the same operation input parameters, the contribution of operation input on the output is not independent, but the output is changed by changing other parameters. Therefore, it needs to be further improved in future work.

Author Contributions

D.T.: Conceptualization, methodology, resources, project administration, writing—original draft preparation; Z.C.: software, formal analysis, writing and editing; J.L. (Jiangtao Li): software, investigation; J.L. (Jianbin Luo): project administration, writing—review and editing; D.Y.: writing—review and editing; S.C.: writing—review and editing; Z.Z.: project administration, writing—review and editing, supervision. All authors have read and agreed to the published version of the manuscript.

Funding

This work is supported by the Natural Science Foundation of Fujian under the research grants of 2020J01690 and this work is supported by the cultivated Natural Science Foundation of Jimei University under the research grants of ZP2021008, the Science and Technology Project of Guangxi, China (GK AD19245149) and the Science and Technology Project of Liuzhou, China (2019DH10601).

Data Availability Statement

All data used to support the findings of this study are included within the article.

Conflicts of Interest

The authors declare no conflict of interest.

References

  1. E, J.; Zuo, W.; Gao, J.; Peng, Q.; Zhang, Z.; Hieu, P.M. Effect analysis on pressure drop of the continuous regeneration-diesel particulate filter based on NO2 assisted regeneration. Appl. Therm. Eng. 2016, 100, 356–366. [Google Scholar] [CrossRef]
  2. E, J.; Liu, G.; Zhang, Z.; Han, D.; Chen, J.; Wei, K.; Gong, J.; Yin, Z. Effect analysis on cold starting performance enhancement of a diesel engine fueled with biodiesel fuel based on an improved thermodynamic model. Appl. Energy 2019, 243, 321–335. [Google Scholar] [CrossRef]
  3. Cai, T.; Zhao, D.; Li, X.; Shi, B.; Li, J. Mitigating NO emissions from an ammonia-fueled micro-power system with a perforated plate implemented. J. Hazard. Mater. 2021, 401, 123848. [Google Scholar] [CrossRef]
  4. Wu, G.; Wu, D.; Li, Y.; Meng, L. Effect of Acetone-n-Butanol-Ethanol (ABE) as an Oxygenate on Combustion, Performance, and Emission Characteristics of a Spark Ignition Engine. J. Chem. 2020, 2020, 1–11. [Google Scholar] [CrossRef] [Green Version]
  5. Zhang, Z.; Ye, J.; Tan, D.; Feng, Z.; Luo, J.; Tan, Y.; Huang, Y. The effects of Fe2O3 based DOC and SCR catalyst on the combustion and emission characteristics of a diesel engine fueled with biodiesel. Fuel 2021, 290, 120039. [Google Scholar] [CrossRef]
  6. Cai, T.; Zhao, D. Effects of fuel composition and wall thermal conductivity on thermal and NOx emission performances of an ammonia/hydrogen-oxygen micro-power system. Fuel Process. Technol. 2020, 209, 106527. [Google Scholar] [CrossRef]
  7. Zhang, B.; Zuo, H.; Huang, Z.; Tan, J.; Zuo, Q. Endpoint forecast of different diesel-biodiesel soot filtration process in diesel particulate filters considering ash deposition. Fuel 2020, 272, 117678. [Google Scholar] [CrossRef]
  8. E, J.; Zhang, Z.; Chen, J.; Pham, M.; Zhao, X.; Peng, Q.; Zuo, W.; Yin, Z. Performance and emission evaluation of a marine diesel engine fueled by water biodiesel-diesel emulsion blends with a fuel additive of a cerium oxide nanoparticle. Energy Convers. Manag. 2018, 169, 194–205. [Google Scholar] [CrossRef]
  9. Zhang, Z.; Jiaqiang, E.; Deng, Y.; Pham, M.; Zuo, W.; Peng, Q.; Yin, Z. Effects of fatty acid methyl esters proportion on combustion and emission characteristics of a biodiesel fueled marine diesel engine. Energy Convers. Manag. 2018, 159, 244–253. [Google Scholar] [CrossRef]
  10. Zhang, Z.; E, J.; Chen, J.; Zhao, X.; Zhang, B.; Deng, Y.; Peng, Q.; Yin, Z. Effects of boiling heat transfer on the performance enhancement of a medium speed diesel engine fueled with diesel and rapeseed methyl ester. Appl. Therm. Eng. 2020, 169, 114984. [Google Scholar] [CrossRef]
  11. E, J.; Zhang, Z.; Tu, Z.; Zuo, W.; Hu, W.; Han, D.; Jin, Y. Effect analysis on flow and boiling heat transfer performance of cooling water-jacket of bearing in the gasoline engine turbocharger. Appl. Therm. Eng. 2018, 130, 754–766. [Google Scholar] [CrossRef]
  12. Nikzadfar, K.; Shamekhi, A.H. Investigating the relative contribution of operational parameters on performance and emissions of a common-rail diesel engine using neural network. Fuel 2014, 125, 116–128. [Google Scholar] [CrossRef]
  13. Labecki, L.; Ganippa, L.C. Effects of injection parameters and EGR on combustion and emission characteristics of rapeseed oil and its blends in diesel engines. Fuel 2012, 98, 15–28. [Google Scholar] [CrossRef]
  14. Rakopoulos, C.D.; Mavropoulos, G.C.; Hountalas, D.T. Measurements and analysis of load and speed effects on the instantaneous wall heat fluxes in a direct injection air-cooled diesel engine. Int. J. Energy Res. 2015, 24, 587–604. [Google Scholar] [CrossRef]
  15. Zhao, D.; Li, S.; Yang, W.; Zhang, Z. Numerical investigation of the effect of distributed heat sources on heat-to-sound conversion in a T-shaped thermoacoustic system. Appl. Energy 2015, 144, 204–213. [Google Scholar] [CrossRef]
  16. Li, J.; Yang, W.; An, H.; Zhao, D. Effects of fuel ratio and injection timing on gasoline/biodiesel fueled RCCI engine: A modeling study. Appl. Energy 2015, 155, 59–67. [Google Scholar] [CrossRef]
  17. Zhao, D.; Ji, C.; Li, X.; Li, S. Mitigation of premixed flame-sustained thermoacoustic oscillations using an electrical heater. Int. J. Heat Mass Transf. 2015, 86, 309–318. [Google Scholar] [CrossRef]
  18. Saxena, S.; Bedoya, I.D. Fundamental phenomena affecting low temperature combustion and HCCI engines, high load limits and strategies for extending these limits. Prog. Energy Combust. Sci. 2013, 39, 457–488. [Google Scholar] [CrossRef]
  19. Liu, T.; E, J.; Yang, W.; Hui, A.; Cai, H. Development of a skeletal mechanism for biodiesel blend surrogates with varying fatty acid methyl esters proportion. Appl. Energy 2016, 162, 278–288. [Google Scholar] [CrossRef]
  20. Gils RW, V.; Speetjens MF, M.; Zwart, H.J.; Hijmeijer, H. Output-based modal control of three-dimensional pool-boiling systems. Int. J. Therm. Sci. 2014, 82, 34–46. [Google Scholar] [CrossRef]
  21. Kang, M.G. Effects of the location of side inflow holes on pool boiling heat transfer in a vertical annulus. Int. J. Heat Mass Transf. 2008, 51, 1707–1712. [Google Scholar] [CrossRef]
  22. Das, S.; Saha, B.; Bhaumik, S. Experimental study of nucleate pool boiling heat transfer of water by surface functionalization with crystalline TiO 2 nanostructure. Appl. Therm. Eng. 2017, 113, 1345–1357. [Google Scholar] [CrossRef]
  23. Marelli, S.; Marmorato, G.; Capobianco, M. Evaluation of heat transfer effects in small turbochargers by theoretical model and its experimental validation. Energy 2016, 112, 264–272. [Google Scholar] [CrossRef]
  24. Mohammadi, A.; Hashemi, H.; Jazayeri, A.; Ahmadi, M. Two Phase Flow Simulation for Film Boiling Heat Transfer Calculation in Water-jacket of Diesel Engine. In Proceedings of the Seventh International Conference on Internal Combustion Engines, Tehran, Iran, 24–29 July 2011; pp. 1721–1729. [Google Scholar]
  25. Kang, M.G. Effects of pool subcooling on boiling heat transfer in a vertical annulus with closed bottom. Int. J. Heat Mass Transf. 2005, 48, 255–263. [Google Scholar] [CrossRef]
  26. Payri, F.; Olmeda, P.; Arnau, F.J.; Dombrovsky, A.; Smith, L. External heat losses in small turbochargers: Model and experiments. Energy 2014, 71, 534–546. [Google Scholar] [CrossRef]
  27. Zhang, Z.; E, J.; Chen, J.; Zhu, H.; Zhao, X.; Han, D.; Zuo, W.; Peng, Q.; Gong, J.; Yin, Z. Effects of low-level water addition on spray, combustion and emission characteristics of a medium speed diesel engine fueled with biodiesel fuel. Fuel 2019, 239, 245–262. [Google Scholar] [CrossRef]
  28. Ong, H.C.; Masjuki, H.; Mahlia, T.; Silitonga, A.; Chong, W.; Leong, K. Optimization of biodiesel production and engine performance from high free fatty acid Calophyllum inophyllum oil in CI diesel engine. Energy Convers. Manag. 2014, 81, 30–40. [Google Scholar] [CrossRef]
  29. An, H.; Yang, W.; Li, J. Numerical modeling on a diesel engine fueled by biodiesel–methanol blends. Energy Convers. Manag. 2015, 93, 100–108. [Google Scholar] [CrossRef]
  30. Zuo, Q.; Xie, Y.; E, J.; Zhu, X.; Zhang, B.; Tang, Y.; Zhu, G.; Wang, Z.; Zhang, J. Effect of different exhaust parameters on NO conversion efficiency enhancement of a dual-carrier catalytic converter in the gasoline engine. Energy 2020, 191, 116521. [Google Scholar] [CrossRef]
  31. Giakoumis, E.G.; Rakopoulos, D.C.; Rakopoulos, C.D. Combustion noise radiation during dynamic diesel engine operation including effects of various biofuel blends: A review. Renew. Sustain. Energy Rev. 2016, 54, 1099–1113. [Google Scholar] [CrossRef]
  32. Ozsezen, A.N.; Canakci, M.; Turkcan, A.; Sayin, C. Performance and combustion characteristics of a DI diesel engine fueled with waste palm oil and canola oil methyl esters. Fuel 2009, 88, 629–636. [Google Scholar] [CrossRef]
  33. Catania, A.E.; Finesso, R.; Spessa, E. Predictive zero-dimensional combustion model for DI diesel engine feed-forward control. Energy Convers. Manag. 2011, 52, 3159–3175. [Google Scholar] [CrossRef]
  34. Yang, Y.; Dec, J.E.; Dronniou, N.; Sjöberg, M. Tailoring HCCI heat-release rates with partial fuel stratification: Comparison of two-stage and single-stage-ignition fuels. Proc. Combust. Inst. 2011, 33, 3047–3055. [Google Scholar] [CrossRef]
  35. Watson, N.; Janota, M.S. Turbocharging the Internal Combustion Engine; Springer: Berlin/Heidelberg, Germany, 1982. [Google Scholar]
  36. Baldi, F.; Theotokatos, G.; Andersson, K. Development of a combined mean value–zero dimensional model and application for a large marine four-stroke Diesel engine simulation. Appl. Energy 2015, 154, 402–415. [Google Scholar] [CrossRef] [Green Version]
  37. Yu, W.; Zhang, Z.; Liu, B. Effect Analysis on the Performance Enhancement and Emission Reduction of Diesel Engine Fueled with Biodiesel Fuel Based on an Improved Model. Int. J. Aerosp. Eng. 2020, 2020, 1–14. [Google Scholar] [CrossRef]
  38. Lino, P.; Maione, B.; Rizzo, A. Nonlinear modelling and control of a common rail injection system for diesel engines. Appl. Math. Model. 2007, 31, 1770–1784. [Google Scholar] [CrossRef]
  39. Yu, W.; Zhang, Z.; Liu, B. Investigation on the Performance Enhancement and Emission Reduction of a Biodiesel Fueled Diesel Engine Based on an Improved Entire Diesel Engine Simulation Model. Processes 2021, 9, 104. [Google Scholar] [CrossRef]
  40. Incropera, F.P.; Dewitt, D.P. Introduction to Heat Transfer, 3rd ed.; John Wiley & Sons: New York, NY, USA, 1996; pp. 506–508. [Google Scholar]
  41. AVL Company. AVL BOOST User Guide Version 5.1; AVL Company: Graz, Austria, 2008. [Google Scholar]
  42. Lapuerta, M.; Armas, O.; Molina, S. Study of the compression cycle of a reciprocating engine through the polytropic coefficient. Appl. Therm. Eng. 2003, 23, 313–323. [Google Scholar] [CrossRef]
  43. Han, D.; E, J.; Deng, Y.; Chen, J.; Leng, E.; Liao, G.; Zhao, X.; Feng, C.; Zhang, F. A review of studies using hydrocarbon adsorption material for reducing hydrocarbon emissions from cold start of gasoline engine. Renew. Sustain. Energy Rev. 2021, 135, 110079. [Google Scholar] [CrossRef]
  44. Chu, H.; Ya, Y.; Nie, X.; Qiao, F. Effects of adding cyclohexane, n-hexane, ethanol, and 2,5-dimethylfuran to fuel on soot formation in laminar coflow n-heptane/iso-octane diffusion flame. Combust. Flame 2021, 225, 120–135. [Google Scholar] [CrossRef]
  45. Zhao, X.; E, J.; Liao, G.; Zhang, F.; Chen, J.; Deng, Y. Numerical simulation study on soot continuous regeneration combustion model of diesel particulate filter under exhaust gas heavy load. Fuel 2021, 287, 119795. [Google Scholar] [CrossRef]
  46. E, J.; Zhao, M.; Zuo, Q.; Zhang, B.; Zhang, Z.; Peng, Q.; Han, D.; Zhao, X.; Deng, Y. Effects analysis on diesel soot continuous regeneration performance of a rotary microwave-assisted regeneration diesel particulate filter. Fuel 2020, 260, 116353. [Google Scholar] [CrossRef]
  47. Zhang, B.; E, J.; Gong, J.; Yuan, W.; Zuo, W.; Li, Y.; Fu, J. Multidisciplinary design optimization of the diesel particulate filter in the composite regeneration process. Appl. Energy 2016, 181, 14–28. [Google Scholar]
  48. E, J.; Zhao, X.; Liu, G.; Zhang, B.; Zuo, Q.; Wei, K.; Li, H.; Han, D.; Gong, J. Effects analysis on optimal microwave energy consumption in the heating process of composite regeneration for the diesel particulate filter. Appl. Energy 2019, 254, 113736. [Google Scholar] [CrossRef]
  49. Xie, Y.; Zuo, Q.; Wang, M.; Wei, K.; Zhang, B.; Chen, W.; Tang, Y.; Wang, Z.; Zhu, G. Effects analysis on soot combustion performance enhancement of an improved catalytic gasoline particulate filter regeneration system with electric heating. Fuel 2021, 290, 119975. [Google Scholar] [CrossRef]
  50. Xie, Y.; Zuo, Q.; Zhu, G.; Guan, Q.; Wei, K.; Zhang, B.; Tang, Y.; Shen, Z. Investigations on the soot combustion performance enhancement of an improved catalytic gasoline particulate filter regeneration system under different electric heating powers. Fuel 2021, 283, 119301. [Google Scholar] [CrossRef]
  51. E, J.; Pham, M.; Zhao, D.; Deng, Y.; Le, D.H.; Zuo, W.; Zhu, H.; Liu, T.; Peng, Q.; Zhang, Z. Effect of different technologies on combustion and emissions of the diesel engine fueled with biodiesel: A review. Renew. Sustain. Energy Rev. 2017, 80, 620–647. [Google Scholar] [CrossRef]
  52. Wei, K.; Yang, Y.; Hong, Y.; Zhong, D. A review on ice detection technology and ice elimination technology for wind turbine. Wind Energy 2019, 23, 433–457. [Google Scholar] [CrossRef]
  53. Zuo, H.; Liu, G.; E, J.; Zuo, W.; Wei, K.; Hu, W.; Tan, J.; Zhong, D. Catastrophic analysis on the stability of a large dish solar thermal power generation system with wind-induced vibration. Sol. Energy 2019, 183, 40–49. [Google Scholar] [CrossRef]
  54. Zhang, F.; Liao, G.; E, J.; Chen, J.; Leng, E. Comparative study on the thermodynamic and economic performance of novel absorption power cycles driven by the waste heat from a supercritical CO2 cycle. Energy Convers. Manag. 2021, 228, 113671. [Google Scholar] [CrossRef]
  55. Peng, Q.; Yang, W.; E, J.; Li, Z.; Xu, H.; Fu, G.; Li, S. Investigation on H2/air combustion with C3H8 addition in the combustor with part/full porous medium. Energy Convers. Manag. 2020, 228, 113652. [Google Scholar] [CrossRef]
  56. Zuo, H.; Tan, J.; Wei, K.; Huang, Z.; Zhong, D.; Xie, F. Effects of different poses and wind speeds on wind-induced vibration characteristics of a dish solar concentrator system. Renew. Energy 2021, 168, 1308–1326. [Google Scholar] [CrossRef]
  57. Zuo, W.; E, J.; Lin, R. Numerical investigations on an improved counterflow double-channel micro combustor fueled with fueled with hydrogen for enhancing thermal performance. Energy Convers. Manag. 2018, 159, 163–174. [Google Scholar] [CrossRef]
  58. Peng, Q.; Yang, W.; E, J.; Li, S.; Li, Z.; Xu, H.; Fu, G. Effects of propane addition and burner scale on the combustion characteristics and working performance. Appl. Energy 2021, 285, 116484. [Google Scholar] [CrossRef]
Figure 1. Simulation model of the entire diesel engine.
Processes 09 00568 g001
Figure 2. Schematics of experimental device.
Processes 09 00568 g002
Figure 3. Comparison of cylinder pressure at 1000 rpm under different load conditions.
Processes 09 00568 g003
Figure 4. Comparison of BSFC under different load conditions.
Processes 09 00568 g004
Figure 5. Comparison of brake thermal efficiency (BTE) under different load conditions.
Processes 09 00568 g005
Figure 6. Comparisons of brake power under different load conditions.
Processes 09 00568 g006
Figure 7. Comparison of cylinder temperature under different load conditions.
Processes 09 00568 g007aProcesses 09 00568 g007b
Figure 8. Comparisons of NOx emission under different load conditions.
Processes 09 00568 g008
Figure 9. Comparisons of HC emission under different load conditions.
Processes 09 00568 g009
Figure 10. Comparisons of CO emission under different load conditions.
Processes 09 00568 g010
Figure 11. Comparisons of relative contribution on the engine characteristic in low speed (628 rpm) and in lean operation zone (Equivalence ratio Φ = 0.25).
Processes 09 00568 g011
Figure 12. Comparisons of relative contribution on the engine characteristic in high speed (1000 rpm) and in lean operation zone (Equivalence ratio Φ = 0.25).
Processes 09 00568 g012
Figure 13. Comparisons of relative contribution on the engine characteristic in low speed (628 rpm) and in lean operation zone (Equivalence ratio Φ = 0.75).
Processes 09 00568 g013
Figure 14. Comparisons of relative contribution on the engine characteristic in in high speed (1000 rpm) and lean operation zone (Equivalence ratio Φ = 0.75).
Processes 09 00568 g014
Table 1. Properties and Composition of rapeseed oil methyl ester (RME).
ItemValueItemValue
Lower calorific value (MJ/kg)39.53Oxygen content (% m/m)10.7
Viscosity at 40 °C (mm·s−2)4.56Cetane number (–)53.88
Surface tension (dynes·cm−2 at 25 °C)30.66Saturation (%)4.45
Methyl linoleate (%)8.11Methyl stearate (%)65.18
Methyl linoleate (%)22.27Methyl palmitate (%)0.87
Methyl palmitate (%)3.57
Table 2. Engine Specifications and Boundary Condition.
TypeValueTypeValue
Bore×stroke (mm)190 × 210Cylinder turbulence scale length (mm)3
Number of cylinders4Initial pressure in the inlet (MPa)0.157
Connecting rod (mm)410Initial temperature in the inlet (K)313.15
Nozzle radius (mm)0.26Exhaust valve opening58° BBDC
Fuel injection holes8Exhaust valve closing56° ATDC
Cylinder diameter (mm)190Intake valve opening66° BTDC
Compression ratio14Intake valve closing54° ABDC
Initial cylinder turbulent kinetic energy (m2/s2)18.375
Table 3. Motoring Tests.
ParameterUnits1234
Speed(rpm)1000909799628
Inlet pressure(bar)1.5501.3391.1691.064
Inlet temperature(°C)4441.940.940.4
Exhaust pressure(mbar)1750152114601534
Exhaust temperature(°C)481429358279
Table 4. The Weighting Coefficient of E3 Test Cycle.
TypeItemValves
E3Engine speed (rpm)1000909799628
Load100%75%50%25%
Weighting coefficient0.20.50.150.15
Table 5. The Upper and Lower Bounds for Data Generation.
ParametersUnitUpper BoundLower Bound
Engine speedrpm1000400
Equivalence ratio-1.20.2
Inlet manifold temperature°C450
Inlet manifold pressurebar2.51.0
EGR-0.40
Injection massg1.320.04
Injection timing°CA−30−10
Exhaust pressurebar30.8
Fuel injection pressurebar15050
Compression ratio-1910
Publisher’s Note: MDPI stays neutral with regard to jurisdictional claims in published maps and institutional affiliations.

