Article

Effects of Micro-Tab on the Lift Enhancement of Airfoil S-809 with Trailing-Edge Flap

1
School of Energy and Power Engineering, Huazhong University of Science and Technology, Wuhan 430074, China
2
Key Laboratory of Low-Grade Energy Utilization Technologies and Systems, Chongqing University, Chongqing 400044, China
3
Xi’an Key Laboratory of Clean Energy, Xi’an University of Architecture and Technology, Xi’an 710055, China
*
Author to whom correspondence should be addressed.
Processes 2021, 9(3), 547; https://doi.org/10.3390/pr9030547
Submission received: 24 January 2021 / Revised: 28 February 2021 / Accepted: 1 March 2021 / Published: 19 March 2021

Abstract

:
Recently, the Trailing-Edge Flap with Micro-Tab (TEF with Micro-Tab) has been exploited to enhance the performance of wind turbine blades. Moreover, it can also be used to generate more lift and delay the onset of stall. This study focused mostly on the use of TEF with Micro-Tab in wind turbine blades using NREL’s S-809 as a model airfoil. In particular, the benefits generated by TEF with Micro-Tab may be of great interest in the design of wind turbine blades. In this paper, an attempt was made to evaluate the influence of TEF with Micro-Tab on the performance of NREL’s S-809 airfoils. Firstly, a computational fluid dynamics (CFD) model for the airfoil NREL’s S-809 was established, and validated by comparison with previous studies and wind tunnel experimental data. Secondly, the effects of the flap position (H) and deflection angle (αF) on the flow behaviors were investigated. As a result, the effect of TEF on air-flow behavior was demonstrated by augmenting the pressure coefficient at the lower surface of the airfoil at flap position 80% chord length (C) and αF = 7.5°. Thirdly, the influence of TEF with Micro-Tab on the flow behaviors of the airfoil NREL’s S-809 was studied and discussed. Different Micro-Tab positions and constant TEF were examined. Finally, the effects of TEF with Micro-Tab on the aerodynamic characteristics of the S-809 with TEF were compared. The results showed that an increase in the maximum lift coefficient by 25% and a delay in the air-flow stall were accomplished due to opposite sign vortices, which was better than the standard airfoil and S-809 with TEF. Therefore, it was deduced that the benefits of TEF with Micro-Tab were apparent, especially at the lower surface of the airfoil. This particularly suggests that the developed model could be used as a new trend to modify the designs of wind turbine blades.

1. Introduction

Wind energy plays a crucial role in tackling global climate issues and shaping tomorrow’s energy systems. Recently, the wind turbine industry is becoming one of the best choices for energy production among all renewable energy choices [1]. The wind industry shows extensive financial progress and it is assumed to seriously compete with fossil fuel energy generation in the coming years. This progression attracts most scientists’ attention to investigate feasible modifications that can enhance wind turbine performance and sustainability. This is supported by numerous recent studies, in which they claim that the efficiency of a wind turbine depends on many factors, including the rotational speed of the electrical generator [2] and the control of the airfoil aerodynamic shape and forces [3]. It is especially problematic for air-flow separation in the region near the hub. It was reported that the efficiency of wind turbines was diminished due to the drag penalty coming from air-flow separation at large angles of attack around the airfoil [4]. Due to the increase in the angle of attack (α), the adverse stream-wise pressure counter-gradients increase correspondingly and lead to air-flow separation.
Consequently, it is essential to study air-flow separation control methods to enhance wind turbines’ aerodynamic performance. Thus, specialists could use modern methods, such as TEF, Micro-Tabs at the TEF with Tab, and vortex generators, to improve the wind turbine blades’ performance. These methods can be applied at a low Reynolds number (Re) number to achieve high aerodynamics efficiency [5]. Hence, this work presents a convenient simulation to modify the airfoil design by using a flap and tabs at the airfoil’s trailing edge. By employing a CFD simulation and using shear stress transport SST k-ω model, the standard airfoil shape is compared to different airfoil shapes with a TEF, and airfoil with TEF with Tab. The latter obtained the highest output power efficiency for the wind turbine blades [6,7].
Compared with the standard shape airfoil, TEF airfoils have been proven useful as wind turbine airfoils since they can be adopted in larger sectional areas, produce more aerodynamic forces (CL, CD and CP), and are insensible to leading-edge roughness [8,9]. Therefore, by using TEF airfoils, further improvement for both the structural strength and the aerodynamic performance of wind turbine blades could be achieved [10,11]. Different angles of installation can be applied in TEF with Micro-Tabs to increase the aerodynamic performance. It was suggested that Micro-Tabs should be maintained below 95% C to maximize the aerodynamic benefits [12]. After conducting a systematic experimental campaign on different shapes of the airfoil, there is compelling evidence that Micro-Tabs enhance the value of CL of airfoils and decrease the CD [13,14]. Figure 1 depicts the shape and flow of the streamlines with and without micro tabs
Many researchers and studies later confirmed the presence of a characteristic separation bubble and rotating vortices as a result of installing a Micro-Tab [16,17]. Consequently, this part was fixed to the airfoil surface; it was responsible for an increasing suction on the airfoil upper surface and a pressure on the lower surface of the airfoil.
Interestingly, the aerodynamic impact of Micro-Tabs strongly depends on their design configuration parameters, such as Micro-Tab geometry and their mounting details, whereby the height and angle of installation of the Micro-Tab are indeed one of the most important design parameters. Furthermore, the CL parameter enhances the aerodynamic performance of any airfoil in different weather conditions. Likewise, for a certain threshold value of the CD parameter, it is confirmed that its size and angles could nullify the Micro-Tabs advantage. Therefore, many researchers are now looking for the best size and the best angle for an optimal installation of the Micro-Tabs [18,19]. Thus, this could provide the domain with the suite’s highest efficiency and obtain a beneficial CL/CD.
Micro-Tabs have been confirmed to have interesting inferences in a wide range of flow fields. Wang et al. and Troolin [20,21] provided an extensive overview of Micro-Tab applications, which include different wind speeds [22], aircraft, and wind turbine blade design analysis [23]. In this paper, we focus on the latter application, and many literature instances suggested Micro-Tabs as a small but useful device for active air-flow control over the airfoil and wind turbine blade’s aerodynamic performance increase [24].
Therefore, this study’s main purpose is to scrutinize the influences of TEF with Micro-Tab on the performance of the airfoil S-809 with TEF using 2D CFD simulations by using shear stress transport SST k-ω model [25]. In particular, this study sets some important parameters that selectively tuned the aerodynamic performance by setting different TEF positions of the chord length (C), deflection angle, and angle of incidence TEF. Interestingly, it has been shown that this study is capable of predicting the qualitative effect of TEF with Micro-Tab at different positions on the airfoil surface of the airfoil with TEF, the highest aerodynamic performance, and improves the CP at a small α. In conclusion, when TEF was deflected, the flow was trapped on the airfoil’s lower surface. In turn, a decrease in the flow velocities, an increase in pressure at the airfoil’s lower surface, and an adverse pressure gradient may be achieved.

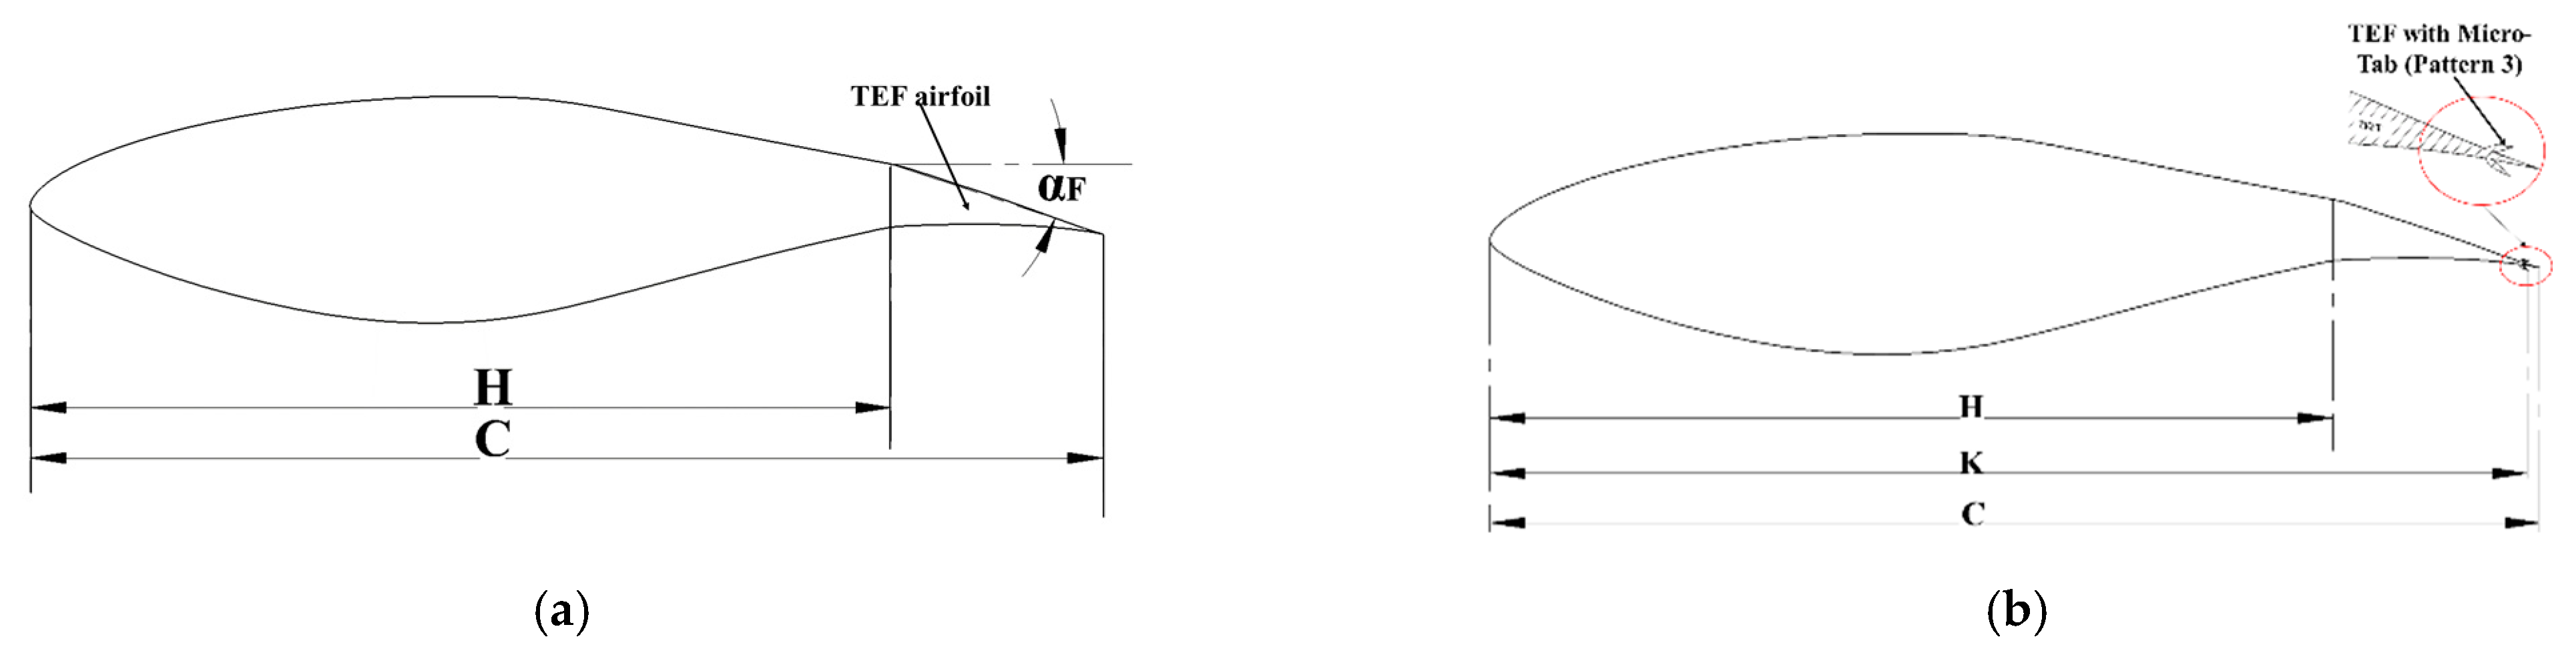
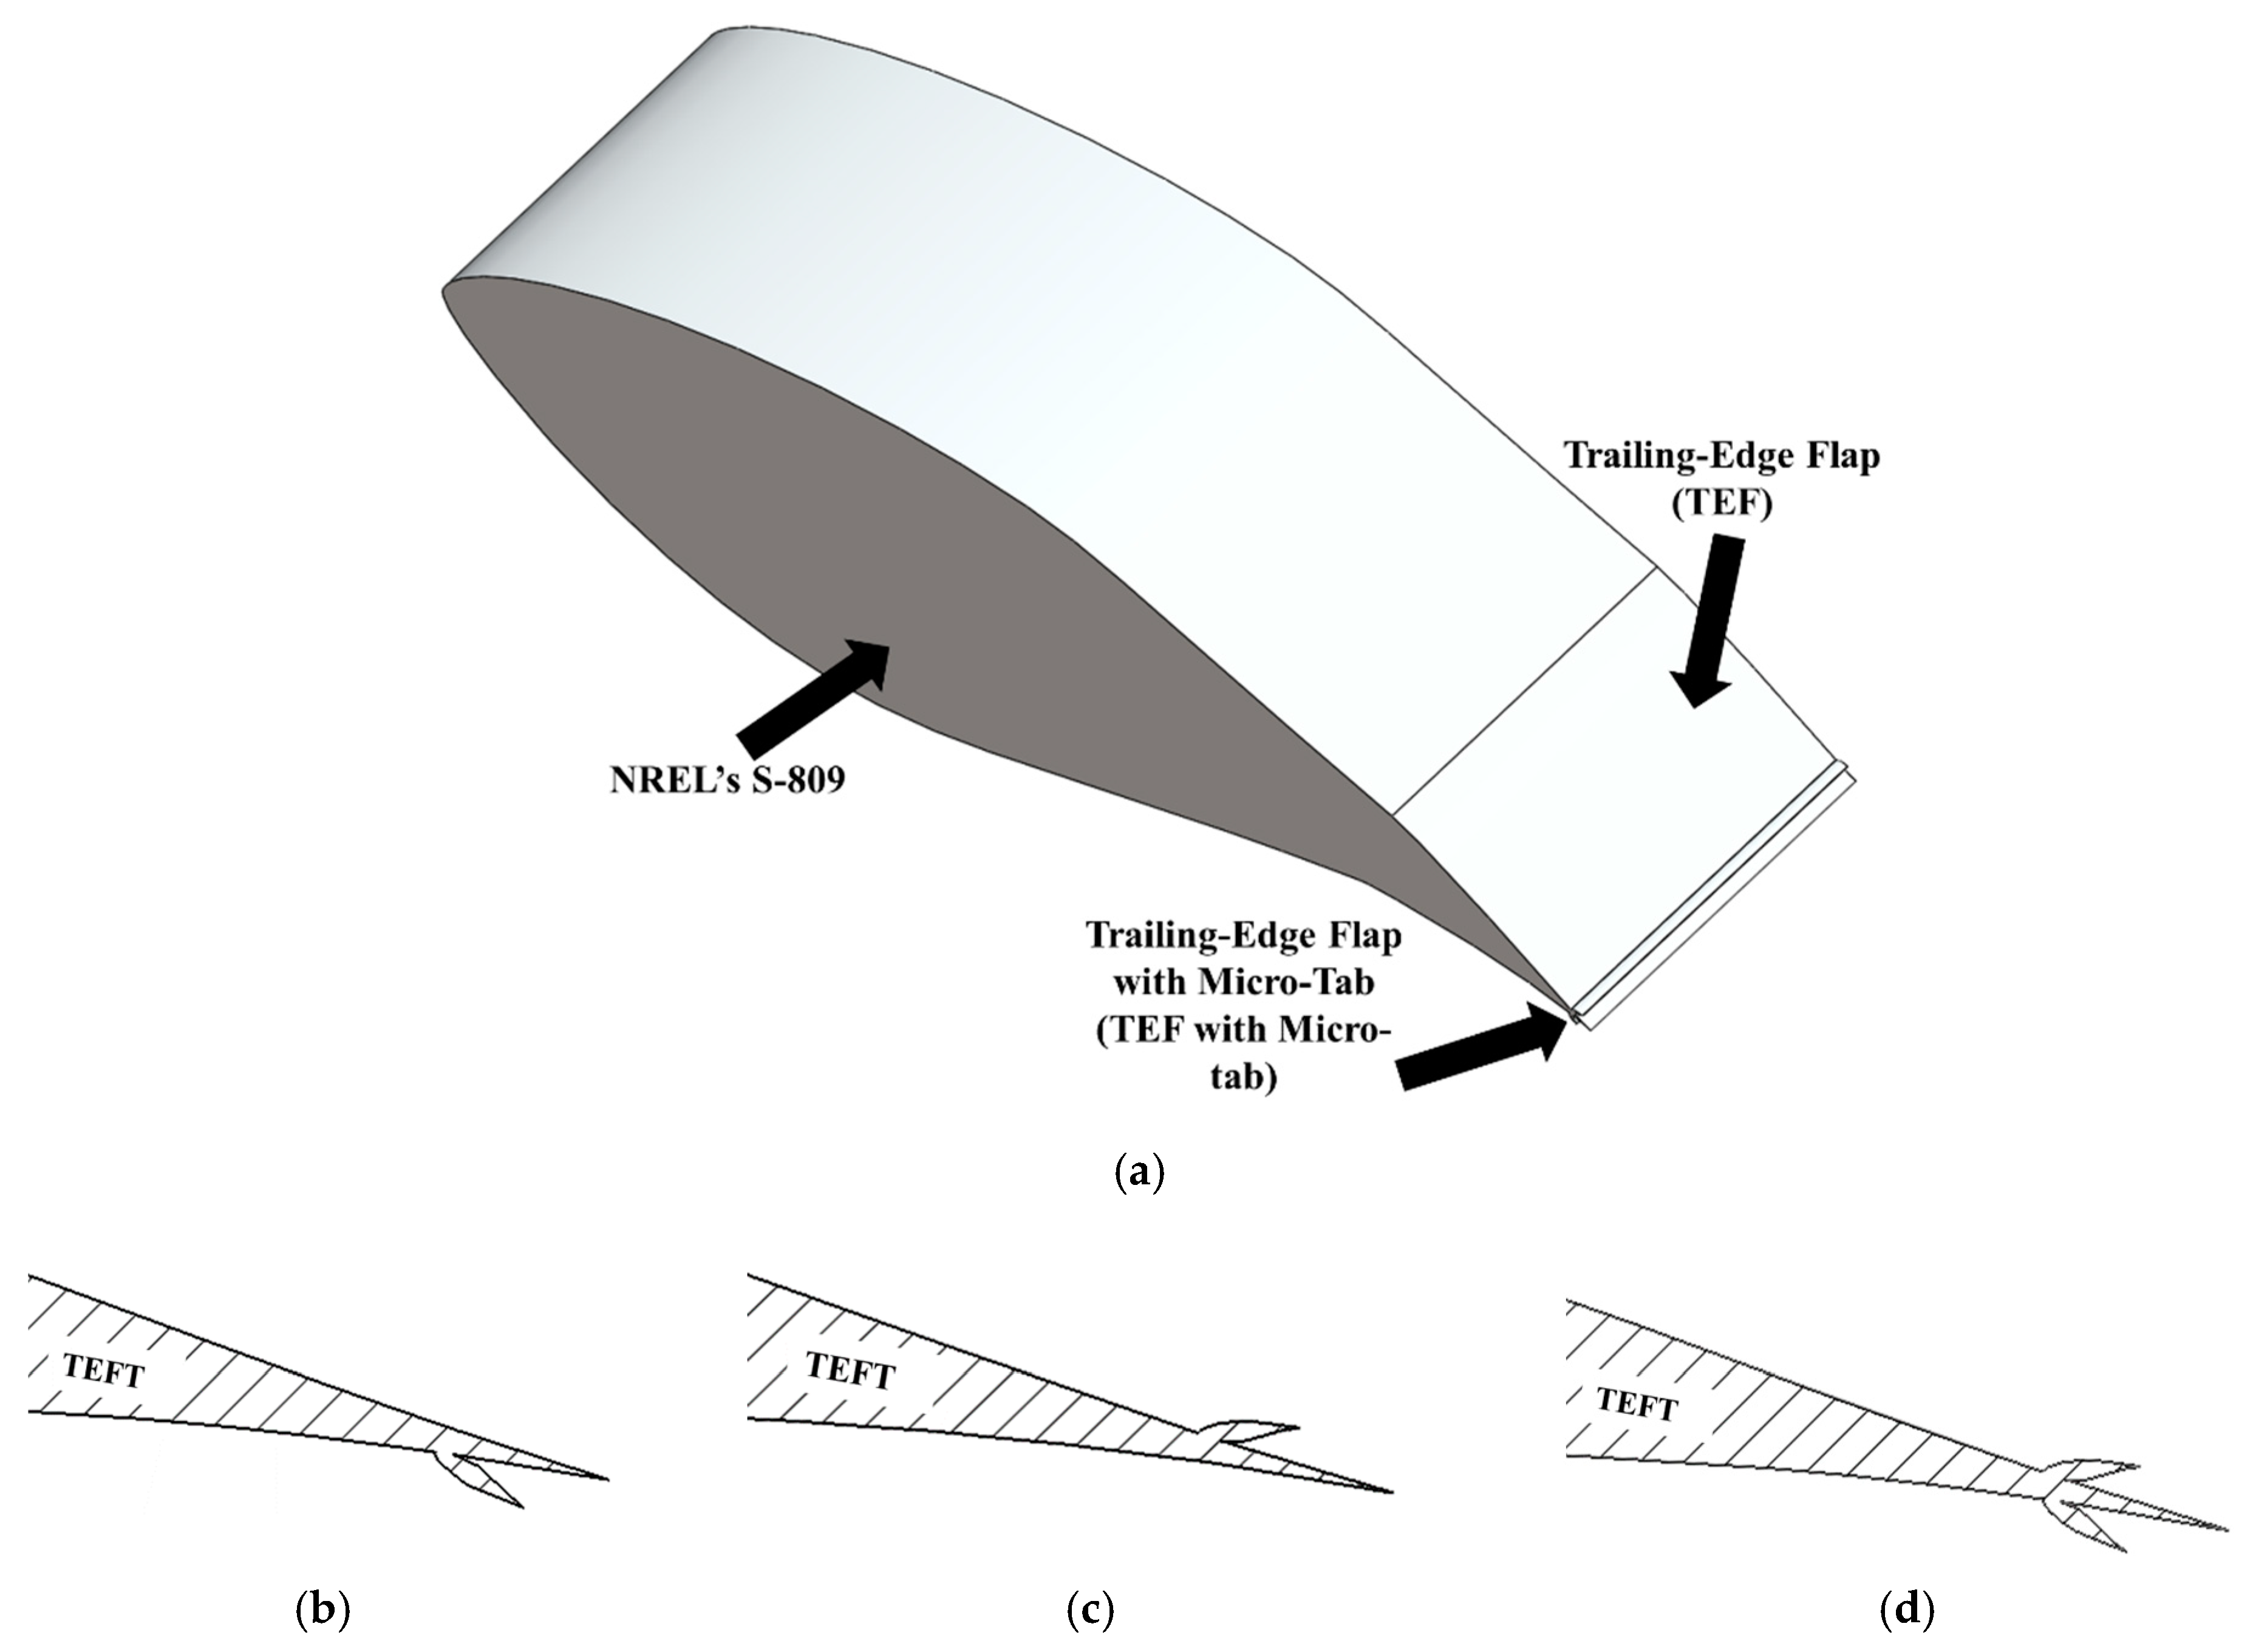
2. Geometric Description of the Trailing Edge Flap with Micro-Tab Airfoil

This section discusses the TEF airfoil geometry parameters with a Micro-Tab at different position by using the airfoil S-809 with TEF. The position of TEF at H = 80% C and deflection angle αF of TEF 7.5° are shown in Figure 2a,b when TEF with Micro-Tab are mounted at the trailing edge of the TEF airfoil. Figure 2 and Table 1 show three patterns with different Micro-Tabs positions. The S-809 airfoil has been selected as the standard airfoil that has been identified as the most popular wind turbine on the market [26,27,28,29].
The TEF was attached at the Trailing-Edge Standard airfoil S-809. For the length of the airfoil chord (C), a suitable length of 0.6 m was chosen. Moreover, the TEF’s position and deflection angle were selected to generate the highest dynamic performance (according to the previous article [28]).
Therefore, the current study is based on TEF with a Micro-Tab at three different pattern positions according to the airfoil chord, and they are all further investigated using CFD simulation. Data and illustrations in Table 1 and Figure 3 show the design parameters and the tab position.
All TEF with Micro-Tabs have a height of 2% C with the position K = 95% C, and maximum width is 0.4% C, the lower position at k = 95% C, the upper position at K = 95% C, and upper/lower positions at K = 95% C, which are denoted as “Pattern 1”, “Pattern 2”, and “Pattern 3,” respectively, as shown Figure 3a–c.

3. Description of the Numerical Method

3.1. The Governing Equations
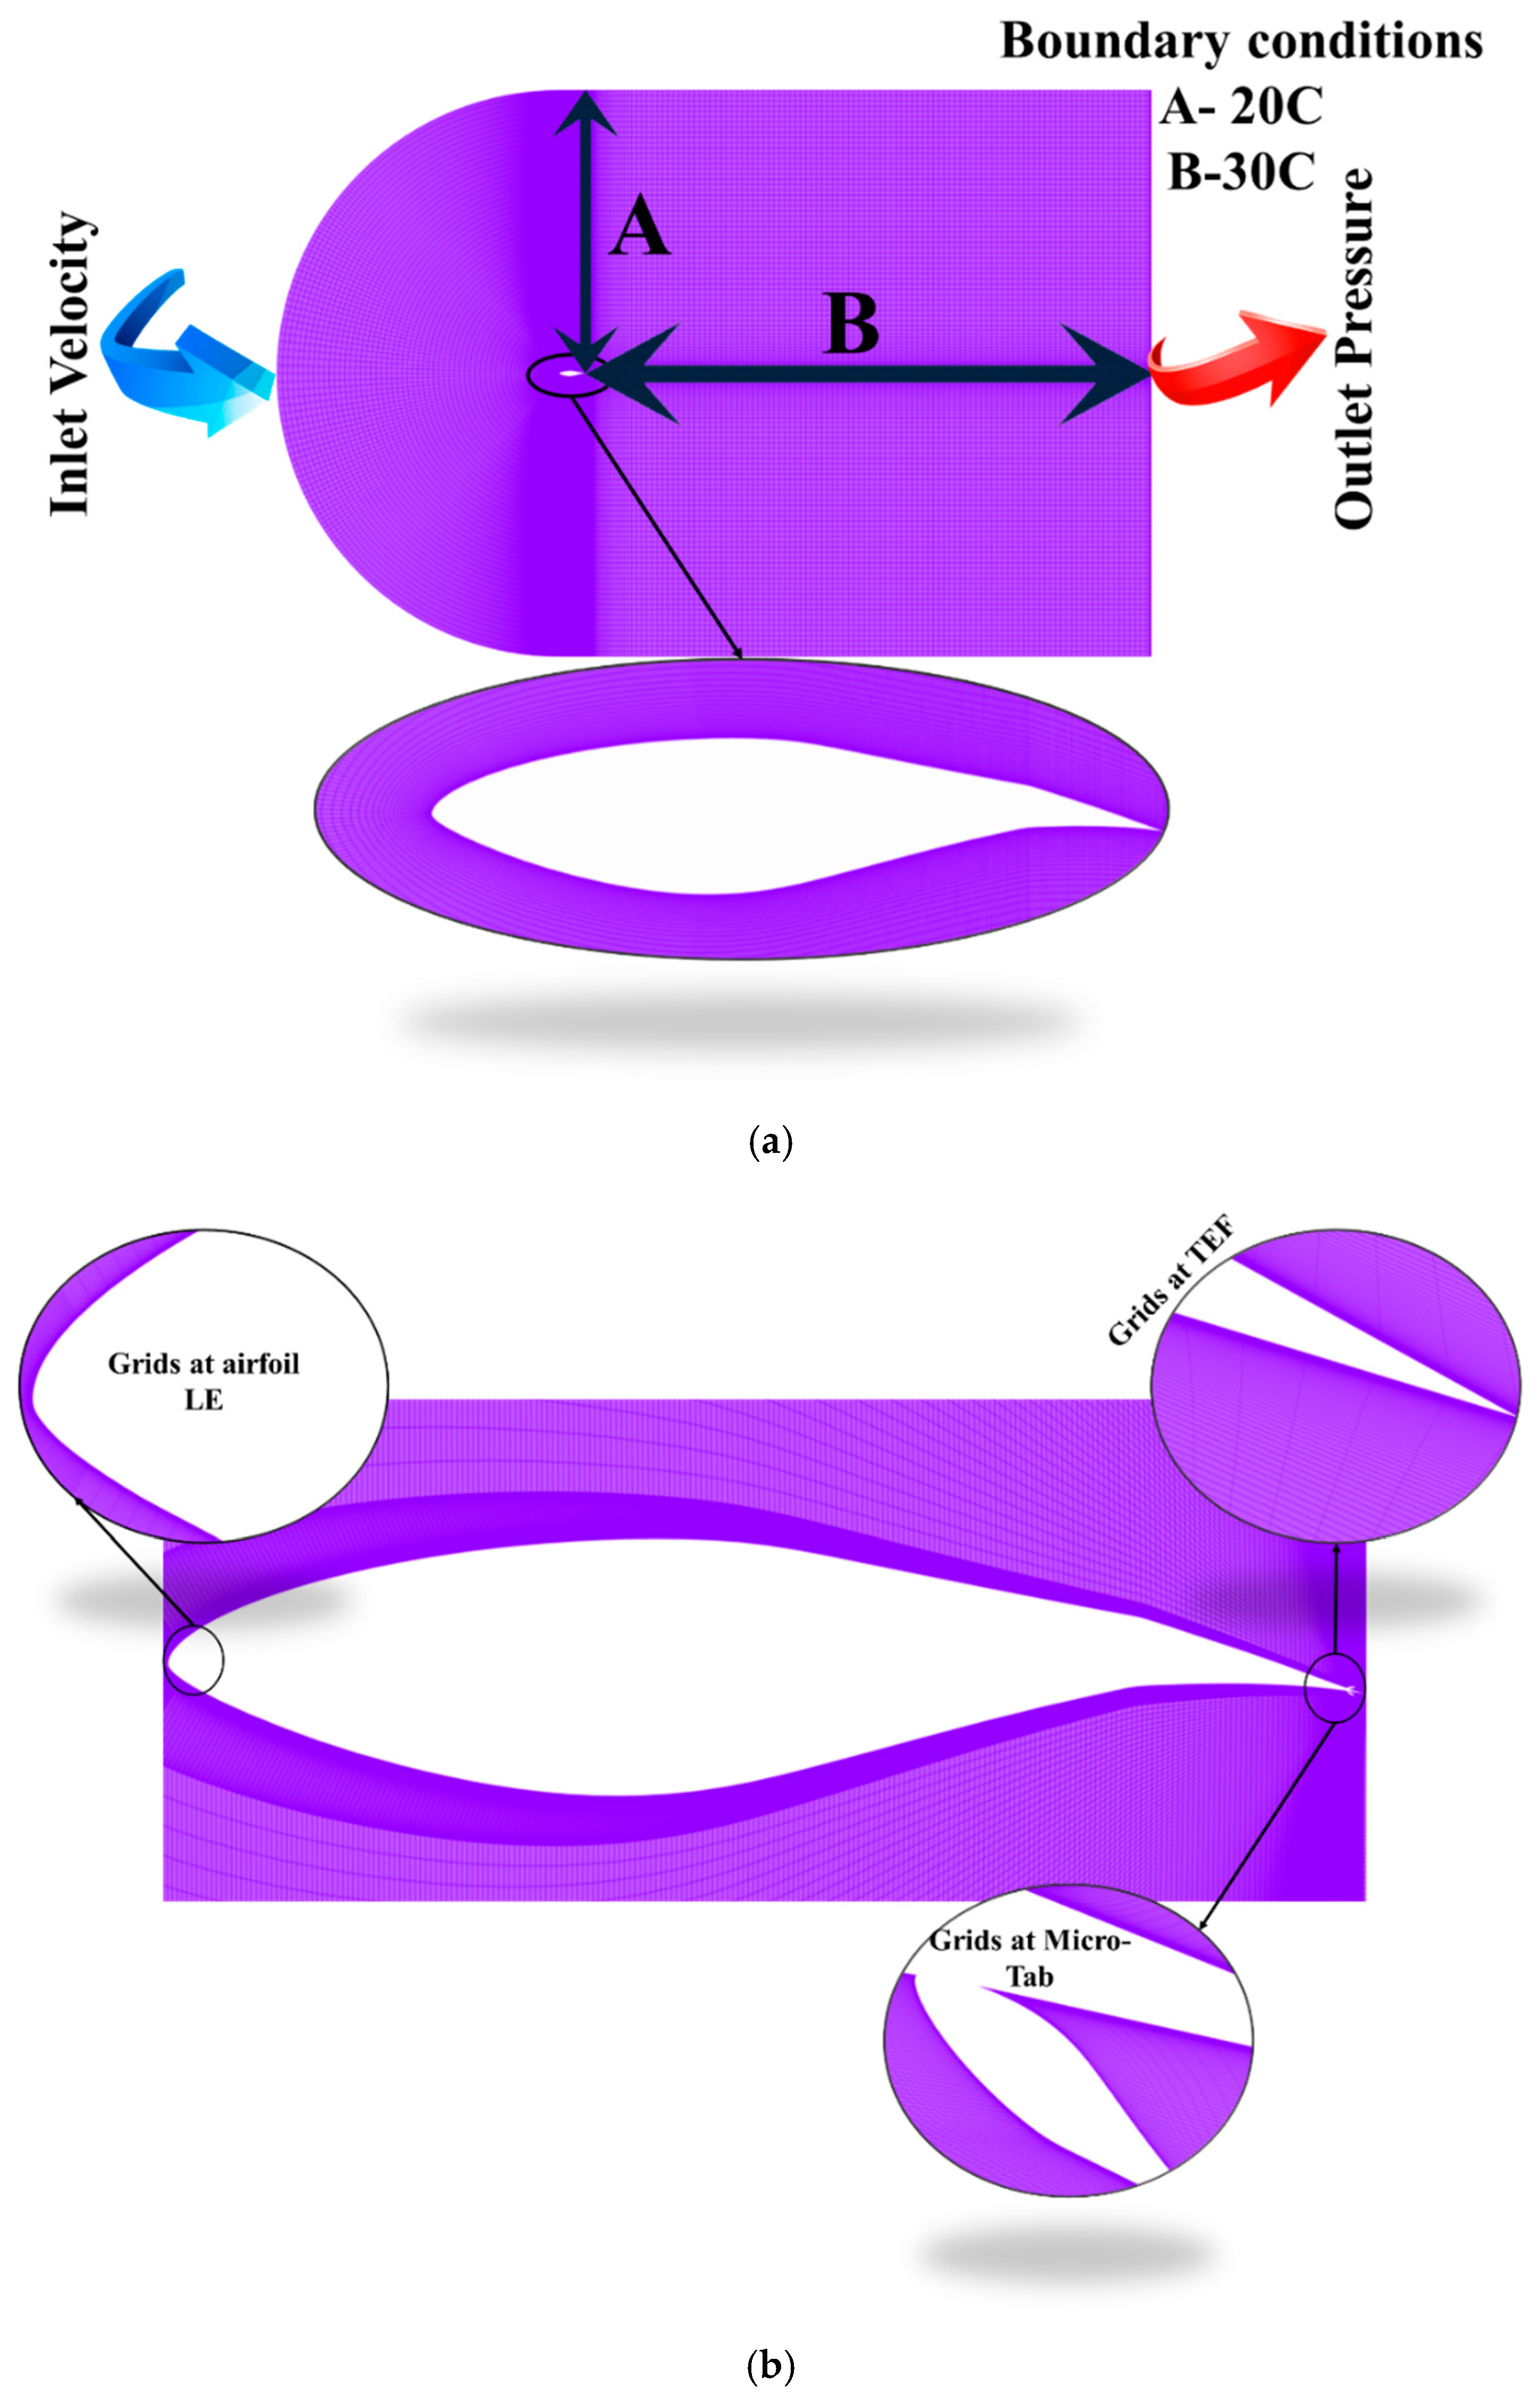
In this study, ANSYS Fluent was used to generate the 2D CFD model simulation. A finite volume method was applied. The solver was set as a pressure-based viscous, incompressible solver, and the shear stress transport SST k-ω model [30,31,32] is used in the steady flow Re-averaged Navier-Stokes (RANS) equations. The spatial RANS equations with second-order accuracy were used and are illustrated as follows:
Mass equation
ρ t + x i ( ρ U i ) = 0
Momentum equation
ρ ( U i t + U k U i x k ) = P x i + x j ( μ U i x j ) + x j τ i j
Here, Ui is the free stream velocity component in the x-direction. P is the pressure, t, μ and ρ are the time, the dynamic viscosity, and air-flow density.
The SIMPLEC algorithm for the treatment of the pressure-velocity coupling was used. Second-order up-wind discretization was adopted for the convection terms and central difference schemes for the diffusion terms.
The SST k-ω (Shear Stress Transport) turbulence model (previously proposed by Menter [31]) was chosen in this work as it has shown good aerodynamic performance in wind turbines and turbo-machinery experiencing air-flow separation as expected for the blades during rotation [33].
This model’s core idea was to utilize the robustness of the k-ω model to capture the flow within the viscous sub-layer. Moreover, one can use the k-ϵ model in the mainstream area to ban the disadvantage of the k-ω turbulence model. Overall, the SST k-ω model combines the advantages of the standard k-ω model and the standard k-ϵ model by mixing functions. Therefore, the SST k-ω model has higher accuracy and reliability in a wide range of flow fields. Yu et al. and Zhang et al. reported simulation results for the Spalart–Allmaras (S–A) turbulence model [34,35]. There was a good agreement between the simulation and the experimental data.
Additionally, Menter and Rogers et al. detected that for most high-lift problems [36], the S–A and SST k-ω model estimations were similar. However, it was proposed that the SST k-ω model is superior in accurately predicting pressure-induced separation. Therefore, the SST k-ω model was assumed to be more suitable in the present study than the S–A model [34,35] This will be shown in the results and discussions Section 4.1.2.
ρ k t + x j ( ρ u j k ) = x j [ ( μ + σ k μ t ) k x j ] + τ i j S i j β * ρ ω k
ρ ω t + x j ( ρ u j ω ) = x j [ ( μ + σ ω μ t ) ω x j ] + C ω ρ μ t τ i j S i j β ρ ω 2 + 2 ( 1 f 1 ) ρ σ ω 2 ω k x j ω x j
where Uj is the velocity component in the x-direction. β, Cω, σk, and σω are coefficients of the SST turbulence model that can be obtained by blending the coefficients of the k-ω model.

3.2. CFD Gird Model

This research adopts the chord length C = 0.6 m and the free stream velocity V ≃ 51 m/s, and the Reynolds number Re = 2 × 10⁶. The C-type mesh provided by the elliptical method in ICEM CFD was used because of its high accuracy, as verified by Ma et al. [37]. The computational grid, shown in Figure 4, constituted 9 × 10⁵ grid elements on the airfoil surface. The respective distance of the inlet and outlet boundaries away from the leading edge was 20 C and 30 C, respectively. The top and bottom boundaries were 15 C away from the chord. In particular, to capture the boundary layer, the grid should have a y+ value of less than one (y+ < 1). The y+ is a non-dimensional distance that indicates the degree of grid fineness in the near-wall region. In the current simulation, the first grid node above the surface was 1.5 × 10⁻⁵ times of chord length, in turn, y+ = 0.02. The mesh quality and the mesh at the edge of the airfoil for the TEF with Micro-Tab are depicted in Figure 4b. Figure 4b shows several details of the computational grid used for the airfoil’s CFD simulations analysis, with a specific focus on the improvement zones used to properly discretize the airfoil LE and TE, such as the Pattern 3 configuration. The whole count of elements demonstrated that there is a very fine meshing in the sections inside the airfoil and a relatively rough meshing outside. However, the number of elements inside the airfoil was about 11 × 105. To capture the boundary layer for Pattern 3, the grid should have a y+ value of y+ < 1. A mesh independency test was achieved to emphasize that the difference in the number of elements did not affect the solution, as shown in the results and discussions Section 4.1.1.

4. Results and Discussion

4.1. Validation of Accuracy S-809 and S-809 with TEF Airfoil

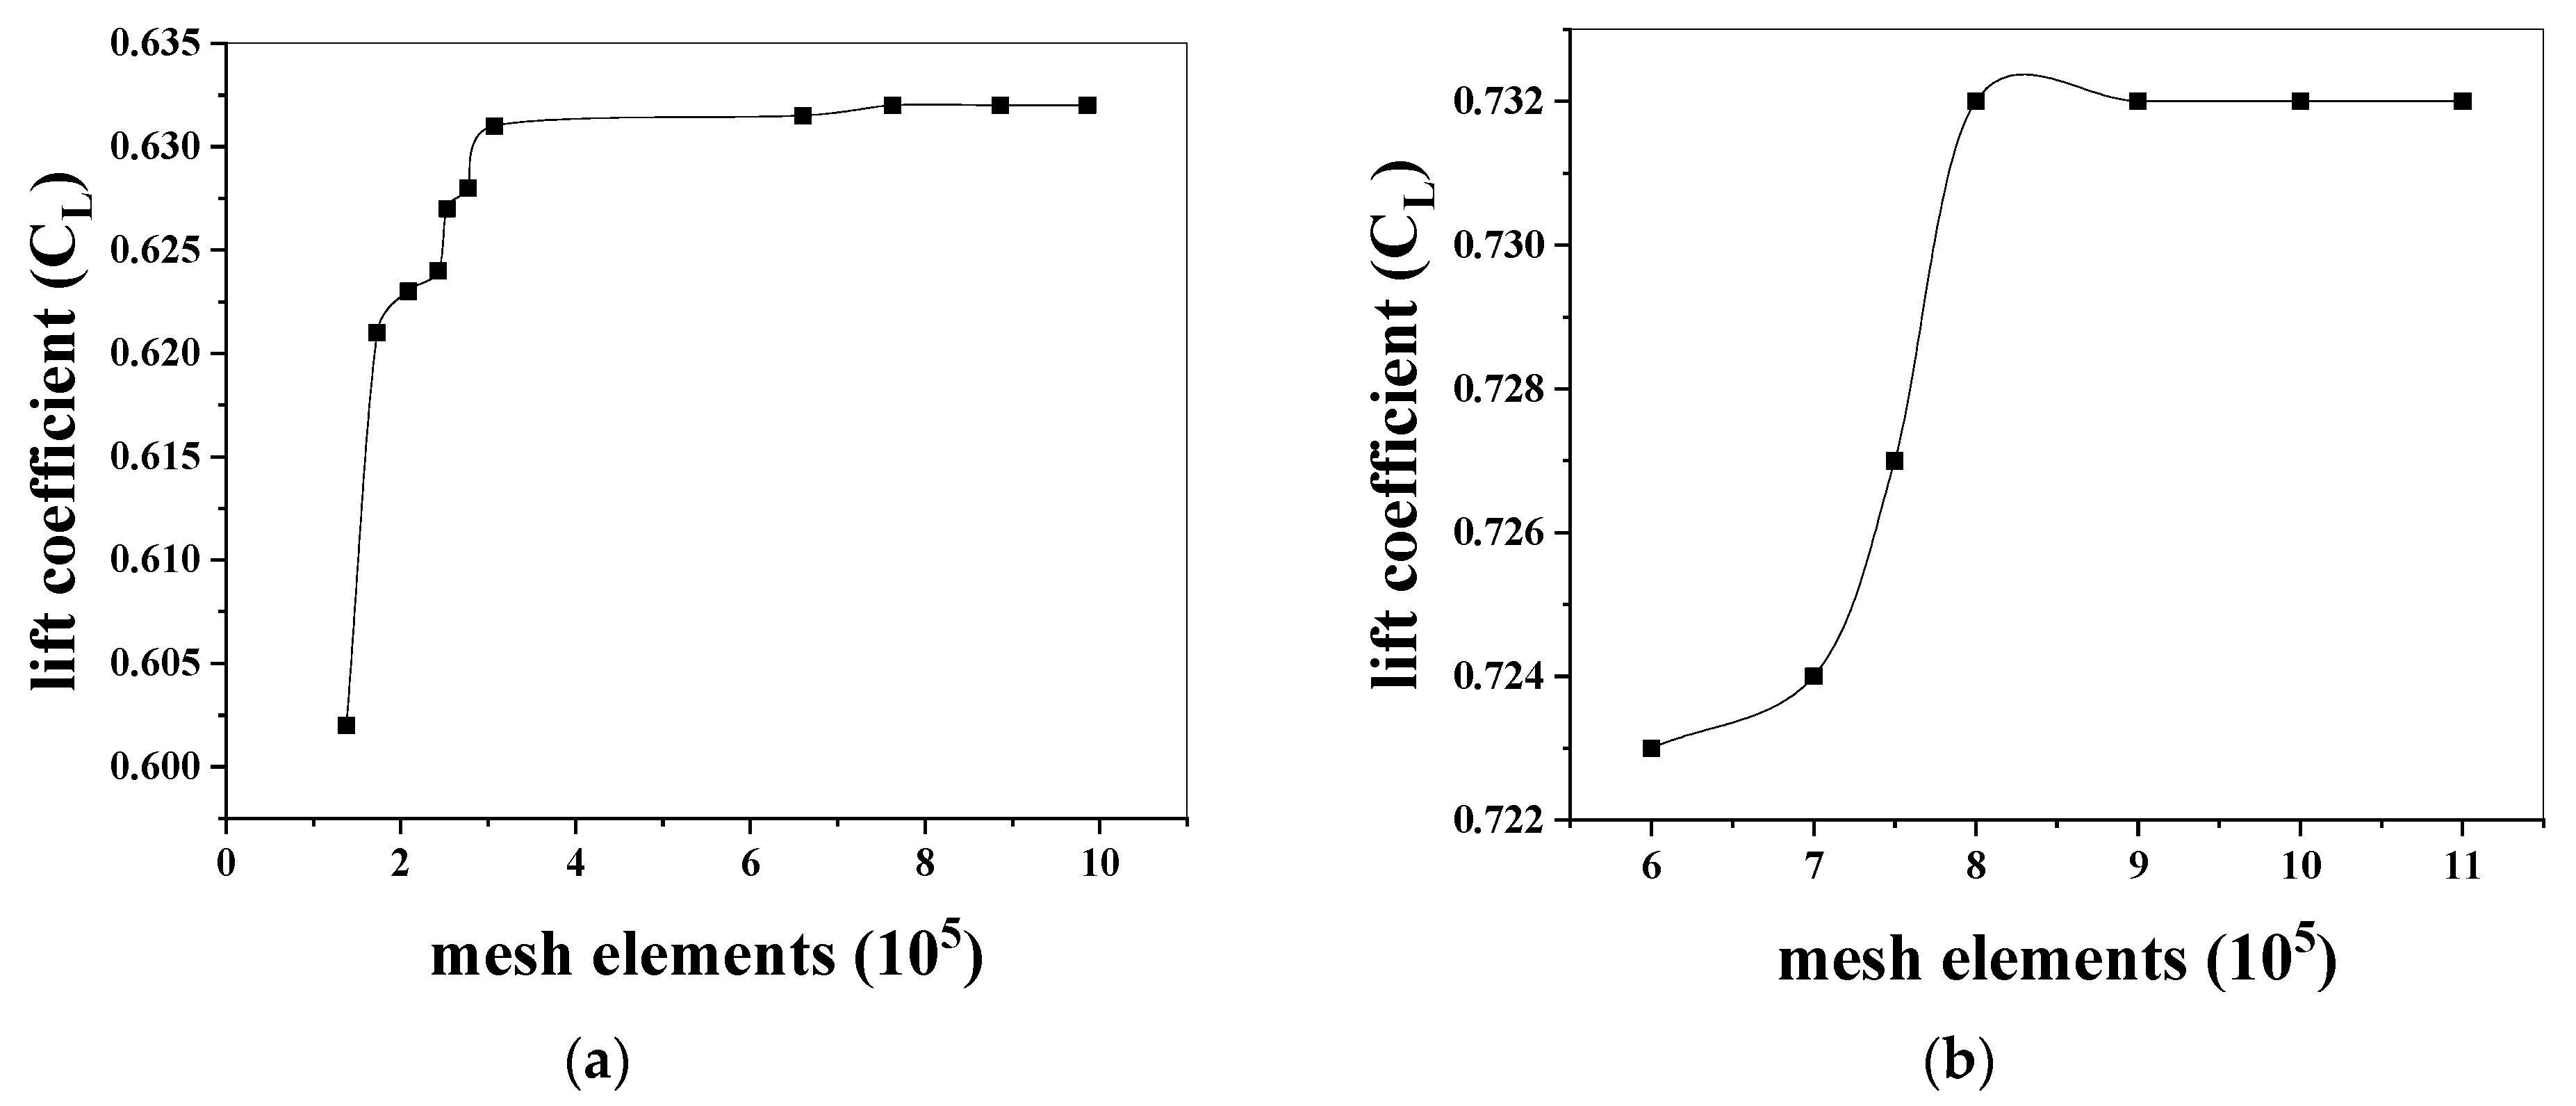
4.1.1. Grid Independence Validation

To ensure grid independence in the CFD simulation predictions, calculations have been made for a typical TEF airfoil shape and air-flow configuration, using different grid accuracies. The verification of the predicted CL with the total number of the grid elements for the considered TEF airfoil and Pattern 3 is displayed in Figure 5a,b. The achievement of sufficient grid independence for grids with elements larger than 8 × 10⁵ is observed in Figure 5a. Thereby, the grids created by the ICEM program and using the same grid strategy possessed an even finer resolution corresponding to the number of elements 9 × 10⁵ and according to the grid independence curve.
The illustrations in Figure 5b verify the grid independence around the airfoil for Pattern 3 (Micro-Tab position at the upper and lower on the TEF surface), where the flow-field model of grid elements ranged from 6 × 10⁵ to 11 × 105. From these findings, it was observed that the convergence was determined with high accuracy and the aerodynamic performance reached a stable value when the number of grid elements reached a value of more than 9 × 10⁵. Therefore, a model with a grid element number of 11 × 105 was further selected for the next modelling assessments.

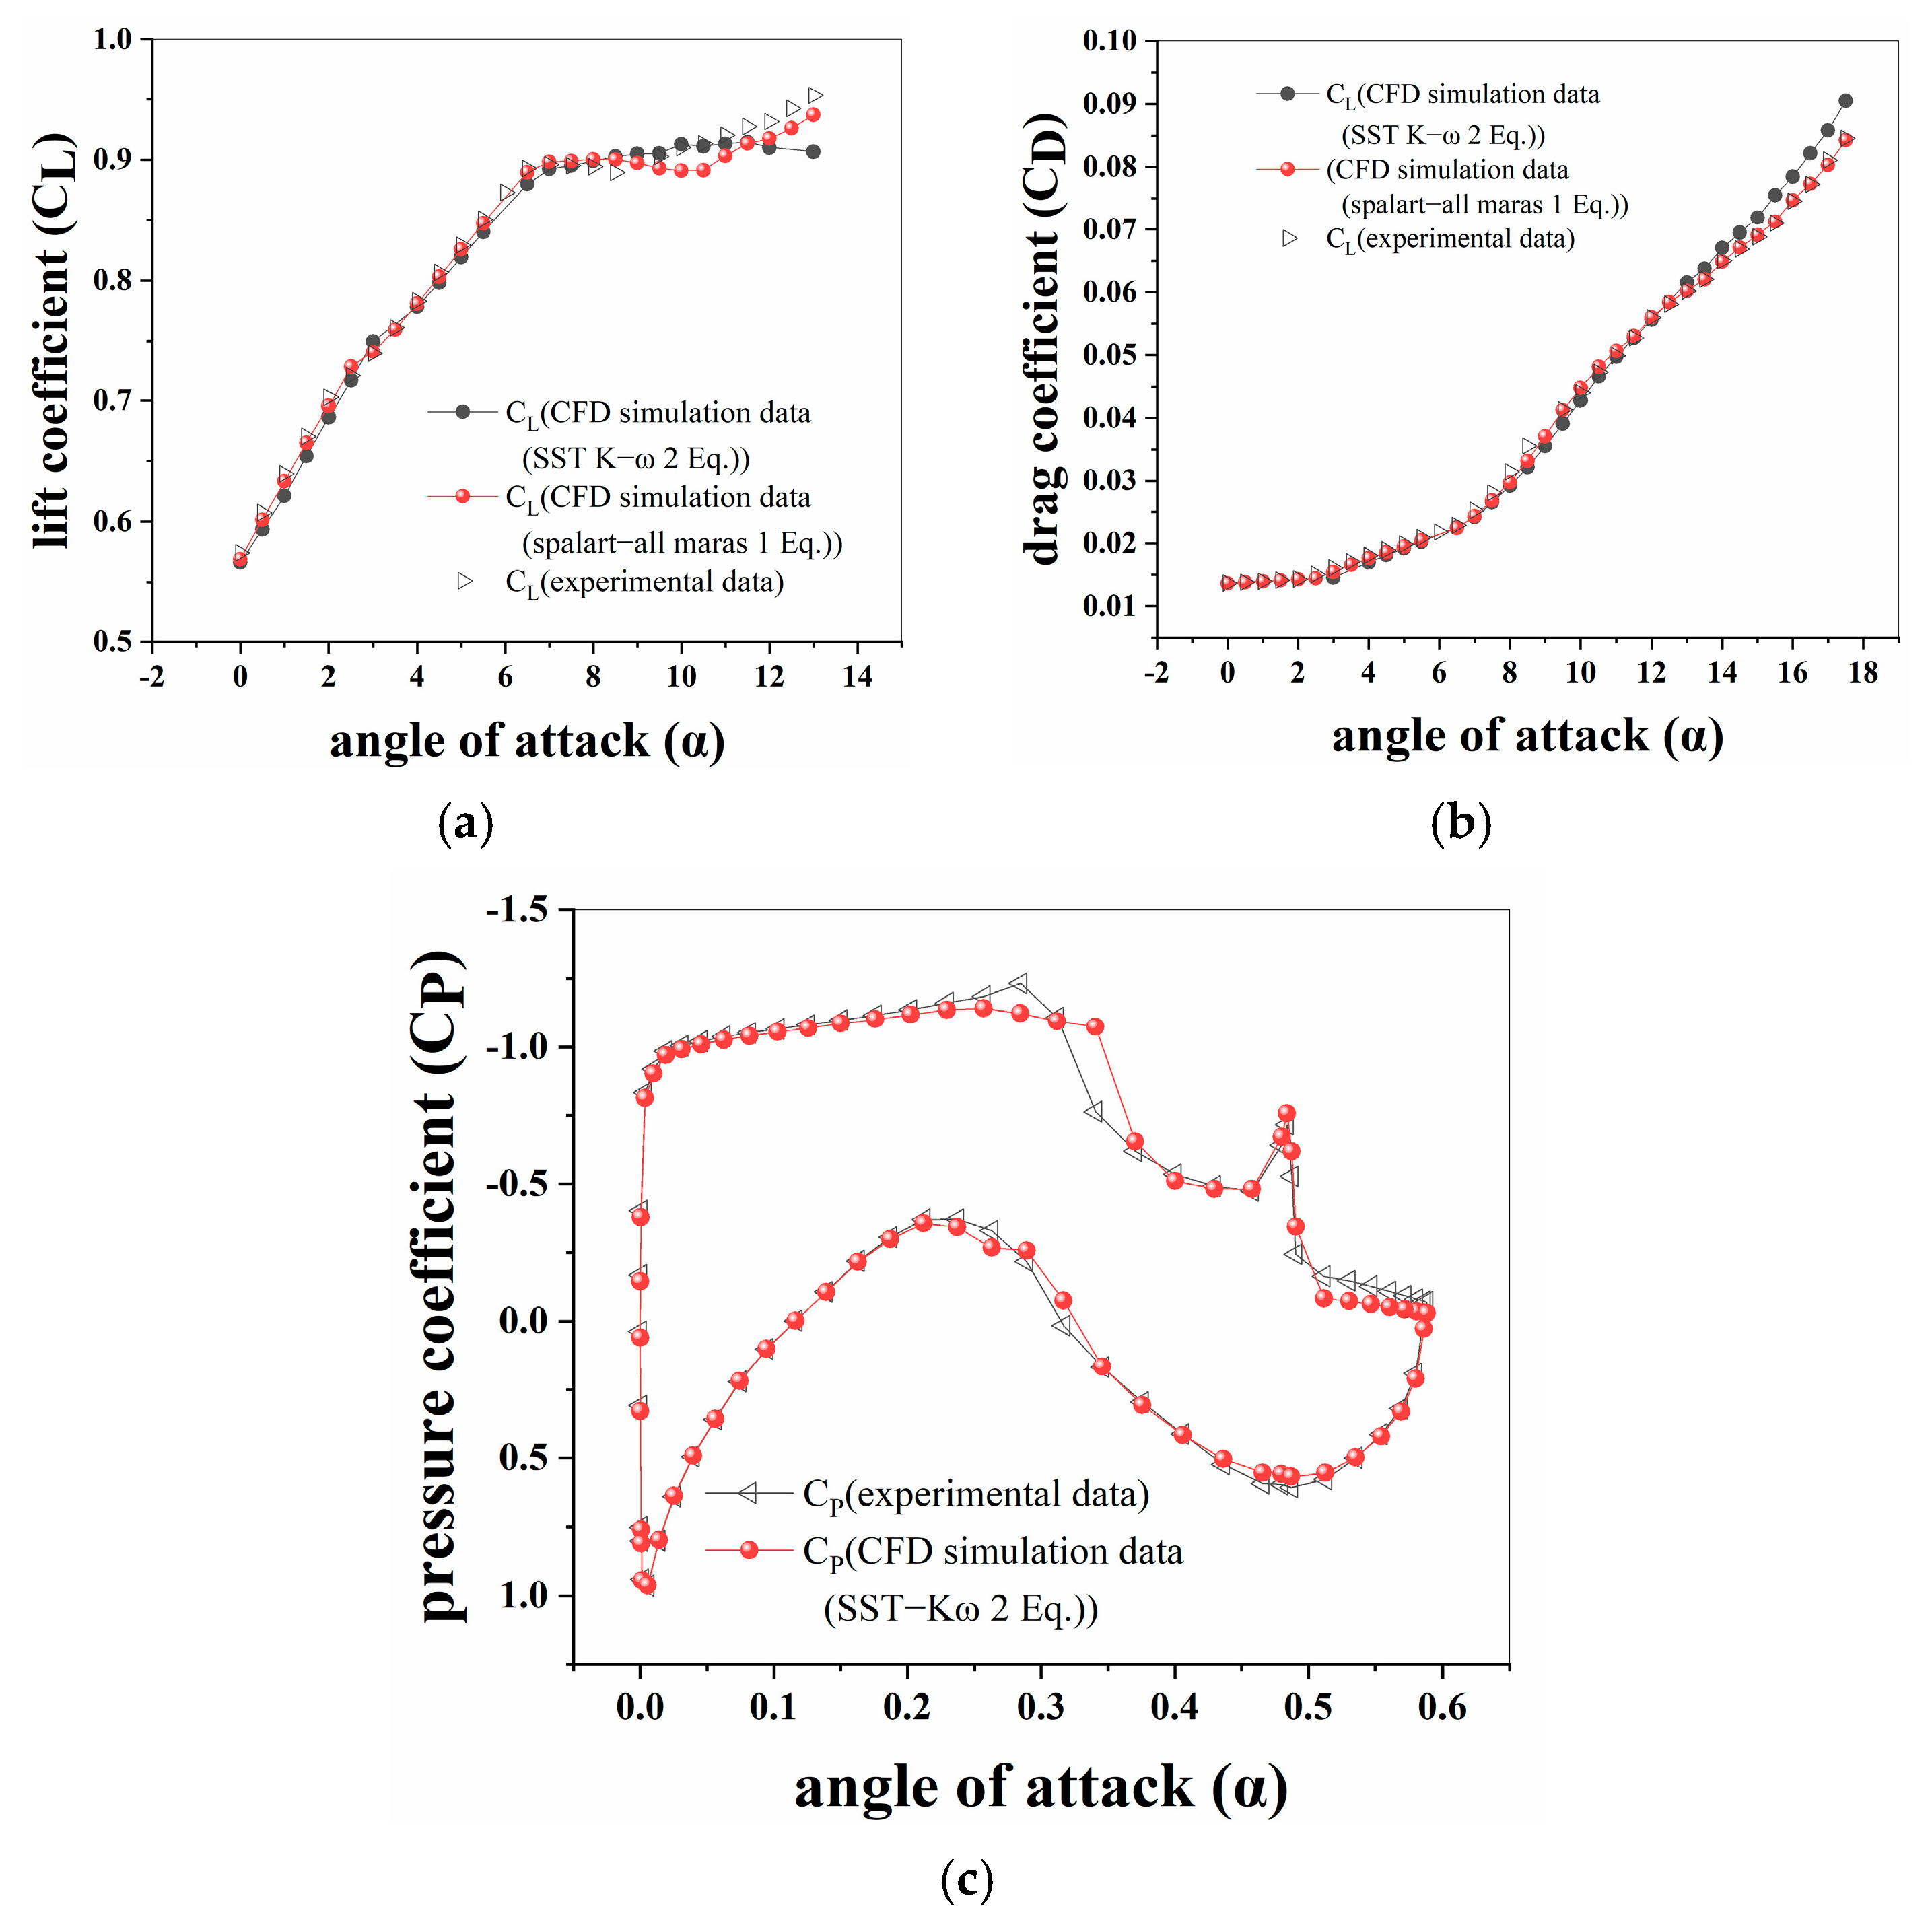
4.1.2. Comparison between CFD and Experimental Data for TEF Airfoil S-809

To validate the CFD simulation, the experimental data of the S-809 airfoil with TEF provided by the Ohio State University were compared with the numerical results [38,39] The Mach number (Ma ≃ 0.15) and the Re = 2 × 10⁶ in the numerical simulation are the same as those of the wind tunnel test. The chord of the S-809 airfoil with TEF was C = 0.6 m. The simulation results are compared with the experimental data in Figure 6. The findings illustrate that the CL coincides with the measurement for the range of angles of attack from −2° to 13°, as shown in Figure 6a. After the flow separation took place, the CL was a little overestimated but within an acceptable range. Moreover, the variation trend was well observed. The CD was obviously overestimated, as shown in Figure 6b. The possible reason was that the S-809 with TEF was a laminar airfoil, and there probably existed a transition flow on the airfoil surface during the experiment. Table 2 shows a comparison of the CFD results and experimental data for the TEF airfoil. For example, for the angle = 4°, the CFD simulation lift coefficient is now equal to the experimental value. Table 2 presents the results obtained from the preliminary CFD analysis (SST-kω and S-A). The CL compared with the experimental data has a 2% error and the error in the calculated drag has been reduced to 9%. The errors in the coefficients at 0° and 1° have also been significantly reduced. These angles of attack were rerun using the same grid as for all cases. In summary, the numerical results concur with the experimental data. This indicated the accuracy of the numerical method in this study. Besides, Ramsay carried out a similar validation strategy to validate their numerical results [40]. Therefore, the present study’s subsequent research used the full turbulence model to carry out the numerical simulations.
Figure 6c shows the comparison between the CFD calculated and experimental surface pressure coefficient distributions for an angle of attack of 0° [40]. The Cp comparisons for 0° are in a reasonably good agreement over the entire S-809 airfoil with TEF surface except in the regions of the laminar separation bubbles. The experimental pressure distributions show the laminar separation bubbles just near the chord on both the upper and lower surfaces. They are indicated in the experimental data that become more-or-less constant with respect to X/C, followed by an abrupt increase in pressure as the flow undergoes turbulent reattachment. Since the calculations assume a fully turbulent flow, no separation is indicated in the numerical results.

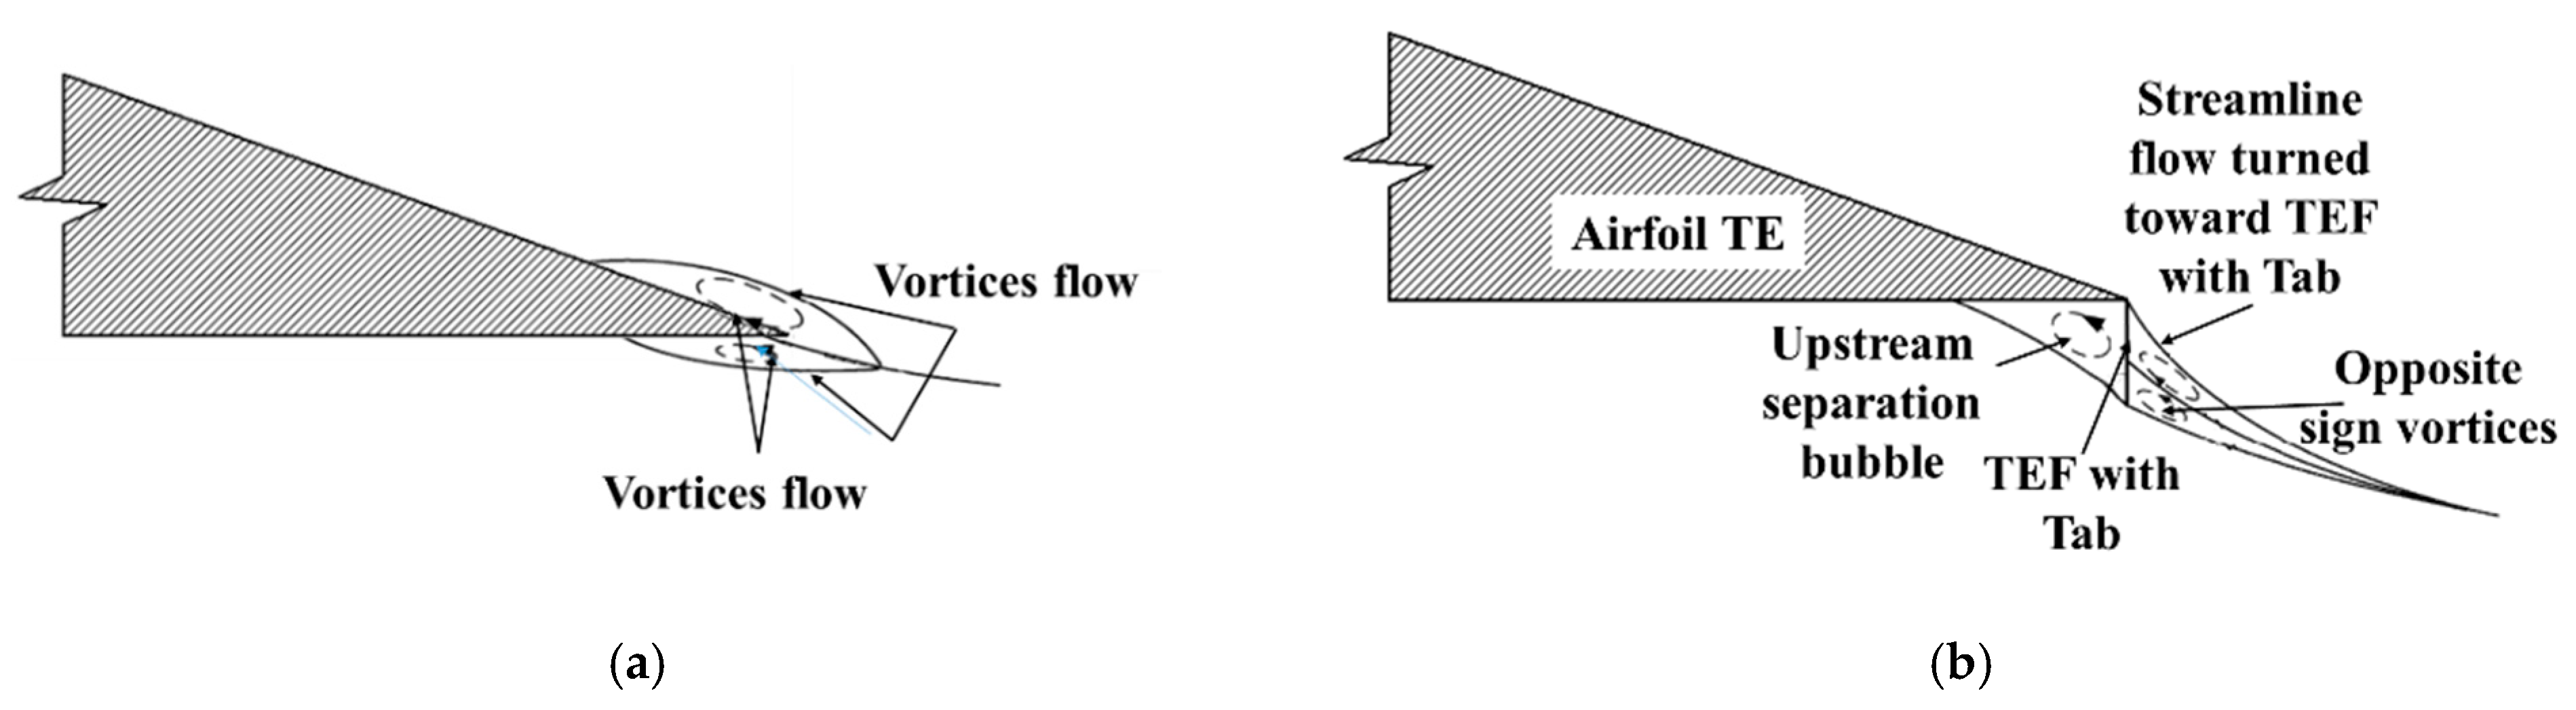
4.2. Effect of the Trailing Edge Flap with Micro-Tab (TEF with Micro-Tab) on the Air-Flow Behaviour

This section presents the results of our investigation on the aerodynamic performance of TEF with Micro-Tab attachment. The aerodynamic performance results presented include stall angles of attack α, CL, CD, and CL/CD distribution. In order to articulate the results, the 2D air-flow streamlines distribution and vortices in the wake area have been analyzed. Different TEF’s aerodynamic performance with Micro-Tab at different positions have been analyzed to control the proposed TEF’s control aerodynamic performance with Micro-Tab. The angles of attack ranging from 0° to 25° to simulate the S-809 airfoil by using TEF with Micro-Tab were chosen. The position of the TEF (H = 80% C) and deflection angle (αF = 7.5°) was chosen based on airfoil S-809 with TEF results (the TEF result in Section 4.1.2); as it showed the highest aerodynamic performance. Subsequently, the TEF with Micro-Tab attachments was readjusted to S-809 with TEF (H = 80% and deflection angle αF = 7.5°).
Figure 7a shows a comparison of the different settings for the aerodynamic performance effect. As seen in the figure, the CL curves depict a gradual upward shift due to the TEF airfoil with Micro-Tab for the proposed α values and for the TEF. When α = 13°, CL was enhanced by 15% and 28.6% for Pattern 2 and Pattern 3, respectively. Figure 7b shows the variation of CD with varying α at different TEF airfoil with Micro-Tab configurations. Thus, when the TEF with Micro-Tab was positioned at both directions (up and lower flap surface), as seen in Pattern 3, the FL showed the highest values compared with the other configurations.
The analysis of the FL and FD curves described before is not comprehensive enough to design blades. Thus, a comprehensive understanding of blades’ design needs the estimation of the CL/CD ratio for the design of the wind turbine blades. The CL/CD ratio is important in determining the most appropriate angle and TEF with Micro-Tab configurations for the proposed blade design. The estimate of CL/CD based on parameters in Figure 7a,b is shown in Figure 7c. The results reaffirm that value of CL was increasing due to the TEF airfoil with Micro-Tab attachment. A possible explanation for the increase in the CL/CD ratio of an airfoil is due to TEF with Micro-Tab attachment. The CL ranged between 0.9 (Pattern 1) and 1.6 (Pattern 3) at α = 15°, and the value of CD decreased from 0.03536 to 0.03219 when the TEF airfoil with Micro-Tab was attached.
The α was readjusted between 5° to 15° to obtain the optimal effect on the CL/CD ratio, as seen in Pattern 3 in Figure 7c. Comparing the airfoil with TEF to the other patterns, no air-flow separation on the airfoil was observed at an angle less than 23°. Pattern 3 depicts the highest lifting force compared to other patterns.
A possible explanation for this might be the opposite sign vortices caused by fitting the TEF with upper/lower Micro-Tabs.
Upon closer inspection of Pattern 3, as seen in both CD (Figure 7b) and CL/CD (Figure 7c), one observes a higher aerodynamic performance (CL/CD > 35%) in comparison to the standard airfoil and other patterns. A higher aerodynamic performance results from the opposite sign vortices and, at the same time, the contribution of the low CD decreases. Another important finding is that Pattern 3 is an optimal choice when α is between 15° to 23° and for an airfoil with TEF with Micro-Tab. The high efficacy experienced for Pattern 3 is assumed to be due to the CL/CD ratio that increases by over 35% and due to the low CD contribution.
Figure 7d illustrates the CP distribution on the standard airfoil, airfoil with TEF, and TEF with Micro-Tab patterns. The CP factor of the Trailing-Edge changed when deploying TEF with Micro-Tab.
The CP factor of the Trailing-Edge changed from −1200 Pa at the TEF airfoil to 1000 Pa when TEF airfoil with Micro-Tab was attached. Correspondingly, an enhancement in the suction of the upper surface for the airfoil and an increase in the pressure at the lower surface was observed and the performance of the airfoil was increased. Finally, the configuration of Pattern 3 did not show the air-flow separation compared with the TEF airfoil. This was probably due to the separation bubble and opposite sign vortices. Therefore, the air flowed smoothly along the upper surface of the airfoil without separation.
The next section gives a detailed discussion of the pressure distribution at the small and large angles of attack for each pattern.

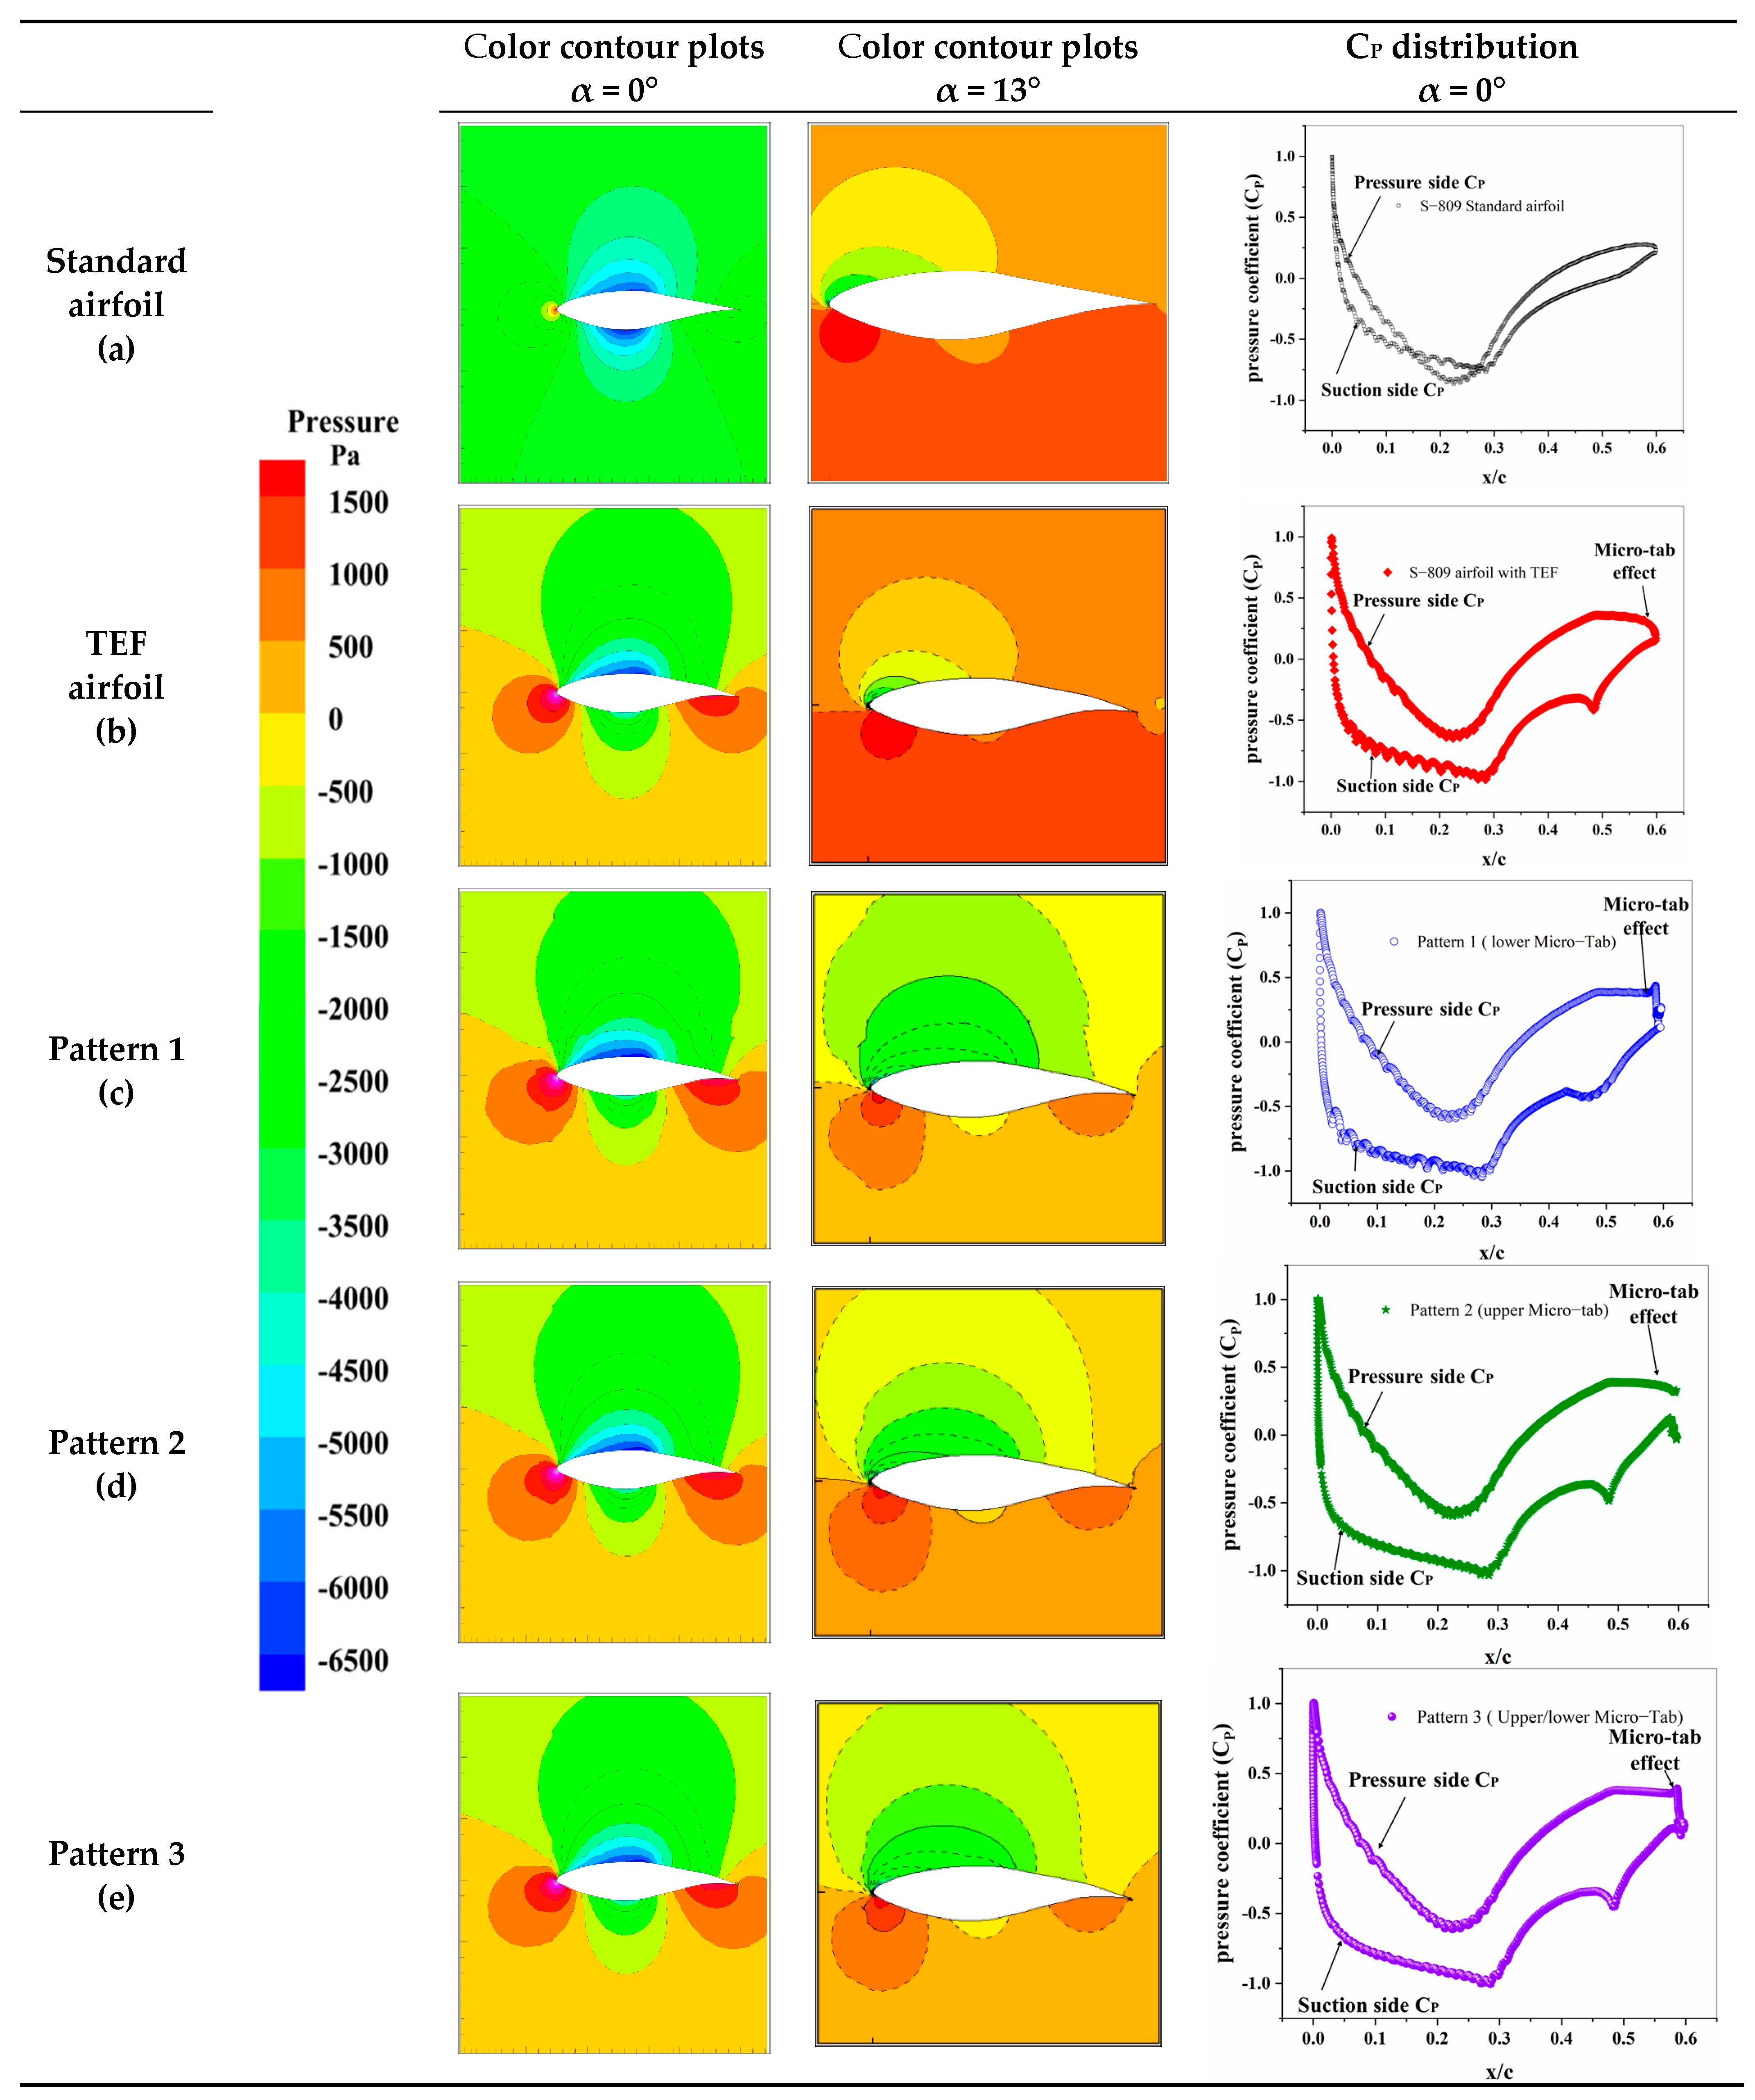
4.3. Discussion of the Surface Pressure Distribution of the TEF Airfoil with/without Micro-Tab

In order to investigate the effects of different Micro-Tab positions on the pressure distribution, contours of CP are used, as shown in Figure 8. Each subplot in Figure 8 represents the CP values as a function of airfoil chord location in the x-axis direction and the Micro-Tab positions.
The upper-pressure distribution represents the airfoil’s suction side, whereas the lower CP distribution represents the pressure side of the airfoil. The Micro-Tab position at 98% C Pattern 1 at the lower surface for the TEF airfoil, for the Pattern 2 the Micro-Tab position 98% C and the upper surface for the TEF airfoil, for the Pattern 3 the MicroTab at 98% C at the lower and upper surface for the TEF airfoil, and the TEF airfoil when there is no Micro-Tab on the airfoil S-809.
To better explain the CP displayed in this analysis at α = 0°–13°, the traditional CP polar for the TEF airfoil upper and lower sides is presented for the three patterns of the TEF airfoil with Micro-Tab that are specified by the solid and dashed lines on the color contour plots. Figure 8 displays an overview of the CP distribution corresponding to α = 0 to 13° with standard airfoil, TEF airfoil, Pattern 1, Pattern 2, and Pattern 3. These pressure distributions over the airfoil were then integrated to determine the lift (CL) and drag (CD) coefficients.
Two CP distributions are presented for two different α, which represent low and high α, respectively. Unsurprisingly, for both angles, Pattern 1 increases the pressure on the pressure side of the airfoil, Pattern 2 decreases the suction on the suction side, and Pattern 3 increases the pressure on the pressure side and the suction side of the airfoil compared to TEF airfoil and standard airfoil. A case-study approach was used to evaluate TEF airfoil’s effectiveness with Micro-Tab on pressure distributions and lift force. This effectiveness clearly comes from the increased adverse pressure gradient, opposite sign vortices, and separation bubbles generated in front of the Micro-Tab on the side on which it has been attached. On the other hand, it is important to indicate that the TEF airfoil with Micro-Tab has also changed the effective aerodynamic performance, angle of attack, and the effective airfoil camber, both of which can considerably impact the pressure distribution over both surface sides of the TEF airfoil. The Micro-Tab effect on the suction side of the airfoil is also noticeable; this appears in Pattern 1 and Pattern 3, as shown in Figure 8c,e.
Pattern 1 has improved the suction on the TEF airfoil’s top surface, even though, at the lowest α, the effect is not high, and, as the angle of attack increases, this effect becomes enhanced. Pattern 2 also affects the pressure the side of the airfoil. As observed for lower angles of attack, Pattern 2 has significantly reduced the pressure on the bottom side of the TEF airfoil, and, for the highest angles, this effect is not high. As for Pattern 3, it combined each of the features of Pattern 1 and Pattern 2. This is because both of these enhance the lower pressure of the wing and increase the lift force, as shown in Figure 8e. It is also fairly apparent that, for average angles, Pattern 1, Pattern 2, and Pattern 3 show comparable effectiveness of the aerodynamic performance on both sides of the TEF airfoil. This investigation of the pressure measurements clearly shows that the Micro-Tab’s effectiveness is not only Micro-Tab dependent but also depends considerably on the airfoil angle of attack and the TEF of the airfoil. The velocity profiles and the streamline distribution data from the CFD simulation can better clarify this dependency.

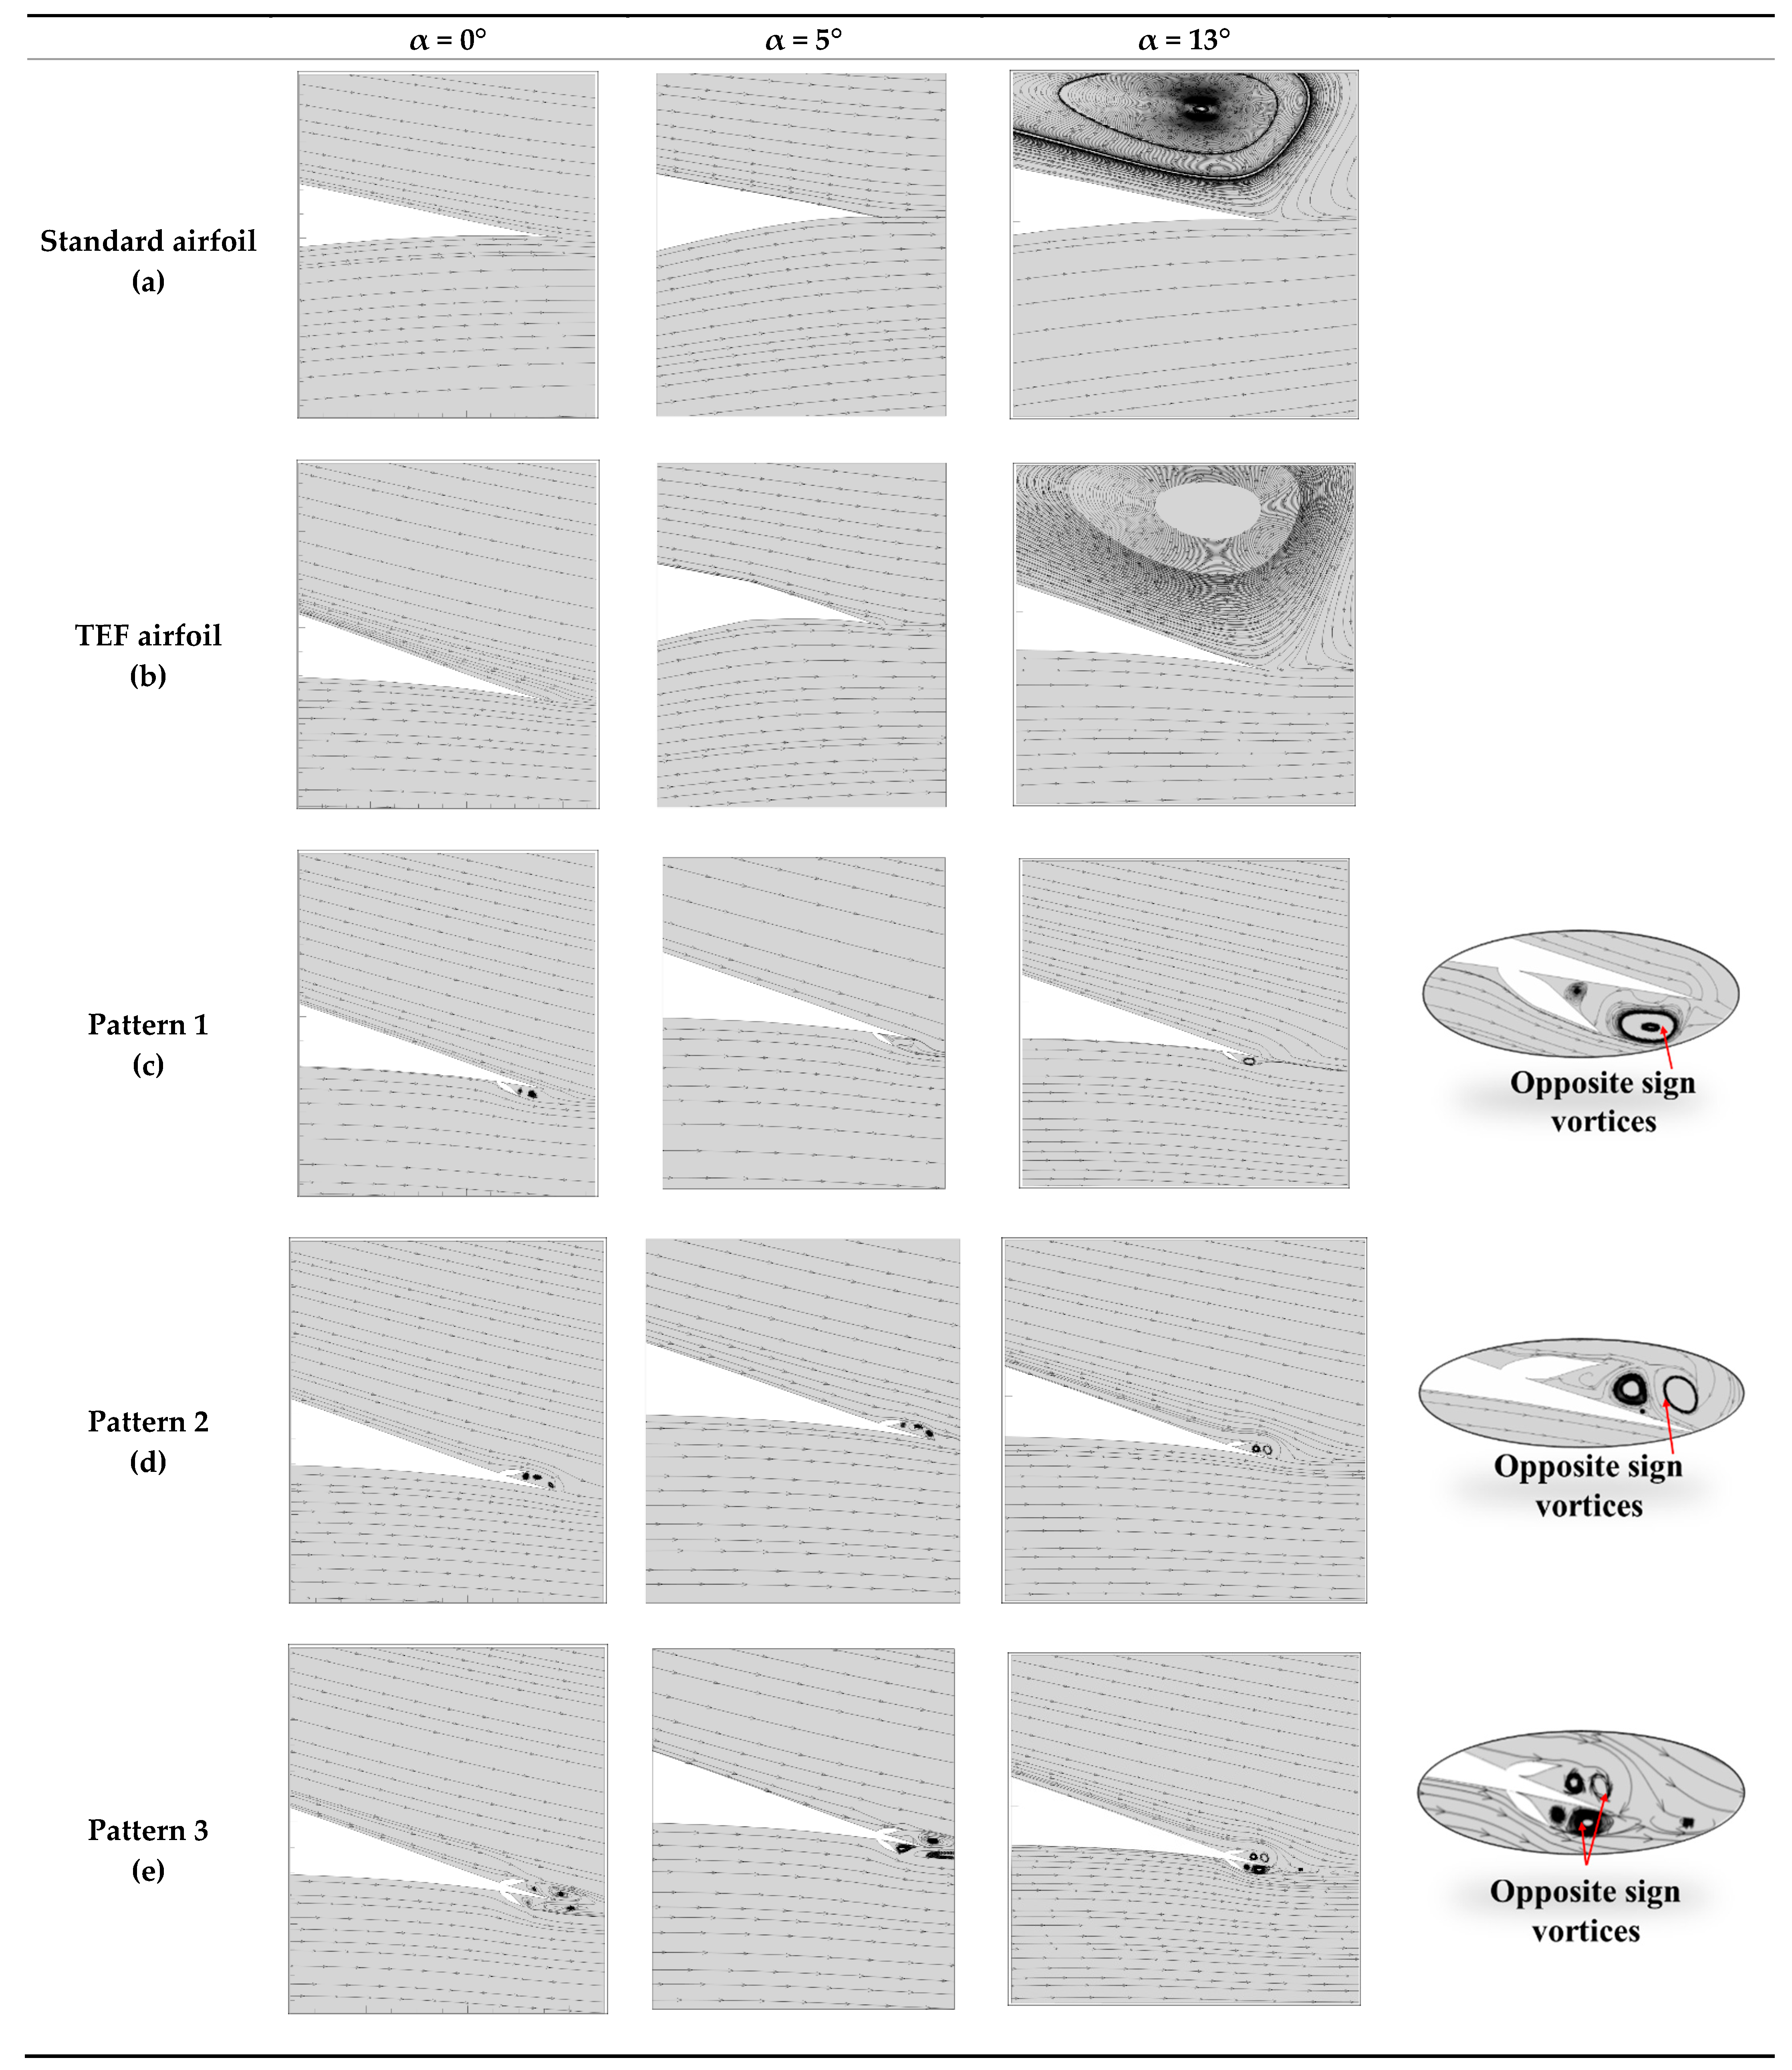
4.4. Discussion of the Streamline Distribution and the Velocity Profiles of the TEF Airfoil with/without Micro-Tab

This study identified the dependency of the angle of attack (α) of the TEF airfoil with Micro-Tab performance on the TEF airfoil. CFD results near the airfoil trailing edge are shown for different patterns in Figure 9. Each column in Figure 9 shows three different TEF configurations for the same angle of attack (α). The deflection of the airfoil trailing-edge flow when the TEF with Micro-Tab is deployed is clear for each attack angle. When Pattern 1 is attached, the findings show that the down-wash flow is more apparent, as shown in Figure 9c. This would imply that the lift is greater in these cases. On the other side, Pattern 2 decreases the down-wash flow, which insinuates a smaller lift at the small angle of attack, as shown in Figure 9d. At α = 0° Pattern 2 has induced an up-wash that implies a negative lift in this configuration. These deflections in the airfoil down-wash imply that the effective camber and angle of attack have changed. These changes significantly affect the pressure distribution and, as a result, the lift and moment behavior of the airfoil change.
Following the previous discussion that suggested the dependency of the TEF airfoil with Micro-Tab effectiveness on the angle of attack, it can be clearly observed that, at lower angles, Pattern 2 is more exposed to the flow. Concurrently, Pattern 1 is more exposed to the flow at higher angles of attack. The CFD results clearly show this dependency and support the observations in the pressure distributions. Physically, it can be inferred that, for the Pattern 1 cases at lower angles of attack, the pressure gradient on the airfoil’s pressure side is so high that the increment produced by the flap is no longer significant. As a result of configuringthe opposite sign vortices at the Micro-Tab, as shown in Figure 9c. For a higher angle of attack, when the Micro-Tab is exposed to the suction side of the airfoil, the pressure gradient on the suction side of the airfoil is so high that the Micro-Tab cannot affect the flow in a manner as significant as at smaller angles of attack; as a result, the pressure gradients are much weaker. Finally, Pattern 3 has an overall advantage because it combines Pattern 1 and Pattern 2 to the same TEF airfoil. Pattern 3 can work at both small and large angles of attack as a result of high aerodynamic performance.

5. Conclusions

This paper describes a methodology for computing the effect of TEF with Micro-Tab on airfoil sections by using CFD. A grid generation method was developed to allow an easy way for repositioning the TEF in the chord-wise direction on the S-809 airfoil. This study was able to predict the qualitative effect of TEF with Micro-Tab, and it was possible to obtain the highest aerodynamic performance at a high CP value. The findings indicated that the best pattern with the highest aerodynamic performance was provided by three patterns of TEF with Micro-Tab. Based on the above, the following may be concluded:
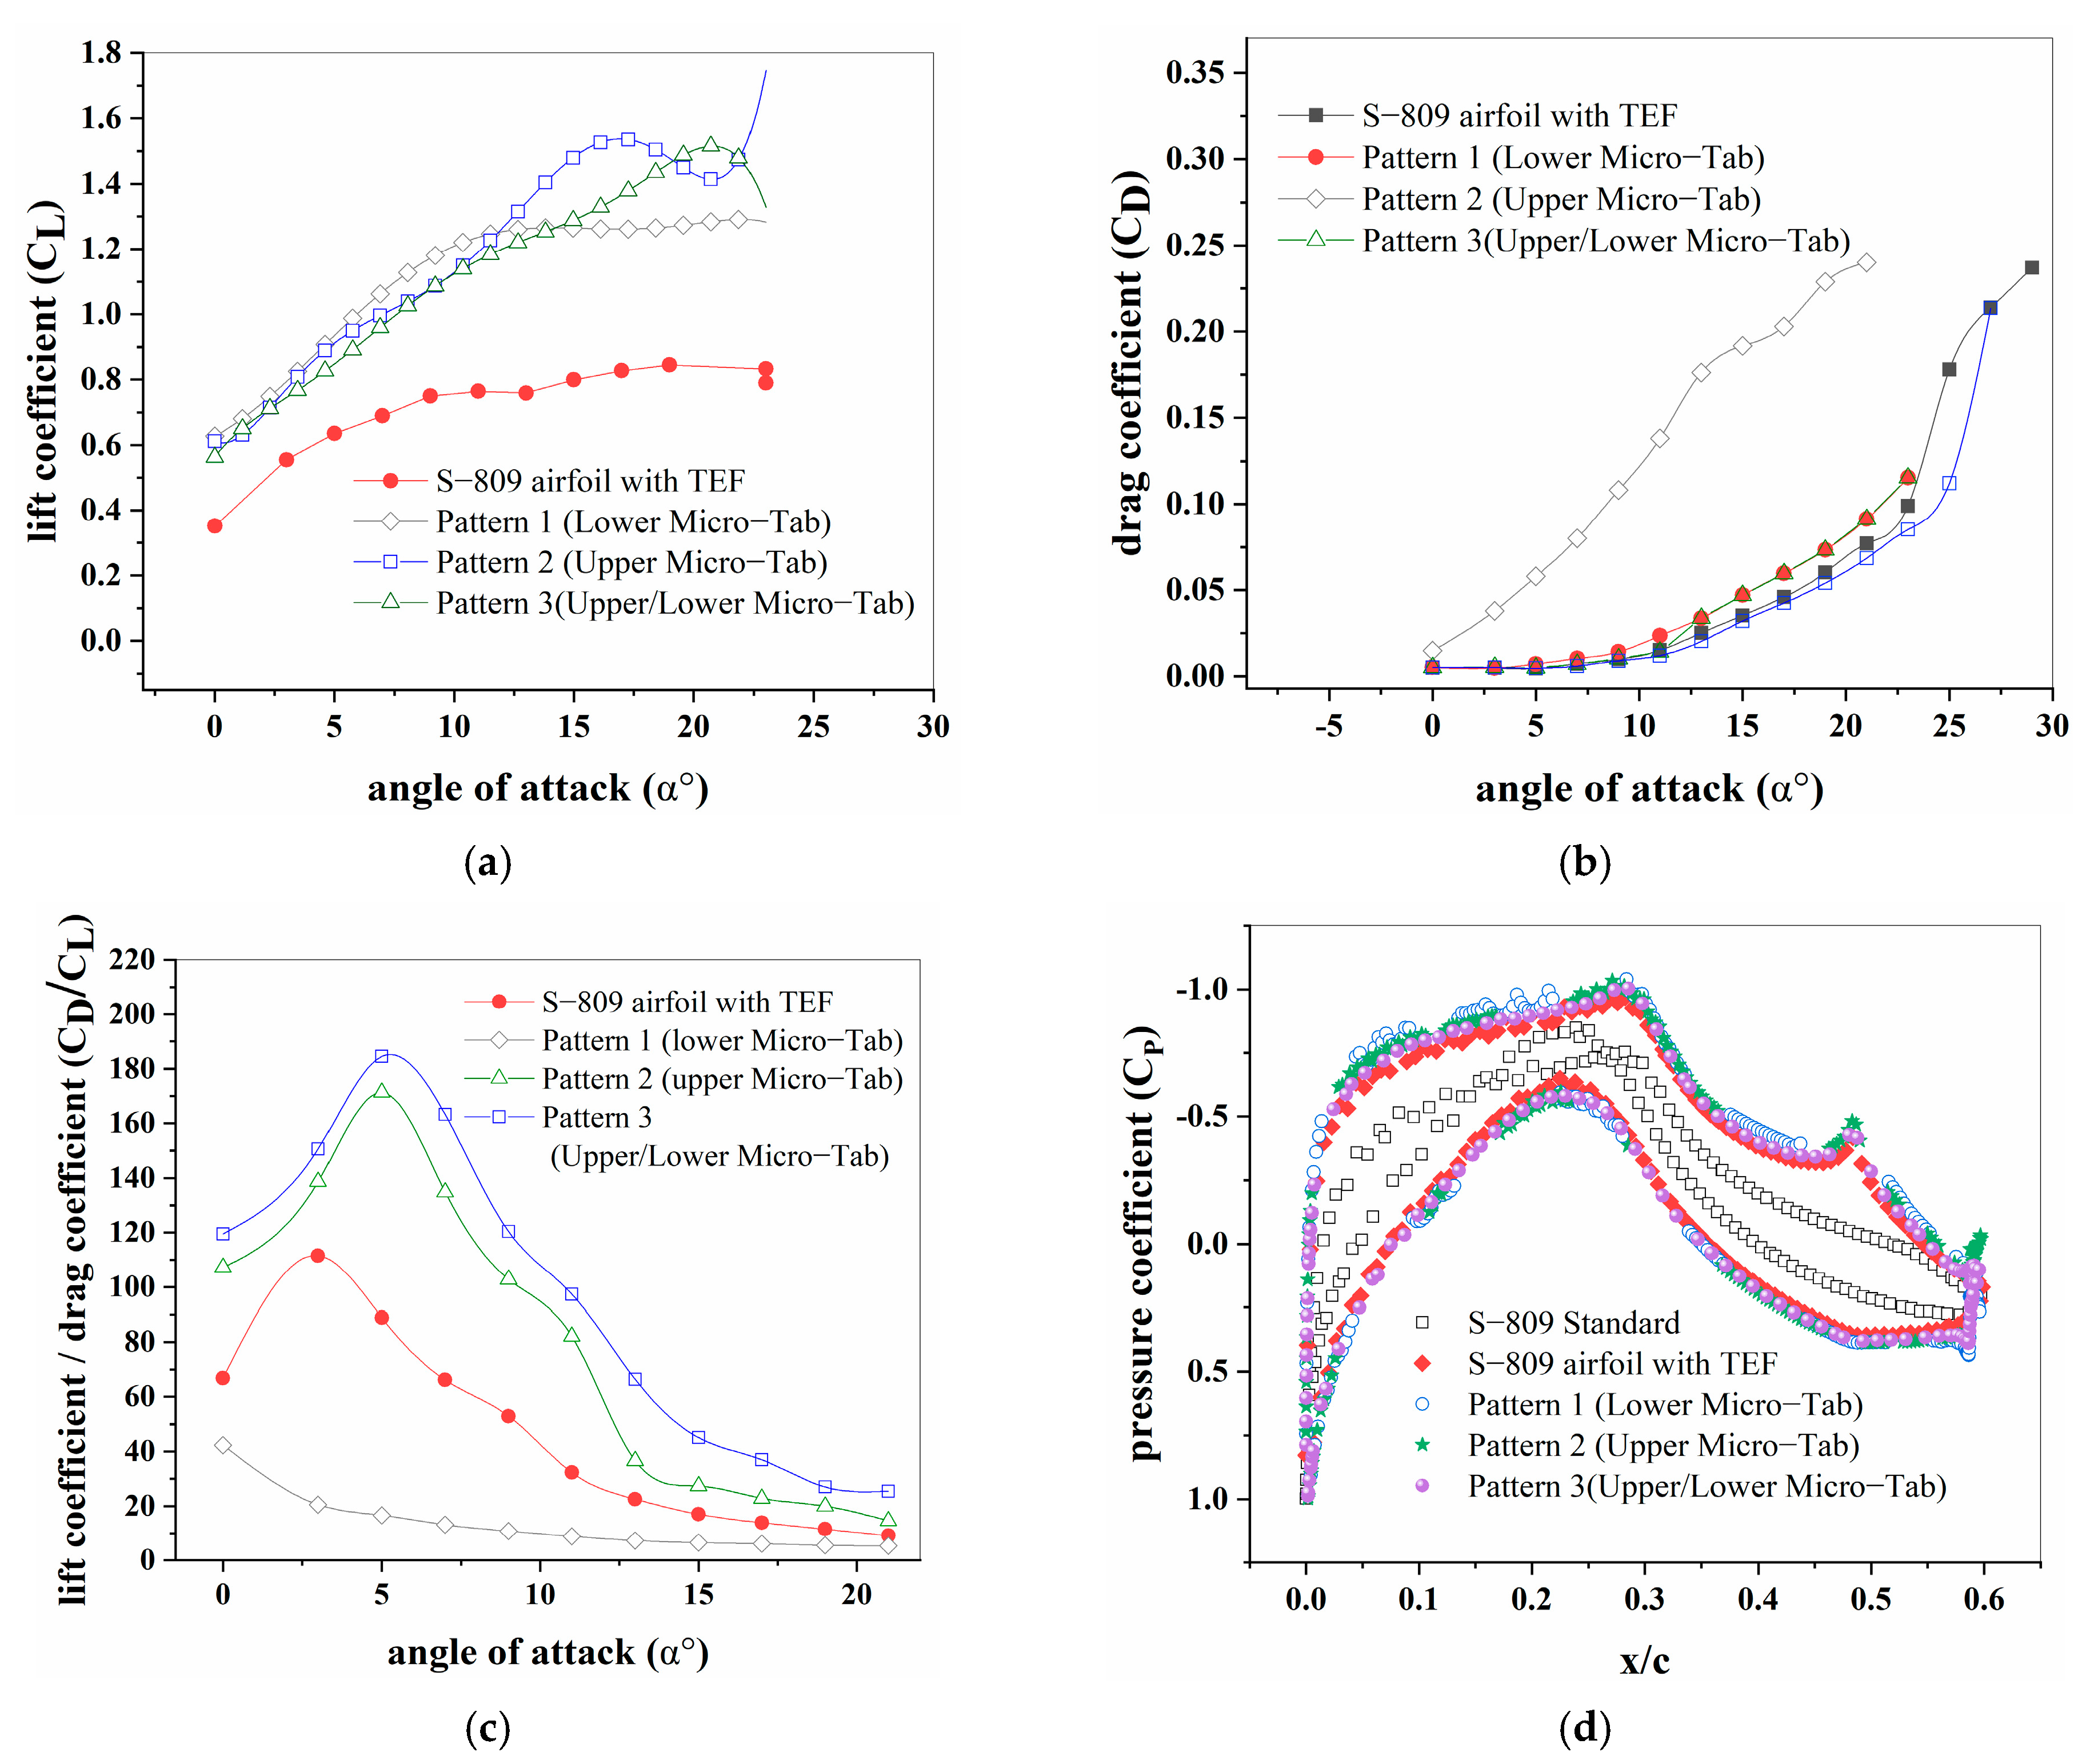
  • For the TEF study, the TEF has been deflected, and the flow has been trapped on the lower surface of the airfoil. In return, the flow velocities decreased, and there was an increase in the pressure at the lower surfaces of the airfoil. However, the increase of the adverse pressure gradient with TEF and different deflection angles αF, may yield an inverse vortex flow behind the TEF and increase the pressure at the lower surface of the airfoil and TEF. Moreover, the highest aerodynamic performance has been produced at αF = 7.5° at H = 80% C.
  • Concerning the TEF with Micro-Tab study, the numerical simulation has shown that the TEF with Micro-Tabs can significantly improve the CL of the low Reynolds number airfoil adopted in this investigation. The more obvious the TEF with the Micro-Tabs position, the larger the effect of lift-enhancement will be. Interestingly, Micro-Tabs can delay the air-flow stall at a small α ≤ 2°. At a different angle of attack α, CP and CL increased due to the bubble separation and the opposite sign vortices. Moreover, the increase of the CL has also been detected while holding a constant position of TEF at 80% C and changing the position of TEF with Micro-Tab. Therefore, the utilization of the TEF with Micro-Tab at aerodynamics H = 80%, deflection angle αF = 7.5°, and K = 95%; the CL and CP was increased, and the highest aerodynamic performance was achieved for Pattern 3.

Author Contributions

Conceptualization, J.Y. and S.S.; methodology, S.S.; software, S.S. and Y.W.; validation, J.Y., J.W. and S.S.; formal analysis, W.W.; investigation, S.S. and Z.D.; resources, J.Y.; data curation, Z.D.; writing “original draft preparation, S.S.; writing “review and editing, J.Y.; visualization, J.Y.; supervision, J.Y. and J.W.; project administration, J.Y.; funding acquisition, Y.W. All authors have read and agreed to the published version of the manuscript.

Funding

National Natural Science Foundation of China, Grant/Award Number: 51976067, the Open Foundation of the Key Laboratory of Low-grade Energy Utilization Technologies and Systems, Grant/Award Number: LLEUTS-201905, the Open Foundation of the State Key Laboratory of Fluid Power and Mechatronic Systems, Grant/Award Number: GZKF-201811.

Data Availability Statement

The data used to support the findings of this study are available from the corresponding author upon request.

Conflicts of Interest

The authors declare no conflict of interest.

Nomenclature

CAirfoil chord length (m)
CDDrag coefficient (dimensionless)
CLLift coefficient (dimensionless)
CL/CDLift coefficient/Drag coefficient ratio (dimensionless)
Cl,maxMaximum lift coefficient (dimensionless)
ReReynolds number (dimensionless)
PPressure
CPPressure coefficient(dimensionless)
HTEF position
KTEF with Micro-Tab position
αFDeflect angle of flap (°)
αAngle of attack (°)
CFDComputational fluid dynamics
TEFTrailing-Edge Flap
TEF with TabTrailing-Edge Flap Micro-Tab

References

  1. MacPhee, D.W.; Beyene, A. Performance analysis of a small wind turbine equipped with flexible blades. Renew. Energy 2019, 132, 497–508. [Google Scholar] [CrossRef]
  2. Ram, K.R.; Lal, S.P.; Ahmed, M.R. Design and optimization of airfoils and a 20 kW wind turbine using multi-objective genetic algorithm and HARP_Opt code. Renew. Energy 2019, 144, 56–67. [Google Scholar] [CrossRef]
  3. Rocha, P.C.; de Araujo, J.C.; Lima, R.P.; da Silva, M.V.; Albiero, D.; de Andrade, C.; Carneiro, F. The effects of blade pitch angle on the performance of small-scale wind turbine in urban environments. Energy 2018, 148, 169–178. [Google Scholar] [CrossRef]
  4. Chamorro, L.P.; Arndt, R.; Sotiropoulos, F. Drag reduction of large wind turbine blades through riblets: Evaluation of riblet geometry and application strategies. Renew. Energy 2013, 50, 1095–1105. [Google Scholar] [CrossRef]
  5. Aramendia, I.; Saenz-Aguirre, A.; Fernandez-Gamiz, U.; Zulueta, E.; Lopez-Guede, J.M.; Boyano, A.; Sancho, J. Gurney Flap Implementation on a DU91W250 Airfoil; Multidisciplinary Digital Publishing Institute Proceedings: Basel, Switzerland, 2018; p. 1448. [Google Scholar]
  6. Anaya-Lara, O.; Jenkins, N.; Ekanayake, J.B.; Cartwright, P.; Hughes, M. Wind Energy Generation: Modelling and Control; John Wiley & Sons: Hoboken, NJ, USA, 2011. [Google Scholar]
  7. Manwell, J.F.; McGowan, J.G.; Rogers, A.L. Wind Energy Explained: Theory, Design and Application; John Wiley & Sons: Hoboken, NJ, USA, 2010. [Google Scholar]
  8. Berry, D.; Lockard, S.; Jackson, K.; Zuteck, M.; van Dam, C. Innovative design approaches for large wind turbine blades final report. In SAND2004-0074; Sandia National Laboratories: Albuquerque, NM, USA, 2004. [Google Scholar]
  9. Jackson, K.; Zuteck, M.V.; Van Dam, C.; Standish, K.; Berry, D. Innovative design approaches for large wind turbine blades. Wind Energy Anu. Int. J. Prog. Appl. Wind Power Convers. Technol. 2005, 8, 141–171. [Google Scholar] [CrossRef]
  10. Simic, Z.; Havelka, J.G.; Vrhovcak, M.B. Small wind turbines–A unique segment of the wind power market. Renew. Energy 2013, 50, 1027–1036. [Google Scholar] [CrossRef]
  11. Barlas, T.K.; van Kuik, G.A. Review of state of the art in smart rotor control research for wind turbines. Prog. Aerosp. Sci. 2010, 46, 1–27. [Google Scholar] [CrossRef]
  12. Giguere, P.; Lemay, J.; Dumas, G. Gurney flap effects and scaling for low-speed airfoils. In Proceedings of the 13th Applied Aerodynamics Conference, San Diego, CA, USA, 19–22 June 1995; p. 1881. [Google Scholar]
  13. Fernandez-Gamiz, U.; Zulueta, E.; Boyano, A.; Fernandez-Gauna, B. Parametric study of a microtab on a DU airfoil. WSEAS Trans. Fluid Mech. 2016, 11, 121–126. [Google Scholar]
  14. Fernandez-Gamiz, U.; Zulueta, E.; Boyano, A.; Ramos-Hernanz, J.A.; Lopez-Guede, J.M. Microtab design and implementation on a 5 MW wind turbine. Appl. Sci. 2017, 7, 536. [Google Scholar] [CrossRef]
  15. Battisti, L.; Ricci, M. Wind Energy Exploitation in Urban Environment; Springer: Berlin, Germany, 2018. [Google Scholar]
  16. Li, Y.; Wang, J.; Zhang, P. Influences of mounting angles and locations on the effects of Gurney flaps. J. Aircr. 2003, 40, 494–498. [Google Scholar] [CrossRef]
  17. Jeffrey, D.; Zhang, X.; Hurst, D.W. Aerodynamics of Gurney flaps on a single-element high-lift wing. J. Aircr. 2000, 37, 295–301. [Google Scholar] [CrossRef]
  18. Li, Y.; Wang, J.; Zhang, P. Effects of Gurney flaps on a NACA0012 airfoil. Flow Turbul. Combust. 2002, 68, 27. [Google Scholar] [CrossRef]
  19. Xie, Y.; Jiang, W.; Lu, K.; Zhang, D. Numerical investigation into energy extraction of flapping airfoil with Gurney flaps. Energy 2016, 109, 694–702. [Google Scholar] [CrossRef]
  20. Wang, J.; Li, Y.; Choi, K.-S. Gurney flap—Lift enhancement, mechanisms and applications. Progr. Aerosp. Sci. 2008, 44, 22–47. [Google Scholar] [CrossRef]
  21. Troolin, D.R. A Quantitative Study of the Lift-Enhancing Flow Field Generated by an Airfoil with a Gurney Flap. Ph.D. Thesis, University of Minnesota, Minneapolis, MN, USA, December 2009. [Google Scholar]
  22. Bae, E.; Gandhi, F. Upstream active Gurney flap for rotorcraft vibration reduction. In Proceedings of the American Helicopter Society 68th Annual Forum, Fort Worth, TX, USA, 1–3 May 2012; pp. 1354–1362. [Google Scholar]
  23. Chen, H.; Qin, N. Trailing-edge flow control for wind turbine performance and load control. Renew. Energy 2017, 105, 419–435. [Google Scholar] [CrossRef]
  24. Frunzulica, F.; Dumitrescu, H.; Dumitrache, A. Numerical investigations of dynamic stall control. Incas Bull. 2014, 6, 67. [Google Scholar]
  25. Uddin, M.A.; Hasan, A.T. A CFD Analysis on the Effects of Geometry of Gurney Flap on Aerodynamics of NACA0012 Airfoil. In Proceedings of the International Conference on Mechanical Engineering (ICME2011), Dhaka, Bangladesh, 18–20 December 2011; pp. 18–20. [Google Scholar]
  26. Ashwill, T.D.; Gershin, S. CFD Calculations of S809 Aerodynamic Characteristics; Sandia National Lab (SNL-NM): Albuquerque, NM, USA, 2011. [Google Scholar]
  27. Wolfe, W.; Ochs, S.; Wolfe, W.; Ochs, S. CFD calculations of S809 aerodynamic characteristics. In Proceedings of the 35th Aerospace Sciences Meeting and Exhibit, Reno, NV, USA, 6–10 January 1997; p. 973. [Google Scholar]
  28. Bofeng, X.; Junheng, F.; Qing, L.; Chang, X.; Zhenzhou, Z.; Yue, Y. Aerodynamic performance analysis of a trailing-edge flap for wind turbines. J. Phys. Conf. Ser. 2018, 1037, 022020. [Google Scholar] [CrossRef] [Green Version]
  29. Timmer, W.; Van Rooij, R. Summary of the Delft University wind turbine dedicated airfoils. J. Sol. Energy Eng. 2003, 125, 488–496. [Google Scholar] [CrossRef]
  30. Menter, F. Two-equation eddy-viscosity turbulence models for engineering applications. AIAA J. 2002, 40, 254–266. [Google Scholar] [CrossRef] [Green Version]
  31. Menter, F.R. Two-equation eddy-viscosity turbulence models for engineering applications. AIAA J. 1994, 32, 1598–1605. [Google Scholar] [CrossRef] [Green Version]
  32. Mishra, P.; Aharwal, K. A review on selection of turbulence model for CFD analysis of air flow within a cold storage. IOP Conf. Ser. Mater. Sci. Eng. 2018, 402, 012145. [Google Scholar] [CrossRef] [Green Version]
  33. Menter, F. Zonal two equation kw turbulence models for aerodynamic flows. In Proceedings of the 23rd Fluid Dynamics, Plasmadynamics, and Lasers Conference, Orlando, FL, USA, 6–9 July 1993; p. 2906. [Google Scholar] [CrossRef]
  34. Rogers, S.; Menter, F.; Durbin, P.; Mansour, N. A comparison of turbulence models in computing multi-element airfoil flows. In Proceedings of the 32nd Aerospace Sciences Meeting and Exhibit, Reno, NV, USA, 10–13 January 1994; p. 291. [Google Scholar] [CrossRef]
  35. Yu, T.; Wang, J.; Zhang, P. Numerical simulation of Gurney flap on RAE-2822 supercritical airfoil. J. Aircr. 2011, 48, 1565–1575. [Google Scholar] [CrossRef]
  36. Zhang, P.; Liu, A.; Wang, J. Aerodynamic modification of NACA 0012 airfoil by trailing-edge plasma gurney flap. AIAA J. 2009, 47, 2467–2474. [Google Scholar] [CrossRef]
  37. Ma, D.; Zhao, Y.; Qiao, Y.; Li, G. Effects of relative thickness on aerodynamic characteristics of airfoil at a low Reynolds number. Chin. J. Aeronaut. 2015, 28, 1003–1015. [Google Scholar] [CrossRef] [Green Version]
  38. Ramsay, R.; Janiszewska, J.; Gregorek, G. Wind Tunnel Testing of Three S809 Aileron Configurations for Use on Horizontal Axis Wind Turbines; Airfoil Performance Report NREL/TP-442-7817; National Renewable Energy Laboratory: Golden, CO, USA, July 1996. [Google Scholar]
  39. Ramsay, R.; Hoffman, M.; Gregorek, G. Effects of Grit Roughness and Pitch Oscillations on the S809 Airfoil; Airfoil Performance Report DE-AC36-83CH10093; National Renewable Energy Laboratory: Golden, CO, USA, December 1995. [Google Scholar]
  40. Ramsay, R.; Janiszewska, J.; Gregorek, G. Wind tunnel testing of an S809 spoiler flap model. In Proceedings of the 35th Aerospace Sciences Meeting and Exhibit, Reno, NV, USA, 6–10 January 1997; p. 976. [Google Scholar] [CrossRef]
Figure 1. Aerodynamic performance for the streamline over the Micro-Tabs [15]. (a) Streamline over the standard airfoil; (b) streamline over the standard airfoil with a Micro-Tab.
Processes 09 00547 g001
Figure 2. Geometrical parameters (a) of Trailing Edge Flap (TEF), (b) of Trailing-Edge Flap with Micro-Tab (TEF with Micro-Tab).
Processes 09 00547 g002
Figure 3. The geometry of TEF with Micro-Tab positions: (a) 3D front view, (b) Pattern 1 with lower Micro-Tab, (c) Pattern 2 with upper Micro-Tab, (d) Pattern 3 with upper and lower Micro-Tabs.
Processes 09 00547 g003
Figure 4. Detail of the grid structure of the airfoil: (a) boundary conditions and mesh domain on the airfoil S-809 with TEF; (b) mesh domain of TEF with Micro-Tab pattern 3.
Processes 09 00547 g004
Figure 5. Mesh verification: (a) mesh independence for TEF airfoil S-809; (b) mesh independence for TEF with Micro-Tab (pattern 3).
Processes 09 00547 g005
Figure 6. Comparisons between the computational fluid dynamics (CFD) calculated and experimentally determined pressure distributions for TEF airfoil with angles of attack of 0°: (a) CL distribution; (b) CD distribution; (c) CP distribution.
Processes 09 00547 g006
Figure 7. The aerodynamic performance effect of TEF with Micro-Tab: (a) comparison of CL; (b) comparison of CD, (c) comparison of CL/CD; (d) comparison of CP distribution at α = 0°.
Processes 09 00547 g007
Figure 8. Pressure distribution and color contour plots at the α = 0°–13°, (a) S−809 airfoil, (b) TEF airfoil, (c) Pattern 1, (d) Pattern 2, (e) Pattern 3.
Processes 09 00547 g008
Figure 9. Comparison of streamline distribution of the TEF airfoil with/without Micro-Tab at three different positions, (a) Standard airfoil, (b) TEF airfoil, (c) Pattern 1, (d) Pattern 2, (e) Pattern 3.
Processes 09 00547 g009
Table 1. The parameters of the airfoil with TEF with Micro-Tab.
PatternsH%CαF (°)K (%C)TEF with Micro-Tab
Pattern 180%C7.5°95%CLower
Pattern 280%C7.5°95%CUpper
Pattern 380%C7.5°95%CUpper/Lower
Table 2. Comparisons between CFD results and experimental data for the TEF airfoil.
α°CL_SST_Kω (2 Eq.)CL_Spalart−All Maras (1 Eq.)CD_SST_Kω
CFD Calc.Exper. DataError %CFD Calc.Exper. DataError %CFD Calc.Exper. DataError %
00.566250.574182.486390.56000.574182.532140.013000.013685.23077
40.778320.7602.353790.780780.760872.467570.016550.018099.30514
80.898830.894232.071580.900331.005411.05730.029000.031458.44828
Publisher’s Note: MDPI stays neutral with regard to jurisdictional claims in published maps and institutional affiliations.

