Article

Techno-Economic Assessment of Solar-Driven Steam Gasification of Biomass for Large-Scale Hydrogen Production

1
CEA-LITEN Solar and Thermodynamic Systems Laboratory (L2ST), 38054 Grenoble, France
2
Processes, Materials and Solar Energy Laboratory, PROMES-CNRS, 7 Rue du Four Solaire, 66120 Font-Romeu, France
*
Author to whom correspondence should be addressed.
Processes 2021, 9(3), 462; https://doi.org/10.3390/pr9030462
Submission received: 16 February 2021 / Revised: 25 February 2021 / Accepted: 26 February 2021 / Published: 4 March 2021
(This article belongs to the Special Issue Extraction, Utilization and Conversion of Woody Biomass)

Abstract

:
Solar biomass gasification is an attractive pathway to promote biomass valorization while chemically storing intermittent solar energy into solar fuels. The economic feasibility of a solar gasification process at a large scale for centralized H2 production was assessed, based on the discounted cash-flow rate of return method to calculate the minimum H2 production cost. H2 production costs from solar-only, hybrid and conventional autothermal biomass gasification were evaluated under various economic scenarios. Considering a biomass reference cost of 0.1 €/kg, and a land cost of 12.9 €/m2, H2 minimum price was estimated at 2.99 €/kgH2 and 2.48 €/kgH2 for the allothermal and hybrid processes, respectively, against 2.25 €/kgH2 in the conventional process. A sensitivity study showed that a 50% reduction in the heliostats and solar tower costs, combined with a lower land cost of below 0.5 €/m2, allowed reaching an area of competitiveness where the three processes meet. Furthermore, an increase in the biomass feedstock cost by a factor of 2 to 3 significantly undermined the profitability of the autothermal process, in favor of solar hybrid and solar-only gasification. A comparative study involving other solar and non-solar processes led to conclude on the profitability of fossil-based processes. However, reduced CO2 emissions from the solar process and the application of carbon credits are definitely in favor of solar gasification economics, which could become more competitive. The massive deployment of concentrated solar energy across the world in the coming years can significantly reduce the cost of the solar materials and components (heliostats), and thus further alleviate the financial cost of solar gasification.

1. Introduction

Today, around 96% of hydrogen is generated from fossil fuels (78% from natural gas and liquid hydrocarbons and 18% from coal) and only a low proportion of 4% is generated from water electrolysis [1]. In industry, hydrogen is mostly generated using carbon-based CO2-emitting methods, such as steam reforming of light hydrocarbons, partial oxidation (POX) and autothermal reforming (AR) (which is a combination of the two previous processes) followed by coal gasification. Although extremely dependent on the price of natural gas, steam reforming remains the most preferred pathway for H2 production given that it reached a high state of maturity outlined by lower production costs, usually below 2 $/kg of H2, including CO2 capture and sequestration [2,3].
Currently, the largest volumes of hydrogen, produced or commercially available, are consumed in the chemical industry with a share of 63% for the production of ammonia, methanol, polymer and resin industries. Refineries are the second largest hydrogen consumers with a share of more than 30%, mainly for hydrocracking and crude oil hydrotreatment. Metallurgical industry consumes around 6% of the share. It is followed by general industries such as semiconductor, glass production, hydrogenation of vegetable oils and fats, etc., with a minor share of 1% [4].
Hydrogen, used as an intermediate chemical species for the above-mentioned processes, is also seen as a promising zero-carbon footprint energy vector for massive storage of intermittent renewable energies. Clean, i.e., CO2-neutral hydrogen, can be produced using biomass or/and water as primary feedstocks. The most mature methods for decarbonized H2 production are water electrolysis and steam biomass gasification [5]. Possibly powered by a renewable energy source such as solar or wind, electrolysis uses an electrical current to split water electrochemically into separate streams of H2 and O2. Being commercially available for over a century, current commercial electrolysers reach single-stack/module capacities of several megawatts with conversion efficiencies up to 85% [6]. Biomass gasification has advantages from the extensive accumulated experience of fossil fuels thermochemical gasification, which represents the state-of-the-art for industrial-scale H2 generation. Biomass steam gasification produces a synthesis gas composed of both H2 and CO at a high temperature (>900 °C). The syngas, therefore, needs to be upgraded (shifted to hydrogen) and purified in downstream equipment. According to the IEA Bioenergy’s report in 2018 [5], hydrogen production from biomass, as a complementary route to increase the share of renewables, cannot be accomplished without the full-process chain validation at a large scale, involving an optimal biomass gasification technology capable of treating and converting a wide range of feedstocks.
Considering the growing demand of biomass in the future, the optimization of the conversion systems to make the best use of biomass is an absolute necessity. A promising way to save the biomass resource while maximizing the yield, quality and purity of the synthesis gas consists of using concentrated sunlight as an external source of energy to drive the endothermal thermochemical reactions instead of continually burning a part of the feedstock. The process goal is to replace feedstock combustion totally (solar-only systems) or partially (hybrid solar/autothermal systems), thanks to external heating using high-temperature concentrating solar technologies.
The solar process viability for coal and biomass gasification has been thoroughly studied at both laboratory [7,8,9,10,11,12,13] and pilot scales [14,15,16]. Accordingly, the extrapolation of these solar technologies to larger scales for semi-central or centralized green solar hydrogen production is auspicious in the future, in view of the increasing decarbonized hydrogen demand. Although more environmentally friendly than the conventional autothermal biomass gasification process (because it avoids the use of part of the biomass source for process heat), the question of the solar process’s economic feasibility and competitiveness arises. On the one hand, the solar process allows for the production of a high-quality synthesis gas with a higher gas output per unit of feedstock, and on the other hand, the solar process is highly dependent on an intermittent heat source, which requires an initial substantial investment. The question is, therefore, not simple, and requires detailed investigation to highlight both technical aspects related to the management of the heat source variability [17,18,19,20] and economic and financial aspects for accurate cost evaluation [21,22,23]. In a previous work [19], a dynamic mathematical model of an up-scaled MW steam solar gasifier was developed. The model was used to assess the transient behavior of the reactor for three successive days with and without cloud cover. Different reactants’ feeding management strategies were proposed and compared, with the aim of achieving enhanced syngas productivity and optimized use of solar energy. The OPTI mode controlled the supplies (biomass and steam) in order to stabilize the reactor temperature around a set point value (assumed to be 1200 °C) for as long as possible. The HYB production mode used the OPTI mode when the solar irradiation was sufficiently high, to gasify a minimum biomass flow rate (e.g., 1 t/h). Otherwise, the solar heating was assisted by in situ injection of O2 to counteract the solar power decline and to maintain the reactor temperature constant all day long. Annual data were generated thanks to the dynamic model to estimate the feedstock consumption and syngas productivity under real solar irradiation conditions.
In the present work, a techno-economic study was carried out using the dynamic model predictions regarding the yearly gas production with the two recalled control strategies (OPTI and HYB). H2 cost at plant gate for the autothermal (non-solar), hybrid (solar/optimized-combustion) and allothermal (solar-only) processes operating at different design capacities is evaluated using the DOE’s H2A tool for hydrogen cost analysis [24]. Furthermore, a sensitivity study is performed to establish the impact of different factors on the cost of hydrogen. Finally, the cost of hydrogen is compared with other solar and non-solar processes for H2 generation.

2. Solar Hydrogen Cost Model

2.1. General Principle

The DOE’s H2A tool used in this study is based on the Discounted Cash Flow (DCF) rate of return method. DCF analysis finds the present value of expected future cash flows using a discount rate. The Internal Rate of Return (IRR) is the discount rate that cancels the Net Present Value (NPV). The NPV calculation (Equation (1)) converts all the expected future cash flows of a project into their “present value”, i.e., their value at the initial time, at the very beginning of the project. Then, all the present values are added together to characterize the overall value of the company’s project, in other words, the profitability of the project. The NPV is the cash flow generated at the end of the project
N P V = I + p = 1 p = N F p ( 1 + i ) p
with I, the investment, Fp, the cash flow for year p, N, the total duration of the project (years), ‘i’, the discount rate (it reflects the cost of capital, so it may take the value of the market interest rate for a comparable duration, even though this value is often discussed). In the DOE’s tool, ‘i’ is fixed and the model calculates the minimum hydrogen price so that the NPV cancels.
The starting point is a reference conventional (non-solar) biomass gasification process, previously developed by Mann and Steward [25]. The minimum cost of hydrogen was calculated with an indirectly heated steam woody biomass gasifier (based on a dual fluidized bed technology). The process model included biomass treatment and injection units, the reactor, gas compressors and scrubbing units, followed by a steam methane reformer (SMR), water gas shift reactors (WGS), and a Pressure Swing Absorption (PSA) unit to reach a hydrogen purity above 99.9%. Hydrogen was thereafter compressed to 7 MPa prior to shipment through a pipeline. In order to minimize the plant water consumption, the water contained in the syngas was recovered at different points of the cycle. Moreover, part of the electricity needed by the chemical plant was generated by recovering heat from the high-temperature syngas. A heat-recovery system using a steam turbine and a generator was, therefore, coupled to the chemical units. More details about the energy/material inflows and outflows can be found in [25]. The solarization of such a chemical process impacts a number of factors, including the capital investment, the O&M costs, and the plant biomass, water and electricity consumptions. These factors were estimated and integrated with the previously developed cost model using the dynamic simulation results (for yearly productivity estimation), as well as the previously reported Concentrated Solar Tower (CST) plants’ operational costs.

2.2. Cost Model Assumptions

2.2.1. Basic Flow Diagram

The solar powered chemical process was modeled using the measured solar data (averaged over a 19-year period: 1991–2010) in Odeillo, in France. This region is characterized by a high duration and quality of sunshine (more than 2.2 MWh/m2.year) with a great clarity of atmosphere.
The basic process flow diagram is described in Figure 1. It consisted of a solar plant composed of a heliostat field and reflecting towers (beam-down technology), and of a chemical plant for biomass gasification and gas processing/purification. The gasifier was fed by both steam and air. Air injection was considered only when operating in full autothermal or in hybrid (solar-combustion) modes. In the model, gas cleaning and upgrading chemical units (such as WGS and PSA) were assumed to be able to withstand rapid changes in gas flows and composition. WGS aims to react CO with H2O to produce H2 and CO2, while PSA is used to obtain a pure H2 stream as a process output. The PSA off-gas thus has no calorific value because CO is first shifted to H2 in the WGS unit, which means the calorific value of CO contained in the produced syngas is recovered in the form of H2 after WGS. As the aim was here to yield pure H2 (for purpose of comparison with other H2 production methods), the remaining PSA off-gas was not further considered in the study (the remaining PSA off-stream would consist of mainly CO2 and N2, but further post-processing was not included).

2.2.2. Capital costs

(i)
Direct capital costs:
The major chemical component costs (installed) at the chemical baseline (defined by a design capacity DC of 155,236 kg of H2 per day) are presented in Table 1.
These costs were scaled to different design points using Equation (2).
C o m p o n e n t i c o s t a t   D C = C o m p o n e n t   a t   c h e m i c a l _ b a s e l i n e     c o s t · ( D C C h e m i c a l _ b a s e l i n e   D C   ) n c h e m i c a l
with nchemical = 0.78 [25] and DC in kg of H2 per day.
The heliostat field cost at DC was calculated by Equation (3).
H e l i o s t   c o s t a t   D C = M i r r o r   r e f e r e n c e   c o s t . f i e l d   s u r f a c e   a t   D C
f i e l d   s u r f a c e   a t   D C = f i e l d   s u r f a c e   a t   s o l a r _ b a s e l i n e · D C   S o l a r _ b a s e l i n e O P T I , H Y B   D C  
The mirror reference cost in €/m2 was assumed to be equal to 120 €/m2 based on reference [26]. The solar baseline was defined by a thermal power input on the solar field of 10 MWth (at a Direct Normal Irradiance DNI of 1000 W.m−2). Thus, Solar_baseline OPTI, HYB DC was directly deduced from the previously developed dynamic model [19]. It was estimated at 1402.0 kg H2/day for the OPTI mode and 4196.1 kg H2/day for the HYB mode. The field surface at solar_baseline in m2 was calculated by Equation (5).
f i e l d   s u r f a c e a t   s o l a r _ b a s e l i n e   = Q s u n f i e l d , m a x D N I m a x  
with Qsun→field,max = 10 MW and DNImax = 1000 W.m−2.
Similarly, the tower cost at DC was calculated by Equation (6).
t o w e r   c o s t a t   D C = t o w e r   c o s t a t   s o l a r _ b a s e l i n e ·   D C S o l a r _ b a s e l i n e O P T I , H Y B   D C        
As tower costs in the literature are often expressed in € per MWe, tower cost at solar_baseline was deduced from Equation (7), assuming a solar-to-electric efficiency ηsolar-to-electric of 30% [27] including the receiver thermal efficiency and a field efficiency ηopt,field of 70% [28].
t o w e r     c o s t a t   s o l a r _ b a s e l i n e     = t o w e r   c o s t   i n   / 10   M W e · ( η o p t , f i e l d · η s o l a r t o e l e c t r i c )    
Tower cost per 10 MWe was considered equal to 2 M€ based on the data provided by Becker et al. [29] in the Ecostar roadmap;
(ii)
Indirect depreciable capital costs:
The site preparation, engineering and design, project contingency and up-front permitting costs were calculated by applying a percentage to the sum of the direct capital costs of the overall plant (solar and chemical). These percentages were, respectively, 2%, 10%, 15%, 15%;
(iii)
Non-depreciable capital costs:
The cost of land, which can greatly vary depending on the plant’s location, was varied from 0.5 to 50 €/m2. A typical serviced land in Odeillo costs up to 150 €/m2 while bare land in rural regions costs only few cents to few euros per m2. Equation (8) was used to estimate the plant land cost.
L a n d   c o s t   = C h e m i c a l   l a n d   c o s t   + S o l a r   l a n d   c o s t
The chemical land cost was calculated by Equation (9).
C h e m i c a l   l a n d   c o s t   = l a n d   c o s t   p e r   m 2 . ( D C   C h e m i c a l _ b a s e l i n e   D C   ) n c h e m i c a l   . C h e m i c a l .   l a n d   r e q u i r e d a t   C h e m i c a l _   b a s e l i n e
where the chemical plant land required at baseline design capacity was assumed equal to 20.2 hectares. The solar land cost was calculated by Equation (10).
S o l a r   l a n d   c o s t   = l a n d   c o s t   p e r   m 2 . s o l a r   f i e l d   s i z e a t   D C
The solar field size at DC was considered seven times the field surface at DC (Equation (4)) according to the PS10 plant data in Spain [30].

2.2.3. Fixed Costs

The total plant staff was calculated by Equation (11).
P l a n t   s t a f f = C h e m i c a l   p l a n t   s t a f f + S o l a r   p l a n t   s t a f f
C h e m i c a l   p l a n t   s t a f f =   c h e m i c a l   p l a n t   s t a f f a t   C h e m i c a l _   b a s e l i n e ·   D C   ( k g   H 2 / d a y ) C h e m i c a l _ b a s e l i n e   D C   ( k g   H 2 / d a y ) 0.25
The chemical plant staff at chemical_baseline was considered equal to 54. The CST plant associated one operator for each 6.25 hectares of mirrors, following the equation provided by Sargent and Lundy [31]. The total plant staffing cost was thus deduced, assuming a burdened labor cost of 54 €/person/h. The general and administrative expenses were estimated as 20% of the total plant staffing cost. The property taxes and insurance were assumed to be equal to 2% of the total capital costs, and the material maintenance costs and repairs were assumed to be equal to 0.5% of the project direct capital costs.

2.2.4. Utilities, Feedstock and Variable Costs

(i)
Water:
Water was used for different purposes, beyond its main role as a biomass oxidizer. Water was used to clean (by removing impurities such as particulates and tars residuals) and to shift the syngas into hydrogen. An important amount of water was also used for the cooling of syngas at the exit of the gasification unit and after the last stages of compression. It was also substantially used for heat rejection in the condenser and as a makeup for the steam cycle. Design calculations allowed for estimation of the process water consumption at about 3.8 L/kg of H2. The cooling water consumption was considerably higher, at around 300.0 L/kg of H2 [25]. Additional washing water was required for the solar-powered chemical plant due to the periodic cleaning of the mirrors. Considering a washing water consumption Vwater of the heliostat field of 18 L/MWhth,on field [32], the amount of required water per kg of H2 was deduced from Equation (13). The total cost of water per kg of H2 was hence calculated by Equation (14)
W a s h i n g   w a t e r     = V w a t e r · Q s u n f i e l d , m a x     S o l a r _ b a s e l i n e O P T I , H Y B   D C    
C o s t   o f   w a t e r   = ( W a s h i n g   w a t e r + P r o c e s s   w a t e r ) .   C 2 + C o o l i n g   w a t e r .   C 3
with C2 = 6.1 × 10⁻⁴ €/L and C3 = 3.0 × 10⁻⁵ €/L;.
(ii)
Electricity:
The different chemical plant sections consumed electricity to different extents. The compression of syngas was the most energy-demanding step in the process, representing up to 60% of the total electricity requirement. The heat recovery system generated most of the power. The deficit in electricity was, therefore, directly supplied by the grid. In conventional CST plants, the electrical requirement comprises the Heat Transfer Fluid (HTF) pumping, along with the electricity used for tracking the solar rays, which remains very low. As there is no HTF in the proposed solar gasification concept, and as the energy of the tracking is of minor significance [33], the electricity requirement of the solar plant was neglected. The overall process electricity requirement (supplied by the grid) was estimated in the previous cost model [25] at 0.98 kWhe/kg of H2, with a cost of electricity of 0.1 €/kWh;
(iii)
Biomass:
Biomass consumption varies depending on how the gasifier is heated. In solar gasification, the available solar energy is collected, then concentrated by a field of mirrors and towers to ensure the complete and total conversion of the biomass load. In a purely autothermal mode, the reactor is heated solely by burning part of the feedstock. In the hybrid mode, the biomass is partially burned, but to a lesser extent than in pure autothermal mode, as it is complemented by solar power when available. The prediction of the biomass consumption (expressed in kgbiomass,dry/kg of H2) for the three modes, OPTI, HYB and autothermal, was done based on the annual simulations. The biomass consumption of the three modes (OPTI, HYB, autothermal) used in the economic analysis are, respectively, 5.8, 8.7, and 9.7 kgbiomass,dry/ kgH2;
(iv)
Other costs:
Other costs include catalysts and bed materials, environmental surcharges, waste treatment and solid waste disposal. These costs are recalled in Table 2 at the chemical baseline design capacity.
The scaling to different design capacities followed Equation (15) [25].
S c a l e d   v a r i a b l e   c o s t = 1.426 . B a s e l i n e   c o s t · D C   ( k g   H 2 / d a y ) C h e m i c a l _ b a s e l i n e   D C   ( k g   H 2 / d a y )  

3. Results and Discussion

3.1. Design Parameters

Table 3 shows the calculated design parameters in the three plant configurations.
The plant land surface area dramatically increases by 12 times in the hybrid mode and by up to 37 times in the allothermal mode. The solar power is, therefore, 67% lower in the hybrid mode compared to the allothermal mode, at the expense of a greater biomass requirement. In fact, around 0.43 × 10³ t/day more biomass is needed to power the reactor during hybrid and full-autothermal phases, which represents about 30% of the total feedstock consumed by the hybrid process. The interest in the allothermal process lies in its high CGE, which by far exceeds those of the hybrid and autothermal processes. The process water requirement, which includes the heat-recovery system for local power generation, is hardly impacted by solarization, as water consumption due to mirror cleaning represents only a small proportion of the total plant water requirement. CO2 direct emissions due to gasification process (reactor heating and/or gasification reaction) are, on the other hand, 35 times lower in allothermal solar gasification because no combustion is used for process heat supply in this case. The overall carbon balance includes additional greenhouse gas emissions, which are released during the different phases of the solar plant’s life-cycle, i.e., during raw material extraction, manufacturing and assembly, transport, construction, site improvement, maintenance, replacements, dismantling/disposal and/or recycling. The application of credits for CO2 mitigation and pollution avoidance will further enable the solar thermochemical technologies to compete favorably with fossil-fuel-based processes or autothermal technologies.

3.2. Cost Assessment

3.2.1. Key Parameters

The project was assumed to start in 2030 with a construction period of three years. It was financed through equity contributions and debt. All the financial inputs used in the economic study are recapped in Table 4. Hydrogen cost evaluation was carried out with a fixed operating capacity factor (CF) of 80% (accounting for possible maintenance and outage times). Due to the novelty of the project that may discourage some of the investors, the IRR was varied from 8% to 16%. The impact of equity financing (%) and the IRR on the cost of hydrogen for the three presented configurations is shown in Figure 2 (at a DC of 150,000 kg H2/day, a biomass reference price of 0.10 €/kg and a land cost of 12.9 €/m2). Due to the possible variability of the reference values for investment and operational costs estimations (depending on seasonal variations, biomass type, plant location, exploitation period, etc.), several sensitivity studies are proposed in the following discussion.
It can be seen that these two purely financial parameters have a considerable impact on the price of hydrogen, which varies from 2.41 to 5.15 €/kgH2 for the solar-only heated process, from 2.15 to 3.72 €/kgH2 for the hybrid process, and from 2.03 to 3.02 €/kgH2 for the autothermal (non-solar) process. The increase in equity financing (at the expense of less incurred debt) drives up the cost of hydrogen markedly; for instance, for an IRR of 8%, an equity increases from 0% to 100% raises the cost of hydrogen by 37%, 25% and 18% (solar-only, hybrid, and autothermal, respectively). The influence of equity percentage on hydrogen price is, therefore, much greater for the allothermal process that required the largest initial capital investment. In such cases, the capital investment of the major pieces of equipment (installed) at DC = 150,000 kg H2/day is 335.7 M€, while it is around 201.0 M€ for the hybrid process and only about 137.01 M€ for the non-solar autothermal process. The new shares issued by the increase in equity contributions hence provide more room to launch the investments, but, on the other hand, imply greater production costs.
In the following, a percentage of equity of 40% with an IRR of 10% is considered. The overall study reference assumptions are recapped in Table 5. The breakdown of the direct capital costs of the studied plants is shown in Figure 3. In the solar-driven processes (solar-only and hybrid solar/autothermal), the heliostat fields hold the largest share of the investment. It contributes to approximately 44% (solar-only) and 24% (hybrid) of the overall direct costs, in agreement with previously reported conventional CST plant values [34,35]. The smallest solar plant size required for the hybrid process leads to a reduced hydrogen price from 2.99 (allothermal) to 2.48 €/kgH2 (hybrid). The autothermal process is the cheapest, with a hydrogen price of 2.25 €/kgH2.
Figure 4 shows, in detail, the specific contribution of each item in the plant on the total cost of hydrogen. Solarization respectively increases the capital and the O&M costs by more than three times and up to 46% (in the allothermal configuration). Moreover, the feedstock cost for the hybrid and the autothermal processes is the most predominant, and contributes to nearly 37% and 39% of the total hydrogen production cost (at plant gate). The allothermal process consumes less biomass, and, therefore, the feedstock cost is lower, representing barely 20%. This is approximately 1.6 times less than for the autothermal process. The impact on the plant variable costs and utilities remains very limited, showing a relative variation of only 2%.
In the following sections, the influence of solar investment and biomass feedstock costs, as major economic factors affecting the minimum hydrogen price, is studied. A sensitivity analysis is carried out on these parameters to examine their impact on the profitability, the competitiveness and the relevance of the projects.

3.2.2. Impact of Solar Investment

The solar investment represents a high proportion of the overall project expenditure, which may be high enough to undermine the economic attractivity and viability of solar processes. In coming years, and in view of the increasing deployment of solar energy worldwide, the solar investment effort is expected to drop appreciably [26]. In fact, innovative designs and new technological solutions are studied intensely at present in many research laboratories with the objective of increasing the concentration efficiency and the durability of the materials. In conjunction with the economy of scale, this should reduce the solar costs to a certain extent, for the benefit of solar and solar hybrid gasification. In this respect, the influence of a possible cost reduction of the main solar compounds (i.e., heliostat field and towers) on the minimum hydrogen price was studied (Figure 5).
It can be observed in Figure 5 that the solar allothermal process is the most costly. Moreover, the decline in the heliostat and tower costs results in reducing the hydrogen minimum price in a more pronounced fashion in the allothermal configuration. In fact, a 50% cost reduction declines the price of hydrogen by 0.37 €/kgH2 for the allothermal process, and by 0.12 €/kgH2 for the hybrid process. The intersection between the two curves is achieved only when the cost reduction is beyond 95%, which is practically unattainable. In any case, and whatever the cost reduction, solar and solar hybrid hydrogen generation remains more expensive as compared to the conventional autothermal process, which is due to major additional costs related to the heliostat field and tower, plant land, maintenance and staffing. Design calculations allowed for estimating the total area occupied by the solar plants (allothermal and hybrid): the heliostat field surface at DC = 150,000 kg H2/day is estimated at 11.5 km2 for the allothermal process and at 3.9 km2 for the hybrid process. This represents nearly 57 and 20 times the required chemical plant land surface. Figure 6 shows the impact of the land cost (varied between 0.5 and 50 €/m2) on the hydrogen minimum price. The graphic shows the importance of the choice of land, which, apart from being highly irradiated and allowing for continuous biomass supply, must be economically profitable. In fact, a quite significant decrease in the cost of hydrogen from 2.99 €/kgH2 at reference land cost (12.9 €/m2) to 2.63 €/kgH2 at 0.5 €/m2 is observed for the allothermal process. As the hybrid plant occupies a smaller area, the hydrogen minimum price decreases less markedly, by 0.16 €/kgH2 against 0.36 €/kgH2, in the allothermal process. On the other hand, the autothermal configuration is almost insensitive to land cost, showing a relative H2 price variation of less than 0.5%. Additionally, a 50% reduction in the heliostats and solar towers costs, combined with a lower land cost below 0.5 €/m2, allows for reaching an area of competitiveness where the three processes meet. This could also correspond to a more favorable plant site in which the solar resource is greater, e.g., Chilean desert, although the cost of water may be somewhat higher in desert locations.
Another important parameter affecting the level of solar investment is the plant design capacity. This parameter was varied in Figure 7 from 20,000 to 150,000 kg H2/day to analyze its impact on the solar/chemical direct costs and on the hydrogen minimum price.
It can be observed that the solar direct costs of allothermal process grow at least two times faster than the hybrid process solar direct costs and the chemical facilities costs (reaching a maximum value of 202.3 M€). Conversely, the increase in plant design capacity reduces the hydrogen minimum price by up to 25%, 34%, and 39% for the allothermal, hybrid, and autothermal processes, respectively. Additionally, due to the sharp rise in the solar facility costs, the relative difference in hydrogen minimum price between the solar processes and the autothermal process goes up from 18% (allothermal) and 6% (hybrid) at 20,000 kg H2/day to 32% (allothermal) and 10% (hybrid) at 150,000 kg H2/day. This suggests that, upon scale-up, the competitive gap between the conventional and the solar processes increases. However, this may be due solely to the linearity assumption that was adopted in (Equations (3)–(6)) between the solar costs and the production capacity. As a matter of fact, solar costs prediction is not straightforward and relies on uncertain data. Generally speaking, heliostats field scale-up depends on many factors, such as the design of individual mirrors, their number, their arrangement, their sub-composition and their reflective properties. Larger solar fields impair the quality of concentration and suffer from amplified atmospheric attenuation (due to a greater heliostat-to-receiver slant path) [36]. At the same time, larger solar fields involve higher solar power inputs that allow the use of larger cavity receivers (i.e., gasification reactors), which reduce the energy losses (due to a better absorption of radiation), and thus positively impact the solar costs. A power law with a global scaling exponent factor of 0.7 accounting for these trends was previously used by Kromer et al. [37] for assessing hydrogen cost of several solar thermochemical processes. The impact of this value on the solar costs and on hydrogen minimum price is shown in Figure 7 (scaling exponent factor = 1 in the base case and 0.7 for the dashed lines). The results show that the trends strongly vary with the scaling exponent. The solar costs decline by approximately 72% for the allothermal process and by 60% for the hybrid process at 150,000 kg H2/day. In the same way, the hydrogen price for the allothermal process sharply drops to 2.09 €/kgH2 at 150,000 kg/day, against 2.22 €/kgH2 for the hybrid process and 2.25 €/kgH2 for the autothermal process. This highlights the necessity of a proper field layout optimization during the scale-up to maximize the energy/materials savings and further reduce the hydrogen cost.
The feedstock cost is another crucial parameter to be studied (Figure 4). Its impact on hydrogen cost is presented in the following section.

3.2.3. Impact of Feedstock Cost

The cost of the feedstock is a key dynamic parameter that evolves with different factors such as local supply chains, resource availability, sustainability criteria, political choices or competing uses of biomass. In this part of the study, the biomass price was varied in the 0–1 €/kg interval to cover a large range of woody and non-woody biomasses (such as food waste, agricultural and crop waste, and Solid Recovered Fuels) and also a potential increase in the resource price (due, for instance, to the increasing pressure on the resource in the incoming years or to extra-cost associated with additional required feedstock pre-treatment). Figure 8 shows the hydrogen cost as a function of the biomass price for the three studied processes (at reference conditions represented by solid lines). Two additional scenarios are considered: the first one assumes a 50% cost reduction of the heliostat field and towers (at reference land cost) and the second one assumes (in addition) a land cost of 0.5 €/m2. Two zones on these graphs can be observed for each of the considered solar scenarios: one zone when the biomass price is below a critical value and one zone when the resource price is above. In the first zone, the autothermal mode prevails and imposes lower production costs. In the second zone, a significant reversal trend occurs in favor of the solar processes. Table 6 shows the critical biomass prices at the intersection between the autothermal and solar processes curves. It can be seen that the trend turnaround occurs faster in the allothermal process than in the hybrid one at reference assumptions. In fact, it takes place at a biomass critical price of 0.29 €/kg (for the allothermal mode, which represents three times the reference biomass price), against 0.37 €/kg for the hybrid configuration. By reducing the solar equipment cost by 50%, the turnaround biomass price decreases by about 31% for the allothermal mode and by 38% for the hybrid mode (at reference land cost). It decreases even more, by a total of 69% (allothermal) and 84% (hybrid), when the land cost is set to 0.5 €/m2. In the latter scenario, the turnaround occurs earlier in the hybrid process.
In summary, the analysis shows that a slight increase in the price of the feedstock undermines the autothermal process. The better use of biomass provided by the solar processes clearly limits the increase in hydrogen cost, especially when combined with lower solar plant and land costs. Zero or even negative-priced feedstocks remain more profitable using the conventional autothermal process. However, in the case of waste gasification, CO2 emissions and environmental impact should be considered if carbon is not renewable (e.g., plastic waste). Direct CO2 emissions released by the solar processes are negligible or significantly lower than those from the current autothermal processes. Solar gasification processes thus have favorable long-term prospects because they avoid or reduce costs for CO2 mitigation and pollution abatement. Moreover, due to the more heterogeneous nature of waste, its conversion implies additional costs, to deal with syngas impurities, especially the H2S content that is a major corrosive constituent. More costly reactor materials and gas cleaning units are thus required for waste feedstock.

3.2.4. Impact of Environmental Subsidies

As shown in Table 3, solar gasification avoids, respectively, 3.08 and 6.73 kg of CO2 (due to reaction) per kilogram of H2 in hybrid and allothermal processes, which is significant. Although a detailed analysis has not yet been published comparing the three processes based on environmental criteria, important and achievable CO2 emission mitigation is greatly expected thanks to solar heating. In fact, a conventional CSP tower plant generates barely 38 g of CO2/kWhe [38], which is far (more than 10 times) lower than the 750–900 g of CO2/kWhe generated by conventional Integrated Gasification Combined Cycles (IGCC) power plants when no CO2 capture is considered. The capture/sequestration of 80% of CO2 during operation decreases the net emissions to about 200 g of CO2/kWhe, resulting in a total saving of more than 550 g of CO2/kWhe [39]. In this sense, solar-driven processes can drastically reduce the Greenhouse gas (GHG) emissions, which allows them to take advantage of carbon pricing and environmental subsidies to improve their economic balance and their competitiveness. Indeed, the application of credits for CO2 mitigation and pollution avoidance will further enable the solar thermochemical technologies to compete favorably with conventional processes. Carbon price varies from country to country [40], and, in France, it is estimated to be 100 €/t CO2 in 2030 according to Quinet report [41]. In Europe, carbon prices are expected to double by 2021, and even quadruple to reach up to 55 €/t CO2, as stipulated in the Paris climate agreement [42]. In this section, the impact of possible capital subsidies due to CO2 emission reduction is studied. The total subventions were calculated on the basis of the amount of CO2 that would have been emitted by the conventional process. For allothermal gasification, the subvention was estimated at 14.74 M€ (6.73 × 150,000 × 80% × 365 × 50/1000) and at about 6.74 M€ for the hybrid process (3.08 × 150,000 × 80% × 365 × 50/1000) for DC = 150 000 kg H2/day, a capacity factor of 80% and a capital subsidy of 50 €/tCO2. Figure 9 shows the impact of CO2 subsidies on hydrogen cost.
At reference conditions, the intersection between the curves (autothermal and solar processes) takes place at CO2 subventions of 82 €/tCO2 (allothermal) and 55 €/tCO2 (hybrid). Considering a cost reduction for heliostats and towers of 50% and a fixed environmental subsidy of 30 €/tCO2, the biomass turnaround price goes down to 0.14 €/kg and 0.09 €/kg (lower than reference cost ~0.1 €/kg) for the allothermal and hybrid processes, respectively. This confirms that subsidies can play a key role in the reduction in solar hydrogen costs.

3.3. Comparison with Other Hydrogen Production Methods

This part of the study gives insights into hydrogen production costs with different technologies, such as biomass gasification, coal gasification, natural gas reforming and water electrolysis (based on a solid oxide technology). Previously developed NREL cost models were used for this purpose [43]. The financial inputs of all the technologies are the same as those presented in Table 4, and the operating capacity factor is fixed to 80%. To focus on the comparison with low-carbon technologies, the considered coal gasification and natural gas-reforming models integrate carbon capture and sequestration units that remove CO2 from syngas before storing it in underground reservoirs. The reference primary resources costs used in this section are: biomass cost = 0.1 €/kg, coal cost = 0.04 €/kg, NG cost = 0.01 €/kWh, electricity cost for electrolysis = 0.10 €/kWh. 
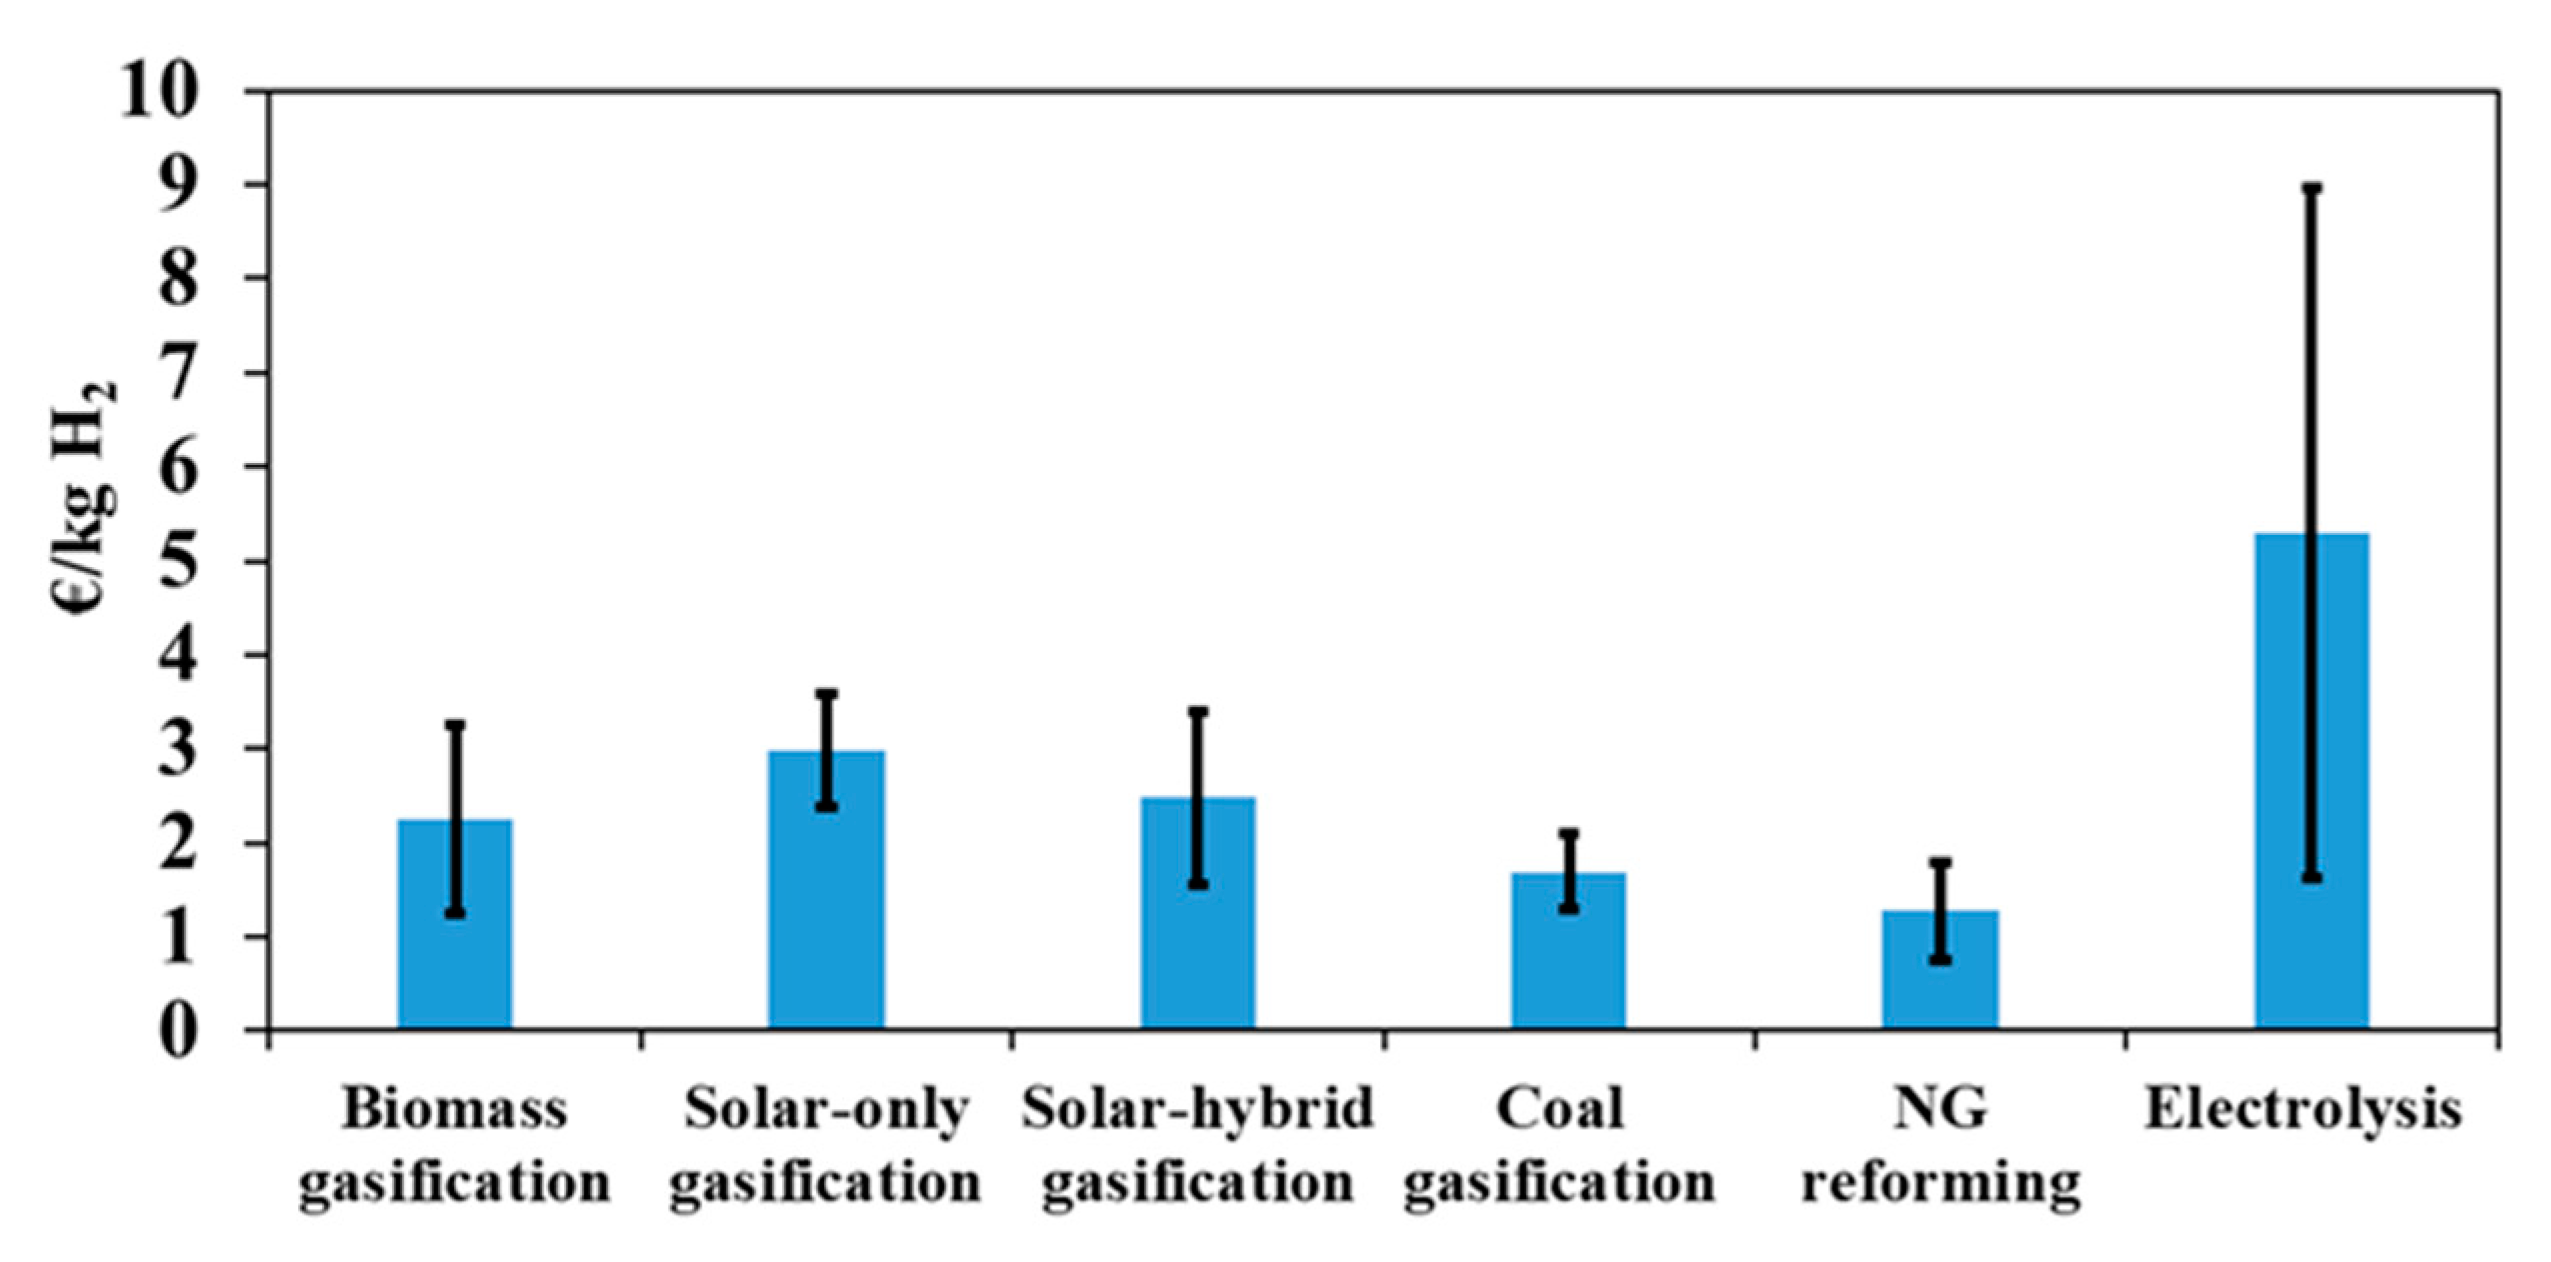
Figure 10 shows the hydrogen minimum price of the different technologies. The grey bars show the sensitivity to the primary resource price (electricity price for electrolysis; process water was fixed to 0.61 €/m3) when it increases from zero to twice the reference cost.
It can be seen that natural gas reforming is the most profitable process so far, with a hydrogen production cost of only 1.28 €/kg. This process is followed by coal (1.69 €/kg) and biomass gasification. The difference between these three processes is mainly due to two factors: the cost of the primary resource and the capacity of the plant. Clearly, due to the low fossil fuel cost, fossil-based processes are the most competitive on the market. Moreover, very large plants can be envisaged, which lowers the price of hydrogen even further thanks to the economy of scale. The cost of hydrogen produced by electrolysis is much higher than that of the other processes (5.48 €/kg), and shows a greater sensitivity to primary resource cost. It can be seen that, for a zero-resource cost, the price of hydrogen produced by electrolysis decreases drastically to 1.68 €/kg, making this technology potentially more competitive when recovering and valorizing unusable electricity (due, for example, to lack of demand and storage). Although coal gasification plant capacity is seven times larger than that of biomass gasification (and, therefore, benefits from the economy of scale), it appears that, for low feedstock costs, hydrogen price is almost the same in both configurations. This is due to the extra costs entailed by CO2 capture and sequestration operations (which are not considered in biomass gasification). Finally, NG reforming with CO2 capture and sequestration is the cheapest process with a hydrogen cost below than that of coal and biomass gasification (solar and non-solar), making this technology the most economically attractive option at present for decarbonized hydrogen generation.
It is essential to recall that other solar thermochemical processes are prospected for the generation of solar fuels. In view of the increasingly stringent environmental regulations, and noting the urgency of climate change, the sustainable paths have undergone extensive research and development to increase efficiency and cost-effectiveness. The number of publications in this field considerably increased, by more than five times since 2000 [44]. This brought significant insights regarding the technical feasibility and the possibilities of scale up. A number of economic studies were carried out to estimate the cost of hydrogen using different solar thermochemical technologies. Although initial assumptions differ from one study to another regarding plant site, solar material cost, operating hours, installation costs and optical/thermal efficiencies, the calculated values estimate the prices and their sensitivity to the input parameters. Möller et al. [45] analyzed the solar steam reforming of natural gas for the production of 103.8 Million Nm3/year (i.e., ~25,594 kg/day) of hydrogen. The study showed that the solar process allows 40% of the fuel to be saved compared to the conventional process, with a hydrogen cost of less than 0.05 €/kWh LHV of H2 (~1.67 €/kg of H2). Similarly, Rodat et al. [46] studied solar thermal decomposition of natural gas at a plant design capacity of 436 kg of H2/day. Hydrogen cost was about 1.42 $/kg and showed great sensitivity to carbon blacks’ (which are the process byproducts) selling price. The study determined carbon blacks’ minimum cost, making solar thermal decomposition of natural gas competitive with solar and conventional reforming processes. Baykara and Bilgen [47] compared commercial, hybrid and solar coal gasification processes for the production of hydrogen. The plants were designed to produce 107 GJ of H2 per year (~228,310 kg/day). The study showed that the commercial process (based on partial feedstock combustion) is the most cost-effective, with a hydrogen price of 0.94 $/kg, which is 5.2% and 6.3% lower than the hybrid and solar (only) process and is, in some respects, consistent with the present study outcomes. This means that solarization is still economically challenging and requires incentive environmental policies. Other researchers took a keen interest in the thermochemical splitting of water using high-temperature solar heat. Given that single-step direct thermolysis, at temperatures beyond 2500 °C, was hardly feasible, thermochemical cycles technologies were rather considered. This process involves several reactional intermediates, which are regenerated during the cycles to lower the water dissociation temperature. Over 280 cycles were developed and screened to select the most suitable ones for coupling with concentrated solar thermal energy [48]. Among the most promising cycles studied from an economic perspective, zinc, ferrite, and sulphur cycles were proposed. Charvin et al. [49,50] studied two-step (ZnO/Zn and Fe3O4/FeO) and three-step (Fe2O3/Fe3O4) thermochemical cycles driven by concentrated solar energy. The economic study was performed with a design capacity ranging from 50 to 250 kg/h of H2. The analysis gave a hydrogen production cost between 7.98 and 14.75 $/kg of H2 depending on process intensification and on the targeted hydrogen productivity. In a similar study, Steinfeld [51] analyzed hydrogen production cost via two-step water-splitting ZnO/Zn redox system, and the hydrogen price was around 4–5 €/kg at a design capacity of 61 Million-kWh/year (~5014 kg/day), which is somewhat larger than Charvin et al. [49] design capacity and therefore lowers hydrogen prices. Solar hydrogen production costs from the hybrid-sulfur cycle and a metal oxide-based cycle were studied and compared to that of commercial electrolysis (powered by a CSP plant with a thermal storage capacity of 4.5 h) by Graf et al. [52]. The metal-oxide-based cycle hydrogen cost ranged between 3.5 and 12.8 €/kg, and thus covered the ranges calculated Charvin et al. [49] and Steinfeld [51]. It showed the greatest cost variability due to the high demand of the metal oxide and its cost dependence. Hydrogen costs for hybrid sulfur cycle were the lowest and ranged between 3.9 and 5.6 €/kg. Water electrolysis was highly influenced by the cost of electricity, with a hydrogen price between 2.1 and 6.8 €/kg.
Overall, it appears from these results that, to date, solar thermochemical processes are far from being competitive with conventional processes based on fossil fuels (coal and natural gas). Major challenges remain to improve the efficiency of the processes. They concern the cost of the solar concentrators, which represents a significant part of the investment, and the cost of the receiver, which, in many cases, must withstand high temperatures in the presence of highly corrosive chemical species. Another challenge concerns the solar reactor design, which should minimize the heat losses and maximize the chemical conversion for a better use of the solar resource. The recycling of chemicals in thermochemical cycles that impose a high degree of purity and a precise control of phases and constituent separation is another issue that needs to be properly managed and solved. Carbon-based solar thermochemical technologies generally show lower hydrogen production costs. These processes, which, by definition, are less harmful to the environment, offer the possibility to extend the lifespan of fossil resources on earth and can play a role in the transition towards a zero-carbon economy.

4. Conclusions

A techno-economic study of solar and solar hybrid gasification was carried out. The study was based on the discounted cash-flow rate of return method to calculate the minimum hydrogen production cost. At first, the most important solar parameters were identified, and they were then integrated to a previously developed autothermal gasification cost model. The new solarized cost model was thereafter used to examine the profitability and the cost-effectiveness of each of the studied heating configurations (i.e., allothermal, hybrid and autothermal). A sensitivity analysis of the main cost-influencing factors was carried out. The analysis showed that at the current biomass reference cost (considered equal to 0.1 €/kg), the most competitive scenario (in which solar hydrogen cost is lower than conventional hydrogen), assumes a cost reduction of 50% of the heliostats and towers costs, with a land cost of 0.5 €/m2, which is clearly challenging at present and requires an important economic effort. However, the analysis also showed that an increase in the biomass cost by a factor of 2 to 3 significantly undermines the profitability of the autothermal process, in favor of solar gasification, which becomes more competitive without any substantial economic and financial efforts. A comparative analysis with other solar and non-solar clean technologies was carried out. This confirmed that the two most economically favorable processes for hydrogen generation are those based on fossil fuels with CO2 capture and sequestration. These processes will, therefore, make the greatest contribution to the hydrogen market in the near future. Nonetheless, fossil fuels are neither universally available nor inexhaustible, and depend on a large number of strategic and geopolitical parameters that remain uncertain, sensitive and hardly predictable. Moreover, carbon sequestration is not without risk for the environment and human health. Leakage during transport and storage is possible, and the long-term process performance is uncertain, especially in cases of large-scale development. These represent major constraints to circumvent in order to ensure security and sustainability. Renewable technologies are hardly competitive with fossil-based technologies at present, and require more effort to gain in efficiency, durability and cost-effectiveness. Government policy incentives have also a major role to play through the use of mechanisms like carbon credits, renewable energy credits, capital subsidies, and reverse auctions. This way, the financial viability of the sustainable path can be improved.

Author Contributions

Conceptualization, H.B., S.R. and S.A.; methodology, H.B., S.R. and S.A.; validation, H.B., S.R. and S.A.; formal analysis, H.B., S.R. and S.A.; investigation, H.B., S.R. and S.A.; writing—original draft preparation, H.B., S.R. and S.A.; writing—review and editing, S.R. and S.A.; visualization, H.B.; supervision, S.R. and S.A.; project administration, S.R. and S.A. All authors have read and agreed to the published version of the manuscript.

Funding

This research received no external funding.

Institutional Review Board Statement

Not applicable.

Informed Consent Statement

Not applicable.

Data Availability Statement

The data presented in this study are available on request from the corresponding author.

Acknowledgments

The support of ADEME (French Environment and Energy Management Agency) is gratefully acknowledged.

Conflicts of Interest

The authors declare no conflict of interest.

References

  1. Hydrogen—Chemical Economics Handbook (CEH)|IHS Markit. Available online: https://ihsmarkit.com/products/hydrogen-chemical-economics-handbook.html (accessed on 14 July 2020).
  2. Safari, F.; Dincer, I. A review and comparative evaluation of thermochemical water splitting cycles for hydrogen production. Energy Convers. Manag. 2020, 205, 112182. [Google Scholar] [CrossRef]
  3. Ursua, A.; Gandia, L.M.; Sanchis, P. Hydrogen Production from Water Electrolysis: Current Status and Future Trends. Proc. IEEE 2011, 100, 410–426. [Google Scholar] [CrossRef]
  4. Fraile, D.; Lanoix, J.C.; Maio, P.; Rangel, A.; Torres, A. Overview of the Market Segmentation for Hydrogen across Potential Customer Groups, Based on Key Application Areas. 2015. Available online: https://www.certifhy.eu/images/D1_2_Overview_of_the_market_segmentation_Final_22_June_low-res.pdf (accessed on 1 January 2021).
  5. Binder, M.; Kraussler, M.; Kuba, M.; Luisser, M. IEA Bioenergy Hydrogen from Biomass Gasification; Reinhard Rauch, Ed.; IEA Bioenergy, December 2018; ISBN 978-1-910154-59-5. Available online: https://www.ieabioenergy.com/blog/publications/hydrogen-from-biomass-gasification/ (accessed on 26 February 2020).
  6. Schmidt, O.; Gambhir, A.; Staffell, I.; Hawkes, A.; Nelson, J.; Few, S. Future cost and performance of water electrolysis: An expert elicitation study. Int. J. Hydrogen Energy 2017, 42, 30470–30492. [Google Scholar] [CrossRef]
  7. Boujjat, H.; Rodat, S.; Chuayboon, S.; Abanades, S. Numerical simulation of reactive gas-particle flow in a solar jet spouted bed reactor for continuous biomass gasification. Int. J. Heat Mass Transf. 2019, 144, 118572. [Google Scholar] [CrossRef]
  8. Chuayboon, S.; Abanades, S.; Rodat, S. Experimental analysis of continuous steam gasification of wood biomass for syngas production in a high-temperature particle-fed solar reactor. Chem. Eng. Process. Process. Intensif. 2018, 125, 253–265. [Google Scholar] [CrossRef]
  9. Gokon, N.; Ono, R.; Hatamachi, T.; Liuyun, L.; Kim, H.-J.; Kodama, T. CO2 gasification of coal cokes using internally circulating fluidized bed reactor by concentrated Xe-light irradiation for solar gasification. Int. J. Hydrogen Energy 2012, 37, 12128–12137. [Google Scholar] [CrossRef]
  10. Kodama, T.; Kondoh, Y.; Tamagawa, T.; Funatoh, A.; Shimizu, K.-I.; Kitayama, Y. Fluidized Bed Coal Gasification with CO2 under Direct Irradiation with Concentrated Visible Light. Energy Fuels 2002, 16, 1264–1270. [Google Scholar] [CrossRef]
  11. Kruesi, M.; Jovanovic, Z.R.; Dos Santos, E.C.; Yoon, H.C.; Steinfeld, A. Solar-driven steam-based gasification of sugarcane bagasse in a combined drop-tube and fixed-bed reactor—Thermodynamic, kinetic, and experimental analyses. Biomass Bioenergy 2013, 52, 173–183. [Google Scholar] [CrossRef]
  12. Muroyama, A.P.; Guscetti, I.; Schieber, G.L.; Haussener, S.; Loutzenhiser, P.G. Design and demonstration of a prototype 1.5 kWth hybrid solar/autothermal steam gasifier. Fuel 2018, 211, 331–340. [Google Scholar] [CrossRef] [Green Version]
  13. Taylor, R.; Berjoan, R.; Coutures, J. Solar gasification of carbonaceous materials. Sol. Energy 1983, 30, 513–525. [Google Scholar] [CrossRef]
  14. Gregg, D.; Taylor, R.; Campbell, J.; Taylor, J.; Cotton, A. Solar gasification of coal, activated carbon, coke and coal and biomass mixtures. Sol. Energy 1980, 25, 353–364. [Google Scholar] [CrossRef]
  15. Piatkowski, N.; Wieckert, C.; Steinfeld, A. Experimental investigation of a packed-bed solar reactor for the steam-gasification of carbonaceous feedstocks. Fuel Process. Technol. 2009, 90, 360–366. [Google Scholar] [CrossRef]
  16. Vidal, A.; Denk, T.; Steinfeld, L.; Zacarías, L.; Almería, T. Upscaling of a 500 kW Solar Gasification Plant. Proc. WHEC 2010, 78, 177–181. [Google Scholar]
  17. Rodat, S.; Abanades, S.; Boujjat, H.; Chuayboon, S. On the path toward day and night continuous solar high temperature thermochemical processes: A review. Renew. Sustain. Energy Rev. 2020, 132, 110061. [Google Scholar] [CrossRef]
  18. Boujjat, H.; Rodat, S.; Chuayboon, S.; Abanades, S. Experimental and numerical study of a directly irradiated hybrid solar/combustion spouted bed reactor for continuous steam gasification of biomass. Energy 2019, 189, 116118. [Google Scholar] [CrossRef]
  19. Boujjat, H.; Junior, G.M.Y.; Rodat, S.; Abanades, S. Dynamic simulation and control of solar biomass gasification for hydrogen-rich syngas production during allothermal and hybrid solar/autothermal operation. Int. J. Hydrogen Energy 2020, 45, 25827–25837. [Google Scholar] [CrossRef]
  20. Saw, W.L.; Guo, P.; Van Eyk, P.J.; Nathan, G.J. Approaches to accommodate resource variability in the modelling of solar driven gasification processes for liquid fuels synthesis. Sol. Energy 2017, 156, 101–112. [Google Scholar] [CrossRef]
  21. Nickerson, T.A.; Hathaway, B.J.; Smith, T.M.; Davidson, J.H. Economic assessment of solar and conventional biomass gasification technologies: Financial and policy implications under feedstock and product gas price uncertainty. Biomass Bioenergy 2015, 74, 47–57. [Google Scholar] [CrossRef]
  22. Rahbari, A.; Shirazi, A.; Venkataraman, M.B.; Pye, J. A solar fuel plant via supercritical water gasification integrated with Fischer–Tropsch synthesis: Steady-state modelling and techno-economic assessment. Energy Convers. Manag. 2019, 184, 636–648. [Google Scholar] [CrossRef]
  23. Saw, W.; Kaniyal, A.; Van Eyk, P.; Nathan, G.; Ashman, P. Solar Hybridized Coal-to-liquids via Gasification in Australia: Techno-economic Assessment. Energy Procedia 2015, 69, 1819–1827. [Google Scholar] [CrossRef] [Green Version]
  24. NREL H2A. H2A: Hydrogen Analysis Production Models|Hydrogen and Fuel Cells|NREL. Available online: https://www.nrel.gov/hydrogen/h2a-production-models.html (accessed on 7 July 2020).
  25. Spath, P.; Aden, A.; Eggeman, T.; Ringer, M.; Wallace, B.; Jechura, J. Biomass to Hydrogen Production Detailed Design and Economics Utilizing the Battelle Columbus Laboratory Indirectly Heated Gasifier; NREL Technical Report; NREL: Golden, CO, USA, 2005. Available online: https://www.nrel.gov/docs/fy05osti/37408.pdf (accessed on 1 January 2021).
  26. Kolb, G.J.; Jones, S.A.; Donnelly, M.W.; Gorman, D.; Thomas, R.; Davenport, R.; Lumia, R. Heliostat Cost Reduction Study; Sandia Report; Sandia National Laboratories: Albuquerque, NM, USA, June 2007. Available online: https://prod.sandia.gov/techlib-noauth/access-control.cgi/2007/073293.pdf (accessed on 1 January 2021).
  27. Mendelsohn, M.; Lowder, T.; Canavan, B. Utility-Scale Concentrating Solar Power and Photovoltaics Projects: A Technology and Market Overview; NREL Technical Report; NREL: Golden, CO, USA, April 2012. Available online: https://www.nrel.gov/docs/fy12osti/51137.pdf (accessed on 1 January 2021).
  28. Sudiro, M.; Bertucco, A. Synthetic Fuels by a Limited CO2 Emission Process Which Uses Both Fossil and Solar Energy. Energy Fuels 2007, 21, 3668–3675. [Google Scholar] [CrossRef]
  29. Becker, M.; Klimas, P.; Chavez, J.; Kolb, G.; Meinecke, W. Second Generation Central Receiver Technologies; Germany; p. 1993. ISBN 3-7880-7482-5. Available online: https://www.osti.gov/etdeweb/biblio/5295357 (accessed on 26 February 2021).
  30. SOLARPACES PS10. Available online: https://solarpaces.nrel.gov/planta-solar-10 (accessed on 2 August 2020).
  31. Sargent & Lundy LLC Consulting Group Chicago, Illinois. Executive Summary: Assessment of Parabolic Trough and Power Tower Solar Technology Cost and Performance Forecasts; NREL: Golden, CO, USA, October 2003. Available online: https://www.nrel.gov/docs/fy04osti/35060.pdf (accessed on 1 January 2021).
  32. Bracken, N.; Macknick, J.; Tovar-Hastings, A.; Komor, P.; Gerritsen, M.; Mehta, S. Concentrating Solar Power and Water Issues in the U.S. Southwest. Conc. Sol. Power Water Issues U.S. Southwest 2015. [Google Scholar] [CrossRef] [Green Version]
  33. Hinkley, J.T.; Hayward, J.A.; Curtin, B.; Wonhas, A.; Boyd, R.; Grima, C.; Tadros, A.; Hall, R.; Naicker, K. An analysis of the costs and opportunities for concentrating solar power in Australia. Renew. Energy 2013, 57, 653–661. [Google Scholar] [CrossRef]
  34. Pfahl, A. Survey of Heliostat Concepts for Cost Reduction. J. Sol. Energy Eng. 2013, 136, 014501. [Google Scholar] [CrossRef]
  35. Pidaparthi, A.; Hoffmann, J. Effect of heliostat size on the levelized cost of electricity for power towers. AIP Conf. Proc. 2017, 1850, 030038. [Google Scholar]
  36. Lovegrove, K.; Stein, W. Concentrating Solar Power Technology; Woodhead Publishing, October 2012; Available online: https://www.sciencedirect.com/book/9781845697693/concentrating-solar-power-technology (accessed on 14 July 2020).
  37. Kromer, M.; Roth, K.; Takata, R.; Chin, P. Support for Cost Analyses on Solar-Driven High Temperature Thermo-Chemical Water-Splitting Cycles; TIAX LLC: Lexington, MA, USA, 2011. [Google Scholar]
  38. Burkhardt, J.J.; Heath, G.; Cohen, E. Life Cycle Greenhouse Gas Emissions of Trough and Tower Concentrating Solar Power Electricity Generation. J. Ind. Ecol. 2012, 16, 93. [Google Scholar] [CrossRef]
  39. Ordorica-Garcia, G.; Douglas, P.; Croiset, E.; Zheng, L. Technoeconomic evaluation of IGCC power plants for CO2 avoidance. Energy Convers. Manag. 2006, 47, 2250–2259. [Google Scholar] [CrossRef]
  40. Carbon Pricing Dash Board. Available online: https://carbonpricingdashboard.worldbank.org/map_data (accessed on 2 August 2020).
  41. Quinet, A. Report of the Commission Chaired by A. Quinet, State-imposed Value of Carbon, Center for Strategic Analysis. 2009. Available online: https://www.vie-publique.fr/sites/default/files/rapport/pdf/094000195.pdf (accessed on 1 January 2021).
  42. Carbon Tracker REPORT Carbon Countdown: Prices and Politics in the EU-ETS. Available online: https://carbontracker.org/reports/carbon-countdown/ (accessed on 20 July 2020).
  43. Penev, M.; Saur, G.; Hunter, C.; Zuboy, J. NREL, Hydrogen & Fuel Cells, H2A Hydrogen Production Model: Version 3.2018 User Guide. Available online: https://www.nrel.gov/hydrogen/assets/pdfs/h2a-production-model-version-3-2018-user-guide-draft.pdf (accessed on 1 January 2021).
  44. Yadav, D.; Banerjee, R. A review of solar thermochemical processes. Renew. Sustain. Energy Rev. 2016, 54, 497–532. [Google Scholar] [CrossRef]
  45. Möller, S.; Kaucic, D.; Sattler, C. Hydrogen Production by Solar Reforming of Natural Gas: A Comparison Study of Two Possible Process Configurations. J. Sol. Energy Eng. 2006, 128, 16–23. [Google Scholar] [CrossRef]
  46. Rodat, S.; Abanades, S.; Flamant, G. Methane Decarbonization in Indirect Heating Solar Reactors of 20 and 50 kW for a CO2-Free Production of Hydrogen and Carbon Black. J. Sol. Energy Eng. 2011, 133, 031001. [Google Scholar] [CrossRef]
  47. Baykara, S.; Bilgen, E. Synthesis gas and H2 production from solar gasification of albertan coal. Energy Convers. Manag. 1985, 25, 391–398. [Google Scholar] [CrossRef]
  48. Abanades, S.; Charvin, P.; Flamant, G.; Neveu, P. Screening of water-splitting thermochemical cycles potentially attractive for hydrogen production by concentrated solar energy. Energy 2006, 31, 2805–2822. [Google Scholar] [CrossRef]
  49. Charvin, P.; Abanades, S.; Lemort, F.; Flamant, G. Analysis of solar chemical processes for hydrogen production from water splitting thermochemical cycles. Energy Convers. Manag. 2008, 49, 1547–1556. [Google Scholar] [CrossRef]
  50. Charvin, P.; Abanades, S.; Lemort, F.; Flamant, G. Hydrogen Production by Three-Step Solar Thermochemical Cycles Using Hydroxides and Metal Oxide Systems. Energy Fuels 2007, 21, 2919–2928. [Google Scholar] [CrossRef]
  51. Steinfeld, A. Solar hydrogen production via a two-step water-splitting thermochemical cycle based on Zn/ZnO redox reactions. Int. J. Hydrogen Energy 2002, 27, 611–619. [Google Scholar] [CrossRef]
  52. Graf, D.; Monnerie, N.; Roeb, M.; Schmitz, M.; Sattler, C. Economic comparison of solar hydrogen generation by means of thermochemical cycles and electrolysis. Int. J. Hydrogen Energy 2008, 33, 4511–4519. [Google Scholar] [CrossRef]
Figure 1. Biomass solar gasification flow diagram.
Processes 09 00462 g001
Figure 2. Impact of equity financing (%) and IRR on the cost of H2 (DC = 150,000 kg H2/day and a biomass reference price of 0.1 €/kg and land cost of 12.9 €/m2).
Processes 09 00462 g002
Figure 3. Direct capital investment breakdown (at reference assumptions, Table 5).
Processes 09 00462 g003
Figure 4. Specific contribution of each project component.
Processes 09 00462 g004
Figure 5. Impact of solar technologies cost reduction on the hydrogen minimum price.
Processes 09 00462 g005
Figure 6. Impact of land cost on the hydrogen minimum price (solid lines: reference assumptions, Table 5; Chain-dotted lines: 50% cost reduction on heliostats and towers).
Processes 09 00462 g006
Figure 7. (a) Direct costs at different design capacities separated in two parts: solar and chemical and impact of scaling exponent factor; (b) Hydrogen minimum price for different design capacities and impact of scaling exponent factor. For the base case (solid lines), the scaling exponent factor is taken equal to 1 for the solar part.
Processes 09 00462 g007
Figure 8. Impact of biomass cost on hydrogen minimum price; (a)-solar-only, (b)-hybrid.
Processes 09 00462 g008
Figure 9. Impact of CO2 subsidies on hydrogen cost
Processes 09 00462 g009
Figure 10. Hydrogen production cost and sensitivity on the primary resource cost (electricity for electrolysis) when ranging from zero to twice the reference cost (Table 4).
Processes 09 00462 g010
Table 1. Direct capital costs at chemical baseline (installed, to be scaled).
M€
Feed Handling and Drying24.57
Gasification, Tar Reforming, and Quench21.84
Compression and Sulfur Removal20.28
Steam Methane Reforming, Shift, and PSA39.39
Steam System and Power Generation18.72
Cooling Water and Other Utilities4.42
Buildings and Structures19.26
Table 2. Other variable operating costs.
M€
Other materials7.00
Waste treatment1.20
Solid waste disposal0.73
Environmental surcharges0.13
Table 3. Comparison between the three studied processes at DC = 150,000 kgH2/day.
AutothermalHybridAllothermal
Plant size (hectares)19.7250.2748.9
Solar power on field (MW)-357.51069.9
Biomass consumption (tdry/day)1.45 × 1031.30 × 1030.87 × 103
Water consumption (m3/day)4.58 × 1044.60 × 1044.63 × 104
Annual Cold Gas efficiency [19]0.800.931.34
CO2 emissions (t/day) [19]1.04 × 1035.78 × 10229.5
Table 4. Financial inputs.
Start-up time (years)1
Analysis period and plant life (years)30
Length of construction period (years)3
% of Capital spent in 1st, 2nd and 3rd year of construction8%, 60%, 32%
Depreciation Schedule Length (years)20
Depreciation TypeMACRS
% of Fixed Operating Costs During Start-up (%)100%
% of Revenues During Start-up (%)50%
% of Variable Operating Costs During Start-up75%
Decommissioning costs (% of depreciable capital investment)10%
Salvage value (% of total capital investment)10%
Inflation rate (%)1.9%
Interest rate on debt3.7%
Total Tax Rate (%)25.7%
Working Capital (%)15%
Table 5. Reference assumptions.
Biomass cost (€/kg)0.10
Land cost (€/m2)12.9
Mirror cost (€/m2)120
Tower cost (M€/MWth)0.42
DC (kg H2/day)150,000
Electricity cost (€/kWh)0.10
Water cost (€/m3)0.61 €/m3 (process), 0.03 €/m3 (cooling)
Table 6. Turnaround biomass price (€/kg): autothermal/solar, DC = 150,000 kg H2/day.
Autothermal/AllothermalAutothermal/Hybrid
Reference assumptions0.290.35
+50% reduction on (heliostats + towers), land cost = 12.9 €/m20.200.23
+50% reduction on (heliostats + towers), land cost = 0.50 €/m20.090.06
Publisher’s Note: MDPI stays neutral with regard to jurisdictional claims in published maps and institutional affiliations.

