Article

On the Way to Integrate Increasing Shares of Variable Renewables in China: Activating Nearby Accommodation Potential under New Provincial Renewable Portfolio Standard

1
School of Economics and Management, North China Electric Power University, Beijing 102206, China
2
Beijing Key Laboratory of New Energy and Low-Carbon Development, North China Electric Power University, Beijing 102206, China
3
Research Center for Beijing Energy Development, Beijing 102206, China
*
Author to whom correspondence should be addressed.
Processes 2021, 9(2), 361; https://doi.org/10.3390/pr9020361
Submission received: 21 January 2021 / Revised: 10 February 2021 / Accepted: 13 February 2021 / Published: 16 February 2021
(This article belongs to the Special Issue Green Technologies for Production Processes)

Abstract

:
More than 1.2 billion kW wind and solar power generation will be integrated in China by 2030. The new provincial renewable portfolio standard, officially implemented in 2020, establishes an efficient bridge between rapid capacity growth and limited accommodation capability. A data-driven prospect analysis framework was proposed to evaluate the activated potential under two kinds of nearby accommodation approaches and to explore the completion prospect of this new obligated quota from provincial levels. Empirical results illustrate diverse prospects across regions. Particularly, it is hard for two kinds of provinces to complete their obligated quotas merely via the single nearby accommodation approach: The first one is close to renewable energy resources but lacks flexible peak regulation capability in Northeast and Northwest China, and the other is close to the nationwide load center but lacks nearby integration from renewables in Southeast, North, and Middle China. Therefore, the pathway for the former is to activate more provincial accommodation potential either via releasing system flexibility or by substituting generation right, and the pathway for the latter is to introduce trans-regional or trans-provincial accommodation and import more renewable energy power.

1. Introduction

Explosive capacity booms have occurred in wind and solar power in China over the past decade. It will maintain high annual capacity growth and play an important role in speeding up transformation of China’s energy structure and mitigating global climate change, corresponding to the carbon emission reduction targets declared by China for 2030 and 2060. However, the rapid capacity growth of integrated variable renewable energy (VRE) such as wind and solar has brought apparent power curtailment in Northwest and Northeast China since 2015, and will inevitably bring more under future high VRE penetration.
Much research in recent years has focused on large-scale VRE accommodation in China. It is hard for China to decrease curtailment level. The inverse distribution of energy supply and demand, concentrated development mode of energy resources, inflexible power supply structure, limited balancing capability of power grid, and weak growth of electricity consumption has caused this situation, typically from 2015 to 2016 [1]. Though China has taken a set of actions to accommodating increasing share of variable wind and solar power, and there has been a significant decline in curtailment level from 2017 to 2019, and these obstacles have not been completely removed [2]. For further analysis, numerous researchers put their scenario back to 2015, and have established that not only the physical limit in power system but also the lack of a more powerful plan-based policy together with coordinating a market-based mechanism has led to this problem [3,4].
The new provincial renewable portfolio standard (RPS) issued by China in May 2019 was officially implemented in 2020, and is a landmark policy towards China’s accommodation of renewable energy. This scheme is quite different with the worldwide adoption not only in assessing subjects but also in tracking completion progress of obligated quota. It is a demand-based policy with provincially distributed quota, and is implemented by directly assessing electricity selling companies or consumers to sell or buy an increasing proportion of their electricity from renewable sources. The RPS adopted outside China is usually a supply-based policy, which is the promotion scheme of a quota obligation on electricity suppliers to supply an increasing proportion of their electricity from renewables [5]. It is accompanied with voluntary tradable green certificates (TGC) and tradable surplus accommodation to complement the fulfillment of quotas, while in most cases outside China, RPS policy is accompanied with compulsory TGC created by government to track the fulfillment of the quotas [5].
A major focus in China’s localized RPS design progress from 2007 to 2019 has been how to evaluate the effects of RPS adoption. It is generally accepted that great changes will happen to China’s power supply structure, carbon emissions reduction, electricity prices, renewable investment decisions, social welfare, and governmental expenditure on subsidies when RPS, together with TGC, is practically adopted [6,7]. Particularly, Chinese researchers pay more attention to the connection between RPS and existing energy policies, such as the substitution effect of RPS and TGC on feed-in tariff (FIT), and the inside cooperation among RPS policy, electricity market, and carbon trading [8,9,10]. The special effect towards cutting curtailment and promoting accommodation of VRE in China is also separately proved [11].
After the announcement of this new RPS scheme, several alternative effect evaluations were developed. In particular, the inevitable effect of RPS on retail electricity market was studied [12]. One creative study analyzed the feasibility of this new RPS from the perspectives of VRE supply and demand, and found that the curtailment of renewables reduced by RPS [13]. Based on this research, further prospect analysis of the new RPS in China from provincial level is necessary. Besides, previous work has focused more on policy evaluation but less on the dual effect between RPS completion and VRE accommodation.
This paper aims to fill this gap and seek out a pathway for activating accommodation potential and fulfilling the new provincial RPS scheme. The data-driven prospect analysis framework highlighted in this study contains a simplified calculation method, which is applied to quantitatively emphasize the specific relationship between accommodation and demand-side quota obligation issued by RPS policy. Two prominent nearby approaches from both technical and marketable perspectives are simulated in scenario analysis combined with two case studies of Northeast and Northwest China. The ideal potential for activating accommodation and achieving obligated quota is evaluated based on the typical data from 2015 to 2018. Results illustrated in the case and extended for nationwide application reveal a clear pathway for activating accommodation potential and accelerating RPS completion in different or similar provinces. The application evidence of these nearby accommodation approaches and prospect analysis for completing provincial quota will provide a valuable reference and useful mode for China to integrate increasing shares of VRE in the next ten years.
This paper focused on the RPS completion in 30 provincial administrative regions (Tibet is not contained in the assessment) across mainland China and is organized as follows. Section 2 firstly introduces the evolution of RPS policy in China, then summarizes two basic characteristics of the newest scheme and illustrates its specific assessment mechanism. Section 3 introduces a calculation and simplification method of accommodation potential. Section 4 conducts scenario analysis within two cases based on several nearby accommodation approaches. Section 5 discusses the results of nationwide application of the above approaches and reveals several facts. Section 6 concludes the paper and proposes related policy recommendations.

2. Framework and RPS Scheme

2.1. Framework of This Paper

The framework of this paper is specifically illustrated as Figure 1.
This paper starts by analyzing the two basic characteristics of the new RPS policy in China, which leads to the fact that the key feasible pathway for implementing RPS is to preferentially conduct nearby accommodation approaches. Peak regulation capacity, determined by power supply structure and regulation performance of power units, is emphasized as the key restricted factor for releasing nearby accommodation potential. The nearby accommodation approaches proposed in this paper are summarized as follows: Full utilization or further modification of present peak regulation capacity, and generation rights trading between captive power plants and renewable power units. They will either technically optimize the peak regulation capability, or economically motivate all responsible market players to alternatively buy or sell more electricity from VRE based on physical restrictions of China’s power system. Both background and implementation situation of these representative approaches are respectively analyzed in corresponding case studies on Northeast and Northwest China. These two case studies include several scenario analyses where the provincial accommodation potential is calculated by reasonable simplification according to the proposed method. All representative approaches are simply simulated and most of the results are discussed regionally or provincially. It is also emphasized which provinces or regions are more suitable for applying these approaches. Part of the results is nationwide extended and further discussed to obtain a relatively clear completion prospect of the new RPS in China.

2.2. Evolution of RPS Policy in China

Evolution for introduction and localization of RPS in China could be divided into two stages. It was firstly introduced in 2007, beginning with assessing electricity suppliers on the quota of renewable energy’s installed capacity and generating electricity. It was then updated in 2012 and 2014, stimulating that provincial government had the administrative responsibility while power grid corporation and generation enterprise were respectively obligated for implementation and cooperation. These policy schemes concentrated on the capacity or electricity proportion on the generating side, and delivered large construction booms of wind and photovoltaics (PV) power station. However, their effects towards accommodating renewable energy power were undesirable. Then the assessment subject and index were switched from the generating side to the demand side, when the first amendment of RPS policy was issued on 23 March 2018 [14]. The assessment was solely conducted by compulsory TGC. The second amendment in 2018 was soon proposed and was more specific in obligation distribution and trading rules of TGC than the first one [15]. On 13 November 2018, the third amendment issued as Notice on trial implementation of renewable portfolio standard was published [16]. Instead of compulsory TGC, the obligated quota was mainly assessed by actual accommodation, and complementarily assessed by both accommodation trading and voluntary TGC. Then in May 2019, the newest amendment Determination of obligation quota and assessment method of accommodation for renewable energy power was finally published [17]. It further emphasized the direct assessment of accommodation. The evolution of RPS policy in China is illustrated in Figure 2.
The newest RPS policy in China stipulated that the RPS target will be annually distributed, and provincially implemented and assessed. The distributed provincial RPS target in the assessment year is annually allocated one year before. It is calculated by estimating the provincial renewable energy electricity which is generated and absorbed locally, predictable net import of renewable energy electricity which is generated outside but absorbed locally, and predictable provincial electricity consumption. Responsible subjects involved in RPS assessment include independent power supply companies that possesses no operation right of distribution network, dependent ones which belong to power grid corporation and directly supplies power to end users, power consumers who purchase electricity through the wholesale electricity market, and enterprises that possess their captive power plants. All involved subjects are encouraged by the provincial energy bureau to correspondingly buy or sell the same proportion of renewable energy power in their total power demand or supply as the provincial RPS target of their located province. This new RPS scheme announced the official launch of demand side-based provincial RPS in China and was simpler and more feasible in assessment. At present, both the forcible target and motivated one from 2018 to 2020 have been specifically given.

2.3. Two Main Characteristics of New RPS in China

2.3.1. Nearby Accommodation Is Preferred

Various challenges for accommodation always exist in China. China’s energy resources and demand are distributed inversely. VRE resources are large in scale and concentrated in provinces throughout North China (NC), Northeast China (NEC), and Northwest China (NWC). These three regions, collectively called the Three-North region, are far away from the nationwide load center in East and South China. In contrast, VRE is mainly developed in a decentralized way and accommodated nearby in Europe and America. The basic pattern of energy development for China seems to be sending electricity from the west to the east, from the north to the south, and allocating energy throughout the country.
The truth is that China’s electricity has been balanced by provinces for a long time and the power generation plan is formulated under the leadership of the local government. Under the plan-based mode, administrative intervention driven by provincial economic interests hinders the trans-provincial exchange of electricity. Although China is actively promoting the orderly liberalization of electricity generation and utilization plans, the proportion of planned electricity in 2017 is still as high as 80% of the benchmark hours. The rigid implementation of the thermal power generation plan and market transaction plan reduces the adjustment flexibility of real-time dynamic balance and restricts the power output of VRE. In addition, the physical power transmission capacity for VRE in the Three-North region is insufficient. The power transmission capacity only accounts for 22% of the installed VRE capacity, and is further occupied by the transmission task from the coal-fired power bases. Though China is speeding up the mechanism reform of the electricity industry, the national unified electricity market has not yet been fully established. The market mechanism, which is conducive to breaking the barriers between provinces and promoting the trans-regional and trans-provincial consumption of electricity, has not yet been formed. There is still a long way to go to give full play to the decisive role of the market in the optimal allocation of resources. Therefore, in this market transition stage, a wide range of VRE allocation and accommodation is restricted. Nearby accommodation merely remains to be a more feasible way.
The newest RPS policy in China tends to encourage all responsible subjects in RPS assessment to deeply develop the potential of nearby accommodation. It stimulates that priority should be given to maximize nearby accommodation in those provinces which finally export electricity. Other provinces, which finally import electricity outside, should preferentially fully accommodate nearby VRE and then maximize trans-provincial or trans-regional accommodation.
Where are the potentials for activating more physical nearby accommodation? Total consumption market is insufficient enough to support the rapid capacity growth of all power sources including VRE, especially in the Three-North region. Peak regulation capability of provincial power system is the major constrained factor related to support enormous absorption of random PV or wind power. The maximum limit of this capability is determined by both power supply structure and peak regulation performance of a single power unit. However, not only the lack of flexible regulated power supplies and limited flexibility of the conventional power units, especially those coal-fired power units, but also the negative participation captive power plants involved in peak regulation have made the power system in China inflexible to accommodate more VRE. Much potential in flexible operation remains to be fully developed for China’s power system in contrast with Spain, Denmark, Germany, and the United States. The capacity share of flexible and coal-fired power in power supply structure is illustrated in Table 1. Therefore, the basic principles for diverse nearby accommodation approaches are either flexibility-based optimization of power supply structure or improvement of units’ peak regulation performance. Specific approaches are discussed in the fourth section of this paper.

2.3.2. Using Direct Assessment on Accommodation Instead of Compulsory TGC

TGC and RPS usually complement each other especially in those countries with mature electricity market. The operation mechanism of RPS scheme in California, Japan, and Britain is to replace physical measurement with green certificates, and to reflect the performance of quota-bearing entities with the number of certificates. The cost of realizing the quota obligation taken by power companies is channeled out through the terminal sales electricity price. If the power company fails to meet the quota target, it shall pay a fine which is higher than the cost of purchasing renewable energy or certificates.
However, the complementary relationship between RPS and TGC seems to be weakened according to the latest scheme issued in China. China creatively designs RPS policy by directly assessing provincial physical accommodation together with market-based accommodation. Provinces are preferentially encouraged to complete their targeted accommodation by physical electricity balance, under the organization and technological support of provincial power grid corporation, and the unified management of the provincial energy bureau. Both nearby accommodation and active trans-provincial or trans-regiona1 accommodation contribute to the physical assessment part. As for the market-based part, China designs two auxiliary market-based measures for responsible subjects to realize their proportion targets which are more independent than nationwide compulsory TGC. One alternative measure is to directly purchase the surplus accommodation from market entities who have exceeded their obligation. The other one is to conduct voluntary trading of TGC with green power producers, and the equivalent amount of accommodation corresponding to purchased certificates is also recorded as supplementary RPS completion. All the identified supplementary completion of single responsible subjects contributes to the total market-based accommodation of a province.

3. Methodology

3.1. Fundamental Conditions

The overall completing progress of RPS for a province can be assessed by Equations (1)–(3):
C o m i T = A i T + R P S i T + T G C i T w i T ,
I n d i T = C o m i T ( C i T w i T ) ,
A i T = L i T + E i T ,
where C o m i t is the amount index of RPS completion for province i in year T. I n d i T is the proportion index of RPS completion for province i in year T. Both are defined according to the latest RPS scheme issued in May 2019. A i T is the actual provincial accommodation of renewable energy electricity for province i in year T, which physically participates in provincial electricity balance. A i T is calculated by two parts. L i T is the part of accommodation that is locally generated and consumed. E i T is the other part of accommodation that is generated outside but consumed locally, and it is set to be negative if the province finally exports non-hydro renewable energy power. As for the market-based accommodation which is complementarily included in RPS completion, R P S i T is the total assigned amount of directly-purchased accommodation from all responsible subjects located in province i. T G C i T is the total equivalent amount of accommodation corresponding to the voluntarily green certificates purchased by all subjects located in province i. w i T is the part of electricity consumption which is closely related to public welfare and declared to be out of assessment for province i in year T. C i T is the annual electricity consumption in the whole province i for year T.
Once the new RPS is strictly implemented, provinces will either raise physical accommodation capability, or encourage responsible subjects to purchase a high enough amount of RPS completion by direct assigned transaction of accommodation and voluntary subscription of TGC. The targeted physical accommodation amount can be simply illustrated by G A i T , as shown in Equation (4). It can be calculated by the distributed provincial RPS target typed as T a r i T and electricity consumption. All nearby accommodation approaches proposed in this paper can be adopted by provincial manager and organizer of RPS implementation to make A i T close to or exceed G A i T .
G A i T = T a r i T · C i T ,
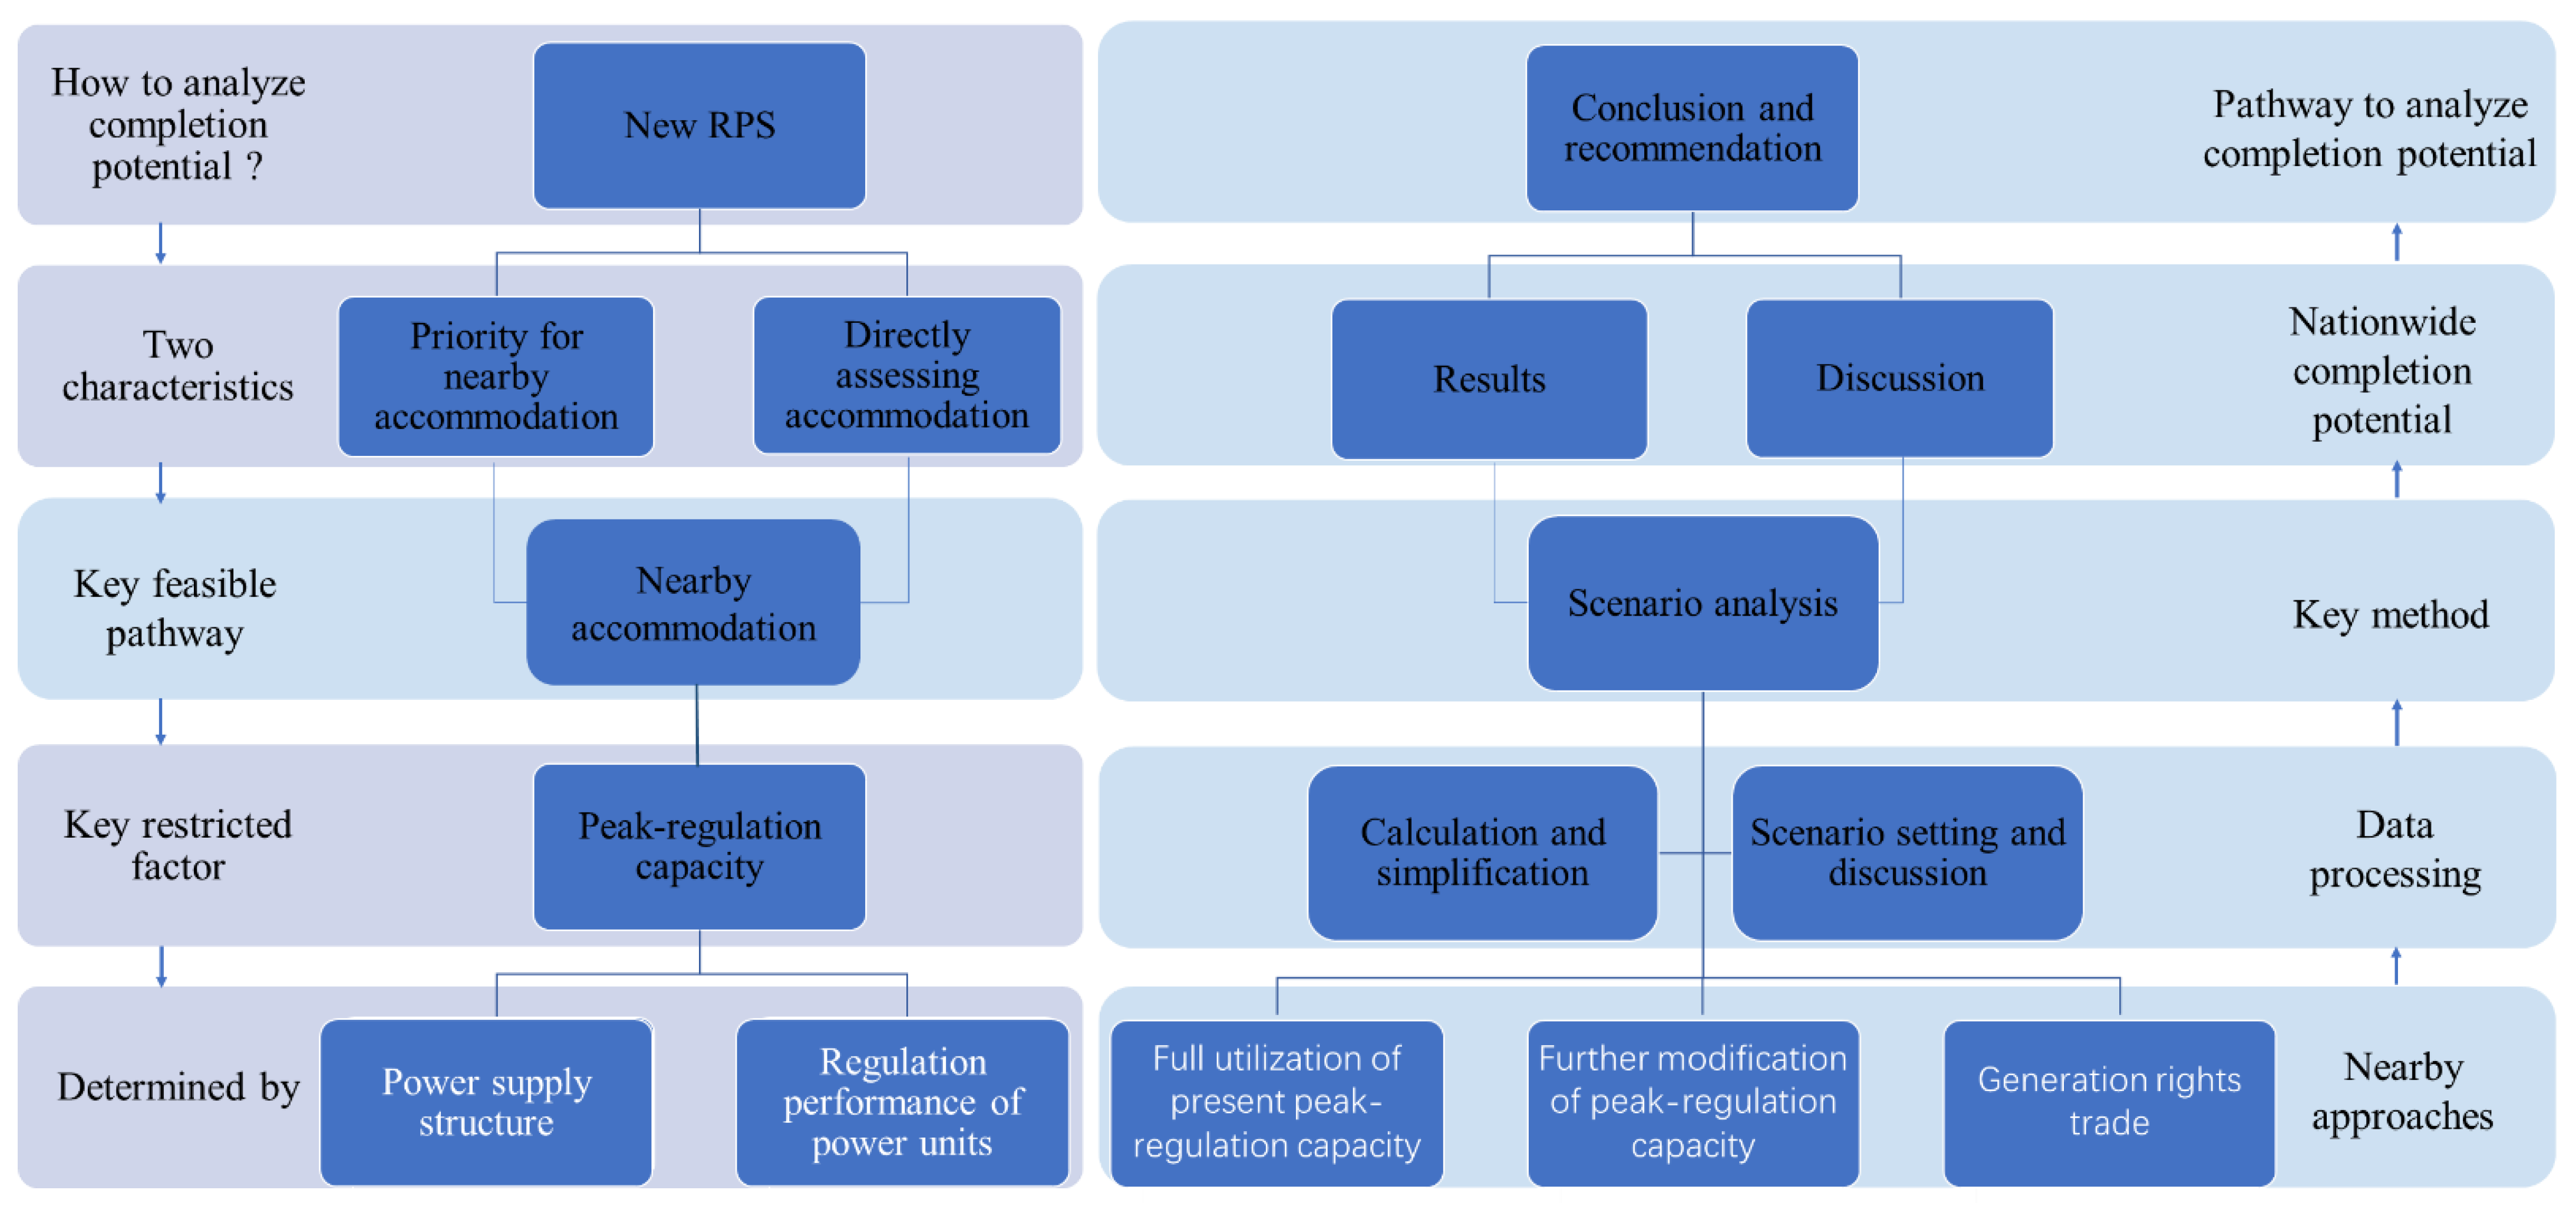
To calculate the completion potential of new provincial renewable portfolio standards in China based on scenario analysis of nearby accommodation approaches, the following section introduces several basic formulas.
The power output of VRE in province i at the time t, typed as P N i t , should meet the requirement of instantaneous power balance in the provincial power system. The power balance is illustrated by Equations (5)–(7):
P N i t = P C i t P A i t P F X i t ,
P A i t = P A C i t + P A F i t ,
P F X i t = P N U i t + P T R i t + P C A i t + P O T i t ,
where P C i t is defined as the provincial consumption load, P A i t is defined as the power output of adjustable generating units which is the sum of adjustable conventional units’ power output typed as P A C i t and flexible units’ power output typed as P A F i t , and P F X i t is the power output of generating units that cannot be adjusted, which is the sum of nuclear power units’ power output typed as P N U i t , imported power through trans-provincial transmission lines typed as P T R i t , off-managed captive power plants’ power output typed as P C A i t , and other uncontrollable power outputs typed as P O T i t .
The adjustable conventional units in China are mainly coal-fired power units and hydropower with reservoir storage. The ratio of flexible power units such as natural gas generation and pumped storage in China’s power supply structure is too low to apparently influence peak regulation capability of provincial power system. For simplification, the power output of adjustable generating units mentioned above can be changed into Equation (8).
P A i t = P C O i t + P H Y i t ,
where P C O i t and P H Y i t   are the power output of coal-fired units and hydropower with reservoir storage, respectively.
The power output of hydropower with reservoir storage is usually stable. In addition, curtailment for hydropower is forbidden. The uncontrollable power output showed in Equation (7) is fixed according to plan-based management. Specially, the power of the external transmission line is set according to the daily planned value and could not be adjusted, which means the actual import power must be accommodated by receiving provinces. The basic provincial electricity balance is illustrated in Table A1. Therefore, the more generating space coal-fired power units assign, the more generating space VRE acquires, which can be illustrated by Equation (9).
| Δ P N i t | = | Δ P C O i t | ,
This paper assumes that the traditional power system reserve is merely undertaken by coal-fired power units. After deducting the system reserve, the remaining part of coal-fired power units is used for tracking and balancing the fluctuation of VRE’s power output. Other forms of thermal power together with runoff hydropower were not considered unless specially mentioned.
The power output of coal-fired units should be limited between minimum technical output and operated installed capacity after deducting system reserve. This is shown in Equation (10):
C A P i t · ( 1 σ i t ) · ( 1 β i t ) P C O i t C A P i t · ( 1 σ i t ) ,
where C A P i t is defined as the installed capacity of coal-fired units, β i t represents the average peak regulation depth of all kinds of operated coal-fired power units in province i at time t, and σ i t is defined as the system reserve rate undertaken by coal-fired units.

3.2. Calculation of Completion Potential

The maximum generating space for VRE which is assigned from coal-fired power units can be shown in Equation (11), if other conditions remain the same and peak regulation performance is considered only.
M a x | Δ P N i t | = | P C O i t C A P i t · ( 1 σ i t ) · ( 1 β i t ) | ,
This paper merely took nearby accommodation approaches into consideration, while the change of trans-provincial a trans-regional transmission plan could be ignored. Respectively, the imported part of accommodation typed as E i T remained unchanged. Therefore, the maximum accommodation amount of VRE which was assigned from coal-fired power units could be calculated by integrating both sides, typed as Equation (12).
M a x | Δ A i T | = | P C O i t C A P i t · ( 1 σ i t ) · ( 1 β i t ) | d t ,
The peak regulation depth of a single power unit is closely related to its capacity and peak regulation mode. This paper merely considered the low-load peak regulation mode and typed five categories of coal-fired power by the capacity of a single unit. Each category was respectively configured into a unified peak regulation depth. The peak regulation depth of different categories is illustrated in Table 2. The weighted average peak regulation depth of all kinds of operated coal-fired power units can be calculated. The specific proportion of various coal-fired power units in different provinces is illustrated in Table A2. The setting for peak regulation depth in Table 2 is based on the investigation results illustrated in Table A3.
The calculation setting of the system reserve rate undertaken by coal-fired units is based on the Notice on issuing early warning of coal and electricity planning and construction risks in 2020 [18]. In this notice, red warning provinces have obviously-installed redundancy of coal-fired units, and the system reserve rate is set by its boundary value of interval; orange ones have relatively abundant installed capacity, and the system reserve rate is set by average value of interval; green ones have basic balance or a slight gap between power supply and demand, and the system reserve rate is also taken by the boundary value of the interval; those undefined provinces’ system reserve rates are consulted by the reasonable reserve rate. The reserve capacity is calculated with the product of the maximum power generation load and actual system reserve rate. These setting data can be also seen in Table A2.
For province i in year T, the maximum physically-rising potential of the proportion index for RPS completion can be further simplified by Equation (13).
M a x | Δ I n d i T | = | E C O i T τ i T · C A P i T · ( 1 σ i T ) · j 5 δ i j T · ( 1 β i j T ) C i T | ,
where E C O i T is defined as the annual generating electricity of coal-fired power units, τ i T is the annual utilization hour of coal-fired power units, C A P i T is the total annual installed capacity of coal-fired power units, σ i T is provincial power system reserve rate, δ i j T is the capacity proportion of five different coal-fired units marked by j, and β i j T is its corresponding peak regulation depth.
For further consideration of heating units, also known as cogeneration units or combined heat and power (CHP), the peak regulation of them was uniformly set to be 75%. The provincial capacity proportion of heating units is illustrated in Table A2. The heating period was set to be 3624 h from November to March of the following year, and the non-heating period was set to be 5136 h from April to October. The actual utilization hours of heating units during these two periods was respectively estimated by their corresponding generating electricity and operated capacity. The capacity proportion of five types of units was assumed to be the same among heating units and non-heating units. Then the formula could vary into Equation (14).
M a x | Δ I n d i T | = | E C O i T C A P i T · ( 1 σ i T ) · j 5 δ i j T · ( 1 β i j T ) · [ τ i w T + ( 1 α i T ) · τ i m T ] τ i n T · α i T · C A P i T · ( 1 β i n T ) C i T | ,
where τ i w T is the average utilization hours of all coal-fired units during a non-heating period, τ i m T is the average utilization hours of non-heating units during a heating period and τ i n T is the average utilization hours of heating units during a heating period, α i T is the provincial capacity proportion of heating units, and β i n T is the peak regulation depth of heating units during a heating period.
The basic principle of this calculation was to make one variable change as the scenario analysis needed and to keep the other ones to be the same. The above formulas regard peak regulation performance of coal-fired power units as the basic variable, because it is the core factor that restricts nearby accommodation. With these calculations, the prospect for completing a provincial obligated quota in China could be estimated.

3.3. Feasibility and Rationality of the Method

Accurate calculation of VRE absorption capacity is an effective way to improve the level of accommodation, which could theoretically predict the maximum potential for provinces achieving their obligated quotas. At present, the calculation method studied in many literatures can be mainly summarized into two types: The typical daily analysis method and time series production simulation analysis method.
The typical daily analysis method usually selects the extreme situation where the power output of VRE is the largest while the load is the smallest, to determine the conservative capacity of integrated VRE [19]. The time series production simulation analysis method usually takes the month or year as the calculation time length, and simulates the power and electricity balance of the power grid time by time [20].
The calculation method proposed in this paper absorbs the advantage in simplification of the first method and avoids the disadvantage in complex data requirements of the second one. It concentrates on the macroscopic average level represented by two kinds of a typical day in a heating period and non-heating period. The basic principle of this method is to control other variables to remain unchanged and to study how the variety of the major variable influences the accommodation. It is especially suitable and more rational to be included in a nearby accommodation framework, due to relatively stable provincial power supply structure and inter-provincial power balance. Though it is idealistic both in assumptions and simplification, the calculation results are valuable enough for analyzing the RPS completion potential from both technical and marketable ways.
In particular, the method proposed in this paper is quite different from those traditional predicting methods. Traditional ones usually predict values of several related variables tied with the targeted variable and give out an estimated value for an exact future date. In contrast, this method keeps these variable values unchangeable except for the studied one prepared for simulation and scenario analysis, and gives out the most ideal evolution for the targeted variable based on present structural data from the actual power system. The differential value for targeted variables between the present actual value and the most ideal one represents the potential remains to be activated. It is not a prediction for an exact date or time series but reflects a present prospect outlook for future development.
Thus, the validity of simulation results on this basis could be proved in another way. As for the traditional methods, the structure validity of their simulation results could be proved by structural validity procedures including boundary adequacy, structure verification, dimensional consistency, parameter verification, and extreme conditions [21,22], while the behavioral validity could be demonstrated by comparison between data output from the model and data from the actual power system, and the test procedures include but are not limited to trend comparison and removal [23,24,25]. However, there were no actual reference data for this estimated ideal evolution calculated in this paper; thus, the results could be not easily proved by their comparison. In addition, results were not for an exact future date or time series and could not be validated by fitting historical data with trend extension. Therefore, to guarantee the simulation results calculated from the proposed method complied with structural validity rules, all balance formulas applied in this paper were referred from the Renewable Energy Production Simulation Model developed by the China Electric Power Research Institute (CEPRI) which has been successfully applied in VRE integration optimization and off-grid multi-good micro-grid optimization for nearly ten years [26]. These formulas illustrate the basic principle that the more generation space released or transferred from thermal power units, the more VRE accommodation and RPS completion become. Under the most ideal circumstance, thermal power units could operate at a lower minimum technical power output and more generation rights to trade between captive thermal power plants and VRE units could be fulfilled, and an explosive boom could happen to VRE accommodation. In addition to these formulas with valid logical structure and consistent dimensions, the basic data for scenario-based case study were collectively sorted out either from official published data books or from investigation of the State Grid Corporation of China [27,28,29,30,31,32,33,34]. The adequacy for boundary conditions and parameters could be also guaranteed [21]. In contrast, to demonstrate the behavioral validity, this paper compared the overlapping variables values acquired from proposed method and similar researches developed by CEPRI and State Grid Energy Research Institute (SGERI) [26,35].

4. Approaches for Activating Nearby Accommodation and Accelerating RPS Completion

Nearby accommodation is the key feasible pathway for absorbing more VRE in the electricity market transition period. Peak regulation capacity, determined by power supply structure and regulation performance of power units, is the key restricted factor for nearby accommodation. However, it is difficult to change the power supply structure in a short time. Inflexible coal-fired power still occupies a core position in the generation structure. Therefore, utilizing and improving peak regulation performance of power units, especially coal-fired power units, becomes a practicable way. Technically, full use and further modification of present peak regulation capacity both contribute to removing the physical limit of nearby accommodation. As for a marketable approach, generation rights trade is the most representative one carried out in China, which motivates thermal power units to make room for VRE power generation based on the peak regulation capacity of present power system. These two series of approaches contribute to completing the obligated quota issued by RPS policy, and the accommodation potential activated by them is separately evaluated in two case studies.

4.1. Full Utilization and Further Modification of Peak Regulation Capacity of Coal-Fired Units in Northeast China

4.1.1. Background and Implementation

Since 2010, electricity consumption growth has been slow, while the power supply has continued to grow at a relatively fast rate, and the contradiction between supply and demand has become more prominent. From 2010 to 2016, the installed power supply in Northeast China increased by 47%, 26 percentage points higher than the demand load growth in the same period, and the installed power supply in 2016 was 2.2 times the maximum load. The utilization rate of power generation equipment in the northeast power grid continued to decline. In 2016, the overall utilization hours fell to 3432 h, which was lower than the national average of 353 h. Thermal power occupied 4068 utilization hours, which was 692 h lower than that in 2010, and wind power possessed 1689 h, which was 386 h lower.
In addition, heating units accounted for an enormous share of thermal power in Northeast China. The peak regulation performance of heating units has been extremely restricted by operation mode because they must meet the heating load demand while producing electric power. For instance, when the heating load gradually increased, the 300 MW CHP unit had to enlarge the capacity of suction; consequently, the minimum technical output rose while the maximum technical output dropped, and its adjustable load range varied from 51.1% to 7.1%, lower than that of non-heating units. When the strong wind period overlapped with the heating period during winter and spring, both limited peak regulation capability and declining electricity consumption together with inadequate transmission infrastructure brought a huge curtailment of wind power.
In response, the dispatching department of the northeast power grid strictly controlled the startup mode and power output of heating units in accordance with the minimum operation mode approved by the Energy Supervision Bureau, dynamically monitored the heating information online in real time, calculated the peak regulation capacity, and arranged the units to participate in deep peak regulation to the maximum extent. In this way, the thermal power plant operated with minimum technical output in 2016, giving additional accommodation room for wind power of 6.372 billion kWh.
In addition, the Northeast China Power Peak Regulation Auxiliary Service Market was established in 2014 and updated in 2016. It stimulated that peak regulation capacity of all generators, except the capacity with obligatory regulation task, ought to participate in the market. Whenever a thermal power unit was operating below the minimum technical output it could it obtain compensation, otherwise it would be regarded as a beneficiary of the peak regulating auxiliary service and therefore share the service cost [36]. This market-based approach has successfully motivated generators to reduce the minimum power output of their CHP units. The auxiliary service electricity in Northeast China became 8.571 billion kWh in 2017, and wind power additionally generated 2.499 billion kWh due to the peak regulating auxiliary service market.
The above two approaches, especially adopted by Northeast China, concentrated on the full utilization of present peak regulation capacity from two pathways. One is to technologically optimize operation dispatching, the other one is to economically motivate coal-fired units to actively reduce their power output.
Further optimization of present peak regulation capacity is also urgent for developing more peak regulation capacity from coal-fired power units. The thermal storage transformation of CHP units and flexibility modification of pure condensing units has been sped up nationwide. Since the end of 2017, total modified capacity has become 9.18 million, and 930 million kWh additional VRE has been accommodated. More than half of the modification has been done by Liaoning Province. By the end of 2020, 133 million kW of CHP units and 82 million kW of pure condensing units are planned to be modified, and 45 million kW of peak regulation capacity should be increased in the Three-North region. Another 185 million kW of deep peak regulation modification is planned to be completed in East and Middle China.

4.1.2. Scenario Analysis

The first two scenario settings in this part only considered the operation mode of coal-fired units based on the present maximum peak regulation depth. It was firstly calculated regardless of the characteristics of heating units, under the condition that all coal-fired units are dispatched to operate on their present minimum technical power output. The results for three provinces in Northeast China are illustrated in Table 3, typed as S 1 . If the heating units were also taken into consideration, and all heating units were operating at their present minimum technical power output in heating period while other units still operated according to their initial minimum technical output, the results are illustrated as S 2 in Table 3.
The second two scenario settings considered the rising potential of peak regulation depth by flexibility modification. It was firstly calculated regardless of the heating units under condition that all coal-fired units were dispatched to operate on 10% lower than the present minimum technical power output. The results are illustrated in Table 3, typed as S 3 . Similarly, heating units were then considered, and all heating units together with non-heating units were operating on 10% lower than the initial setting, regardless of whether they were in or out of the heating period, and the results are illustrated as S 4 in Table 3.

4.1.3. Discussion

In this case, both full utilization and further modification of peak regulation capacity of coal-fired units raise the RPS completion potential in Northeast China. The maximum physically-rising potential of the proportion index for RPS completion in all scenarios is close to or more than the obligated quotas in 2018, 2019, and 2020. The actual accommodation proportion in 2018 and 2019 is close to or more than the potential one calculated in this scenario analysis. This can be explained by two possibilities. One is that the potential from flexibility modification of coal-fired units has been completely developed in Northeast China. The other is that all the nearby accommodation approaches adopted in Northeast China work in coordination with each other and bring a higher rising potential than a single approach. The results from the consideration of heating units are always lower than that of the other. This can be explained because the existence of a huge amount of heating units in Northeast China dramatically reduces the completion potential of RPS gained from the flexibility modification of coal-fired units.
It has been proven to be a necessary approach for activating nearby accommodation, and is especially suitable for those provinces with a huge amount of heating units. However, some obstacles still exist during the adoption of these approaches. On one hand, the dispatching capability of power grid corporations needs further improvement, so that present peak regulation capacity can be fully used for VRE accommodation. On the other hand, the auxiliary service market still needs to be further improved, even in Northeast China during the reform of the power industry, let alone some provinces that have not yet established a peak regulation auxiliary service market. Both generators and power grid corporations in these provinces are not motivated enough to actively conduct flexibility modification.

4.2. Generation Rights Trading between Captive Power Plants and Renewable Power Units in Northwest China

4.2.1. Background and Implementation

Northwest China once faced more serious curtailment of VRE than Northeast China. It not only similarly possesses a huge amount of CHP units, but also has a huge number of captive power plants. A captive power plant is a power plant owned, used, and managed by an industrial or commercial energy user for its own energy consumption, and is widely used by high-electricity consuming industries in Northwest China [36]. It can be integrated to the power grid for exchanging excess power, or be used off-grid for selfishly meeting one’s own electricity demand but escaping from peak regulation obligation. Whether the captive power plants participate in peak regulation makes a difference to system flexibility as well. The installed capacity and power generation of captive power plants has grown rapidly. They have forced public power plants and non-hydro renewable energy power suppliers to further press their power output. For instance, the captive power plants in Xinjiang Province have generated more electricity than public ones since 2014, and the usage hour of them is always 1000 h more than public power plants from 2012 to 2016. In response, Northwest China has been exploring a substitution trade mode to fully release the peak regulation capacity of captive power plants since 2016. It is usually called the generation rights trading between captive power plants and renewable power units. By the end of 2017, the additional accommodation benefitted from this trade in Shaanxi, Gansu, Qinghai, Ningxia, and Xinjiang respectively achieved 0.39, 1.89, 0.54, 1.22, and 7.9 billion kWh. This total trade achieved 14.2 billion kWh in 2019.

4.2.2. Scenario Analysis

In this scenario setting, the maximum physically-rising potential of the proportion index for RPS completion was directly calculated in three represent provinces in Northwest China, by assigning 15%, 25%, and 35% of the generation rights for captive power plants to renewable energy generators with the actual accommodation data in 2016. The results are respectively illustrated as S 5 , S 6 , and S 7 in Table 4.

4.2.3. Discussion

In this case, the completion potential, developed from generation rights trading between captive power plants and renewable power units in Northwest China, is far lower than the installed capacity of captive power plants. The trading shares in these three provinces are all below 10% which illustrates that there remains much more potential to be further developed. The maximum proportion index for RPS completion in all scenarios is far higher than actual accommodation shares in electricity consumption from 2015 to 2018 except in Ningxia Province. It has already completed the obligated quota of 2020 in advance. As for Gansu Province, it cannot complete the obligated quota of 2020 before singly assigning the generation rights of captive power plants for 27.9% or more. In contrast, the same index for Xinjiang is 3.5%, which means the maximum proportion index for RPS completion in Xinjiang province is more sensitive to this approach.
This approach is also suitable to be applied in Shandong Province and Inner Mongolia Province which also possess huge installed capacity of captive power plants. Once the trading is adopted, the supplementary peak regulation capacity of captive power plants would further raise the completion potential of RPS in these provinces. However, some argue that this approach is a helpless choice for renewable power units because they will have to face extraordinary power rationing if they do not participate in the transaction. In addition, a vast majority of VRE generators must clinch a deal with zero electricity price, with the average electricity price reduced by 0.294 yuan/kWh, if they intend to participate in the transaction. This benefits high-energy-consuming enterprises a lot. But if the government subsidy is considered, it is fair enough for both sides of the trade. This will be a relatively feasible way for accommodating VRE as much as possible in the transition period. After that, the unified management and sharing mechanism of peak regulation capacity need to be completely established to maximize the peak regulation capability.

5. Results and Discussions

5.1. Result Discussions and Prospect Analysis

The two representative nearby accommodation approaches for activating completion potential of new RPS in China have distinct concerns. The first one focused on either full utilization of present peak regulation capacity through minimum operation mode control and motivation from auxiliary service market, or further modification of peak regulation capacity through flexibility modification of pure condensing units and thermal storage transformation of CHP units. The other one concentrated on market-based substitution of generation rights between captive power plants and renewable power units with no change in present peak regulation capacity. Both of them certainly contributed to activating completion potential. The generation rights trade seemed to be a little more effective due to the direct substitution of the electricity amount.
In the related case separately discussed above, Northeast China adopted all approaches of the first type and each element of the single approach contributed to releasing the completion potential. It continuously would contribute more, but the deep digging space for Northeast China has been almost run out. In contrast, its nationwide application would benefit more provinces, especially in North China and Northwest China, as illustrated in Table 5.
The nationwide simulation results from scenarios 1 to 4 illustrate that in most cases, the growth of the actual accommodation proportion from 2015 to 2018 has dramatically exceeded the maximum limit of rising potential which is calculated by the proposed method based on the data in 2015. This can be explained from two possibilities. One is that the motivation of one single approach is far weaker than that of approach portfolios. There possibly remains positive synergy between different approaches, especially inside the first category. While provinces use diverse approaches during the same period, the progress of index improvement might be out of imagination. The other one is that all the results calculated in the first four scenarios are the extreme evolution developed from the basic year 2015. Neither new growth of installed capacity nor new-added electricity consumption from 2015 to 2018 completely involves the fundamental assumptions and calculations. Therefore, not only do the approach portfolios give more actual growth of the completion index, but also the accommodation priority in the new-added electricity market deeply releases more potential for completing RPS.
In addition, the nationwide completion potential of RPS activated by nearby accommodation approaches can be inferred from the results. As mentioned above, the nearby accommodation approach is currently the most feasible pathway for provincial completion of RPS target, while the peak regulation capacity is the most important restricted factor of nearby accommodation. Thus, it is inferred that it would be almost impossible for provinces to complete their physical targeted accommodation if they could not complete these four scenarios which were based on extremely idealized calculations. There remains some potential for provinces in the Three-North region for further improvement by nearby accommodation approaches, but the targets for provinces in North China would be relatively hard to complete by merely adopting nearby accommodation. In addition, most provinces outside the Three-North region seem to not be sensitive to nearby accommodation approaches. These provinces are usually far away from VRE resources but close to the nationwide load center in Southeast China. They may have run out of nearby accommodation potential and need some other pathways to raise RPS completion.
To simply illustrate the provincial completion potential of RPS brought by the single approach mentioned above, this paper chooses the maximum results of the RPS completion index among scenario 1 to scenario 4 illustrated in Table 5, and uses the maximum differential value between scenario results and the actual index in 2015 to represent the completion potential brought by a single approach of flexibility modification. Meanwhile, the gap between the same index in 2015 and the targeted one in 2020 was also considered. Regarding the completion potential surplus of the present gap or the actual index in the 2018 surplus the targeted one in 2020, this paper recognizes the province has completed its RPS target. It was assumed to be very hard to complete the target if the ratio of potential and gap was between 0 and 0.5. If the ratio was between 0.5 and 0.6, provinces found it hard to complete the RPS target. The same ratio was between 0.6 and 0.8 for provinces that found it easy to fulfill, while the ratio for another category of provinces recognized to be very easy to complete was between 0.8 and 1. The nationwide completion prospect is illustrated as a five-color map in Figure 3.

5.2. Result Comparisons and Validity

To illustrate the behavioral validity of our results, we compared them with the overlapping results for two similar studies developed by State Grid Energy Research Institute (SGERI)SGERI and China Electric Power Research Institute (CEPRI) [26,35]. These two official studies applied similar scenario analysis but simulated results based on more structural data for a complex power system (provincial online power grid). Their results could also figure out the added VRE consumption by singly adopting these two nearby accommodation approaches proposed in this paper. The first type of approach was to fully utilize and further modify peak regulation capacity of coal-fired units, and the other was to fulfill more generation rights trading between captive power plants and renewable power units. The maximum value for added VRE consumption via singly adopting the former is illustrated as A 1 , while the maximum value via singly adopting the latter is illustrated as A 2 . Not only were these two ideal values calculated from this paper and two similar studies compared, but also the actual added VRE consumption from 2016 to 2019.
For further demonstration, these two similar studies were simply introduced as follows. As for the first method developed by SGERI, the flexibility modification was to separately retrofit thermal power units to be so flexible that their minimum technical power output could be 30% and 40% of the rated installed capacity. The total modification plan for the whole provincial power system case covered 4 to 16 GW power units. The added VRE consumption was equal to reduced VRE curtailment and related value series could be calculated by proper trend extension based on the same modification scale as proposed in this paper. Similarly, results for A 2 could be calculated based on the relationship between substitution trading value series and VRE curtailment rate series. In contrast, the second method developed by CEPRI only illustrated the relationship between added substitution trading values and reduced VRE curtailment rate. Therefore, the results for A 2 could also be calculated by trend extension based on the same substitution plan as proposed in this paper. All these results are calculated based on similar conditions and data for the same typical years (from 2015 to 2016), compiled and organized in Table 6, so that they could be compared with each other.
The estimation for A 1 in this paper was assumed to be the most ideal VRE consumption a provincial power system ought to accommodate under the present conditions as long as it were to adopt the first approach immediately, and was more optimistic than that done by SGERI. In contrast, diverse results for A 2 revealed the fact that provinces with a huge amount of captive thermal power units are more sensitive to the second approach. All estimations for the Xinjiang Province are several times that of the values for Gansu and Ningxia Provinces. Meanwhile, the estimation acquired by SGERI was the most optimistic and the one done by CEPRI was the least, though estimations for two other provinces in this paper were also more than that done by others. The differential values between three methods indeed existed but all these results reflected similar behavior logic, with which these methods could estimate the evolution of VRE consumption for provincial power system. Thus, the results for scenario-based case studies in this paper were reasonable.
In addition, the actual added VRE consumption from 2016 to 2019 could indirectly reflect the rising potential for future VRE increase when the calculation was back to 2015 and 2016, considering a relatively high utilization level of VRE at present. All these actual data or upper limit for data were compiled from published data books or official reports. It is obvious that the actual added VRE consumption from adopting A 1 and A 2 was far lower than those maximum estimations acquired from three methods, which also contributed to illustrating the validity of our results.

6. Conclusions and Policy Recommendations

China’s new-modified provincial RPS will play a significant role in energy revolution amidst the tension between rapid growth and limited accommodation of non-hydro renewable energy. It was officially implemented in 2020 by assessing the physically-consumed accommodation in provincial electricity balance, and the complementary market-based one via assigning redundant the accommodation or voluntary trade of green certificates. Two basic characteristics of this new policy involve priority of nearby accommodation and direct assessment on accommodation. Thus, the adoption of nearby accommodation approaches will maintain core position during the implementation of RPS in this transition period. This paper focused on the prospects of completing a new provincial renewable portfolio standard in 30 provincial administrative regions across mainland China, and proposed a data-driven analysis framework to estimate the potential activated by nearby accommodation approaches. It began by introducing the evolution of RPS policy and the specific newly-modified demand-side-based assessment mechanism towards both single responsible subjects and overall provinces; highlighted in presenting a simplified calculation method for estimating nearby accommodation potential. This was followed by several scenario analyses combined with an introduction of background and implementation for approaches applied in two case studies, and ended with results discussion. Empirical results proved that maximum use and further modification of coal-fired units’ peak regulation performance and generation rights trading between captive power plants and renewable power units contribute to exploiting nearby accommodation potential and completing obligated quota. These nearby accommodation approaches are relatively suitable for those provinces in the Northeast and Northwest China which were close to renewable energy resources but less effective in provinces which were close to the nationwide load center in Southeast and North China. Other provinces in Middle China which possessing neither resource advantage nor location advantage would find it harder to complete RPS target merely via the single nearby accommodation approach.
This paper proposed policy recommendations in order to further activate the accommodation potential for VRE and fulfill the new renewable portfolio standard. First, provinces close to renewable energy resources should maintain the priority of nearby accommodation while provinces close to the load center should seek out other alternative ways such as trans-provincial or trans-regional accommodation. As the most urgent nearby accommodation approach, nationwide deep peak regulation modification of coal-fired power units should be sped up. More generation rights trade between captive power plants and renewable power units in related provinces should be encouraged. Second, further improvement of generation rights trade, peak regulation auxiliary service, and other market-based approaches such as provincial direct electricity trade and regional peak regulation aid should be conducted, in coordination with the reform of electricity market in China. Third, the approach portfolio is preferred rather over the adoption of a single measure, and further synergistic effects among various approaches should be explored. Fourth, provinces should prepare for inadequate physical accommodation and actively take part in accommodation assignment or voluntary TGC markets.

Author Contributions

Conceptualization, Y.B. and X.Z.; methodology, Y.B.; software, Y.B.; validation, Y.B.; formal analysis, Y.B.; investigation, Y.B.; resources, Y.B. and X.Z.; data curation, Y.B.; writing—original draft preparation, Y.B.; writing—review and editing, X.Z.; visualization, Y.B.; supervision, X.Z.; project administration, X.Z.; funding acquisition, X.Z. All authors have read and agreed to the published version of the manuscript.

Funding

This research was funded by the National Natural Science Fund of China, grant number 72074075.

Institutional Review Board Statement

Not applicable.

Informed Consent Statement

Not applicable.

Data Availability Statement

Data sharing not applicable. No new data were created or analyzed in this study. Data sharing is not applicable to this article.

Acknowledgments

The authors would like to thank the anonymous referees and the editor of this journal. The authors also gratefully acknowledge the administrative and technical support of the State Grid Gansu Electric Power Company and State Grid Qinghai Electric Power Company.

Conflicts of Interest

The authors declare no conflict of interest. The funders had no role in the design of the study; in the collection, analyses, or interpretation of data; in the writing of the manuscript; or in the decision to publish the results.

Appendix A

Table A1. Structural data of provincial electricity balance and accommodation, 2015 1,2.
Province I m p i t E N i t E H i t E C O i t E T i t C i t A i t E i t L i t
Inner Mongolia−13831.43.6342.2392.3254.330.6−0.831.4
Sichuan−121.61.2276.742.9320.8199.22.81.61.2
Yunnan−111.410217.727.6255.3143.97.3−2.710
Guizhou−75.73.382.7107.1193.1117.42.3−13.3
Shanxi−72.110.83.1231.9245.8173.712.11.310.8
Hubei−69.12.3130.3103235.6166.56.23.92.3
Anhui−42.22.44.9198.9206.21646.442.4
Xinjiang−31.820.820.3206.7247.821616.9−3.920.8
Ningxia−28.812.41.6102.6116.687.811.8−0.612.4
Gansu−12.918.633.670.6122.8109.912.5−6.118.6
Shaanxi−9.92.38.3121.5132.1122.23.312.3
Jilin−5.26.15.35970.465.27.91.86.1
Fujian−3.14.543.9110.9188.3185.26.31.84.5
Heilongjiang−2.67.21.980.489.586.99.72.57.2
Guangxi1.50.776.254.4132133.41.40.70.7
Hainan1.70.80.923.425.527.21.10.30.8
Qinghai8.58.237.11257.365.88.90.78.2
Jiangxi10.51.417.179.798.2108.72.411.4
Chongqing19.30.322.94568.287.51.20.90.3
Hunan19.52.35271125.3144.84.11.82.3
Tianjin200.7059.460.180.16.15.40.7
Henan32.11.510.9243.5255.92886.75.21.5
Liaoning36.611.33.2132.9161.9198.515.23.911.3
Shandong49.812.80.7448.4461.9511.725.712.912.8
Beijing53.10.30.741.242.295.37.26.90.3
Zhejiang58.32.422.9222.2297.1355.48.462.4
Shanghai58.51.108182.1140.62.31.21.1
Jiangsu68.99.61.2415.2442.6511.516.97.39.6
Hebei87.517.11.1210.6230.1317.624.1717.1
Guangdong152.24.528.4285.4378.9531.19.75.24.5
Source: Compiled by the authors from data yearbooks or reports issued by National Energy Administration (NEA) and China Electricity Council (CEC) [27,28,29,30,31,32,33,34]. 1 E T i t is total provincial electricity generated locally, I m p i t is the final import or export electricity outside province, and it is set to be negative if the province finally exported power. E N i t ,   E H i t , and E C O i t , respectively, refer to locally generated electricity from VRE, hydropower, and coal−fired power. The units of all variables are TWh. 2 Provinces shaded finally export electricity during provincial electricity balance.
Table A2. Structural capacity data of thermal power and maximum load of provincial power system, 2015.
ProvinceType of Capacity (%)
(Capacity of Single Unit, GW)
Total Capacity (GW)Maximum Load (GW)System Reserve Rate (%)Heating Unit Share (%)
≥10.6–10.3–0.60.2–0.3<0.2
Heilongjiang02137192320.411.91764
Jilin02241191817.810.71875
Liaoning7293871930.721.81666
Inner Mongolia04036101472.627.52443
Tianjin15164891212.811.22270
Hebei0324891143.542.718.363
Shandong6163034587.527.52151
Shanxi03540101559.429.72047
Shaanxi0513441129.4192023
Gansu0206351219.316.32650
Qinghai021398323.210.9230
Ningxia10264621619.816.22217
Xinjiang513455324230.32724
Sichuan0412952516.234160
Chongqing15273702114.110.82313
Shanghai18244201622.618.81919
Zhejiang26292232062.340.11815
Fujian7493301128.932.11924
Guangdong19302941873.293.51934
Guangxi13352242616.514.1210
Yunnan043393151433.4150
Guizhou0503421426.821.9200
Henan10412961462.147.218.527
Hubei12304021625.837.719.523
Jiangxi6562441017.915180
Anhui11552201246.127.11424
Hunan0513021721.931.8237
Jiangsu21303011883.873.11654
Hainan00600404.63.6300
Beijing003647179.78.61572
Source: China Electricity Council (CEC) [18,27,28,29].
Table A3. Investigation results of peak regulation depth of different coal−fired units typed by capacity.
Capacity of Unit /MWMinimum Technical Output/MWPeak Regulation Depth/%
10004500−55
8004700−41.7
6002800−53.3
5002900−42
3501800−48
3201800−43.7
3001650−45
Source: State grid corporation of China.

References

  1. Shu, Y.B.; Zhang, Z.G.; Guo, J.B.; Zhang, Z.L. Study on key factors and solution of renewable energy accommodation. Proc. CSEE 2017, 37, 1–8. (In Chinese) [Google Scholar]
  2. Li, H.; Zhang, N.; Kang, C.Q.; Xie, G.H.; Li, Q.H. Analytics of contribution degree for renewable energy accommodation factors. Proc. CSEE 2019, 39, 1009–1018. (In Chinese) [Google Scholar]
  3. He, Y.X.; Xu, Y.; Pang, Y.X.; Tian, H.Y.; Wu, R. A regulatory policy to promote renewable energy consumption in China: Review and future evolutionary path. Renew. Energ. 2016, 89, 695–705. [Google Scholar] [CrossRef]
  4. Bu, Y.H.; Zhang, X.P. The Prospect of New Provincial Renewable Portfolio Standard in China Based on Structural Data Analysis. Front. Energy Res. 2020, 8, 59. [Google Scholar] [CrossRef]
  5. Zhang, Y.Z.; Zhao, X.G.; Ren, L.Z.; Ji, L.; Liu, P.K. The development of China’s biomass power industry under feed−in tariff and renewable portfolio standard: A system dynamics analysis. Energy 2017, 139, 947–961. [Google Scholar]
  6. Rouhani, O.M.; Niemeier, D.; Gao, H.O.; Bel, G. Cost−benefit analysis of various California renewable portfolio standard targets: Is a 33% RPS optimal? Renew. Sust. Energy Rev. 2016, 62, 1122–1132. [Google Scholar] [CrossRef] [Green Version]
  7. Feng, T.T.; Yang, Y.S.; Yang, Y.H. What will happen to the power supply structure and CO2 emissions reduction when TGC meets CET in the electricity market in China? Renew. Sust. Energy Rev. 2018, 92, 121–132. [Google Scholar] [CrossRef]
  8. Zhang, Q.; Wang, G.; Li, Y.; Li, H.L.; Mclellan, B.; Chen, S.Y. Substitution effect of renewable portfolio standards and renewable energy certificate trading for feed−in tariff. Appl. Energy 2018, 227, 426–435. [Google Scholar] [CrossRef] [Green Version]
  9. Zuo, Y.; Zhao, X.G.; Zhang, Y.Z.; Zhou, Y. From feed−in tariff to renewable portfolio standards: An evolutionary game theory perspective. J. Clean. Prod. 2019, 213, 1274–1289. [Google Scholar]
  10. Li, W.; Liu, L.G.; Zhang, S.; Zhang, H.Z. Will the tradable green certifications and renewable portfolio standard policy work well in China: A recursive CGE analysis. J. Renew. Sustain. Energy 2018, 10, 055904. [Google Scholar] [CrossRef]
  11. Zhang, Y.Z.; Zhao, X.G.; Ren, L.Z.; Zuo, Y. The development of the renewable energy power industry under feed−in tariff and renewable portfolio standard: A case study of China’s wind power industry. J. Clean. Prod. 2017, 168, 532. [Google Scholar] [CrossRef] [Green Version]
  12. Zhu, C.P.; Fan, R.G.; Lin, J.C. The impact of renewable portfolio standard on retail electricity market: A system dynamics model of tripartite evolutionary game. Energy Policy 2020, 136, 111072. [Google Scholar] [CrossRef]
  13. Fan, J.L.; Wang, J.X.; Hu, J.W.; Yang, Y.; Wang, Y. Will China achieve its renewable portfolio standard targets? An analysis from the perspective of supply and demand. Renew. Sust. Energ. Rev. (in press). [CrossRef]
  14. NEA. Notice on Soliciting Opinions of Renewable Portfolio Standard and Assessment Measures. Available online: http://zfxxgk.nea.gov.cn/auto87/201803/t20180323_3131.htm (accessed on 23 March 2018).
  15. NEA. Notice on Soliciting Opinions of Renewable Portfolio Standard and Assessment Measures (The Second Version). Available online: http://www.sohu.com/a/256151232_776203 (accessed on 25 September 2018).
  16. NEA. Notice on Trial Implementation of Renewable Portfolio Standard and Assessment Measures. Available online: http://www.nea.gov.cn/2018−11/15/c_137607356.htm (accessed on 15 November 2018).
  17. NEA. Notice on Guarantee Mechanism of Renewable Energy Power Accommodation. Available online: http://zfxxgk.nea.gov.cn/auto87/201905/t20190515_3662.htm (accessed on 10 May 2019).
  18. NEA. Notice on Issuing Early Warning of Coal and Electricity Planning and Construction Risks in 2020. Available online: http://zfxxgk.nea.gov.cn/auto84/201705/t20170510_2785.htm (accessed on 20 April 2017).
  19. Matteo, Z.; Marco, G.; Marco, F.; Michele, R.; Agostino, G.; Mirko, M.; Emanuele, M. K−MILP: A novel clustering approach to select typical and extreme days for multi−energy systems design optimization. Energy 2019, 181, 1051–1063. [Google Scholar]
  20. Zhang, D.; You, P.Y.; Liu, F.; Zhang, Y.H.; Zhang, Y.T.; Feng, C. Regulating cost for renewable energy integration in power grids. Glob. Energy Interconnect. 2018, 1, 544–551. (In Chinese) [Google Scholar]
  21. Qudrat−Ullah, H.; Seong, B.S. How to do structural validity of a system dynamics type simulation model: The case of an energy policy model. Energy Policy 2010, 38, 2216–2224. [Google Scholar] [CrossRef]
  22. Kleindorfer, G.B.; O’Neill, L.; Ganeshan, R. Validation in simulation: Various positions in the philosophy of science. Manag. Sci. 1998, 44, 1087–1099. [Google Scholar] [CrossRef] [Green Version]
  23. Qudrat−Ullah, H. Behavior validity of a simulation model for sustainable development. Int. J. Manag. Decis. Mak. 2008, 9, 129–140. [Google Scholar]
  24. Sterman, J.D. Testing Behavioral Simulation Models by Direct Experiment. Manag. Sci. 1987, 33, 1572–1592. [Google Scholar] [CrossRef] [Green Version]
  25. Pidd, M. Why modeling and model use matter. J. Oper. Res. Soc. 2010, 1, 14–24. [Google Scholar]
  26. China Electric Power Research Institute. Production Simulation of New Energy Power System, 1st ed.; China Electric Power Press: Beijing, China, 2019; pp. 96–183. [Google Scholar]
  27. China Electricity Council. Compilation for Statistical Data of Power Industry in 2018, 1st ed.; China Electricity Council Press: Beijing, China, 2019; pp. 20–45. [Google Scholar]
  28. China Electricity Council. Compilation for Statistical Data of Power Industry in 2017, 1st ed.; China Electricity Council Press: Beijing, China, 2018; pp. 20–45. [Google Scholar]
  29. China Electricity Council. Compilation for Statistical Data of Power Industry in 2015, 1st ed.; China Electricity Council Press: Beijing, China, 2016; pp. 20–45. [Google Scholar]
  30. NEA. Report on the Monitoring and Evaluation of National Renewable Energy and Electricity Development in 2015. Available online: http://zfxxgk.nea.gov.cn/auto87/201608/t20160823_2289.htm (accessed on 16 August 2016).
  31. NEA. Report on the Monitoring and Evaluation of National Renewable Energy and Electricity Development in 2016. Available online: http://zfxxgk.nea.gov.cn/auto87/201704/t20170418_2773.htm (accessed on 10 April 2017).
  32. NEA. Report on the Monitoring and Evaluation of National Renewable Energy and Electricity Development in 2017. Available online: http://zfxxgk.nea.gov.cn/auto87/201805/t20180522_3179.htm (accessed on 11 May 2018).
  33. NEA. Report on the Monitoring and Evaluation of National Renewable Energy and Electricity Development in 2018. Available online: http://zfxxgk.nea.gov.cn/auto87/201906/t20190610_3673.htm (accessed on 4 June 2019).
  34. NEA. Report on the Monitoring and Evaluation of National Renewable Energy and Electricity Development in 2019. Available online: http://zfxxgk.nea.gov.cn/2020−05/06/c_139059627.htm (accessed on 6 May 2020).
  35. State Grid Energy Research Institute. Analysis Report on New Energy Power Generation 2020, 1st ed.; China Electric Power Press: Beijing, China, 2020; pp. 93–97. [Google Scholar]
  36. Li, S.T.; Zhang, S.F.; Andrews−speed, P. Using diverse market−based approaches to integrate renewable energy: Experience from China. Energy Policy 2018, 125, 330–337. [Google Scholar] [CrossRef]
Figure 1. Framework of this paper.
Processes 09 00361 g001
Figure 2. Evolution of renewable portfolio standard (RPS) policy: Characteristics on quota obligation and assessment, 2007–2019.
Processes 09 00361 g002
Figure 3. RPS completion potential brought by single approach of flexibility modification.
Processes 09 00361 g003
Table 1. Flexible and coal-fired power in power supply structure, 2016.
Regions or CountriesThree-NorthNCNECNWCSpainGermanyAmericaPortugal
Flexible power (%)3.97.61.50.834.317.548.734.0
Coal-fired power (%)69.980.170.156.811.731.130.19.5
Source: State Grid Corporation of China.
Table 2. Calculation setting of peak regulation depth for coal-fired power units typed by capacity.
Capacity of a Single Unit/GWMinimum Technical Output/%Peak Regulation Depth/%
≥14555
0.6–15248
0.3–0.65644
0.2–0.37030
<0.28515
Table 3. Flexibility modification scenarios of Northeast China 1.
Province T a r i 2018 T a r i 2019 T a r i 2020 I i 2015 I i 2016 I i 2017 I i 2018 S 1 S 2 S 3 S 4
Jilin151516.512.113.716.41717.016.118.117.1
Liaoning101010.57.78.69.211.711.210.411.710.9
Heilongjiang1517.520.511.212.415.816.215.514.816.515.8
Source: Calculated by the data from National Energy Administration (NEA) [17,30,31,32,33,34]. 1 I i T (%) is the actual accommodation proportion from 2015 to 2018.
Table 4. Generation rights trading scenarios of Northwest China 1.
Province T a r i 2018 T a r i 2019 T a r i 2020 I i 2015 I i 2016 I i 2017 I i 2018 T C A i 2016 E C A i 2016 I C A i 2016 S 5 S 6 S 7
Gansu14.5171911.412.513.813.42475247909.916.018.320.7
Ningxia18182013.419.12122.3815213903.822.725.127.6
Xinjiang11.512137.811.113.114.76120965006.319.224.629.9
Source: Calculated from the data from NEA [17,30,31,32,33,34]. 1 T C A i 2016 (GWh) is the trading electricity of generation rights trading in 2016, E C A i 2016 (GWh) is the total generation of captive power plants in 2016, I C A i 2016 (%) is the actual assigning share in 2016.
Table 5. Simulation results for the index of RPS completion by single approach of flexibility modification 1,2.
RegionProvince I i 2015 I i 2018 T i 2020 S 1 S 2 S 3 S 4
North ChinaBeijing7.611.71510.610.311.310.9
Tianjin7.6111511.510.812.111.4
Hebei7.611.31511.310.711.911.1
Shandong59.4107.56.97.97.2
Shanxi714.514.5109.410.79.9
East ChinaJiangsu3.377.54.94.65.24.8
Zhejiang2.45.37.53.43.43.73.5
Anhui3.91111.55.85.56.15.6
Fujian3.44.965.155.45.1
Shanghai1.63.33.02.42.42.62.5
Middle ChinaHubei3.77.5105.65.45.95.5
Hunan2.810.2134.34.24.54.3
Henan2.39.410.53.53.33.73.4
Jiangxi2.28.683.23.23.53.5
Sichuan1.44.43.5222.22.2
Chongqing1.42.92.521.92.12
Northeast ChinaHeilongjiang11.216.220.515.514.816.515.8
Liaoning7.711.710.511.210.411.710.9
Jilin12.11716.51716.118.117.1
Northwest ChinaShaanxi2.710.6123.83.74.13.9
Gansu11.413.41916.515.817.516.4
Qinghai13.518.52517.617.61919
Inner Mongolia1217.31817.316.218.417
Ningxia13.422.32020.319.921.420.2
Xinjiang7.814.71312.41212.912.2
South ChinaGuangdong1.83.542.92.632.7
Guangxi14.251.61.61.81.8
Guizhou24.55.0333.23.2
Hainan45.255.65.65.95.9
Yunnan5.115.611.57.87.88.28.2
1 Simulation results are calculated based on the structural data from 2015 to 2018 [17,27,28,29]. 2 Provinces not shaded have completed their obligated quota for 2020 until the end of 2018.
Table 6. Comparison among results from different methods: Added variable renewable energy (VRE) consumption by adopting a single approach.
ProvincesResults from Different Methods: Added VRE Consumption by Adopting a Single Approach (TWh)Actual Added VRE Consumption from 2016 to 2019 (TWh)
This PaperSGERICEPRI
A 1 A 2 A 1 A 2 A 2 A 1 A 2
Heilongjiang4.0 -5.4 --<12.1-
Liaoning6.4 -5.7 ---
Jilin3.3 -5.1 ---
Gansu5.5 9.9 5.3 7.9 5.3 <10.036.9
Ningxia6.0 12.6 5.4 4.3 3.1 4.5
Xinjiang9.5 39.6 5.0 43.0 18.8 28.9
Publisher’s Note: MDPI stays neutral with regard to jurisdictional claims in published maps and institutional affiliations.

