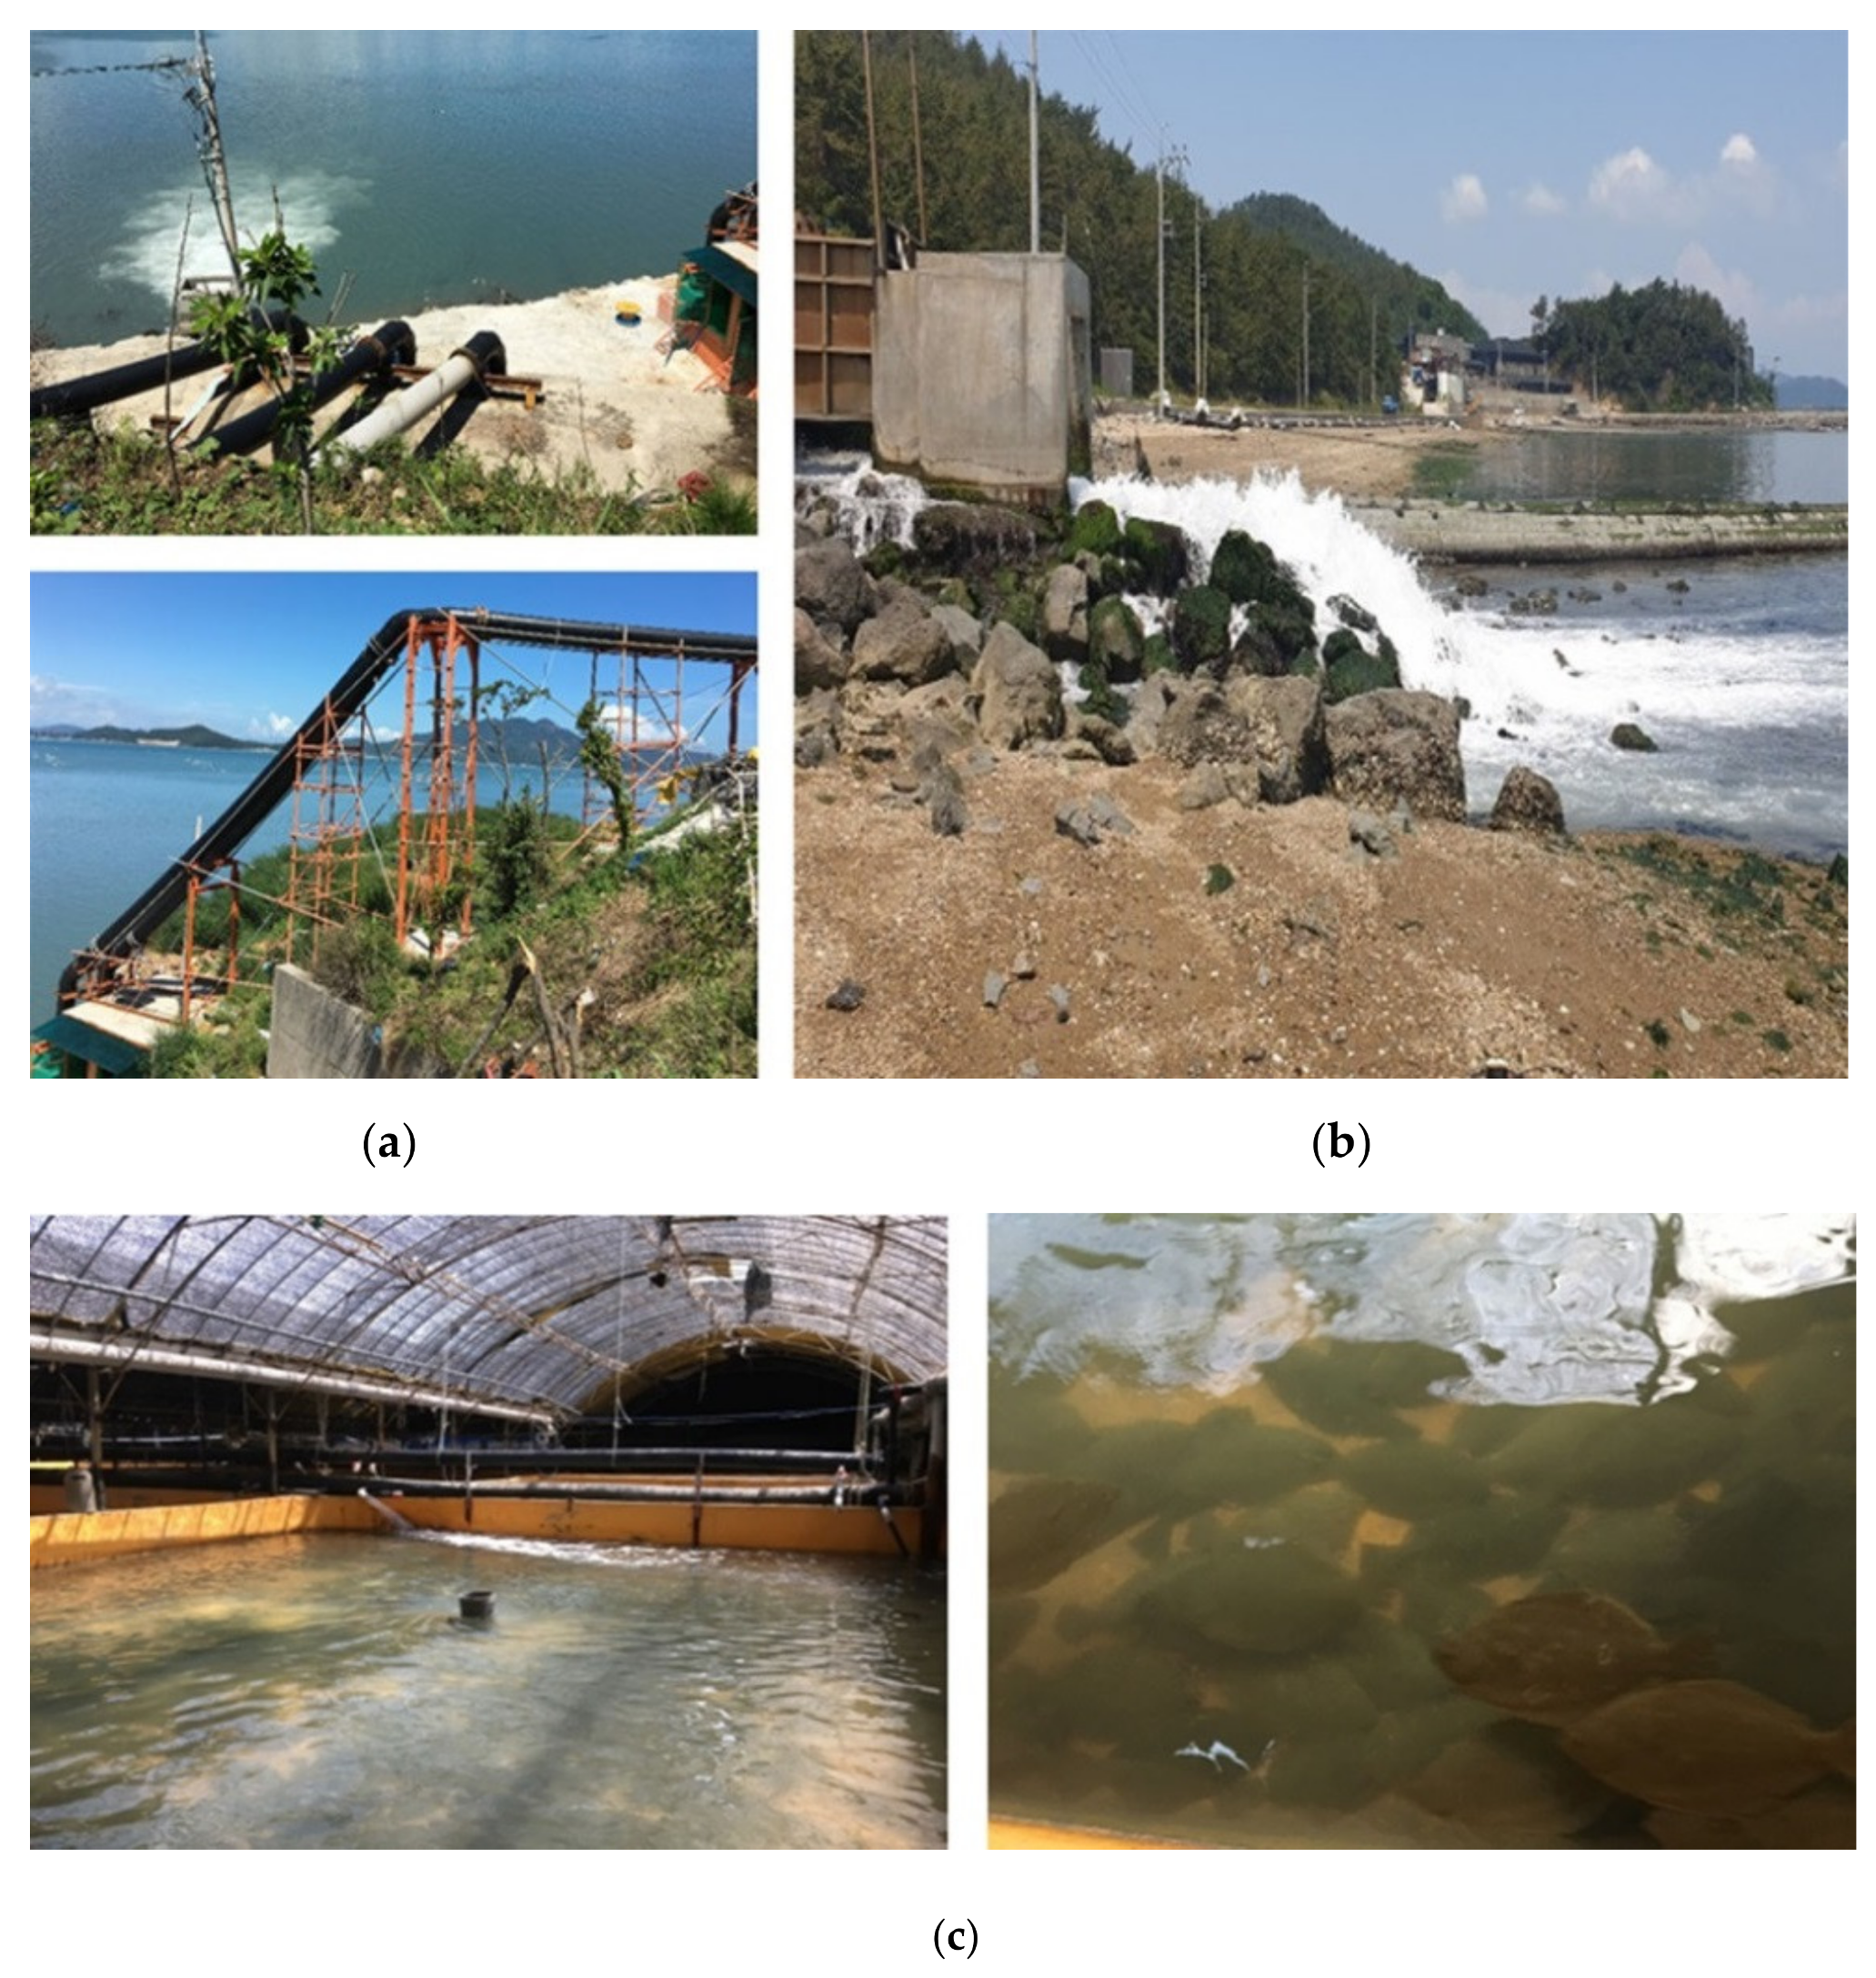
Article

Development of a Hydropower Turbine Using Seawater from a Fish Farm

1
Department of Mechanical Engineering, International University of Business Agriculture and Technology, Dhaka 1230, Bangladesh
2
School of Mechanical Engineering, Soongsil University, Seoul 06978, Korea
3
School of Mechanical Engineering, GNTECH, Jinju 52725, Korea
4
Namhae Energy Co., Ltd., Changwon-si 51395, Korea
5
Department of Mechanical Engineering, Korea Polytechnic University, Siheung-si 15073, Korea
*
Authors to whom correspondence should be addressed.
Processes 2021, 9(2), 266; https://doi.org/10.3390/pr9020266
Submission received: 31 December 2020 / Revised: 25 January 2021 / Accepted: 26 January 2021 / Published: 30 January 2021

Abstract

:
Discharge water from fish farms is a clean, renewable, and abundant energy source that has been used to obtain renewable energy via small hydropower plants. Small hydropower plants may be installed at offshore fish farms where suitable water is obtained throughout the year. It is necessary to meet the challenges of developing small hydropower systems, including sustainability and turbine efficiency. The main objective of this study was to investigate the possibility of constructing a small hydropower plant and develop 100 kW class propeller-type turbines in a fish farm with a permanent magnet synchronous generator (PMSG). The turbine was optimized using a computer simulation, and an experiment was conducted to obtain performance data. Simulation results were then validated with experimental results. Results revealed that streamlining the designed shape of the guide vane reduced the flow separation and improved the efficiency of the turbine. Optimizing the shape of the runner vane decreased the flow rate, reducing the water power and increasing the efficiency by about 5.57%. Also, results revealed that tubular or cross-flow turbines could be suitable for use in fish farm power plants, and the generator used should be waterproofed to avoid exposure to seawater.

1. Introduction

Hydropower is expected to remain the world’s largest source of renewable electricity and to play a critical role in decarbonizing the power system and improving system flexibility. In 2016, world hydropower installed capacity was 1064 GW, and annual power generation was 3940 TWh [1]. Hydropower generation has been declining in Southeast Asia and the Americas due to continued drought caused by climate change. However, demand for hydroelectric power generation is increasing to cope with the increasing proportion of renewable energy and to adapt to increasing power demands from industrialization and the climate change crisis [2]. The hydropower industry is improving its efficiency, output, and system resilience through modernization, improving old facilities and renovating and expanding existing facilities [3,4]. Small scale hydropower development is being studied worldwide to improve technology to make it more reliable and economically efficient, which is necessary due to climate change, high oil prices, and environmental problems [2]. In addition, domestic small hydroelectric power generation technologies are being localized due to new and renewable energy certificates (RECs) and the sale of electric power in domestic institutions and corporations; a continuous decrease in the development unit price has also been affected by small and medium enterprises [3,5,6]. Therefore, particular attention should be paid to small scale hydropower plants operating in low head conditions [7,8], the significant possibility of which is still not fully identified.
Small hydropower (SHP) has been used to produce renewable, clean, and abundant energy [9]. In a study of SHP, Ma et al. conducted a study on runners to develop general purpose 2.5 kW micro-water vehicles [10]. Borkowski et al. validated computational fluid dynamics (CFD) on SHP with electrical generator integrated with experiments, and the main results were the mechanical power losses in the hydro-set gap and selection of suitable turbulence model [11]. Huidong et al. conducted a study on the possibility of replacing composite runner blades and mechanical stainless steel runner blades as a way to increase the economics of SHP in stream sites [12]. Wen-Quan et al. investigated the development of water turbines available in rivers through computational fluid dynamics [13]. Punys et al. [14], reviewed small scale hydropower resource assessment for the development of small hydropower plants using sophisticated software tools.
However, it represents only around 1.5% of the world’s total installed electricity capacity, 4.5% of its total renewable energy capacity, and 7.5% (<10 MW) of its total hydropower capacity [15,16]. Currently, there are few possibilities to develop and construct small hydropower plants [17].
In Korea, fish farms operate approximately 600 units from the southern area, which is at 350 units, and Jeju Island, which is at 250 units. Fish farms are environmentally friendly, pollution-free, low cost, and guarantee the income of fishing villages. A small hydropower plant that produces from 20–500 kW can utilize surplus recirculated water from fish farms [18,19,20]. Propeller-type tubular turbines could be suitable for use in fish farm hydropower plants [21]. Propeller turbines have a simple structure and a fixed blade, the cost is relatively lower than that of the Kaplan turbine, and they have a high likelihood of successful use in small hydropower plants [22,23,24,25]. Li et al. [26], analyzed hydraulic performance according to the operating conditions of turbines through numerical analysis and studied the effects of the opening angle of the guide vanes.
CFD has been applied to the design of hydro turbines and can be used in numerical simulation to obtain hydraulic performance. Vu et al. [27] studied a Pico propeller hydro turbine using the old runner model and improved the performance of the turbine using CFD. Park et al. [28] studied the flow analysis of 30 kW gate turbines using a permanent magnetic generator as well as the dynamic behavior of the flow stability of operating conditions. Nasir, B. A. [29] was focused on the selection of suitable micro-scale hydropower plant components. In [30], the authors focused on preliminary studies of economic feasibility, the design of civil works, and the selection of electro mechanical components, and developed a 15 kW micro-scale hydropower plant for rural electrification. In [31], the authors investigated four different propeller turbine models with head ranges of 4–9 m and generated an efficiency of 68%. The efficiency of small hydropower plants is generally in the range of 60–80% [27]. In [32], the authors studied the fish passage experience and passage facilities, especially how fish friendly they were, at a small scale hydropower plant. However, the study did not show design and performance improvements in a micro-scale hydropower plant using seawater from a fish farm.
Therefore, this study has especially focused on the applicability of a 100 kW class small propeller-type turbine (with an annular permanent magnetic generator). It is intended to serve as a reference for researchers who want to approach this field in the future by conducting prior research on the development of SHP available in Korea’s marine characteristics, such as fish farms, through computational fluid dynamics and certificated field tests. In addition, we intend to provide basic data on the possibility of hydrodynamic characteristic changes due to simple feature changes in draft tubes, guide vanes, and runner vanes, which are important components of SHP.

2. Hydropower Turbine Design

2.1. Fish Farm Facilities

In fish farm facilities, seawater is supplied through the water supply system by a pipeline 20–30 m above sea level. The water is recirculated for use in the fish farm and finally discharged through the discharge channel into the sea. Fish farm facilities are shown in Figure 1. The plan was to install the hydropower plant on a shared water surface along the coast. Therefore, data regarding sea level and tide observations was important for the development of the fish farm. Figure 2 illustrates the monthly average tide levels in the southern sea off the coast of Korea [33].

2.2. Hydroturbine Design

A horizontal propeller type tubular turbine was designed with nine fixed guide vanes, which were attached via a guide vane casing. Runner blades were directly attached to the end of the permanent magnet synchronous generator (PMSG) [34], and an s-shaped draft tube, which was chosen to ensure maximum recovery with minimum loss. The generator was designed to be installed on a shared seawater surface. The fish farm hydropower plant layout was chosen for its low head and flow rate, compact and simple mechanism, low maintenance needs, and environmental friendliness. Table 1 shows the major design parameters of the tubular turbine. When the one dimensional (1–D) design of the turbine was considered, specific speed ( N S ) was a meaningful parameter for identical geometric proportions if the sizes and speeds were different. The specific speed was expressed as follows:
N S = N P H 5 / 4
where N is the turbine rotational speed in rpm, H is the net head in m, and P is the turbine power in kW. The choice of the blade rotational speed depends on the generator and the type of the drive used [35,36,37].
We considered two rotational speeds in this study, 600 rpm and 900 rpm. The turbine selection was referenced from the H–NS chart [37]. The chart shows that at 600 and 900 rpm, the specific speeds were 230 and 345 respectively. The diameter of the turbine is calculated as follows:
D = 60 k u 2 g H π N
where, k u is the non-dimensional blade velocity, and the value is 1.5~2 [35]. The main specifications of the turbine runner blade are shown in Table 2. The hub ratio was 0.5. The block diagram of the design process for the new propeller turbine model has been shown in Figure 3. The turbine design process used a trial and error-based algorithm with several times numerical analyses for optimum geometry [35].

3. Methodology

The installation location of the small hydropower plant was the southern area of Korea. This fish farm was equipped with a water pump supply system. Seawater is recirculated into the fish farm and discharged through the discharge water channel. The installation facilities were designed to be installed in a shared water surface without a building, that is, they were environmentally friendly. A schematic installation diagram of the marine small hydropower plant has been shown in Figure 4.

3.1. Numerical Method

3.1.1. Geometrical Model and Meshing

The three dimensional (3D) geometry of the horizontal prototype propeller type tubular turbine was selected to analyze the flow characteristics as shown in Figure 5. The 3D turbine model was meshed by ANSYS ICEM-CFX (16.2) software (16.2, ANSYS Inc., Canonsburg, PA, USA, 2016) The flexibility of the complex design of the hydraulic turbine allowed the unstructured prism tetrahedral grid system to be employed to make the grid. Overall, meshing grids comprised 1,192,047 nodes and 4,302,575 elements. Unstructured tetra-prim meshing grids have been shown in Figure 6. To precisely simulate the flow in a whole turbine channel, further grid refinement is required. However, the grid cannot be too large, which is needed for a comparatively fine grid, as numerical simulations lead to a considerable amount of computational data. To reduce the influence of grid number on computational results, a grid dependency study at the rated head (15 m) operating condition (GV 60° and RV 24°) was conducted. This showed that the efficiency deviation was less than 1% [38,39], as shown in Figure 7. The grid independency test was carried out based on the grid convergence index (GCI) method [40,41,42]. With this, the approximate and extrapolated relative errors can be written as:
ε a = ε n e w ε o l d ε n e w × 100 %
The grid convergence index can be calculated as
G C I = 1.25 × ε a r 2 1
where ε a is the relative error and r is the mesh ratio.
The cells’ finite volume approaches near the wall boundary are irregular, potentially requiring a special procedure. First, prisms create a layer near the wall of regular prisms and then mesh the remaining volume with tetrahedrons [39,43]. This grid approach improves the near walls and provides better solutions and convergence of computational methods [43].
The mesh quality of the tubular turbine is shown in Table 3. The estimated numerical uncertainties in the hydraulic turbine are shown in the Table 4. From the table, the 1,192,047 grid density showed higher efficiency with lower uncertainties compared to the other grid density. Therefore, 1,192,047 grid densities were selected as the final grid scheme for numerical computation. The Y+ contour of the runner and hub has been shown in Figure 8.

3.1.2. Governing Equations

Numerical analysis of the fluid flow was based on continuity and momentum equations [44,45], which are expressed as:
u i x i = 0
ρ u i t + u j u i x j = p x i + x j μ u i x j ρ u i u j ¯
where ρ and μ are density and dynamic viscosity respectively, p is the pressure scalar, and ρ u i u j ¯ is the apparent turbulent stress tensor.
For numerical simulation, the tubular turbine domain was considered a steady-state, incompressible flow. The flow through the tubular turbine was simulated with the commercial code ANSYS-CFX (16.2) based on finite volume methods (FVM) [44]. The runner domain was rotating on the z-axis at a given rotating speed of 850 rpm, and the inlet pipe, generator, guide vane, and draft tube were a stationary domain.
Figure 9 shows the tubular turbine domain for the computer simulation. All boundary conditions were assumed as smooth walls with no-slip, and automatic wall functions were considered in the near wall region. Moreover, regular smooth wall functions were used, so that at a non-dimensional distance from the walls Y+ the first grids were placed. Near a no-slip wall, there are negative gradients in dependent variables, according to conventional theory. Also, the viscous effects on transport processes are relatively high; these measurements are spread across the wall-adjacent viscosity-affected sublayer. Computer performances and ability demands are greater than those of the wall function, and a certain strong computational resolution in the near-wall area can be taken care of to understand the rapid difference in variables [44]. An automated wall treatment mechanism has been developed by ANSYS-CFX to minimize the resolution requirements, allowing a gradual switch between wall functions and low-Reynolds number grids, without loss of precision [44]. The well-accepted way to account for wall effects is through wall functions. In CFX, an automatic near-wall treatment feature was reported in the near-wall region for k-ω–based models (including the SST model) [44,45].
The static pressure boundary conditions were imposed on the inlet and outlet of 1.47 bar and −0.0245 bar. A frozen rotor was applied to couple the rotation and stationary domain. Menter’s shear stress transport (SST) k-ω turbulence model [46,47] was used to solve the turbulence phenomena of the fluid. Also, the SST model accounts give highly accurate predictions of the onset and the amount of flow separation under adverse pressure gradients [46]. Advection term dealt with high-resolution discretization scheme, and the first-order upwind difference was used to solve the turbulence numeric. The residual value was 1 × 10⁻⁵ controlled by convergence criteria.

3.2. Experimental Method

The performance of the manufactured water turbine was measured in the field. Experimental measurements and calibrations were taken using the IEC-60193 procedure and guidelines [48]. The inlet pipe diameter was 925 mm. A pressure gauge at a range of 0~1 MPa was installed and located at the turbine upstream. Flow rates were measured by the differential pressure sensors located near the generator. The flow rate was measured based on the pressure differential chart provided by Korea Testing Certification (KTC). The experiment was carried out three times at 30 min intervals. The combined standard uncertainty in the hydraulic turbine is the effect of the standard uncertainty of the independent variable on the uncertainty of the flow rate. Unfortunately, only three measurement data for the degree of freedom (DoF) could not illustrate the 95% confidence limit and error propagation from the result (Table 5) [39]. Figure 10 illustrates the experimental layout and devices of the small hydropower plant at the fish farm.

4. Results and Discussion

4.1. Validation of Numerical Results

Numerical simulations were validated with experimental data. Table 5 illustrates CFD performance and experimental results for the tubular turbine. As shown in Table 6, the average deviation of the head was 0.231%, and the flow rate deviation was only 2.105% at a rotational speed of 496 rpm [39,49]. The power output and efficiency of the turbine were different due to the different runner vane openings in the experiment and simulation. The power and efficiency of the measuring procedure were different due to the different runner vane angles in the experiment and simulation. Also, in simulation, we did not take into account the bearing and generator loss. In a hydraulic system, the three kinds of losses are hydraulic loss, shaft loss, and generator or bearing loss. However, in the simulation, we only considered the hydraulic part, as shown in Figure 11, that included hydraulic and shaft losses. Also, different runner vane openings were used in the simulation because when it created the exact opening angle, the runner blades were crossed the interface between the guide vane outlet and runner vane inlet. If it could happen in the computer-aided design (CAD) model, the simulation would not run by the ANSYS-CFX solver. Therefore, we solved this issue as much by opening the runner vane angle which was closed to the experimental vane opening. When the runner vane opening angle was 24°, and the guide vane opening angle was 60°, the power output was 97.13 kW. As the opening angle of the runner vane decreased, efficiency increased, but flow rate and power decreased. When the opening angle of the guide vane angle was 40°, and the opening angle of the runner vane was 19°; maximum power output (128.78 kW) was possible under a flow condition of 1.13 m3/s. Further review of this part is needed. With an efficiency of 79.90% in close proximity, the runner vane angle was between 26° and 28°. However, power and flow decreased. A field performance test was conducted under the environmental conditions of 1024 kg/m3, a working dry temperature of 26 °C, a relative humidity of 74%, and an atmospheric pressure of 101 kPa. Turbine output obtained from the field performance test was 98.7 kW, and the overall efficiency of the hydraulic turbine was 79.90%, which was 3.9% higher than the guaranteed efficiency of 76%. The turbine efficiency curve is shown in Figure 12 as a comparison between the expected efficiency of the computer simulation and the efficiency obtained from the field performance test.

4.2. Performance Characteristics

Computer simulations were conducted at different flow rates by changing the guide vane and runner vane opening angles of the tubular turbine. Guide vane opening angles varied from 40°~60°, and runner vane opening angles varied from 14°~24°. Figure 13 and Figure 14 show the efficiency, flow rate, and power performance characteristics of the tubular turbine with different runner vane and guide vane opening angles. In the graph, maximum efficiency was 81.67%, and power output was 101.54 kW at a flow rate of 0.854 m3/s. In this case, the runner vane opening angle was 14°, and the guide vane opening angle was 50°. As the runner vane angle increased, the flow rate increased linearly, and the power increased sharply as shown in Figure 14. Also, when runner vane and guide vane angles varied to maximum (fully open, Figure 13 and Figure 14), efficiency was low (67.13%), and power was 97.13 kW at a flow rate of 0.994 m3/s.
The rated flow rate was found when the runner vane opening angle was 19°, and the guide vane opening angle was 40°. In this case, efficiency was found to be 78.44%, and power output was 128.78 kW at a flow rate of 1.13 m3/s. Figure 15 shows the blade-to-blade pressure and velocity (magnitude) distributions at a 0.5 span (non-dimensional blade height = 0.5). In this figure, the dotted circle represents the leading edge and trailing edge of the runner blade. The pressure was maximum, and the velocity was minimum at the leading edge of the pressure side. Velocity was not distributed uniformly from the leading edge to the trailing edge of the runner vane. Velocity decreased at the trailing edge of the runner vane, and a small vortex formed in this region.
Figure 16 shows the velocity vector and streamlines of the blade-to-blade guide and runner vane. The figure shows that the guide vane makes the flow pattern non-uniform through the runner vane, and this phenomenon could not reach the desired value. A vortex was also formed near the front of the guide vane and a recirculating flow occurred. Large recirculation flow occurred near the hub of the runner outlet [49].

4.3. Design Modification for Performance Improvement of Turbine

4.3.1. Shape of Guide Vanes

The performance of guide vanes with short and long chords was compared. Figure 17 shows the cross-section before and after the shape of the guide vane was changed. The vane-to-vane streamlines distribution of guide vanes and runner vanes are shown in Figure 18. In Figure 18, a vortex occurred at the leading edge of the guide vane in both the short and long blade chords. When the blade chord was long, the pressure difference between the leading edge and the trailing edge of the guide vane was large, but the size of the recirculation area was slightly reduced. Additionally, velocity decreased slightly in the leading edge of the guide vane.
Table 6 shows performance characteristics according to guide vane shape. As the size of the blade chord of the guide vane increased, flow rate decreased, as a result of reducing the water power and shaft power and increasing the efficiency by 0.56%. Compared to guide vanes with short chords, guide vanes with long blade chords had lower flow rates due to the change in pressure distribution, even though the recirculation area was slightly reduced. Figure 19 shows the turbine loss analysis. From a loss analysis point of view, efficiency changed generally around 1–2% according to changes in the length of the guide vane. Additionally, it was more important to change the shape of the runner vane than the shape of the guide vane.
The optimum total efficiency depends on the design and operating conditions of turbine, it is especially important to reduce the main losses which are divided the losses into frictional and kinetic parts. Loss analysis states that loss due to runner is a mainly large part of the number of losses and determines hydraulic overall efficiency [37,50]. Therefore, it is necessary to first look at the efficiency changes caused by the change in runner shape and analyze the effects of the closely related guide vane shape changes. From a loss analysis point of view, efficiency changed generally around 1–2% according to changes in the length of the guide vane. The flow rate into the runner is controlled by the shape of the guide vanes. As a result, the velocity triangles in the runner will vary from section to section. Thus, it was more important to change the shape of the runner vane than the shape of the guide vane.

4.3.2. Guide Vanes Attached to the Generator Side

Figure 20 shows that the guide vane is attached to the generator side when the chord is short. Figure 21 shows the vane-to-vane pressure and streamline distribution of the guide vane and runner vane. Table 7 shows performance characteristics of the guide vane attached to the generator side. Results showed that efficiency increased by 1.33% when guide vanes were attached to the generator side. However, a vortex flow occurred at the front of the guide vane, and a large pressure drop appeared.

4.3.3. Streamlining the Shape of the Guide Vane

(1) In the case of a short cord
In this investigation, the shape of the guide vane was changed to a streamlined shape. Figure 22 illustrates a cross-sectional view of the guide vane’s streamlined shape. Figure 23 shows the vane-to-vane streamline distributions of guide vanes and runner vanes. Changing the streamline shape of the guide vane improved its pressure distribution. As shown in the streamline diagram (Figure 23), flow separation was also reduced due to the streamlined shape around the front of the guide vane, improving the efficiency of the turbine. Table 8 shows performance characteristics of guide vanes with a streamlined shape when the wing string was short. After guide vanes were streamlined, efficiency decreased, and the rated flow rate was not reached. Changing the opening degrees of guide vanes and runner vanes to bring out the rated flow increased efficiency by 0.21%. It was believed that efficiency did not increase much, because the shape of the leading edge of the runner vane was designed incorrectly.
(2) In the case of long chords
In this investigation, the long chord shape of the guide vane was chosen. Figure 24 shows the vane-to-vane pressure and streamlines distributions of guide vanes and runner vanes. The flow separation was disappeared from the guide vane. Table 9 illustrates the performance characteristics of streamlined guide vanes when the wing string was long. In Table 9, efficiency changes were insignificant in the case of short and long chords.

4.3.4. Runner Vane Shape

The shape of the runner vane was changed as shown in Figure 25. Table 10 shows the performance characteristics of different runner vane shapes. Flow rate decreased according runner vane shape, reducing the water power and increasing the efficiency by about 5.57%.
When the opening angle of the guide vane and runner vane was changed to reach the rated flow rate (1.131 m3/s), efficiency increased by 4.47%. Figure 26 shows the vane-to-vane pressure and streamline distribution of guide vanes and runner vanes. In the figure, flow separation disappeared after changing the shape of the runner vane. Also, performance characteristics of turbines with different shapes were compared. Figure 27 shows the efficiency and flow performance characteristics of guide vanes with different opening degrees (GV-38° and GV-40°). Results showed that efficiency was lower in short guide vanes than in long guide vanes.

4.3.5. Rotational Speed

The performance characteristics of generators with different rotational speeds were investigated. When the generator ran at 850 rpm, the tubular turbine would not operate functionally, and an increase in vibration could stop the hydroelectric power plant. Therefore, a reduced rotational speed was considered to stabilize the turbine operation. Table 11 shows the performance of runner vanes with different rotation speeds. In the table, efficiency gradually decreased as rotational speed decreased. The flow rate and output also decreased sharply. There was no major change in efficiency (only 0.86% difference) when the rotation speed was 650 rpm.
The effect of tidal level on the turbine was investigated. Figure 28 shows changes in performance characteristics according to the rotational speed and tidal level (high and low tide). At higher tides, the efficiency and flow rate of the turbine was slightly higher than at low tides for different rotational speeds. There was a remarkable power output difference between high and low tides (Figure 28c).

4.3.6. Optimum Model

After changing the shape of the turbine draft tube, performance characteristics were reviewed. Efficiency after the shape modification of the draft tube was 77.67%, which was 0.98% less than efficiency before modification. The influence of the shape of the draft tube on efficiency was insignificant. Performance changes when the guide vane was changed to short and long blade strings were examined. Vortex flow occurred at the leading edge of the guide vane for both short and long blade strings. As flow rate decreased, the difference in efficiency in the case of power was within the error range. Efficiency increased by 1.33% when guide vanes were attached to the generator side. Streamlining the shape of the guide vane improved the pressure distribution around it. Streamlining the shape around the front side of the guide vane reduced flow separation and improved efficiency. Changing the shape of the guide vane made the recirculation zone and flow separation disappear when blade chords were both long and short. However, it was more important to change the shape of the runner vane than the shape of the guide vane. Changing the runner vane shape increased efficiency by 4.47%, and the rated flow rate emerged at a runner vane opening angle of 24°. When comparing the performance characteristics of runner vanes with long and short chorded guide vanes, the efficiency of short guide vanes was lower than that of long guide vanes.
The optimized runner vane and guide vane angles were RV-24° and GV-40°, respectively. Design specifications were considered for the manufacture and development of the fish farm power plant. At a rotational speed of 850 rpm, the flow rate was 1.101 m3/s, output was 133.43 kW, and efficiency was 83.41%. At a rotation speed of 650 rpm, stable performance was obtained. In this case, the flow rate was 0.994 m3/s, output was 114.03 kW, and efficiency reached 78.75%.

5. Conclusions

This study investigated the applicability of using fish farm recirculating discharge water. A new prototype propeller type tubular turbine was designed, and a CFD analysis was carried out to analyze its performance. Numerical simulations were validated with experiments using the IEC-60193 procedure. Various design parameters were investigated to determine the rated flow rate at the best efficiency. When runner vane and guide vane angles varied to the maximum (fully open), efficiency was low (67.13%), and power was 97.13 kW at a flow rate of 0.994 m3/s. With smaller runner vane opening angles, efficiency increased, but flow rate and output decreased. The maximum output (133.43 kW) was reached at a flow rate of 1.13 m3/s when the opening angle of the guide vane angle was 40°, and the runner vane opening angle was 19°. In this case, turbine efficiency was 78.44%. Recirculation formed near the front of the guide vane and rear of the hub. Velocity streamline distributions of the turbine were distributed non-uniformly. The tubular turbine was optimized using computer simulation to modify the shapes of runner and guide vanes, opening angles, and so on. From a loss analysis point of view, the runner component was the main part of the loss, more than the guide vane component. Thus, total efficiency sharply increased when the shape of the runner vane changed. Optimized runner vane and guide vane angles were RV-24° and GV-40°, respectively. The guide vane should be fixed, and the runner vane should be adjustable, so the vane angle can be adjusted according to the installation location. Turbine performance was optimized satisfactorily. Tubular or cross-flow type turbines are suitable for use in fish farm power plants, and generators should be waterproofed to prevent exposure to seawater. Using renewable energy from the circulated water of fish farms could meet the challenges faced during the development of hydroelectric power plants.

Author Contributions

M.R. conceived and designed the study, analyzed the results, wrote the paper, and edited the draft; S.-H.S. contributed to project administration, conceptualization and supervised the work; H.-H.K. managed resources and edited the draft; Y.R. contributed to fund acquisitions and resources the work; and K.Y.K. managed resources, fund acquisition, and advised on project work. All authors have read and agreed to the published version of the manuscript.

Funding

This research was funded by the Korea Technology and Information Promotion Agency for SMEs (TIPA), grant number S8025391, and the article processing charge (APC) was funded by grant number S8025391.

Data Availability Statement

The data that support the findings of this study are available from the corresponding author, upon reasonable request.

Acknowledgments

This research was supported by TIPA. The grant number was S8025391 for the promotion of science. Authors also extend their gratitude to Hyung-Woon Roh for his assistance during the project work.

Conflicts of Interest

The authors declare no conflict of interest.

Nomenclature

CFDComputational fluid dynamics
GCIGrid convergence index
PMSGPermanent magnet synchronous generator
DoFDegree of Freedom
DTurbine diameter, m
gAcceleration due to gravity, m/s2
HHead, m
k u Non-dimensional velocity
PPower, kW
QFlow rate, m3/s
u i Velocity vector, m/s
Greek Symbols
ρDensity, kg/m3
ηTurbine efficiency, %
μViscosity, Pa·s
Subscript
i, jTensor indices

References

  1. Girling, B.; Lane, T. World Energy Resources Hydropower 2016; World Energy Council: London, UK, 2016. [Google Scholar]
  2. Koch, F.; Prasch, M.; Bach, H.; Mauser, W.; Appel, F.; Weber, M. How Will Hydroelectric Power Generation Develop under Climate Change Scenarios? A Case Study in the Upper Danube Basin. Energies 2011, 4, 1508–1541. [Google Scholar] [CrossRef]
  3. Kim, H.-G. Korea Institute of Energy Research, New and Renewable Energy Resource Mapping and Utilization System Construction Project; Korea Institute of Energy Research: Daejeon, Korea, 2013. [Google Scholar]
  4. Park, N. Development of Hydraulic Gate Turbine and Its Evaluation of Hydraulic and Dynamic Performances; Soongsil University: Seoul, Korea, 2018. [Google Scholar]
  5. Byun, J.-R. Korea Energy Agency, 2014 Annual Report; Korea Energy Agency Global Strategy Division: Gyeonggi-Do, Korea, 2015. [Google Scholar]
  6. Liu, H.; Masera, D.; Esser, L. World Small Hydropower Development Report 2013, Korea ed; United Nations Industrial Development Organization, International Center on Small Hydro Power: Hangzhou, China, 2013. [Google Scholar]
  7. Balkhair, K.S.; Ur Rahman, K. Sustainable and economical small-scale and low-head hydropower generation: A promising alternative potential solution for energy generation at local and regional scale. Appl. Energy 2017, 188, 378–391. [Google Scholar] [CrossRef]
  8. Zhou, D.; Deng, Z.D. Ultra-low-head hydroelectric technology: A review. Renew. Sustain. Energy Rev. 2017, 78, 23–30. [Google Scholar] [CrossRef]
  9. Hwang, Y.-H.; Lee, Y.-H.; Choi, Y.-D. Performance Measurement of a Tubular Type Turbine System for Small Hydropower by Field Test. KSFM J. Fluid Mach. 2011, 14, 5–10. [Google Scholar] [CrossRef]
  10. Ma, S.B.; Kim, S.; Choi, Y.S.; Cha, D.A.; Kim, J.H. Development of 2.5 kW class propeller type micro hydraulic turbine. Trans. Korean Hydrog. New Energy Soc. 2020, 31, 314–321. [Google Scholar]
  11. Borkowski, D.; Węgiel, M.; Ocłoń, P.; Węgiel, T. CFD model and experimental verification of water turbine integrated with electrical generator. Energy 2019, 185, 875–883. [Google Scholar] [CrossRef]
  12. Li, H.; Zhou, D.; Martinez, J.J.; Deng, Z.D.; Johnson, K.I.; Westman, M.P. Design and performance of composite runner blades for ultra low head turbines. Renew. Energy 2019, 132, 1280–1289. [Google Scholar] [CrossRef]
  13. Wang, W.Q.; Yin, R.; Yan, Y. Design and prediction hydrodynamic performance of horizontal axis micro-hydrokinetic river turbine. Renew. Energy 2019, 133, 91–102. [Google Scholar] [CrossRef]
  14. Punys, P.; Dumbrauskas, A.; Kvaraciejus, A.; Vyciene, G. Tools for Small Hydropower Plant Resource Planning and Development: A Review of Technology and Applications. Energies 2011, 4, 1258–1277. [Google Scholar]
  15. Liu, D.; Liu, H.; Wang, X.; Kremere, E. World Small Hydropower Development Report 2019, Korea ed; United Nations Industrial Development Organization, International Center on Small Hydro Power: Hangzhou, China, 2019. [Google Scholar]
  16. Korea Energy Management Corporation. New & Renewable Energy 2010; KEA Global Strategy Division: Gyeonggi-Do, Korea, 2010. [Google Scholar]
  17. Rheinhafen-Dampfkraftwerk Block 8 Achieved A 47.5% Net Thermal Efficiency to World-Class Level, World Energy. 2019. Available online: https://www.world-energy.org/article/1198.html (accessed on 6 August 2019).
  18. Ullah, I.; Kim, D.H. An Optimization Scheme for Water Pump Control in Smart Fish Farm with Efficient Energy Consumption. Processes 2018, 6, 65. [Google Scholar] [CrossRef] [Green Version]
  19. Jeong, H.G.; So, J.Y.; Chung, D.H.; Ahn, K.S.; Cho, C.H.; Kim, D.K. Development of 10 kW Permanent Magnet Synchronous Generator for Small Hydropower Generation. J. Korean Inst. Illum. Electr. Install. Eng. 2013, 27, 44–52. [Google Scholar]
  20. Kim, B.-K. Development of a Submerged Propeller Turbine for Micro Hydro Power. KSFM J. Fluid Mach. 2015, 18, 45–56. [Google Scholar] [CrossRef]
  21. Gatte, M.T.; Kadhim, R.A. Hydro power. Energy Conserv. 2012, 9, 95–124. [Google Scholar]
  22. Hwang, Y.-C.; Choi, Y.-D. Construction of Marine Small Hydro Power Plant using Discharge Water of Fish Farm. KSFM J. Fluid Mach. 2013, 16, 11–17. [Google Scholar]
  23. Kim, D.Y.; Kim, Y.T. Design and performance analysis of a 115kW class bulb-type hydro-turbine. J. Korean Soc. Mar. Eng. 2018, 42, 304–311. [Google Scholar]
  24. Kim, B.-K. Performance Characteristics of Micro Propeller Turbine. KSFM J. Fluid Mach. 2014, 17, 25–32. [Google Scholar] [CrossRef]
  25. Park, J.H.; Kim, Y.T.; Cho, Y.; Kim, B.K.; Lee, Y.H. Performance Analysis of 10 kW Class Propeller Hydro Turbine by the Change of Flow Rates and the Number of Runner Vane Using CFD. KSFM J. Fluid Mach. 2014, 17, 5–11. [Google Scholar]
  26. Li, K.M.; Kwon, W.; Lee, Y.W. Numerical study on effects of guide vane opening of a bulb turbine. J. Korean Soc. Mar. Eng. 2019, 43, 528–534. [Google Scholar]
  27. Vu, L.V.; Chen, Z.; Choi, Y.-D. Design and Performance of a Pico Propeller Hydro Turbine Model. KSFM J. Fluid Mach. 2018, 21, 44–51. [Google Scholar] [CrossRef]
  28. Park, N.; Rakibuzzaman, M.; Suh, S.-H. Flow Analysis of 30 kW Gate Turbine using Permanent Magnetic Generator. Heat Transf. Eng. 2019, 40, 1511–1522. [Google Scholar] [CrossRef]
  29. Nasir, B.A. Suitable Selection of Components for the Micro-Hydro-Electric Power Plant. Adv. Energy Power 2014, 2, 7–12. [Google Scholar]
  30. Michael, P.A.; Jawahar, C.P. Design of 15 kW Micro Hydro Power Plant for Rural Electrification at Valara. Energy Procedia 2017, 117, 163–171. [Google Scholar] [CrossRef]
  31. Alexander, K.V.; Giddens, E.P.; Fuller, A.M. Axial-Flow Turbines for Low Head Micro Hydro Systems. Renew. Energy 2009, 34, 35–47. [Google Scholar] [CrossRef]
  32. Larinier, M. Fish Passage Experience at Small-Scale Hydro-Electric Power Plants in France. Hydrobiologia 2008, 609, 97–108. [Google Scholar] [CrossRef]
  33. Korea Hydrographic and Oceanographic Agency, Busan, South Korea in 2017. Available online: http://www.khoa.go.kr/oceangrid/koofs/kor/observation/obs_real_detail.do?tsType=0&tsId=44 (accessed on 7 October 2018).
  34. Madani, N.; Cosic, A.; Sadarangani, C. A Permanent Magnet Synchronous Generator for a Small Scale Vertical Axis Wind Turbine. In Proceedings of the IEEE International Electric Machines & Drives Conference (IEMDC), Coeur d’Alene, ID, USA, 10–13 May 2015; pp. 48–52. [Google Scholar] [CrossRef]
  35. Suh, S.H.; Kim, K.Y.; Kim, B.H.; Kim, Y.T.; Kim, T.G.; Roh, H.W.; Yoo, Y.I.; Park, N.H.; Park, J.M.; Shin, C.S.; et al. Theory and Applications of Hydraulic Turbines, 1st ed.; Dong Myeong Publishers: Seoul, Korea, 2014. [Google Scholar]
  36. Fox, R.W.; Mcdonald, A.T.; Pritchard, P.J.; Leylegain, J.C. Fluid Mechanics, 8th ed.; John Wiley and Sons, Inc.: Hoboken, NJ, USA, 2012. [Google Scholar]
  37. Drtina, P.; Sallaberger, M. Hydraulic Turbines—Basic Principles and State-of-the-Art Computational Fluid Dynamics Applications. Proc. Inst. Mech. Engrs: Part C 1999, 213, 85–102. [Google Scholar] [CrossRef]
  38. Kim, H.-H.; Rakibuzzaman, M.; Kim, K.; Suh, S.-H. Flow and Fast Fourier Transform Analyses for Tip Clearance Effect in an Operating Kaplan Turbine. Energies 2019, 12, 264. [Google Scholar] [CrossRef] [Green Version]
  39. Rakibuzzaman, M.; Kim, H.-H.; Kim, K.; Suh, S.-H.; Kim, K.Y. Numerical Study of Sediment Erosion Analysis in Francis Turbine. Sustainability 2019, 11, 1423. [Google Scholar]
  40. Trivedi, C.; Cervantes, M.J.; Gandhi, B.K.; Dahlhaug, O.G. Experimental and Numerical Studies for a High Head Francis Turbine at Several Operating Points. J. Fluids Eng. 2013, 135. [Google Scholar] [CrossRef]
  41. Celik, I.B.; Ghia, U.; Roache, P.J.; Freitas, C.J.; Coleman, H.; Raad, P.E. Procedure for Estimation and Reporting of Uncertainty due to Discretization in CFD Applications. ASME J. Fluids Eng. 2008, 130, 078001. [Google Scholar]
  42. Taylor, J.R. An Introduction to Error Analysis, 2nd ed.; University Science Books: Mill Valley, CA, USA, 1982. [Google Scholar]
  43. Friziger, J.H.; Peric, M. Computational Methods for Fluid Dynamics, 3rd ed.; Springer: New York, NY, USA, 2002. [Google Scholar]
  44. Ansys Inc. ANSYS-CFX (CFX Introduction, CFX Reference guide, CFX Tutorials, CFX-Pre User’s Guide, CFX-Solver Manager User’s Guide, Theory Guide), Release 16.00, USA. 2016. Available online: https://www.ansys.com/products/fluids/ansys-cfx.
  45. Georgiadis, N.J.; Yoder, D.A.; Engblorn, W.B. Evaluation of Modified Two-Equation Turbulence Models for Jet Flow Predictions. Aiaa J. 2006, 44, 3107–3114. [Google Scholar] [CrossRef] [Green Version]
  46. Wilcox, D.C. Turbulence Modeling for CFD, 1st ed.; DCW Industries, Inc.: La Cañada Flintridge, CA, USA, 1994. [Google Scholar]
  47. Menter, F.R. Two-Equation Eddy-Viscosity Turbulence Models for Engineering Applications. AIAA J. 1994, 32, 1598–1605. [Google Scholar] [CrossRef] [Green Version]
  48. CEI/IEC-60193, Hydraulic Turbines, Storage Pumps and Pump-Turbines-Model Acceptance Tests; International Standard; International Electrotechnical Commission: Geneva, Switzerland, 1999.
  49. Rakibuzzaman, M.; Suh, S.-H.; Ryu, Y.T.; Kim, K.Y. Utilization of Hydraulic Energy in a Fish Farm. In Proceedings of the 12th International Conference on Computational Heat and Mass Transfer, Rome, Italy, 3–6 September 2019. [Google Scholar]
  50. Liu, X.; Luo, Y.; Karney, B.W.; Wang, W. A selected literature review of efficiency improvements in hydraulic turbines. Renew. Sustain. Energy Rev. 2015, 51, 18–28. [Google Scholar] [CrossRef]
Figure 1. Fish farm facilities: (a) water supply system; (b) discharge water system; (c) fish farm.
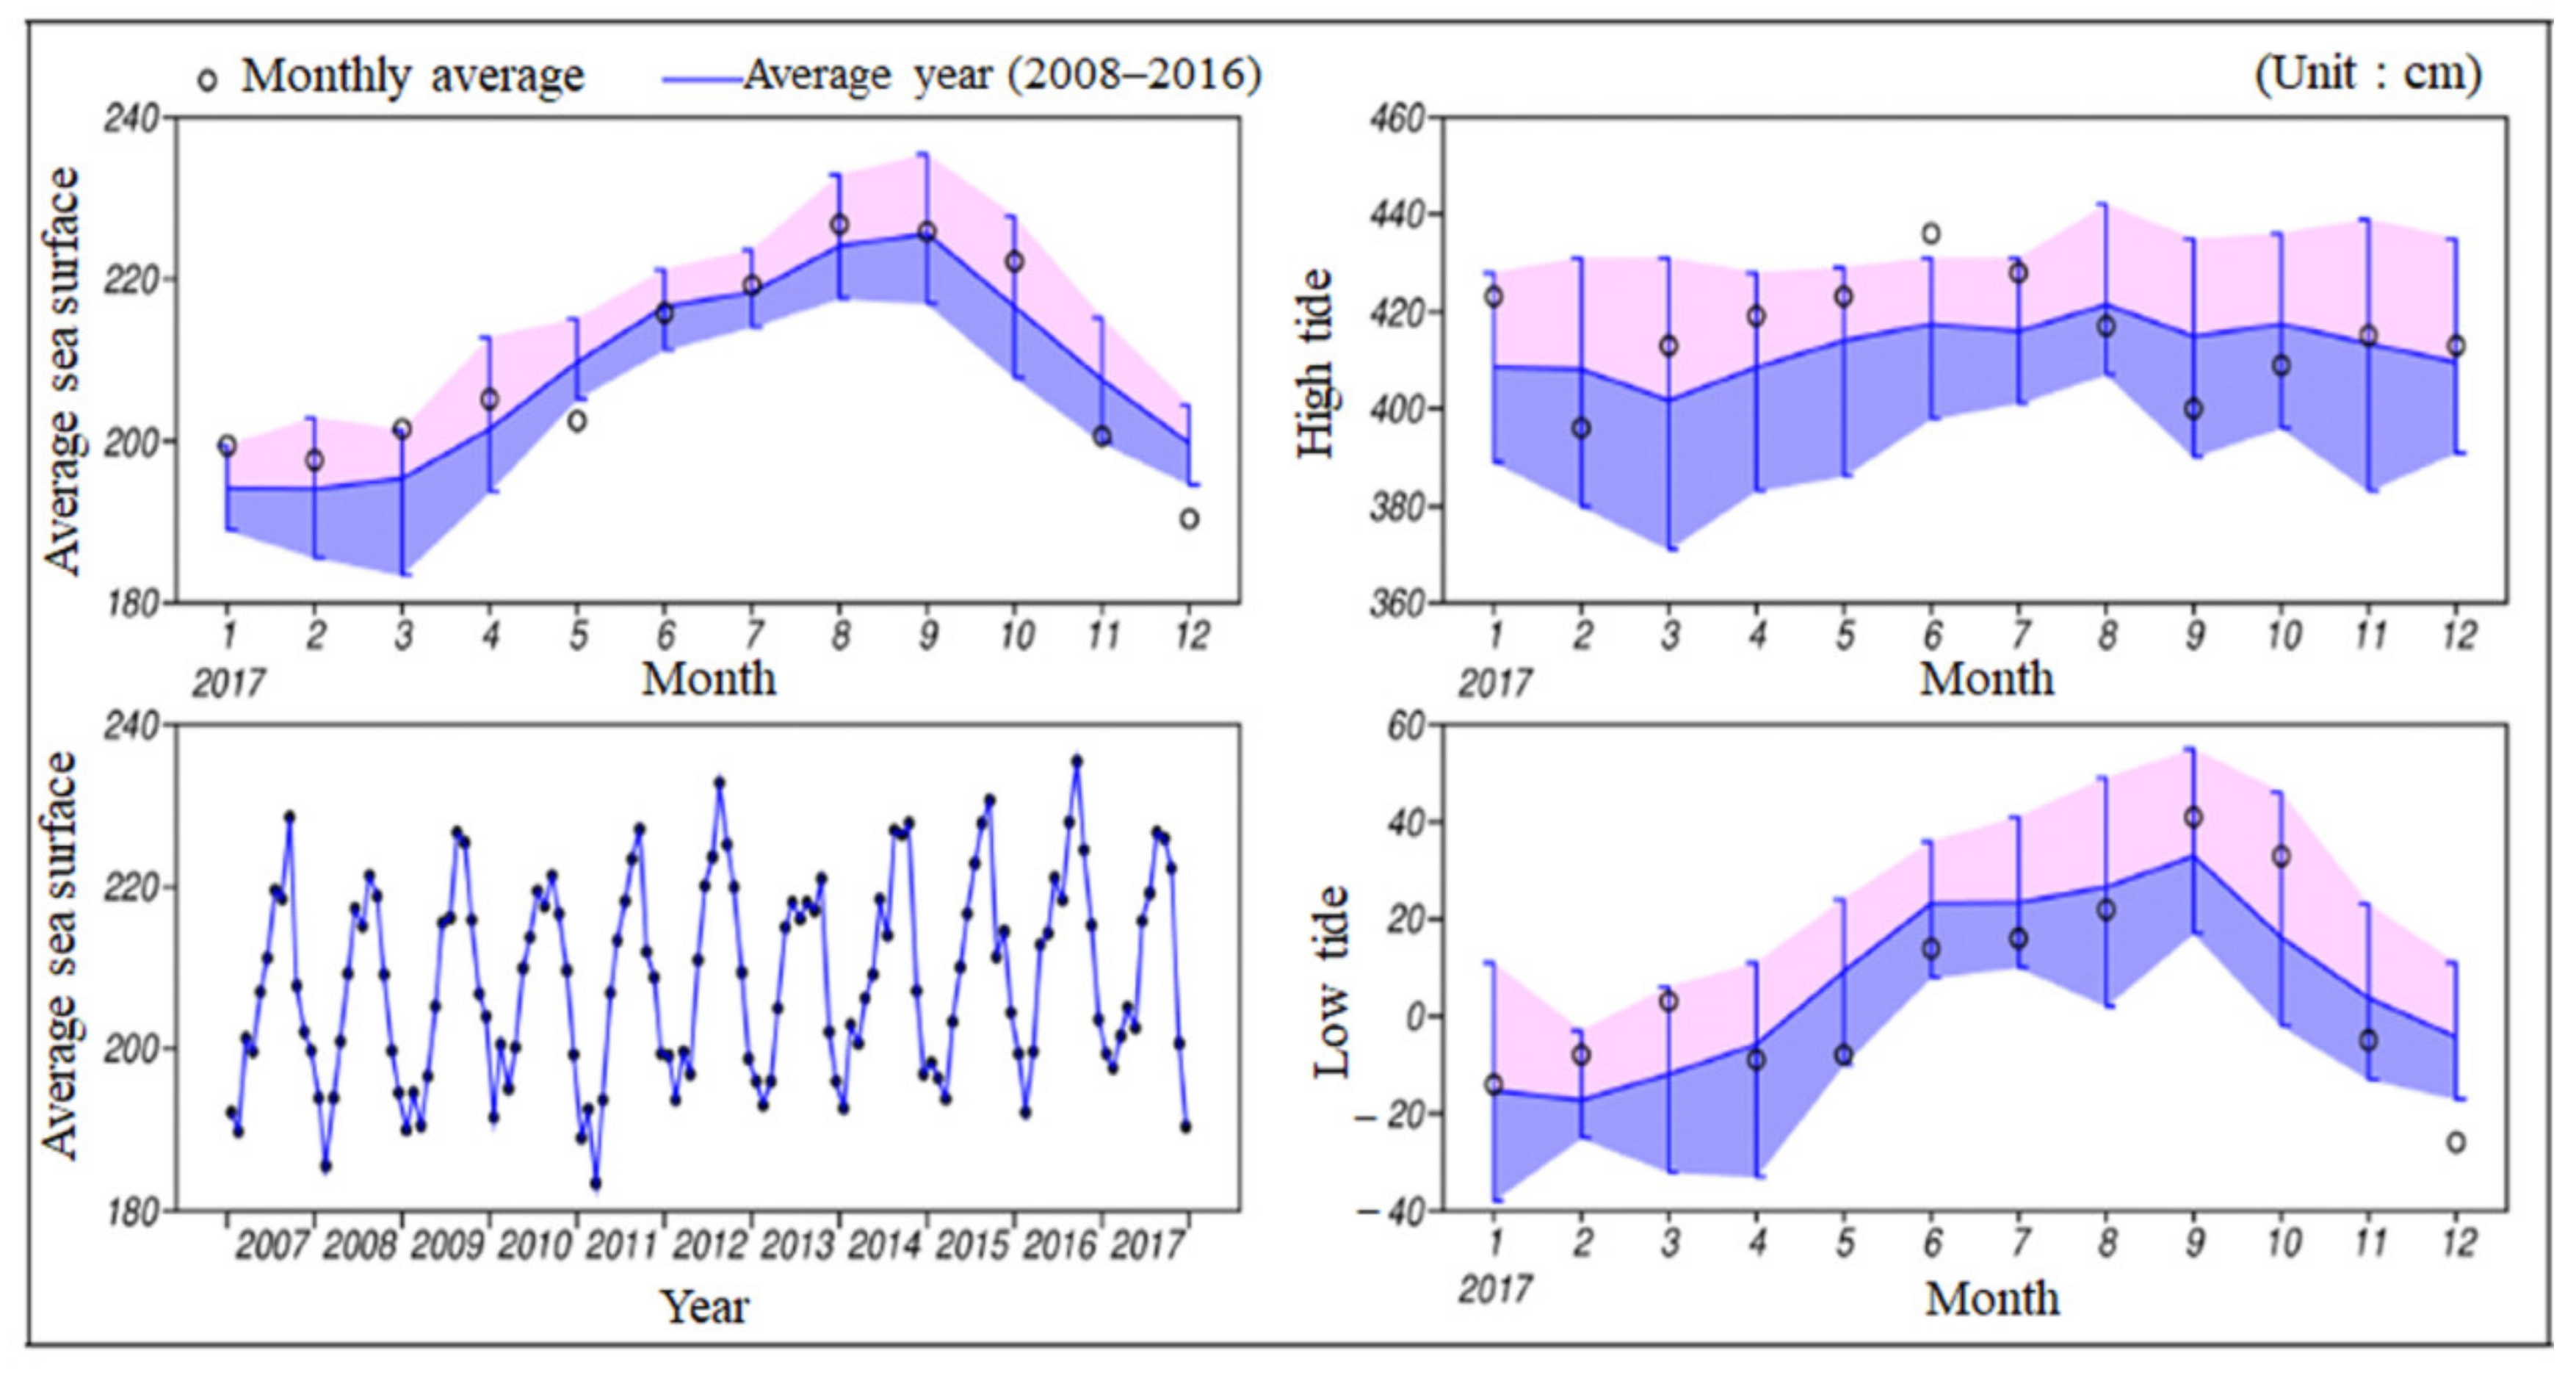
Processes 09 00266 g001
Figure 2. Monthly average tidal status, Southern sea, Korea.
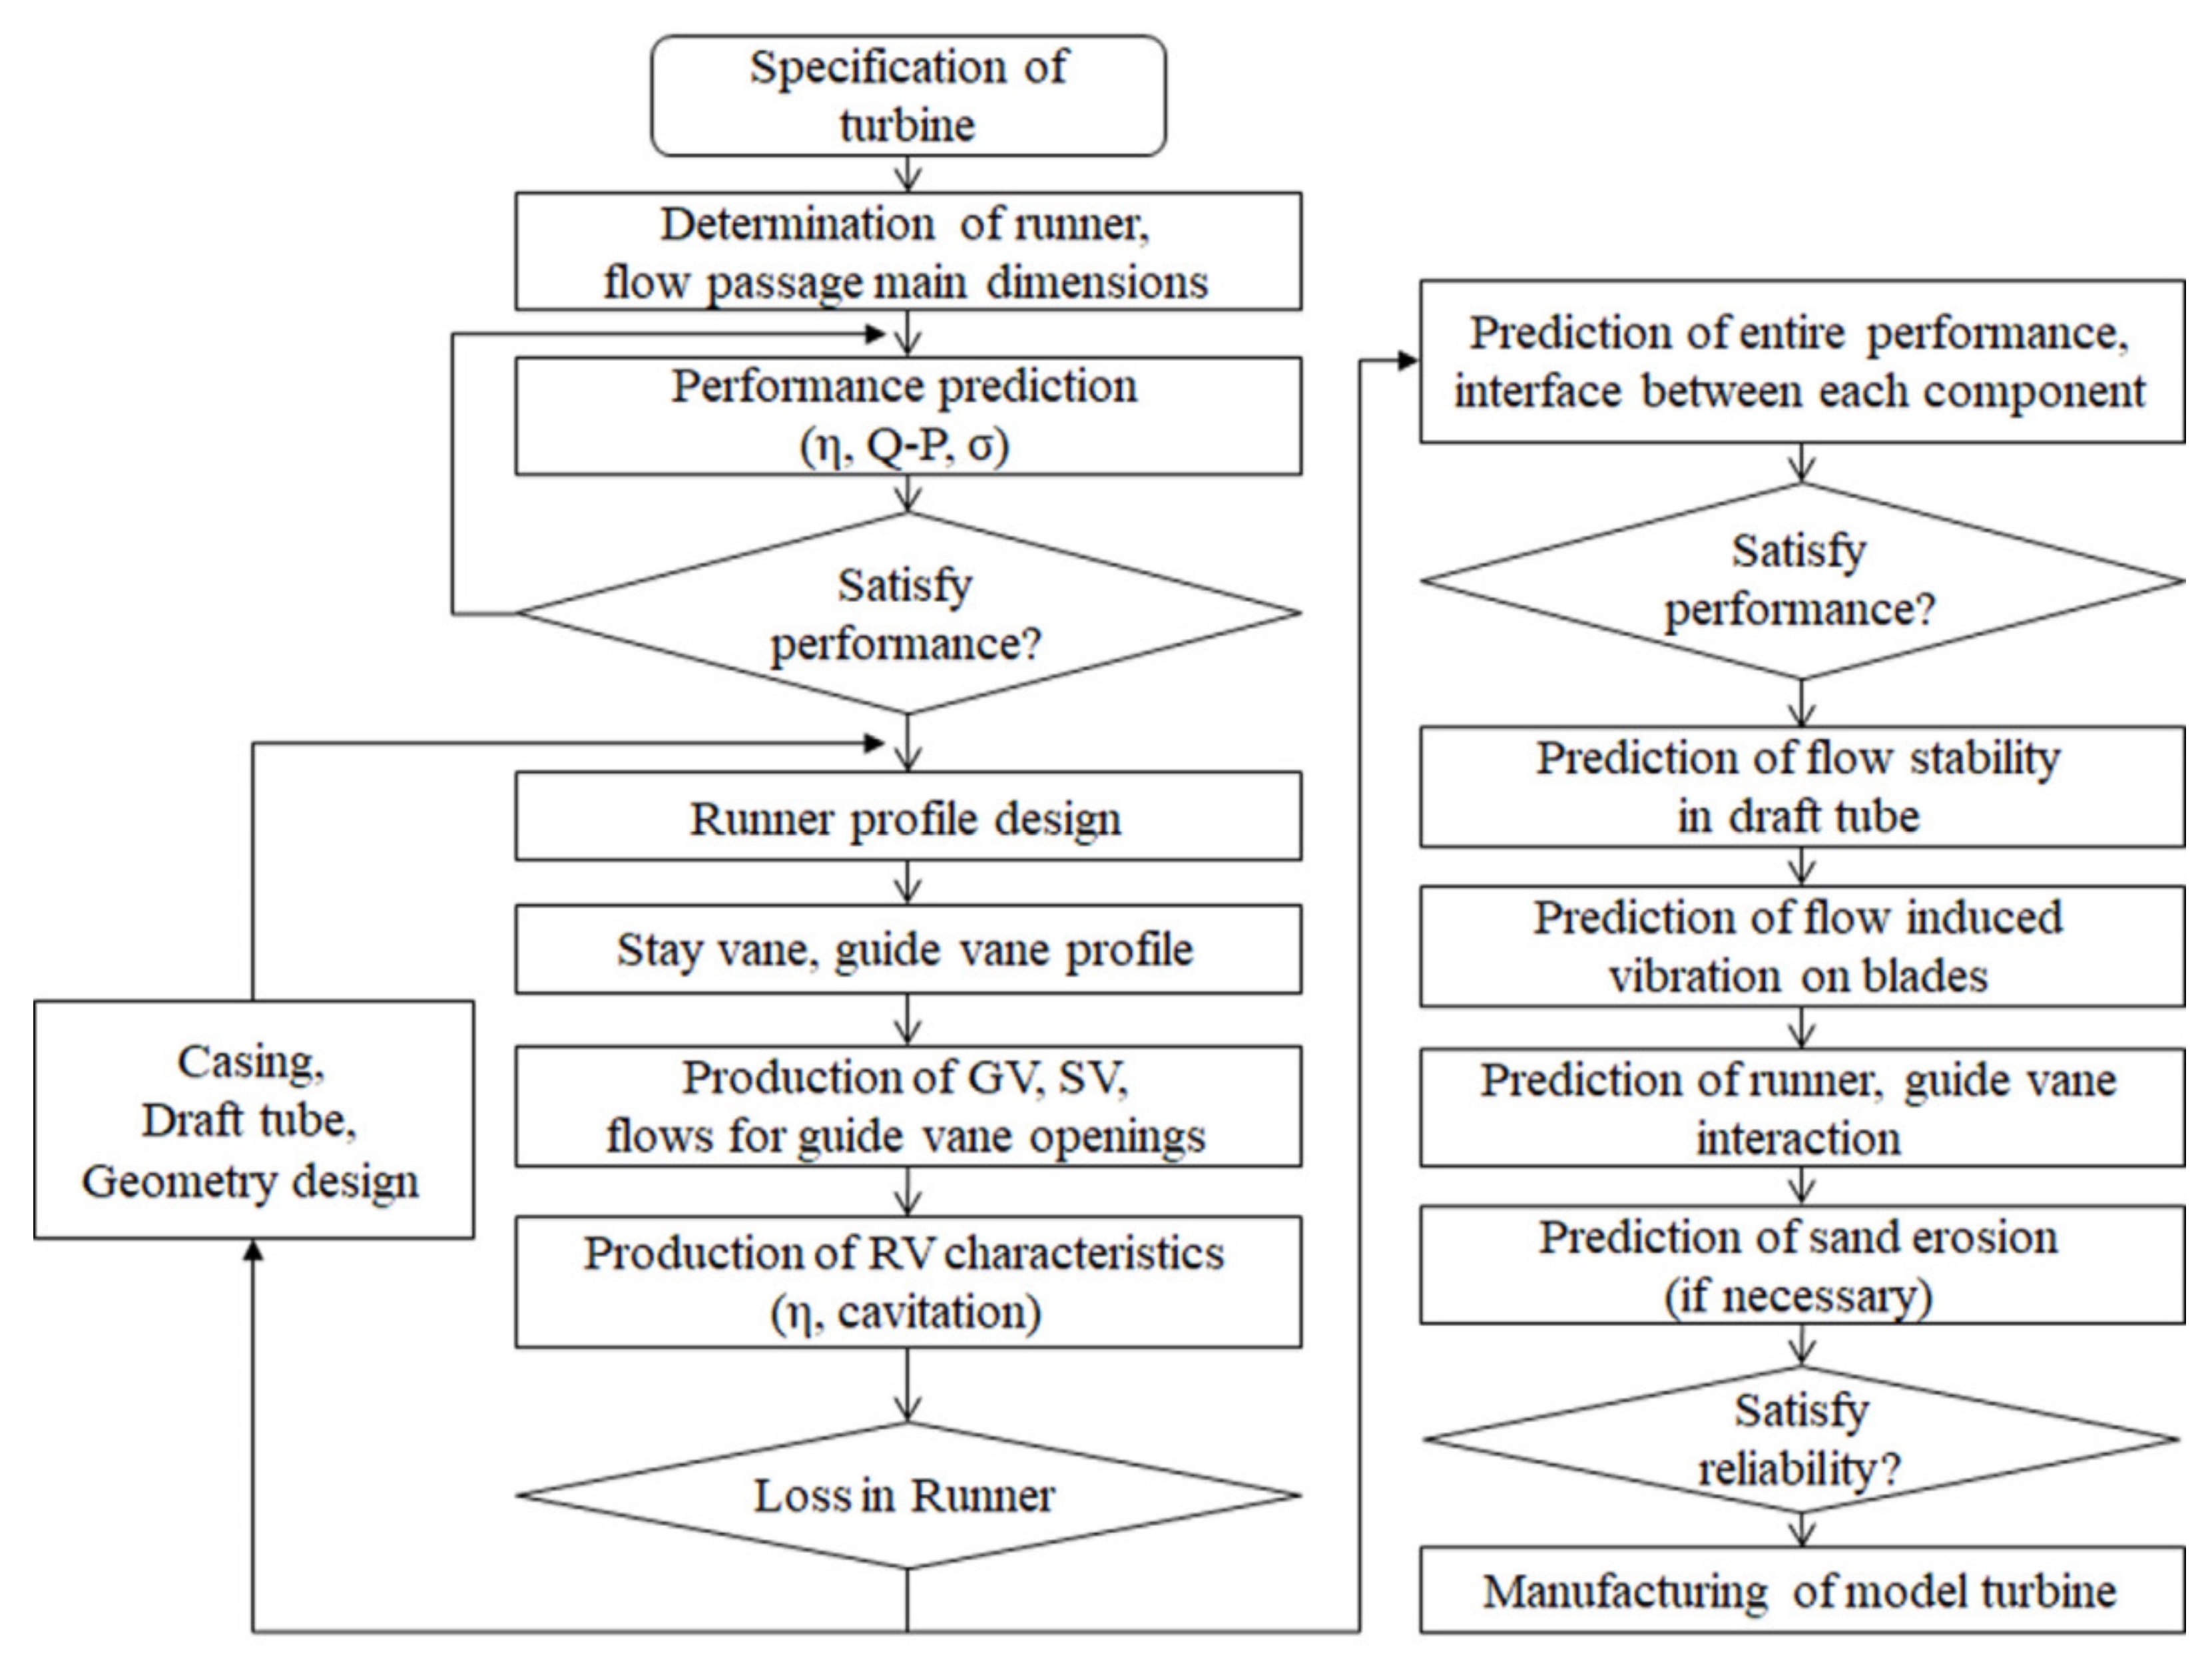
Processes 09 00266 g002
Figure 3. Block diagram of the design process for the hydraulic turbine.
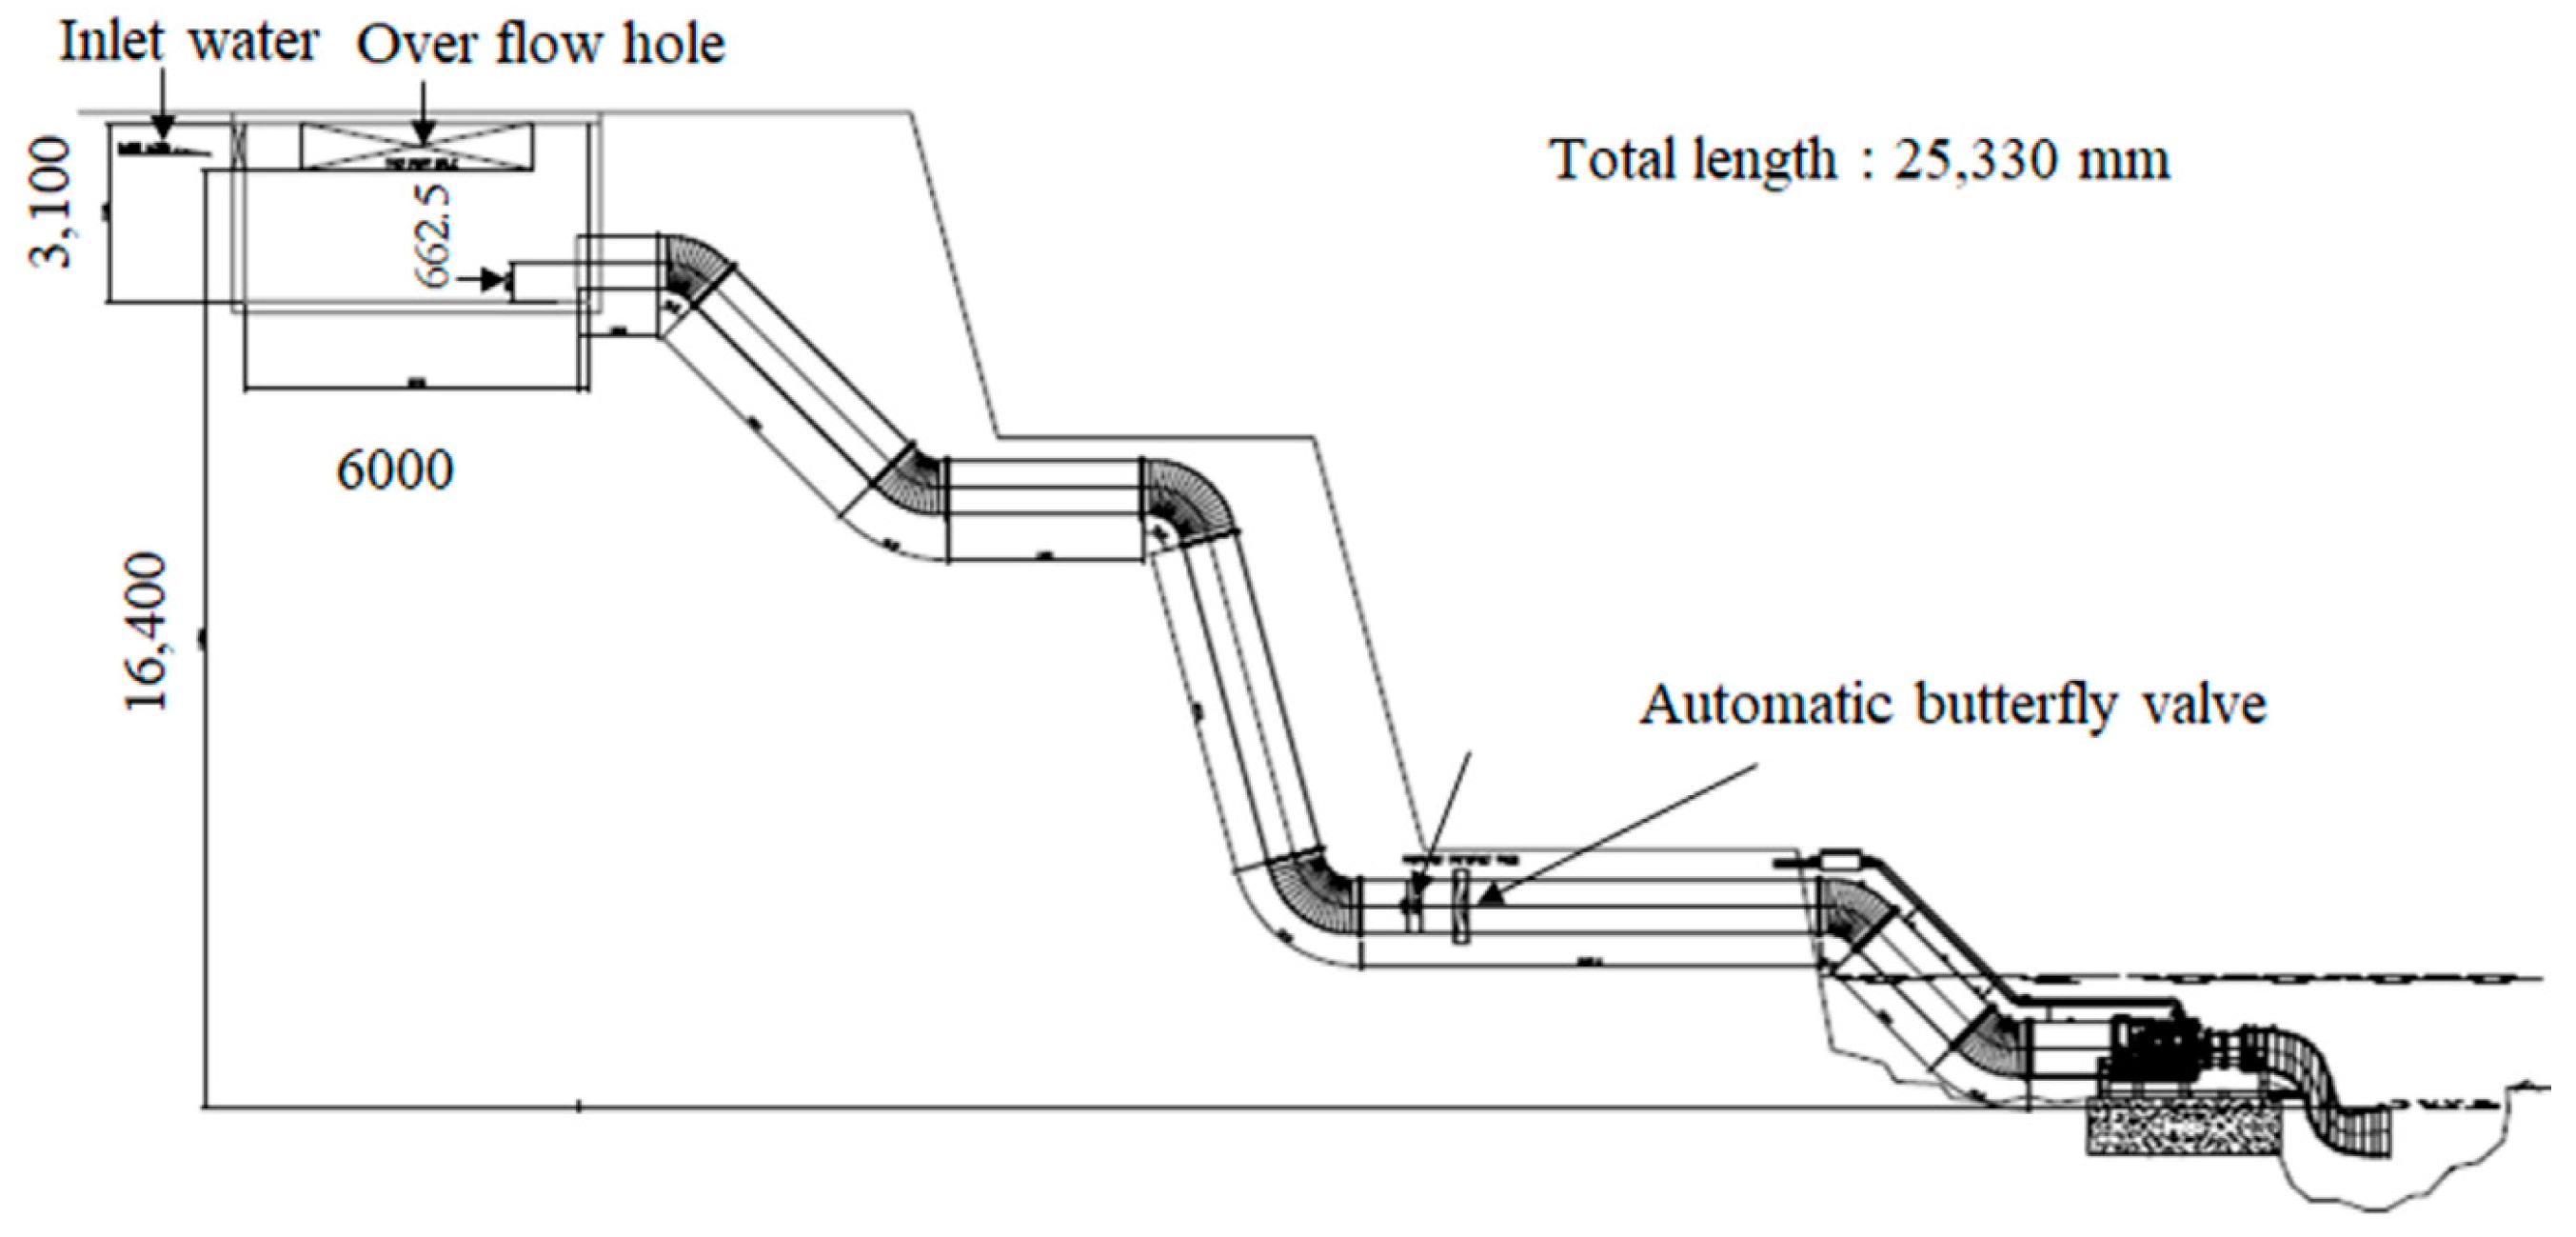
Processes 09 00266 g003
Figure 4. Schematic installation diagram of an offshore small hydropower plant.
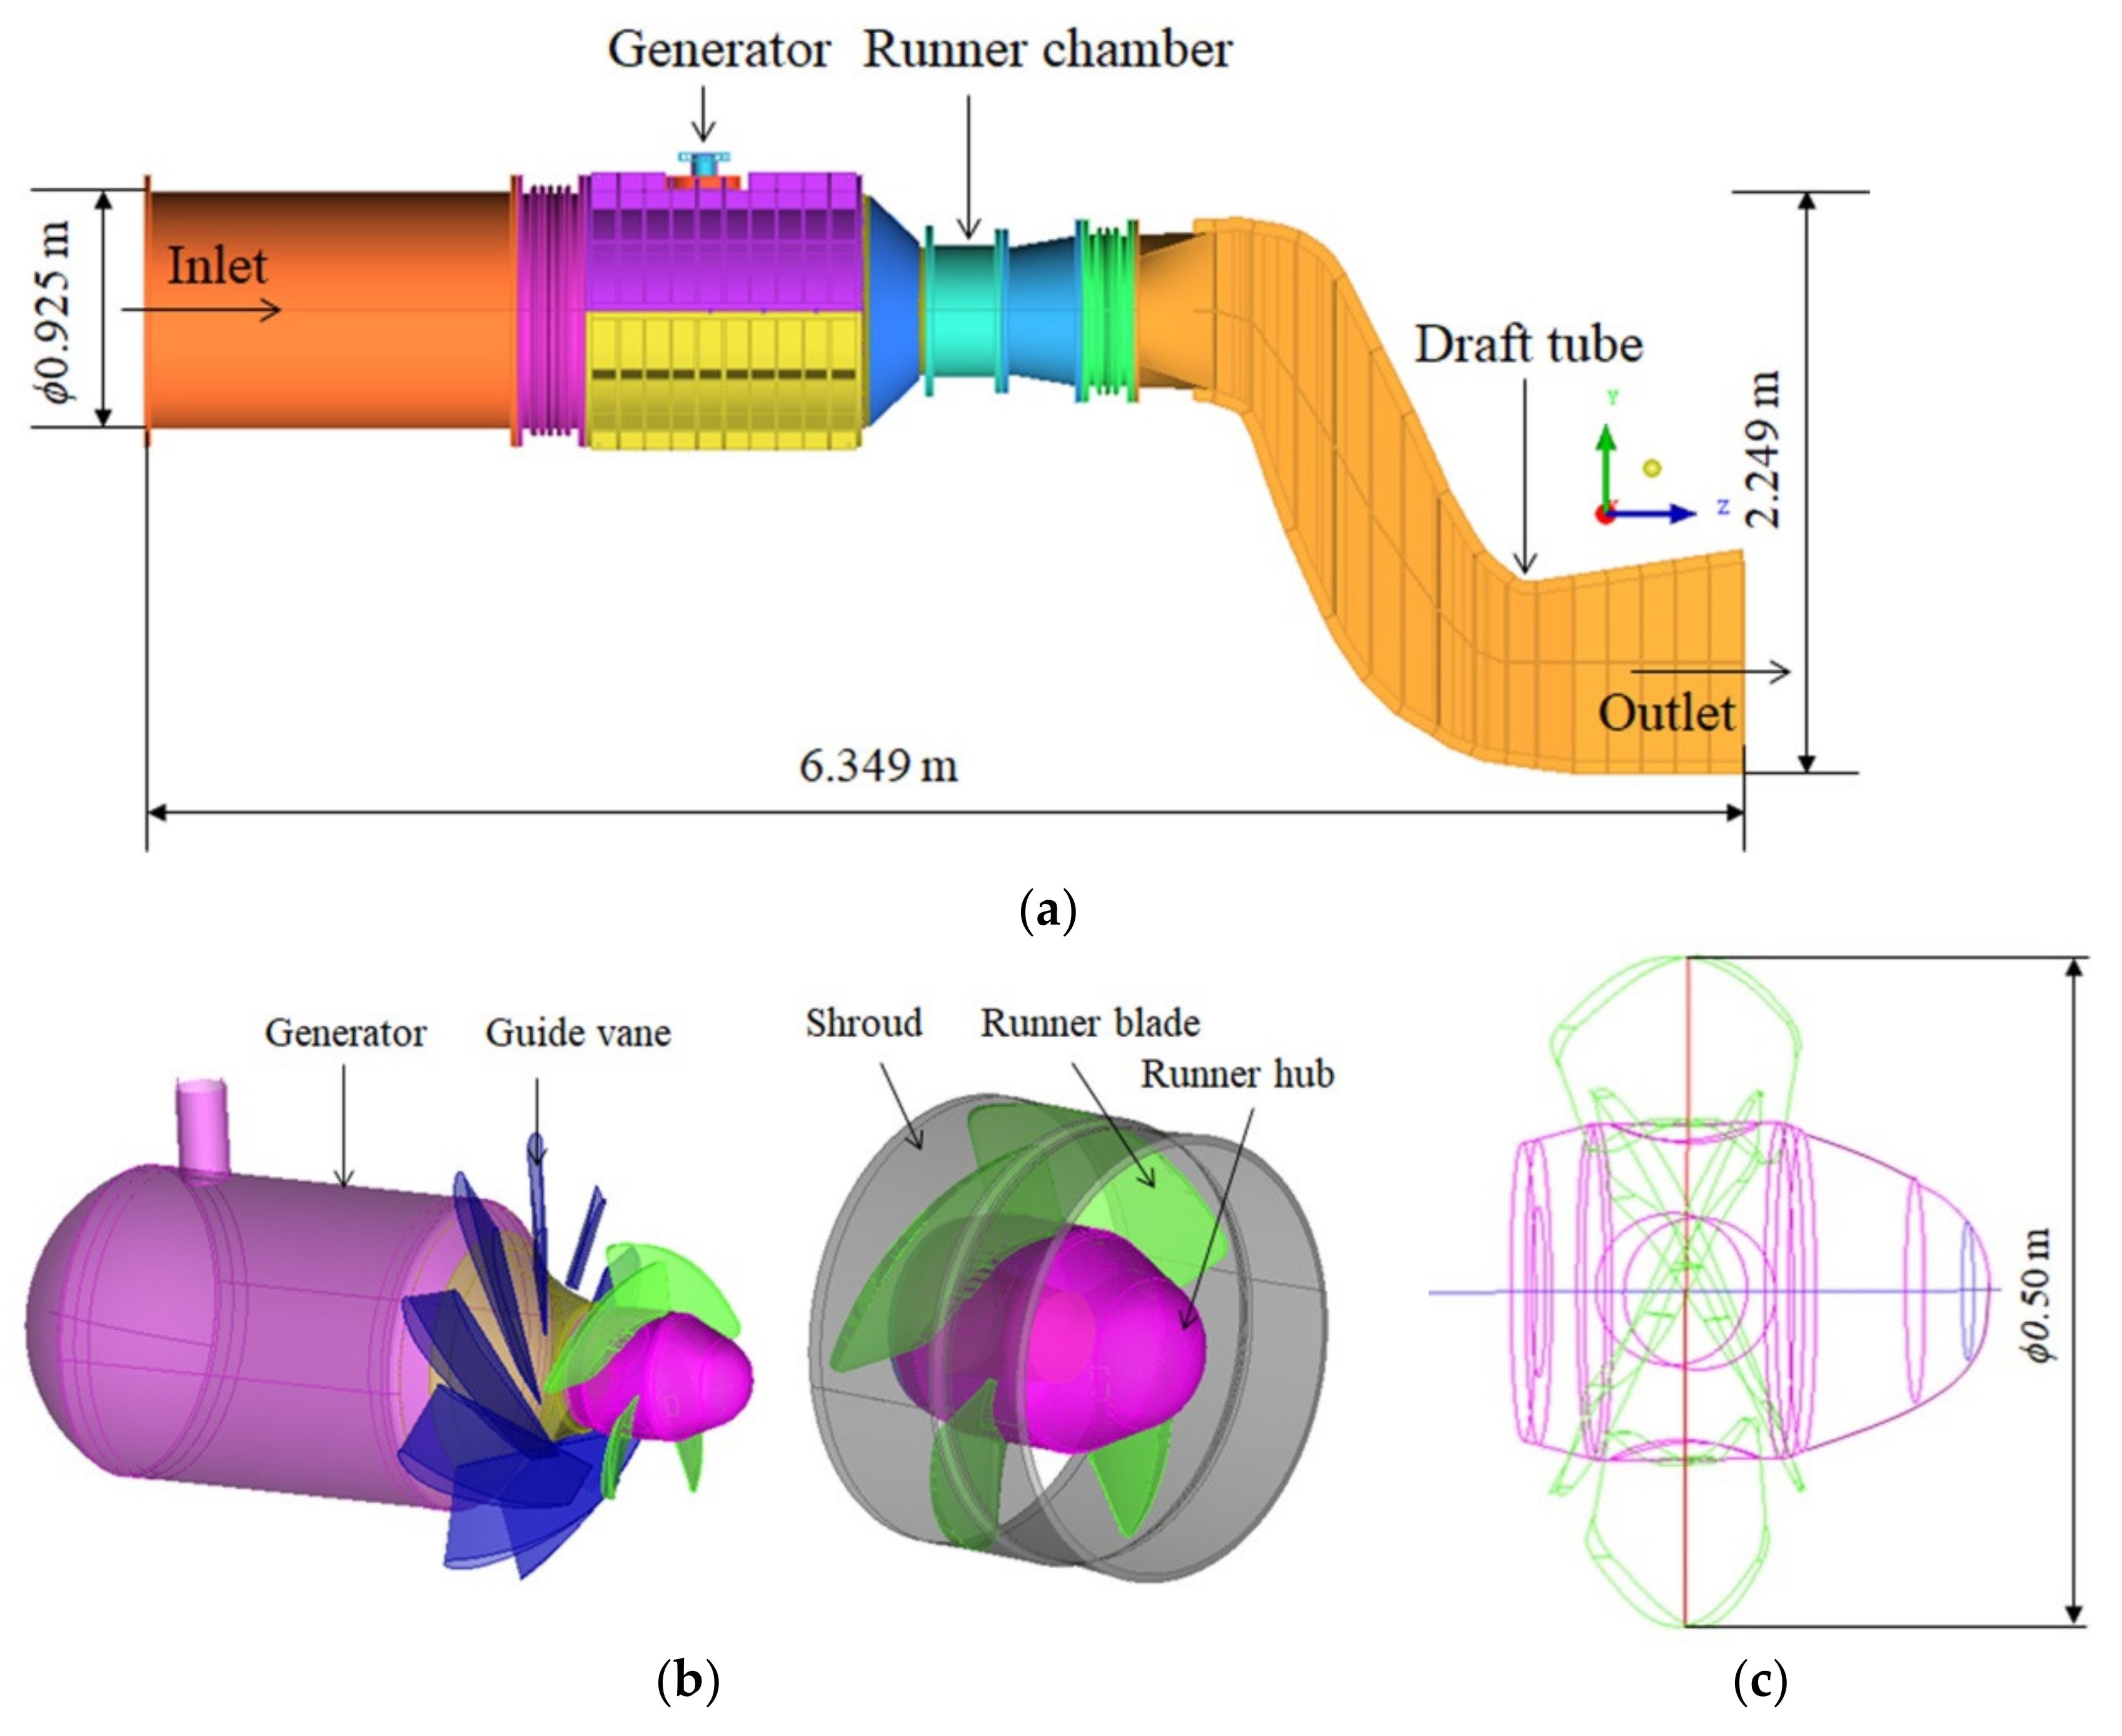
Processes 09 00266 g004
Figure 5. Three dimensional (3D) geometry of a propeller type turbine: (a) turbine; (b) generator, runner, and guide vane; (c) dimension of runner.
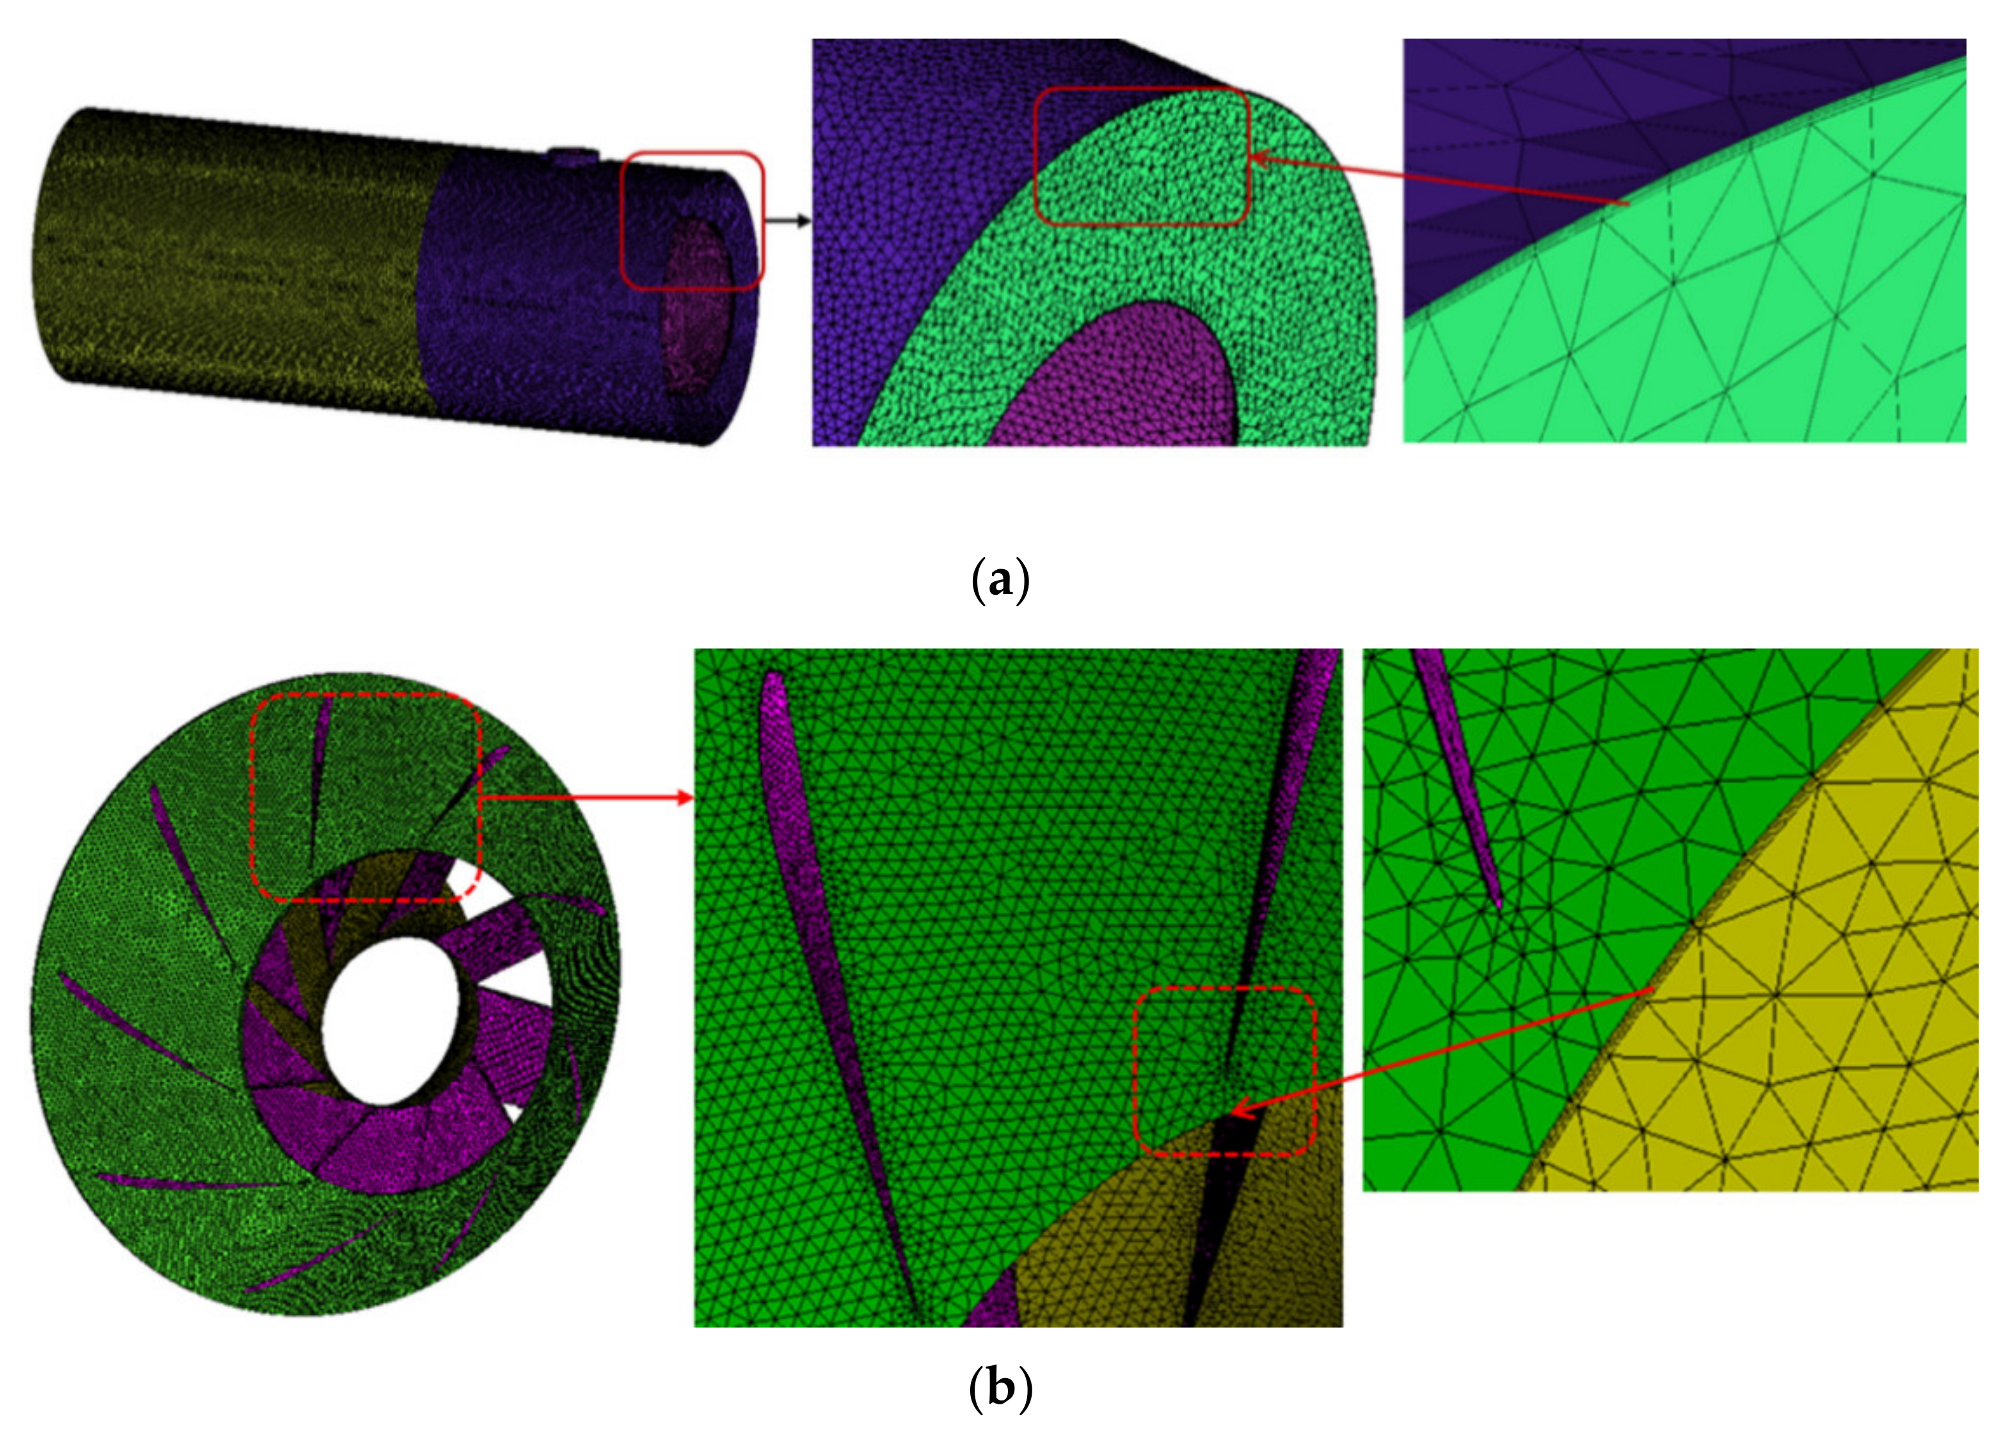
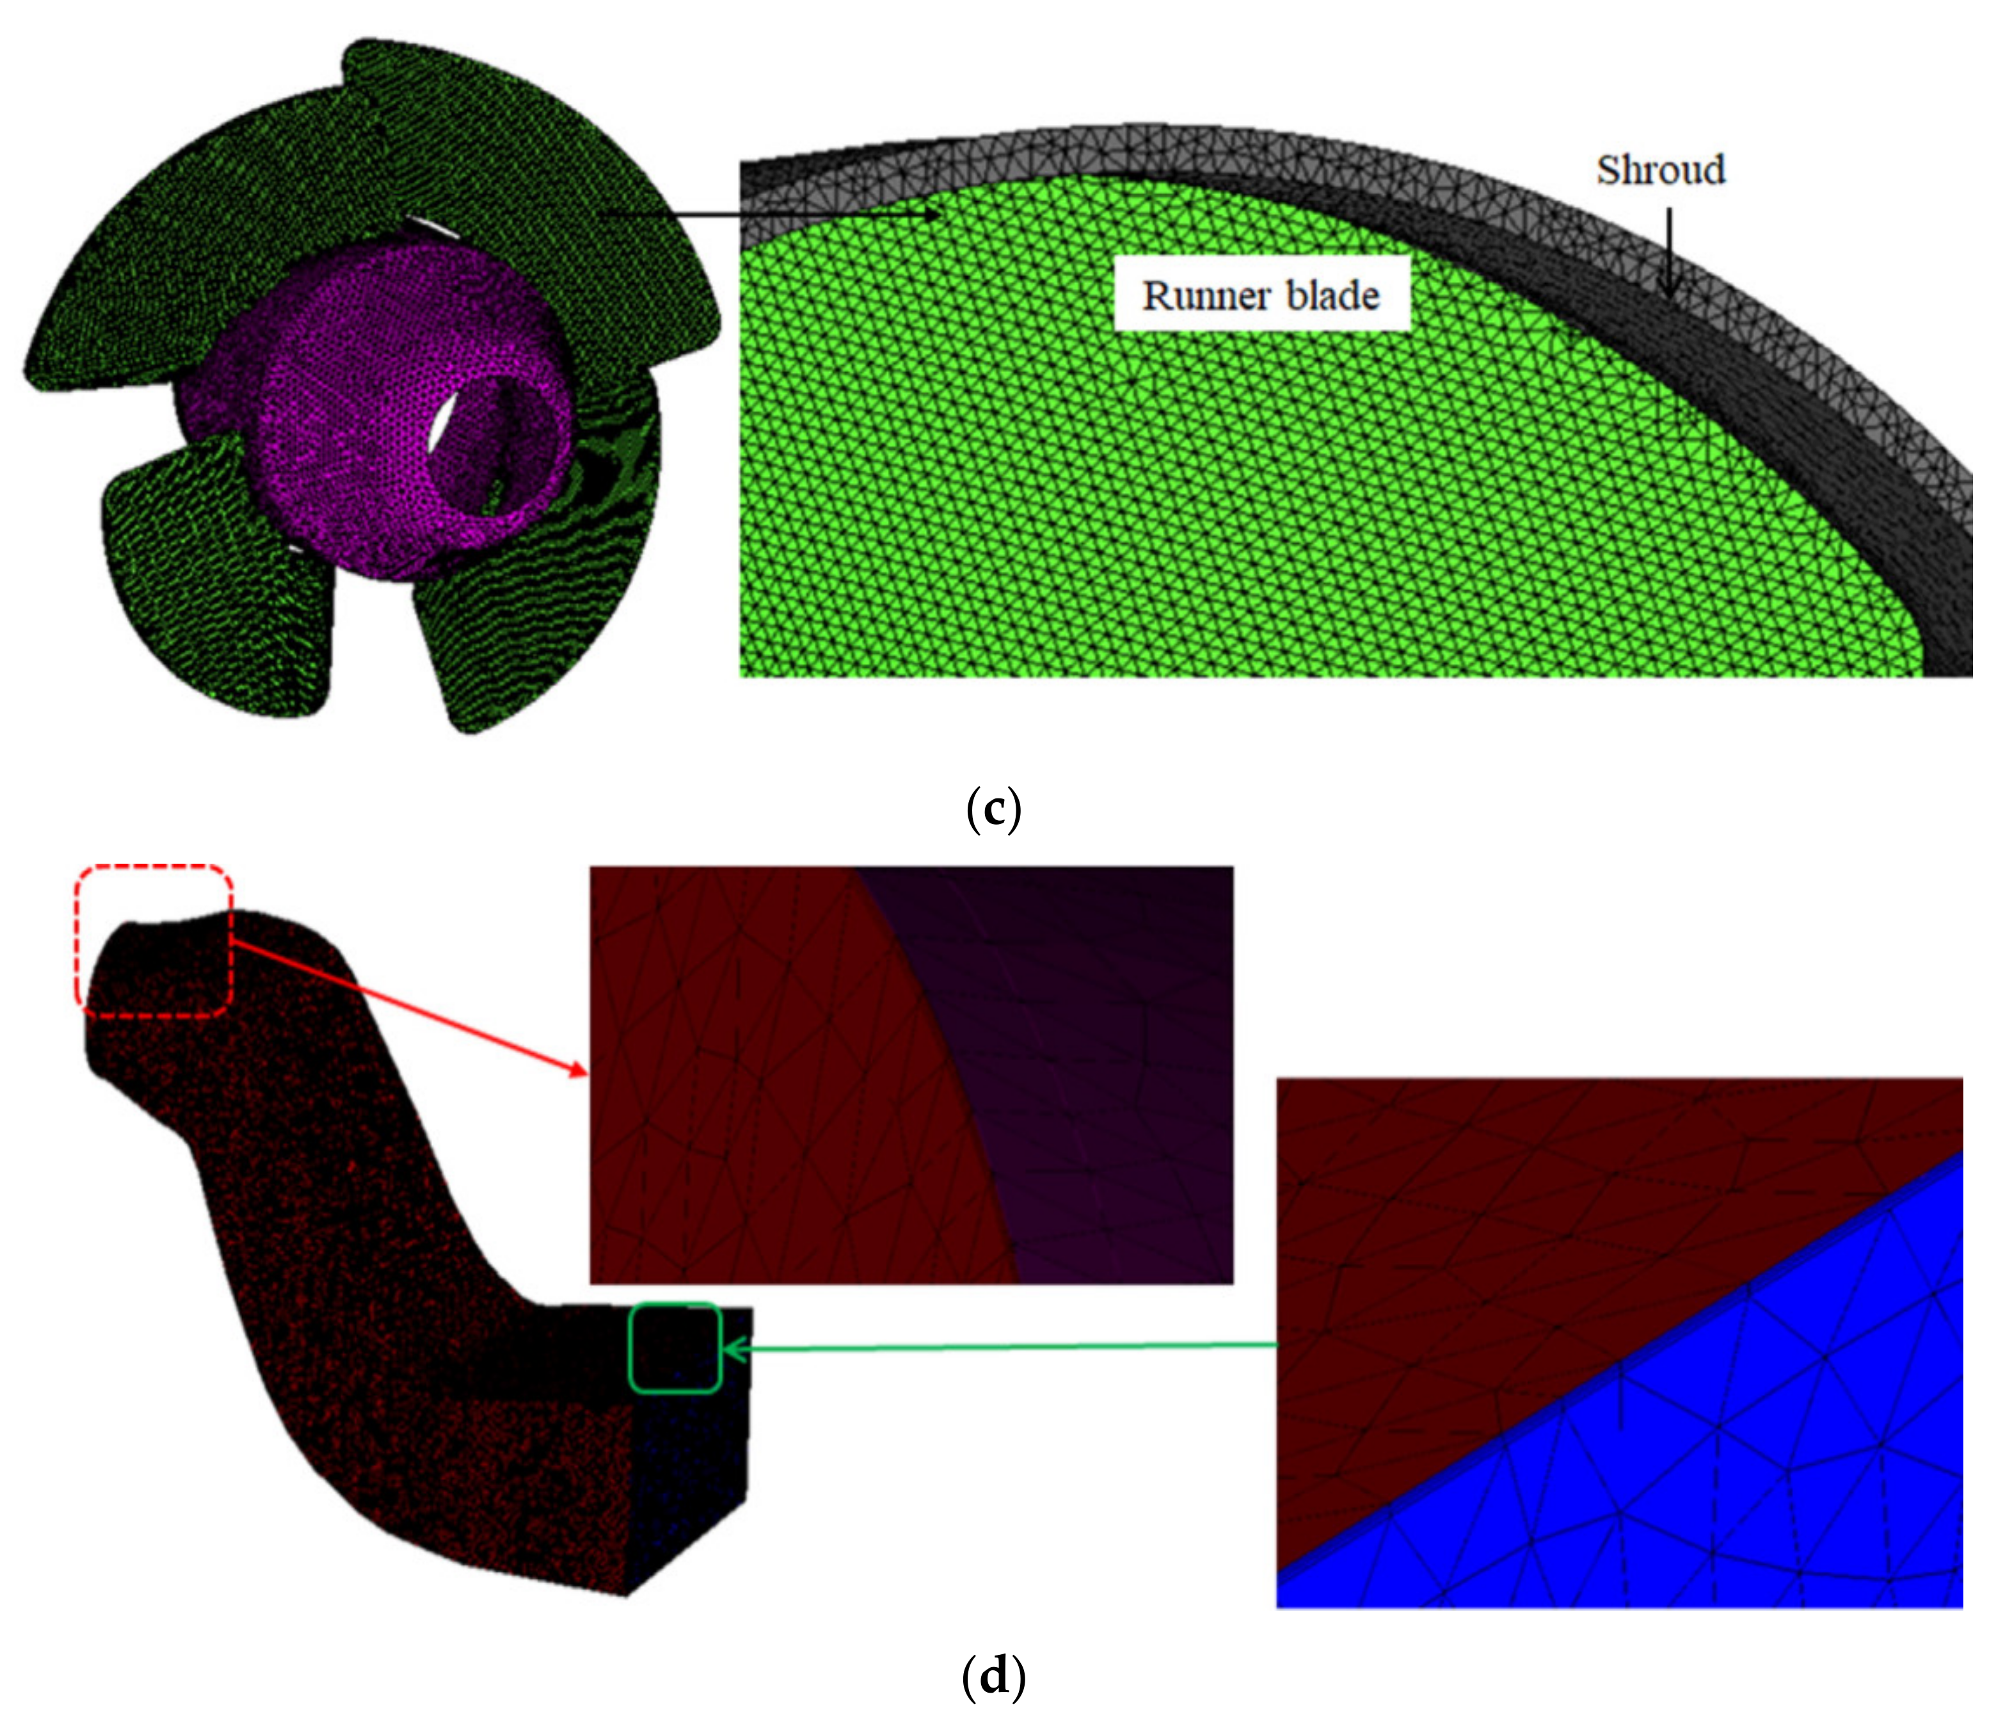
Processes 09 00266 g005
Figure 6. Unstructured prism grids: (a) inlet pipe and generator; (b) guide vane; (c) runner; (d) draft tube.
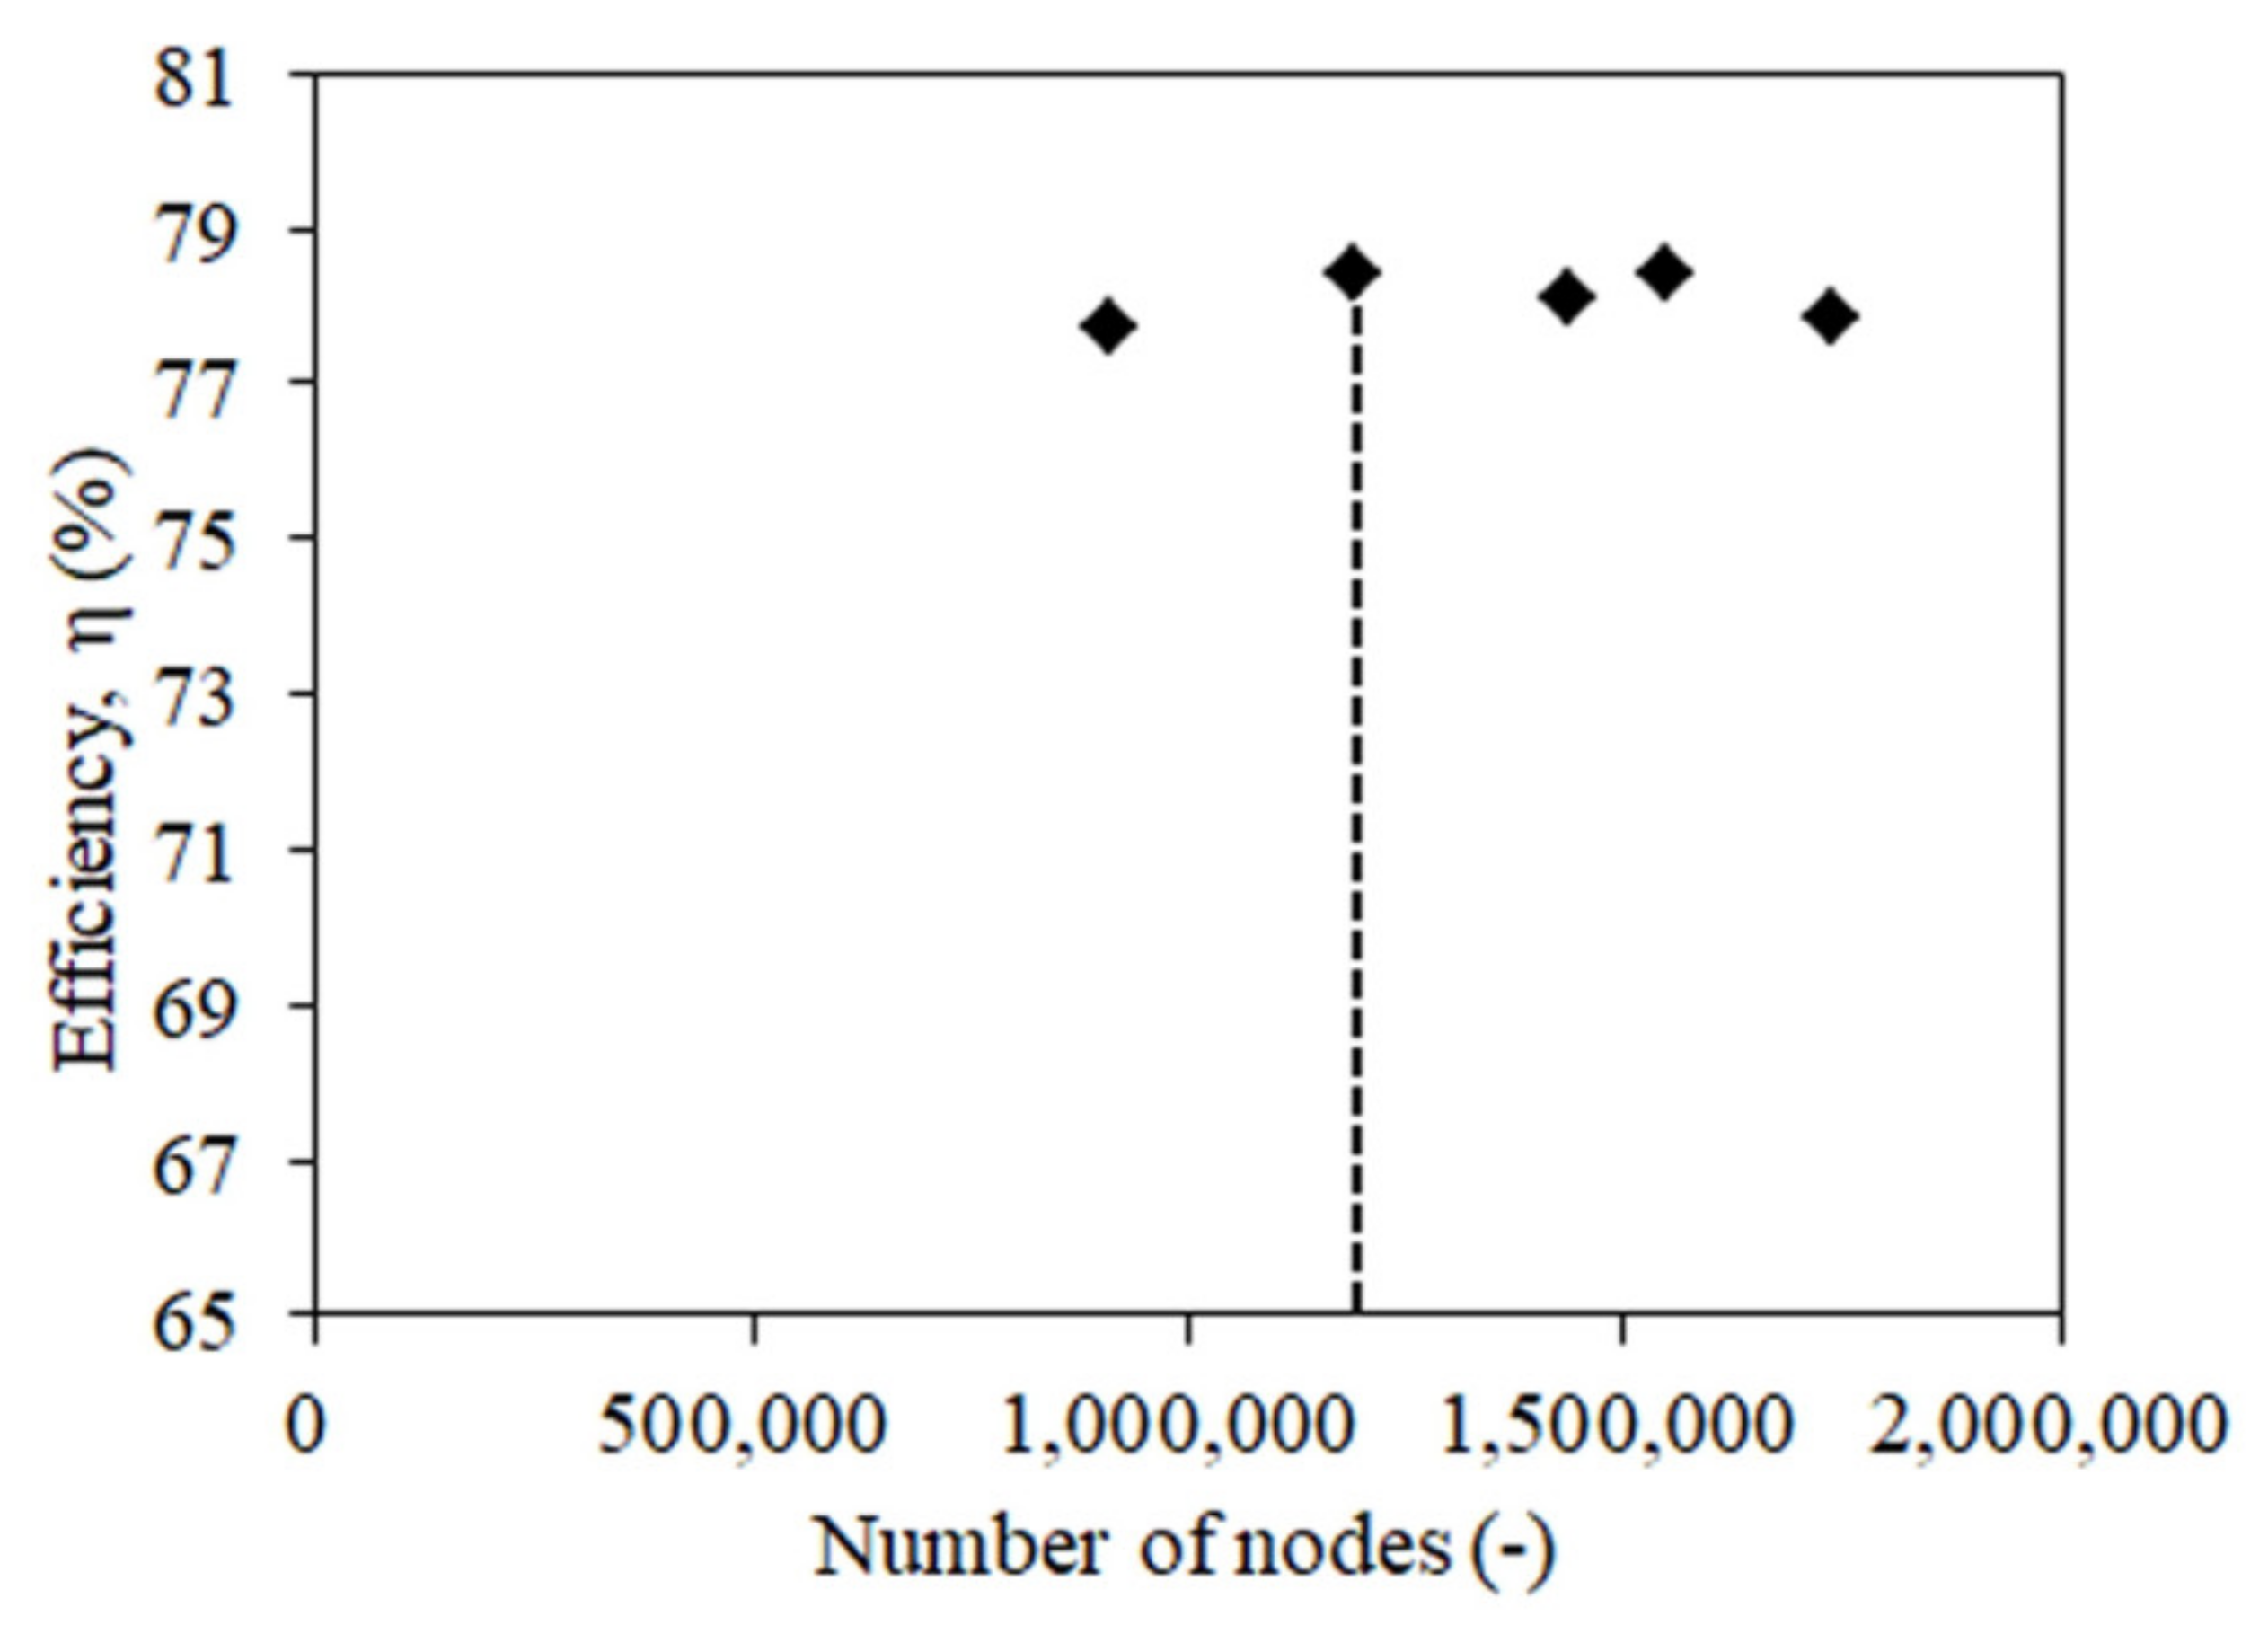
Processes 09 00266 g006aProcesses 09 00266 g006b
Figure 7. Grid independency test of the tubular turbine (vertical dotted line represents the used grid).
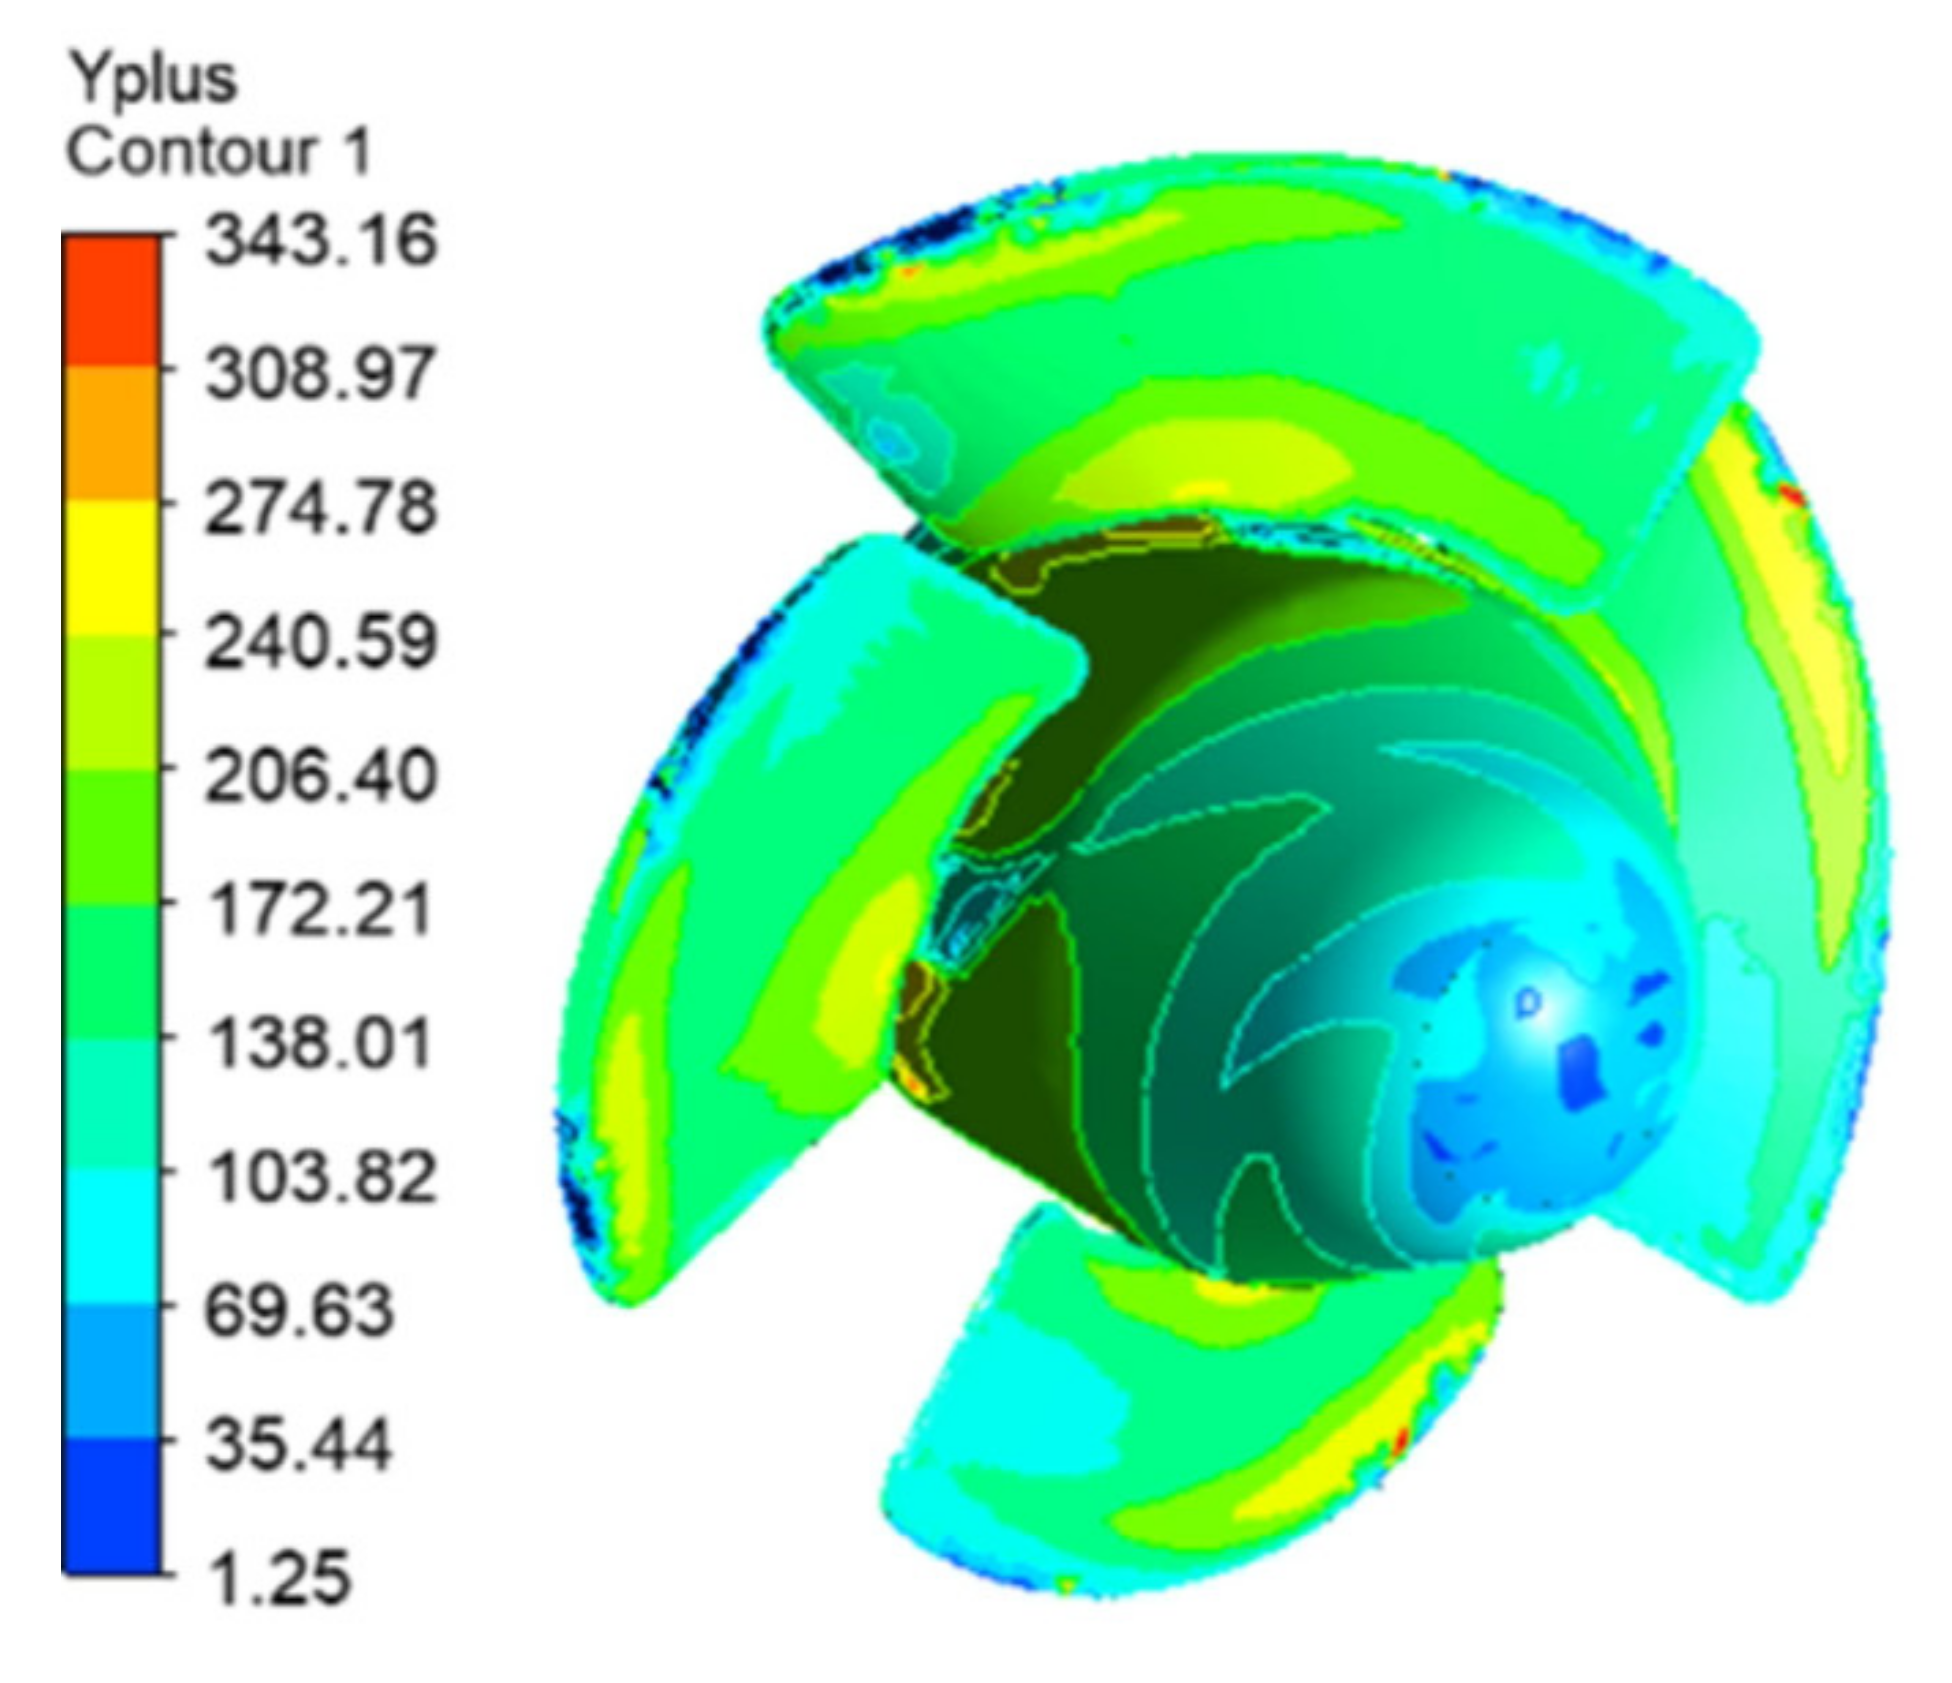
Processes 09 00266 g007
Figure 8. Y+ contour of the runner.
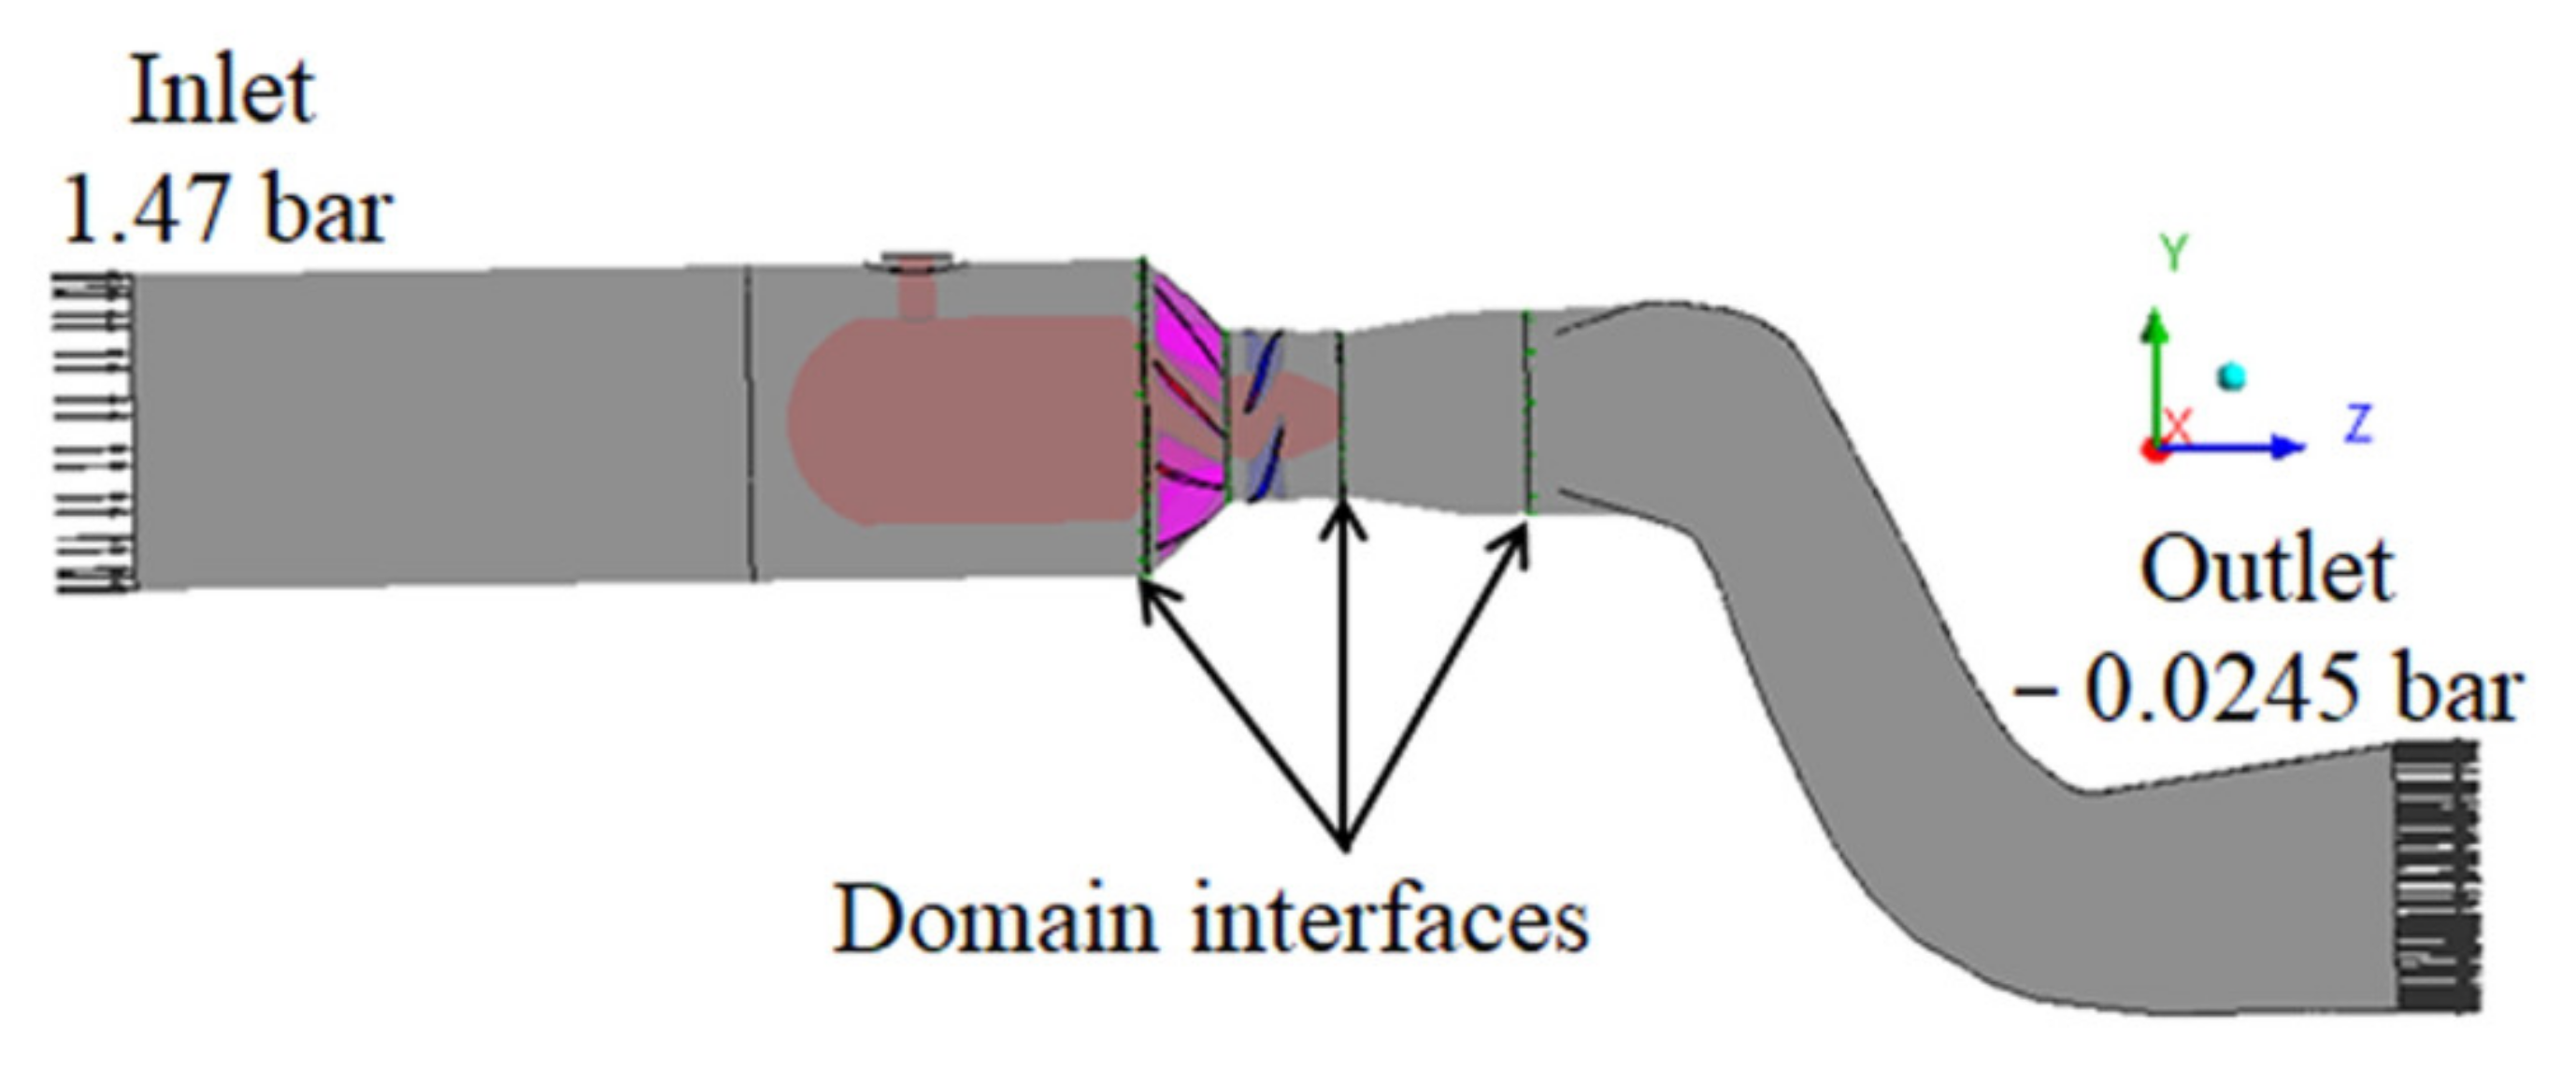
Processes 09 00266 g008
Figure 9. Prototype turbine domain for computational analysis.
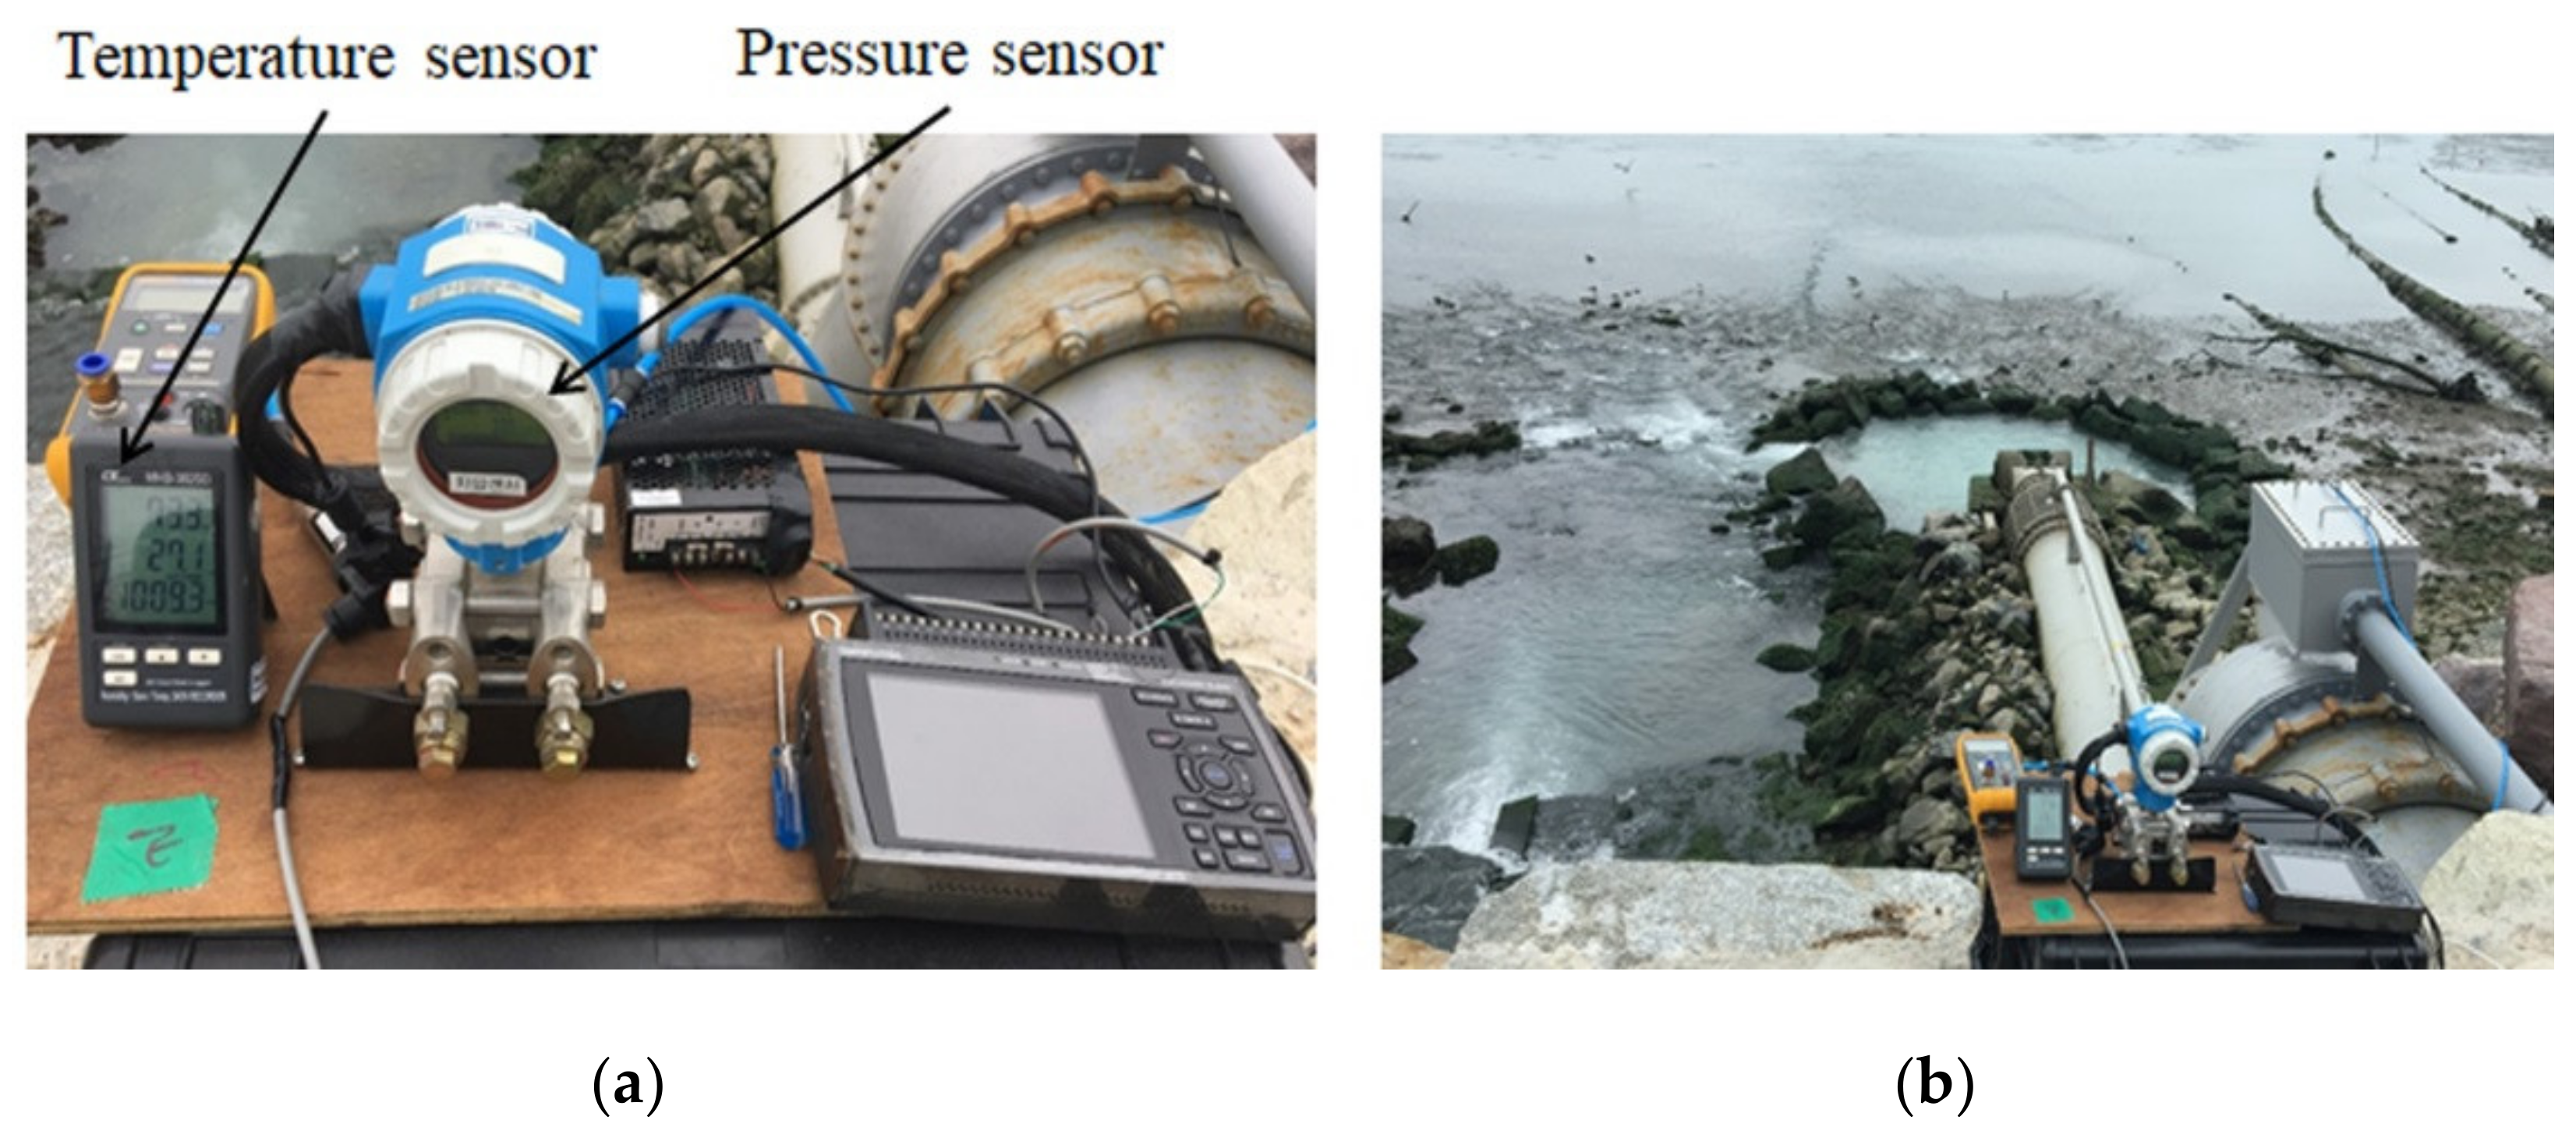
Processes 09 00266 g009
Figure 10. Experimental layout and devices: (a) pressure and temperature sensor; (b) offshore small hydro power plant.
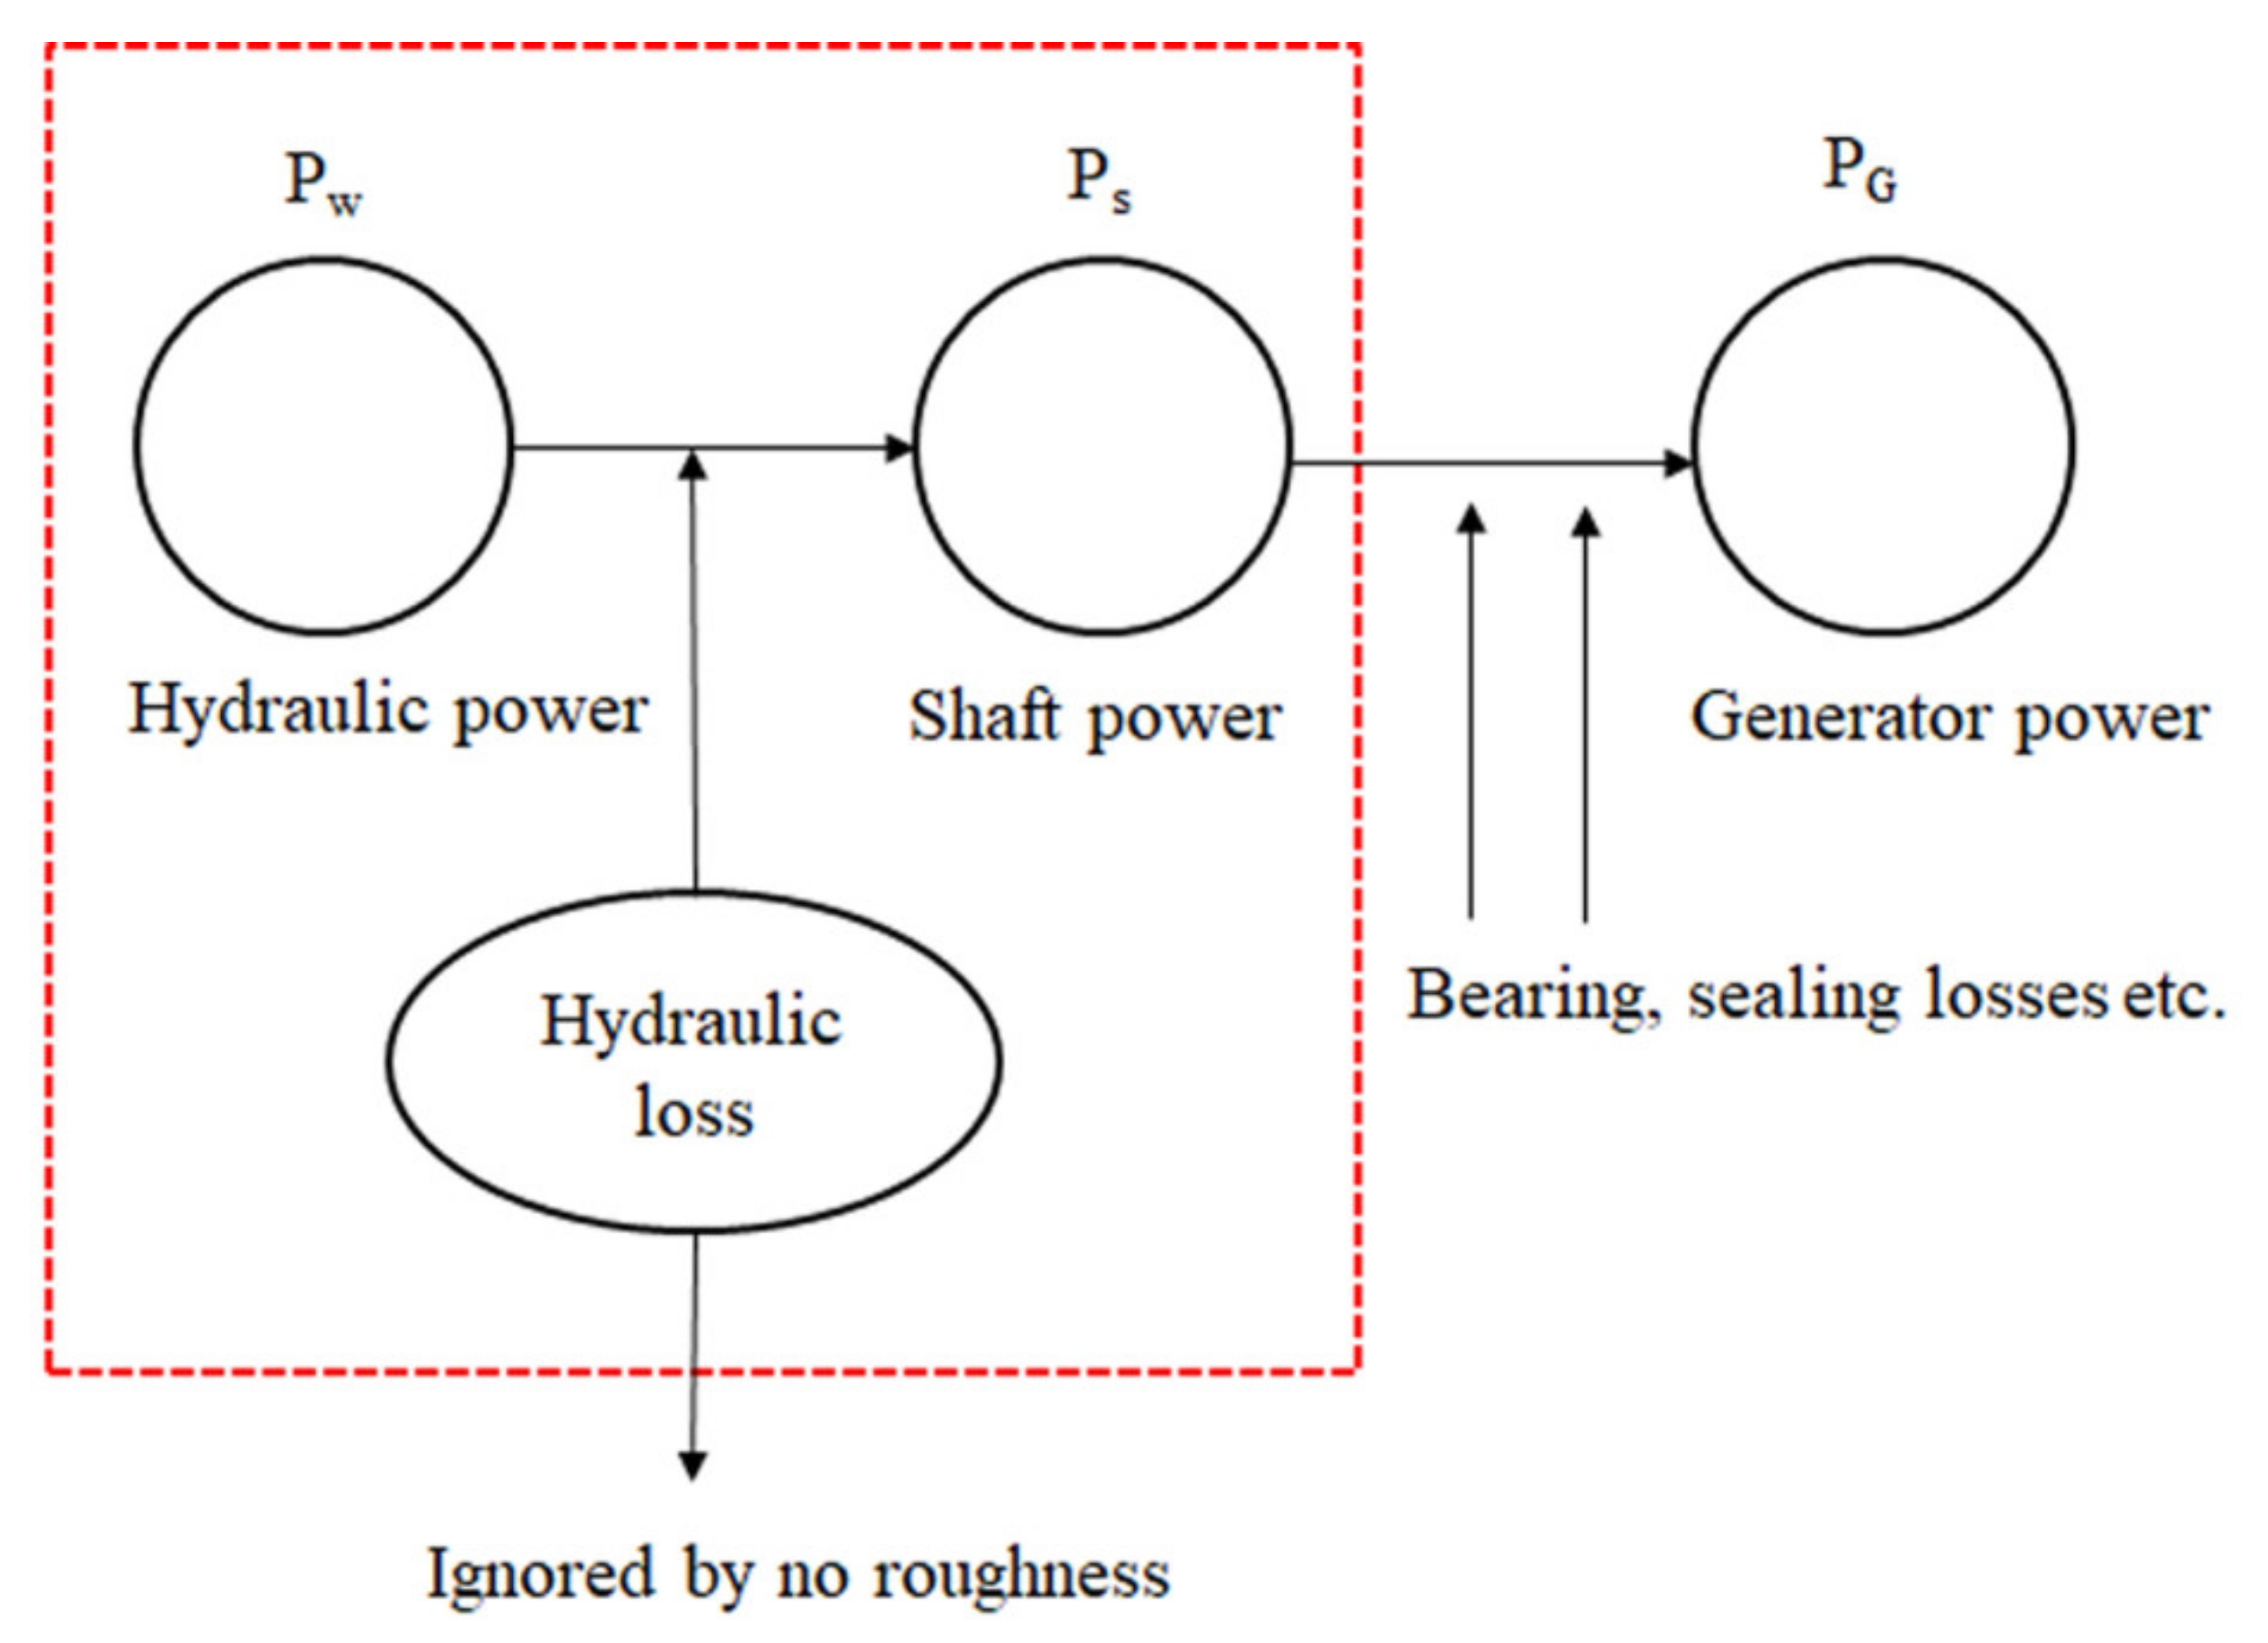
Processes 09 00266 g010
Figure 11. Different losses in the hydraulic turbine (Pw = hydraulic power, Ps = shaft power, and PG = generator power).
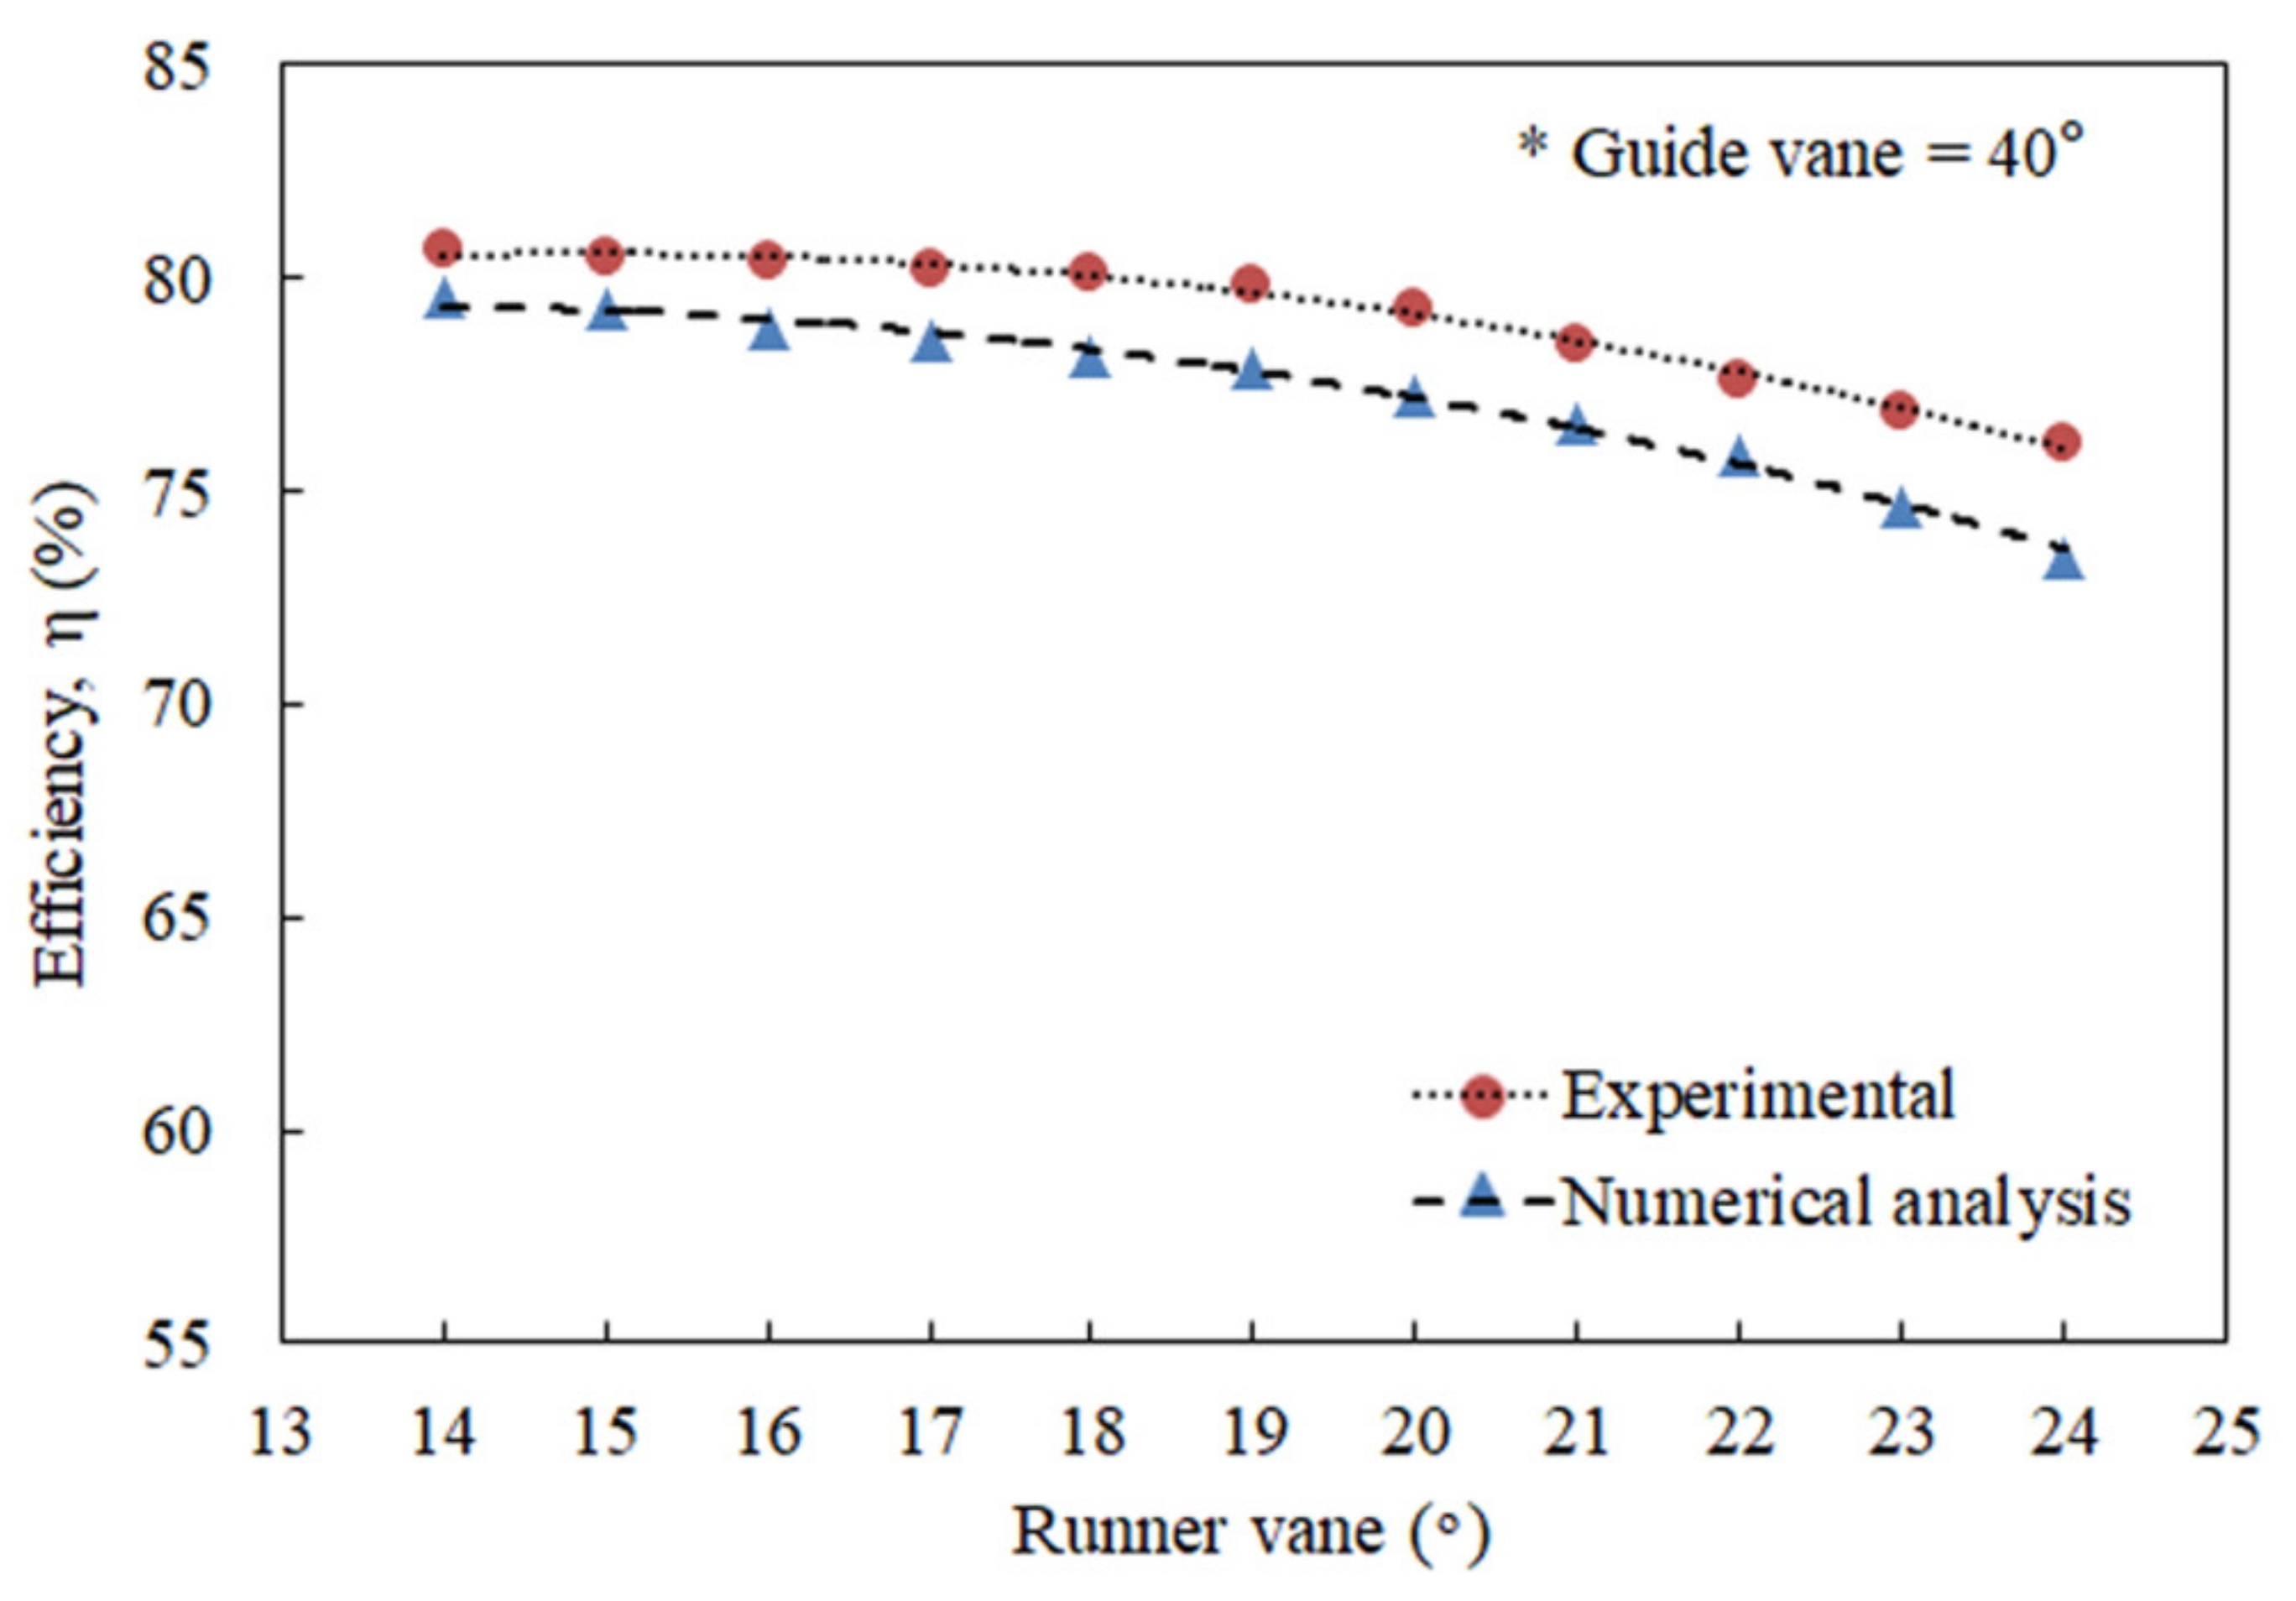
Processes 09 00266 g011
Figure 12. Comparison of turbine efficiency across various runner vane opening angles.
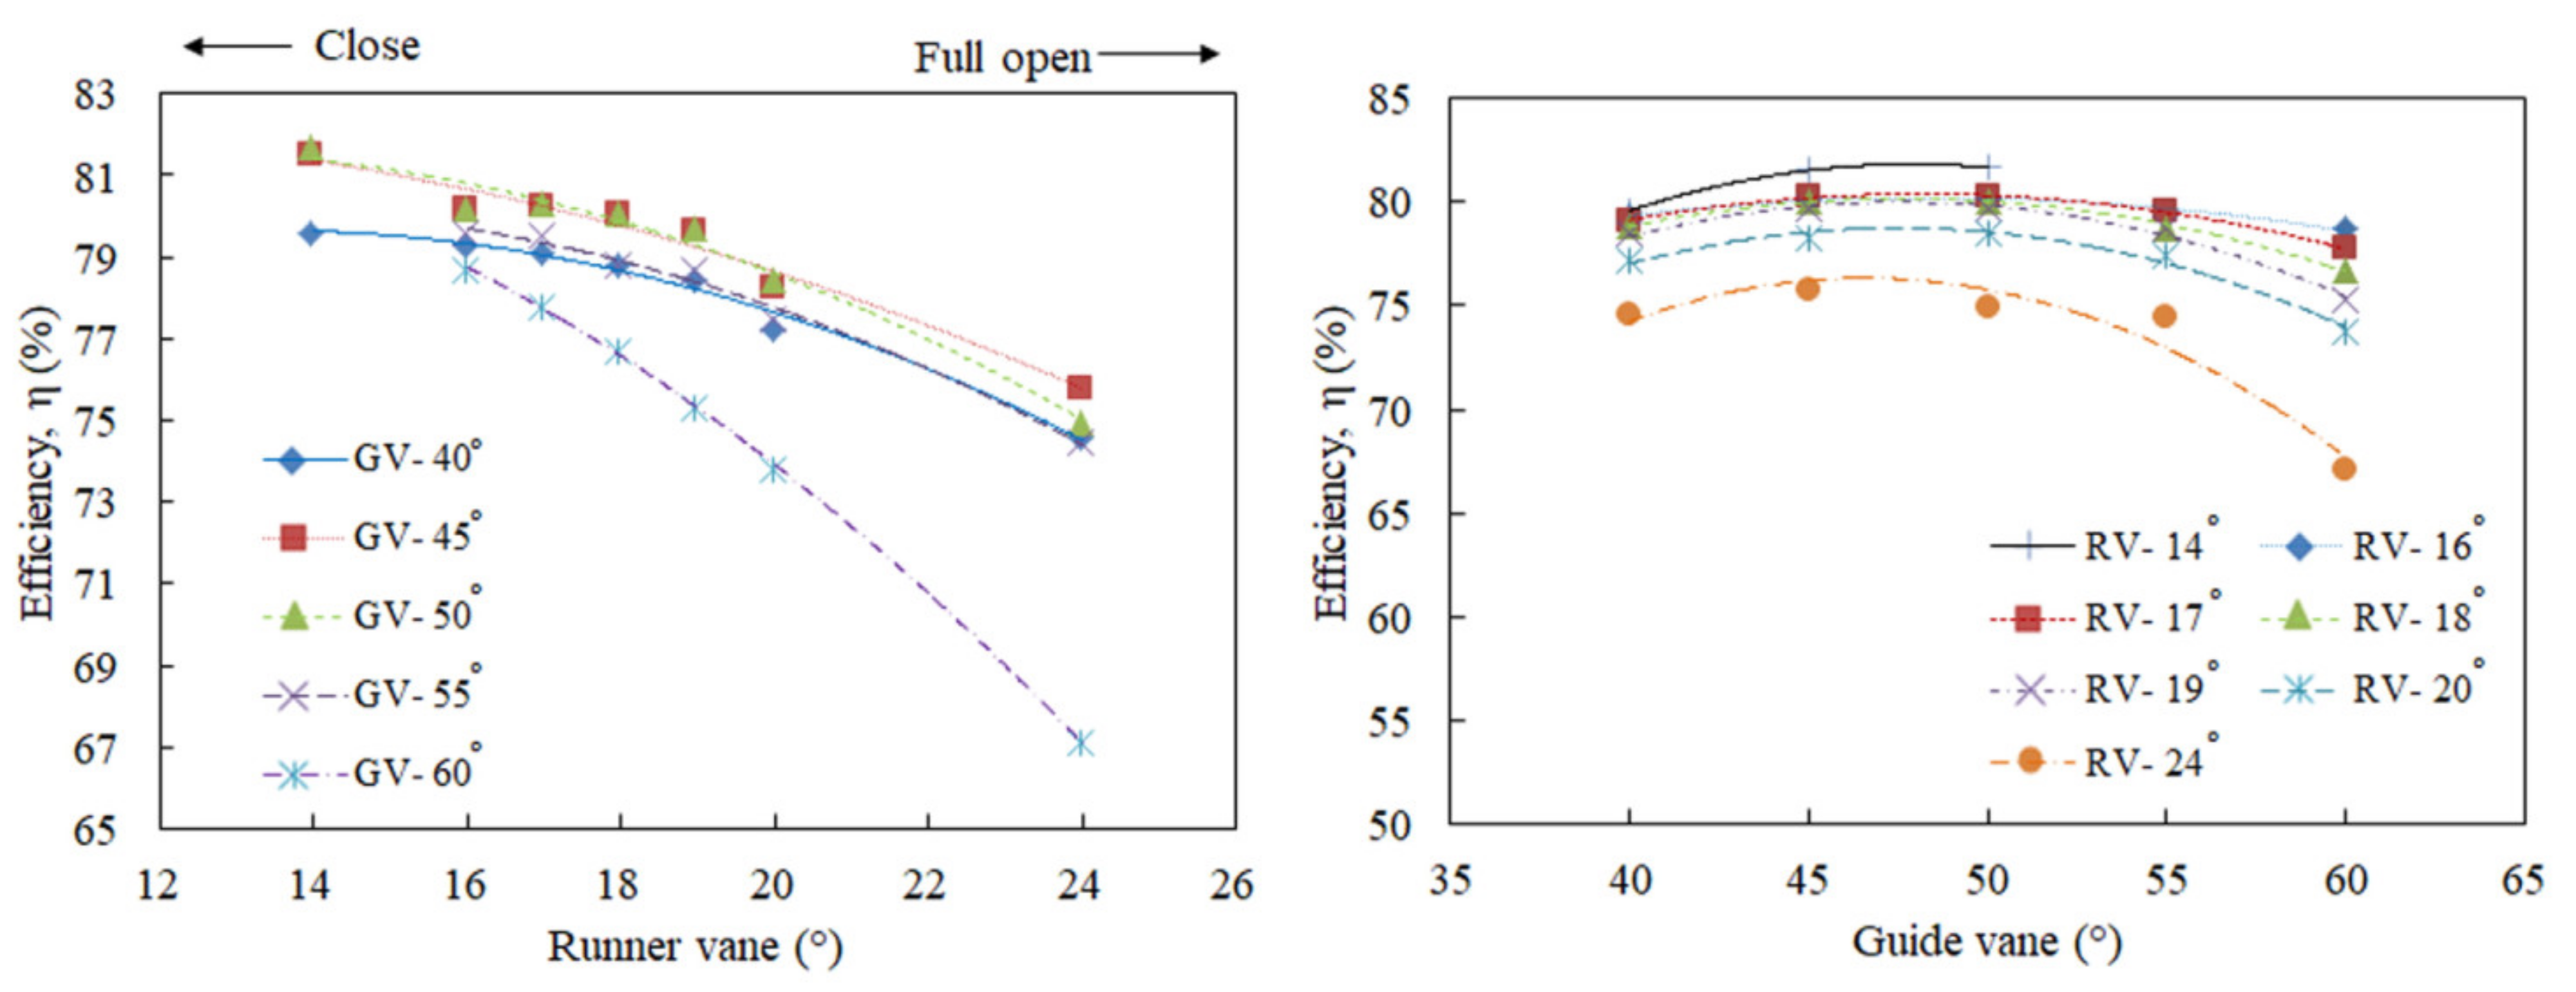
Processes 09 00266 g012
Figure 13. Efficiency changes according to runner vane and guide vane opening angles.
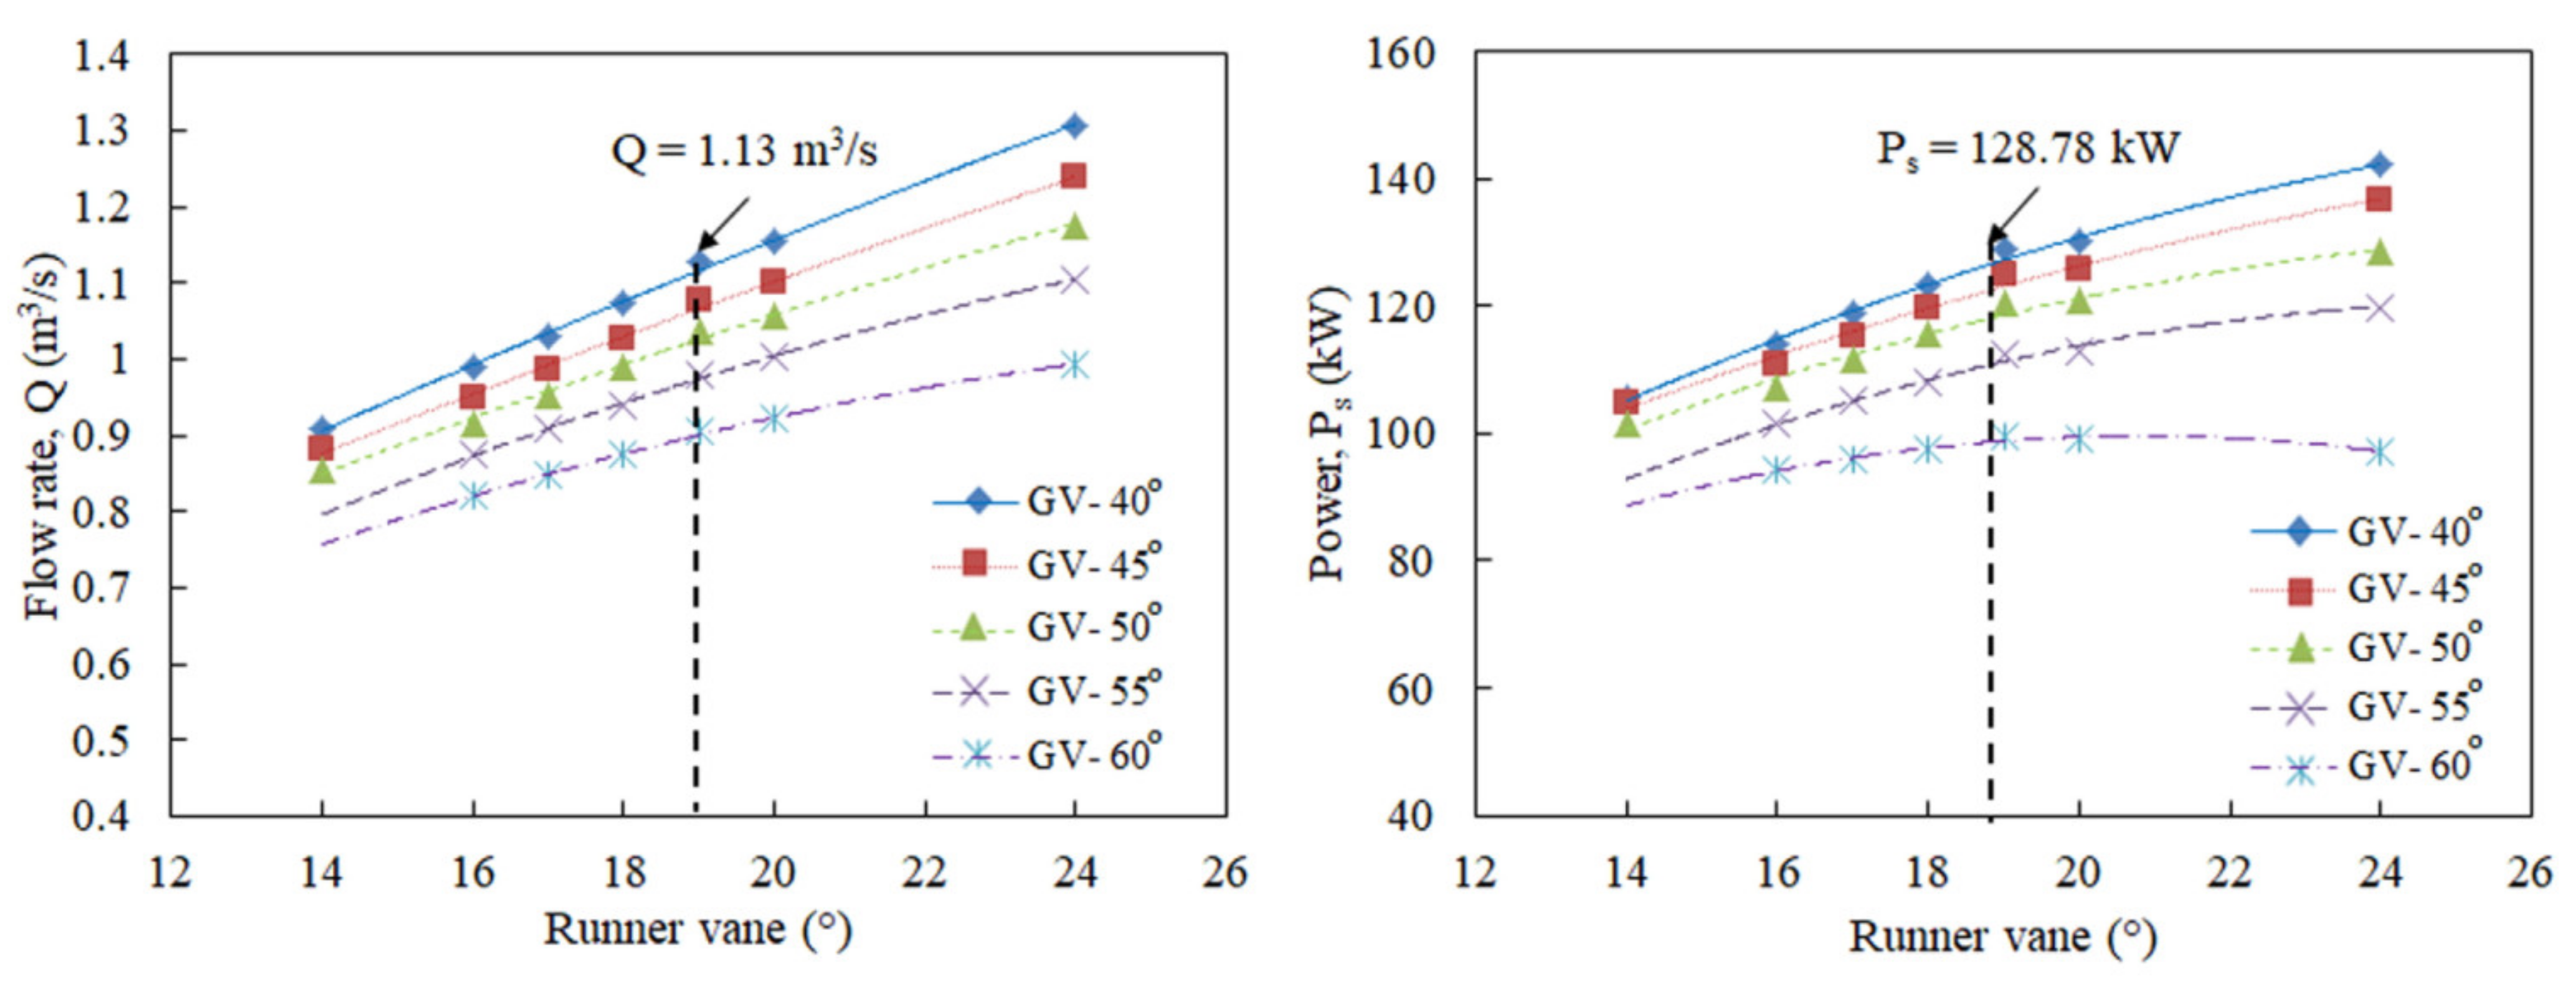
Processes 09 00266 g013
Figure 14. Flow rates, power versus runner vane, and guide vane opening angles.
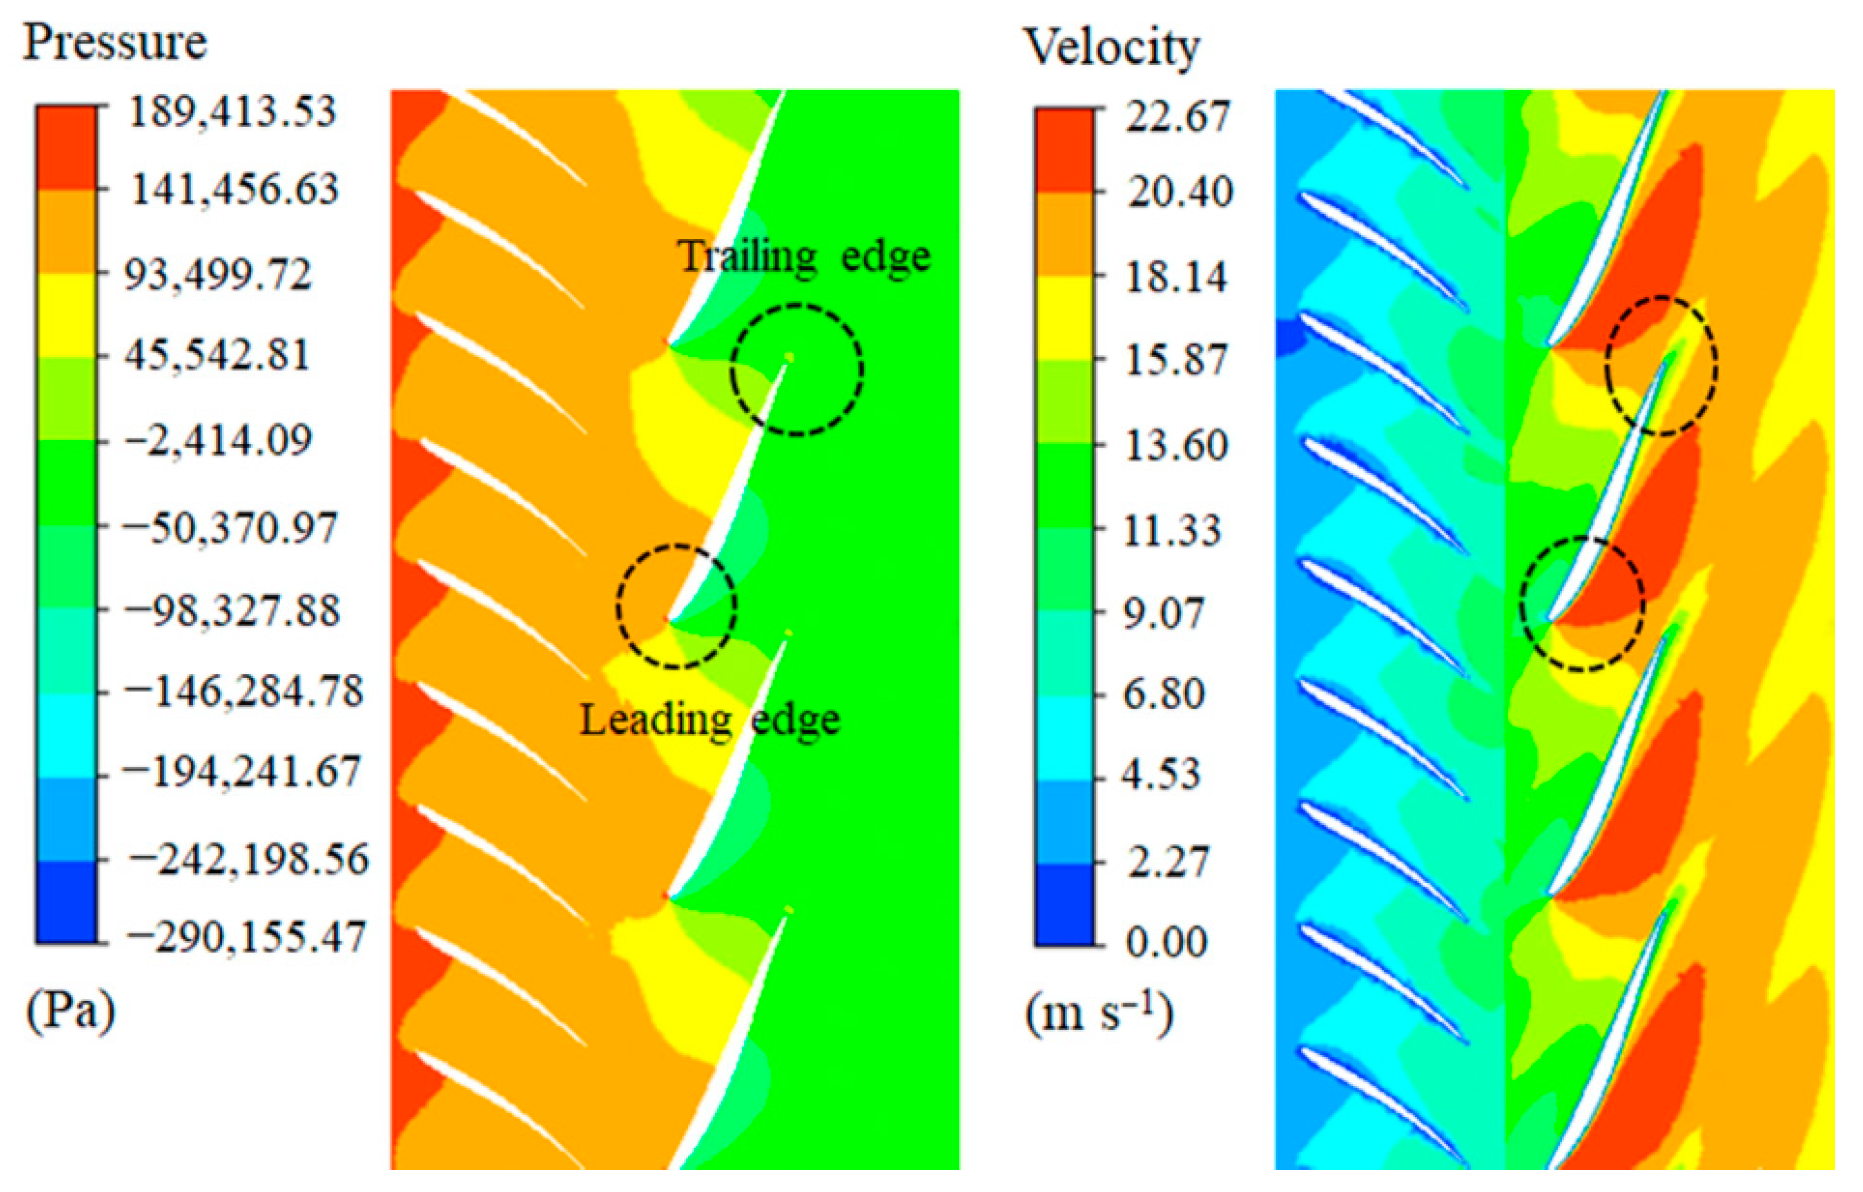
Processes 09 00266 g014
Figure 15. Blade-to-blade pressure and velocity contours (span = 0.5).
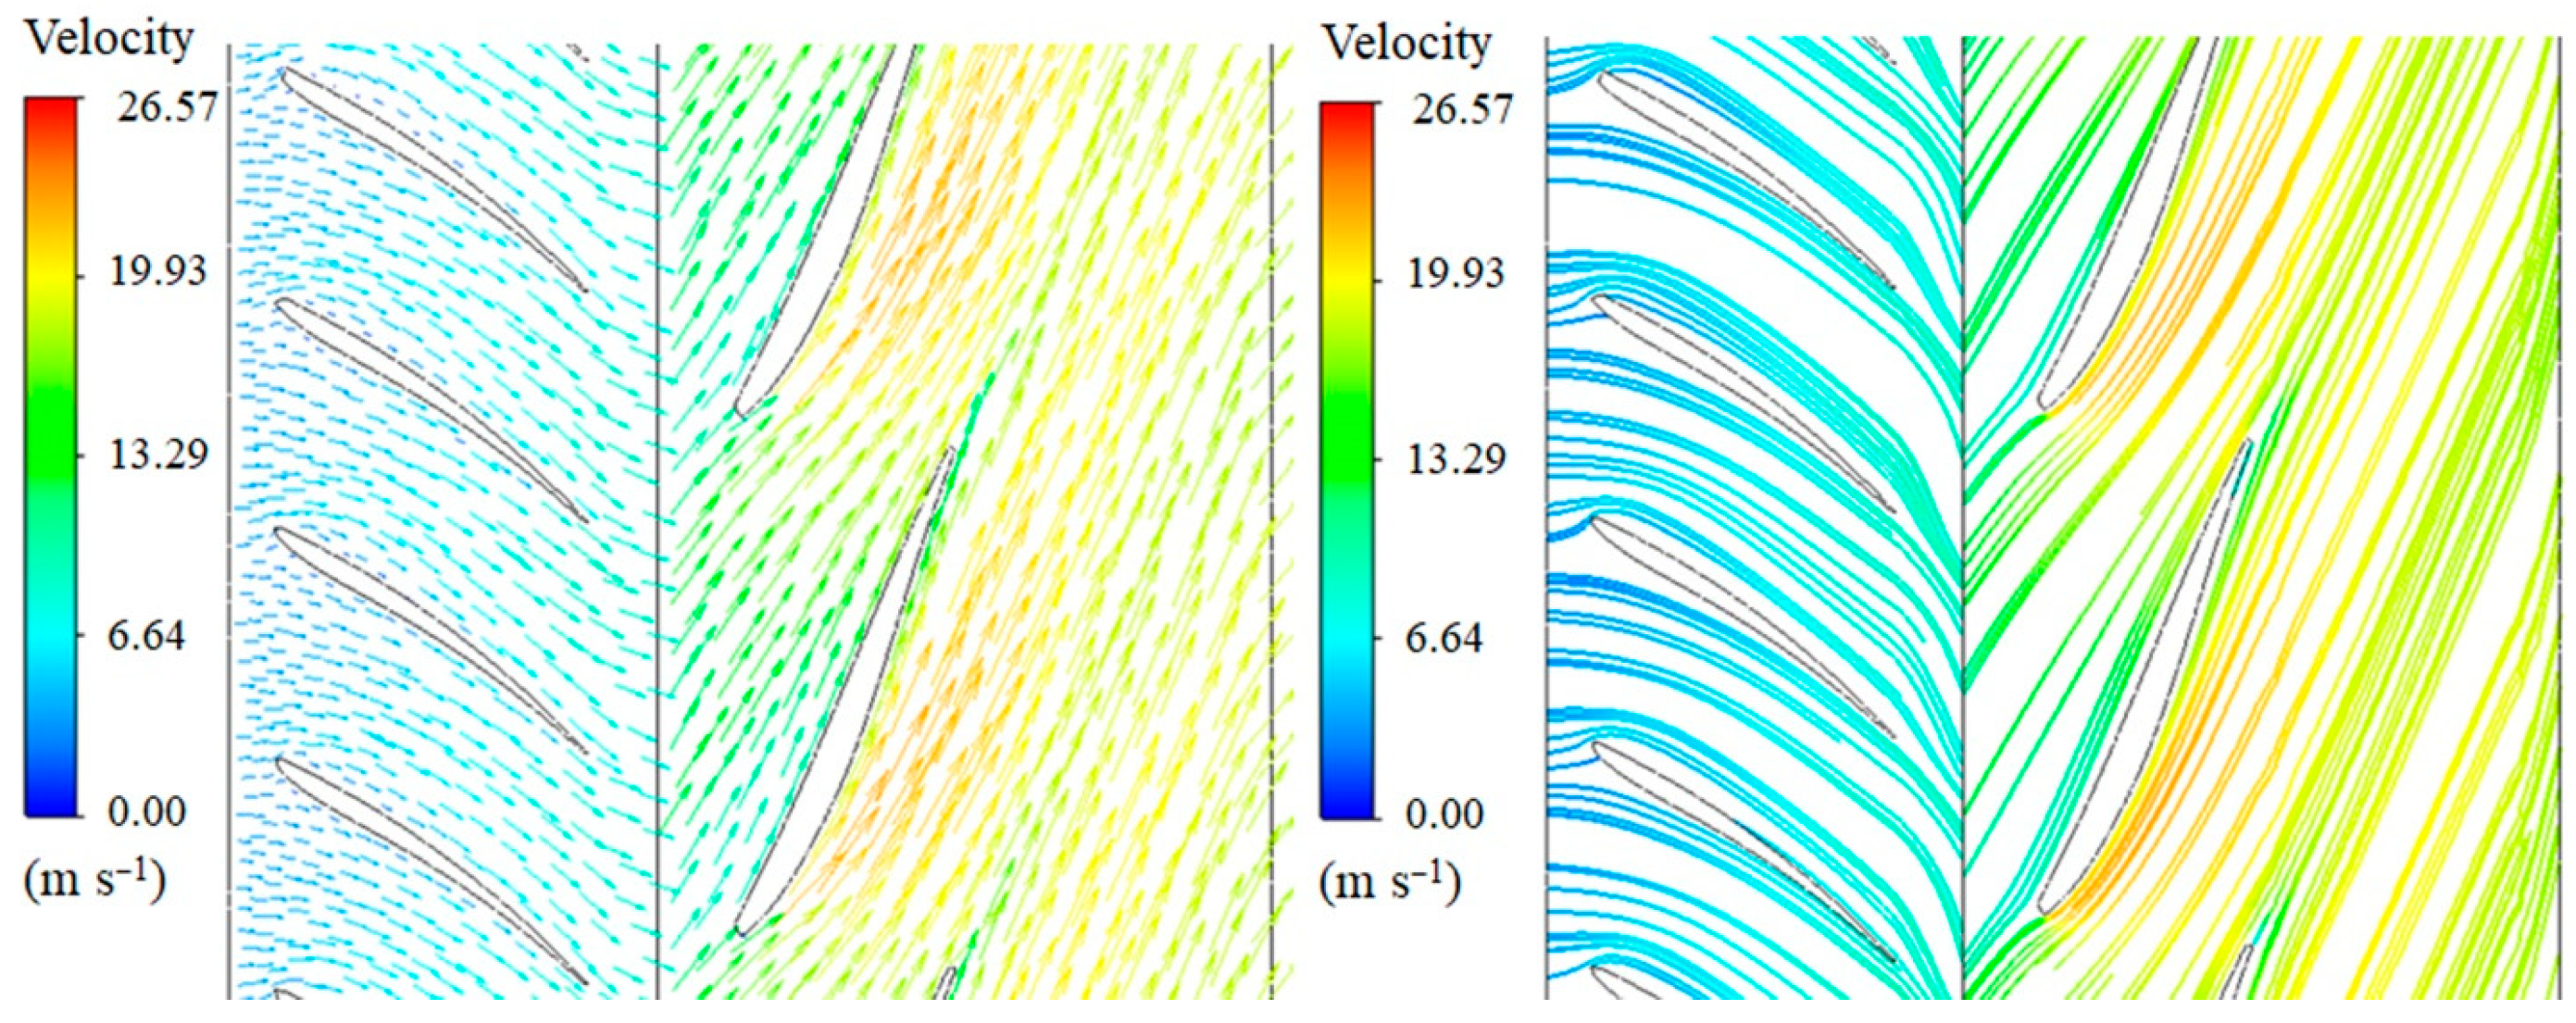
Processes 09 00266 g015
Figure 16. Blade-to-blade velocity vector and velocity streamlines (span = 0.5).
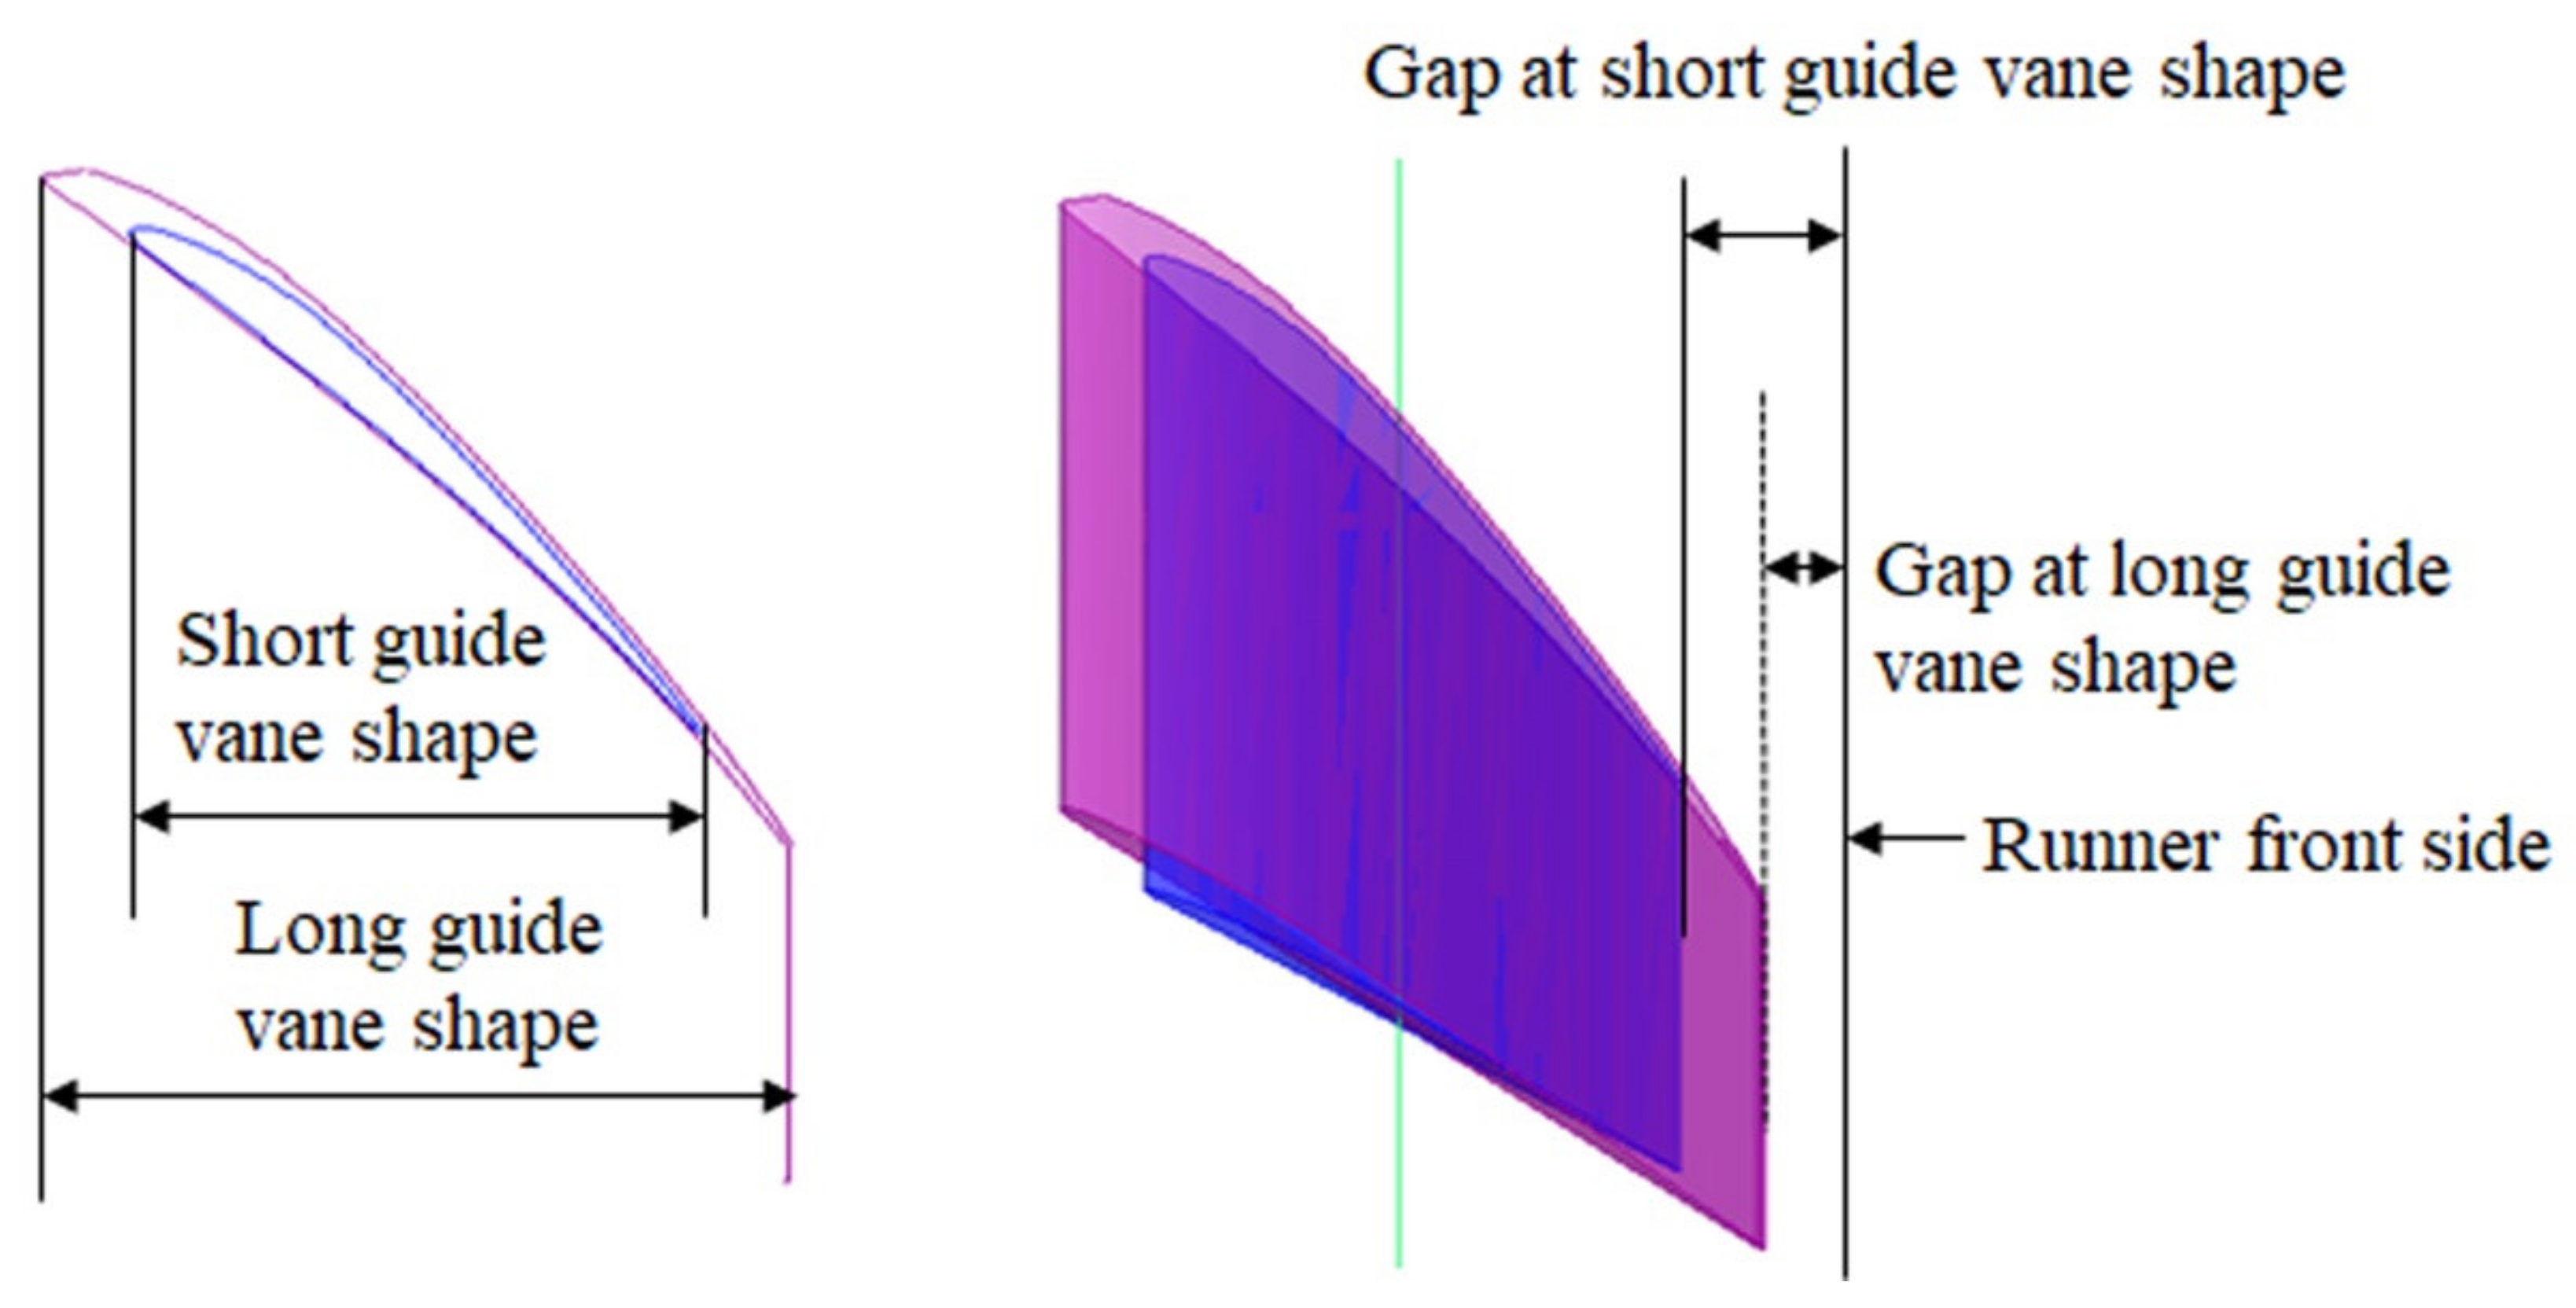
Processes 09 00266 g016
Figure 17. Shapes of short and long guide vanes.
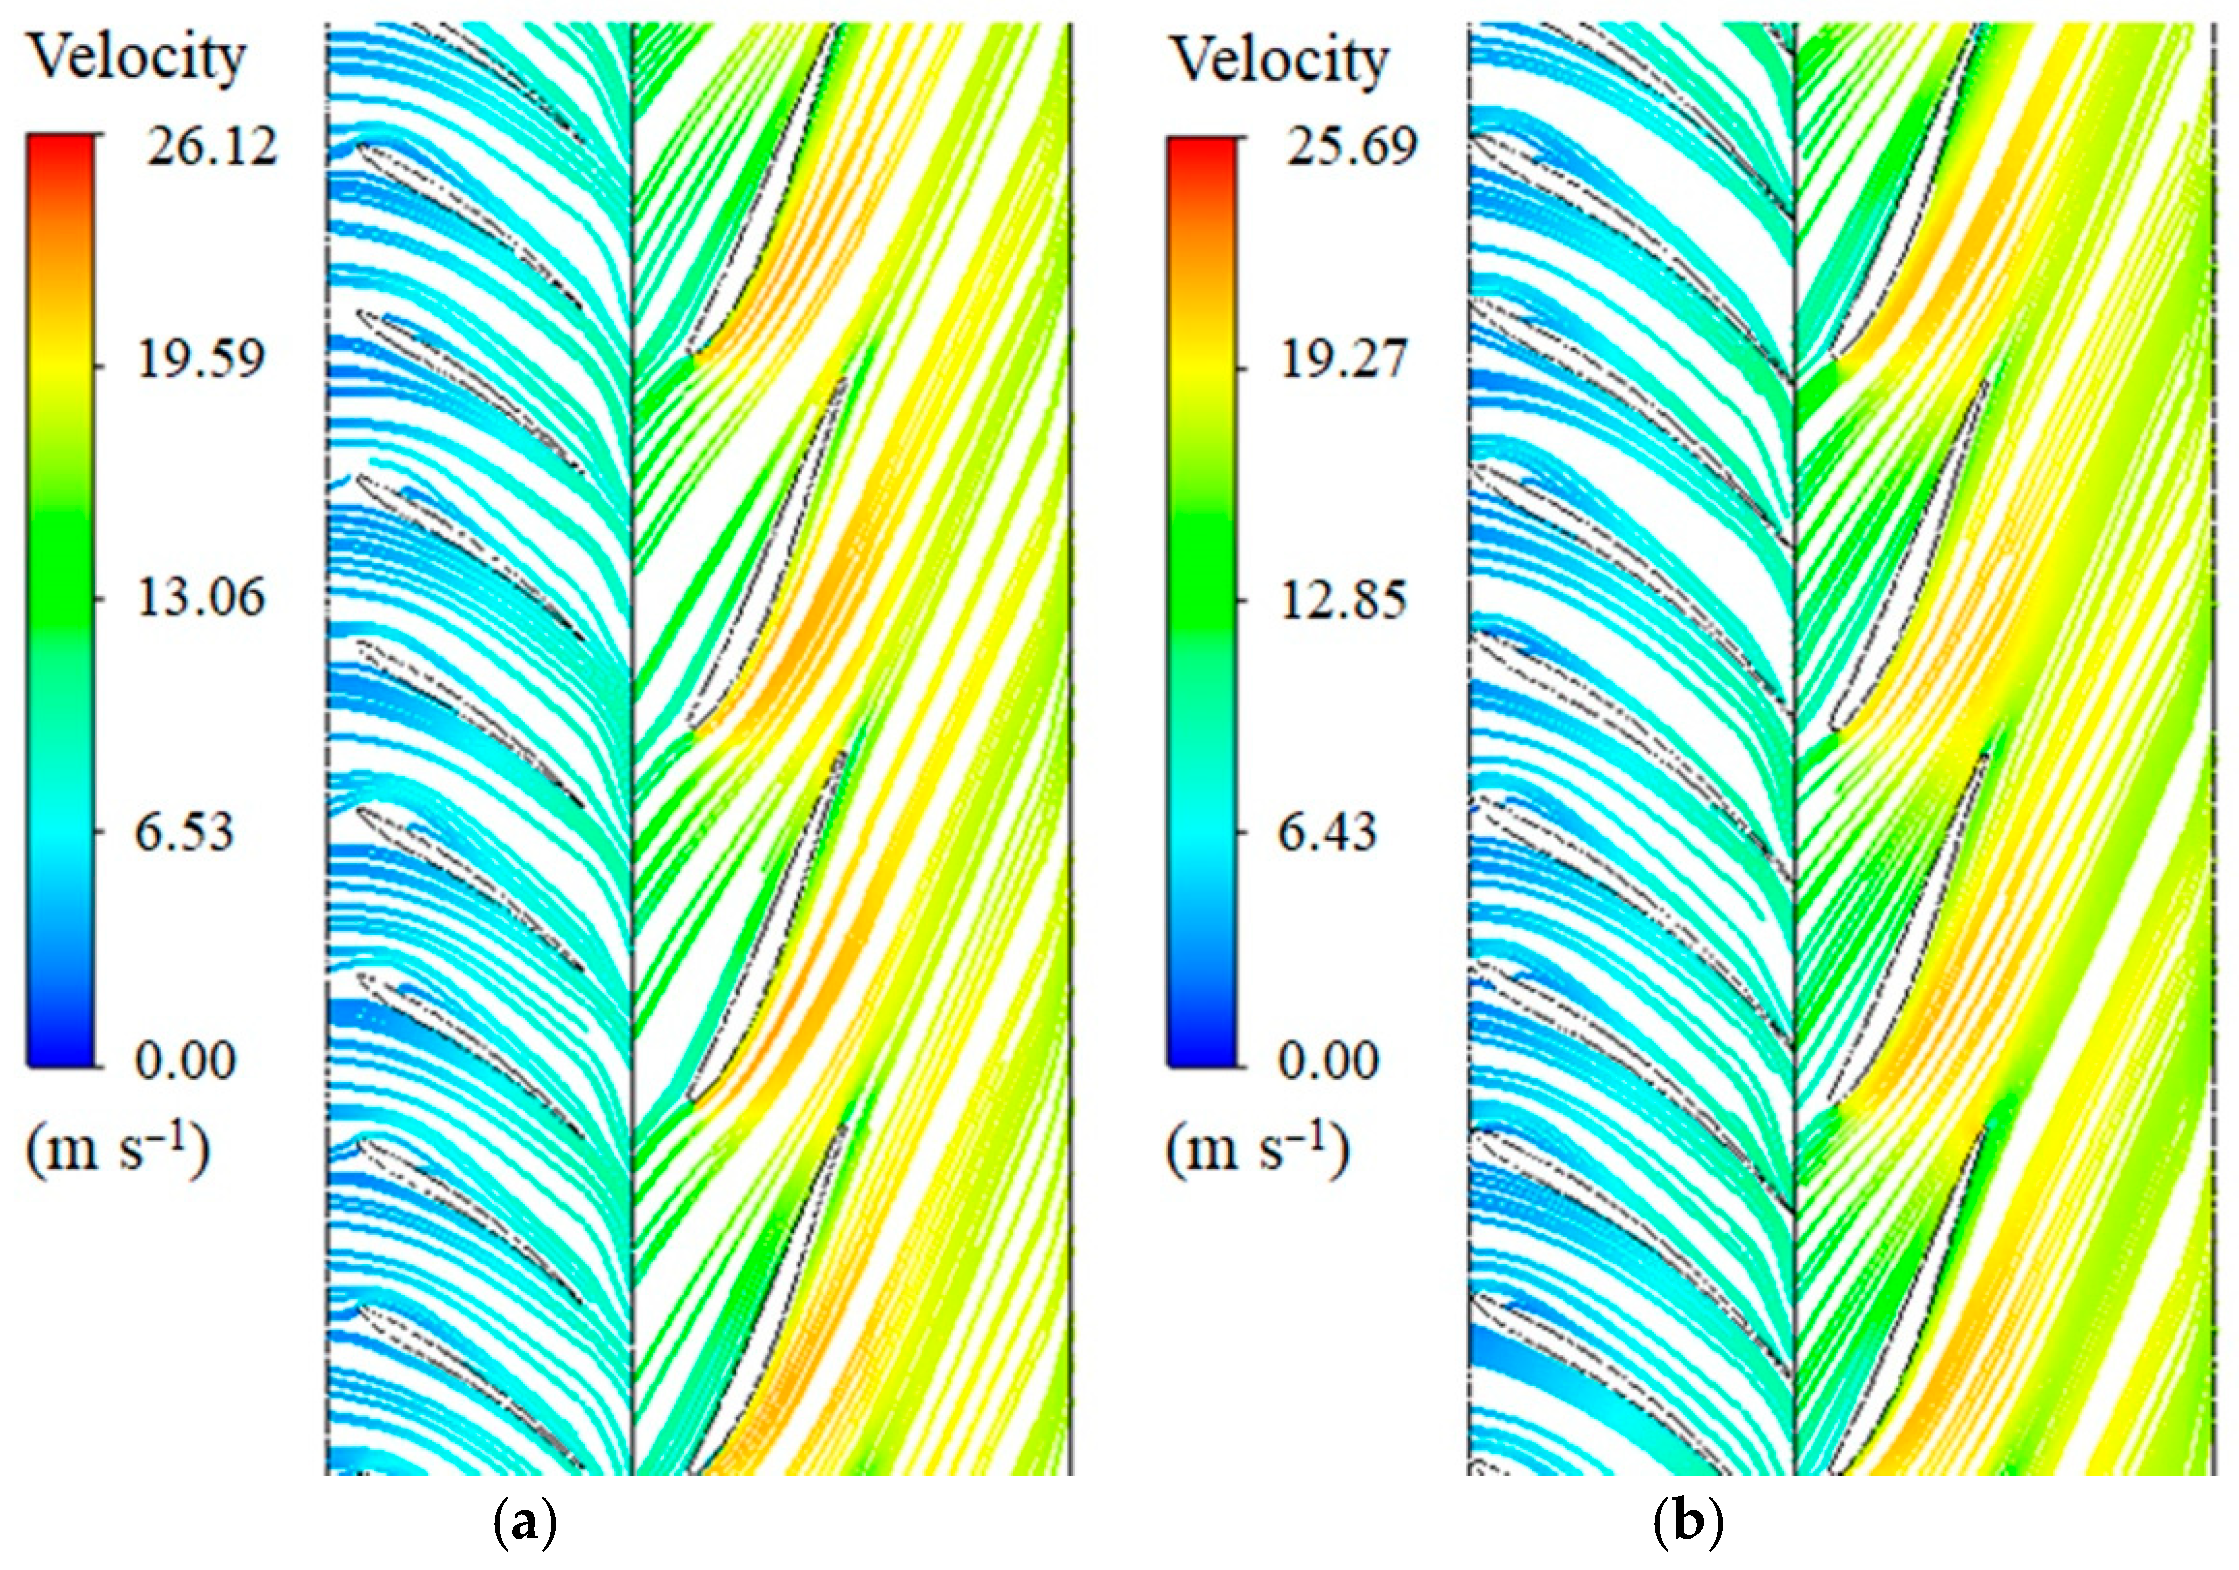
Processes 09 00266 g017
Figure 18. Vane-to-vane velocity streamline distribution of guide vanes and runner vanes: (a) at short chord; (b) at long chord.
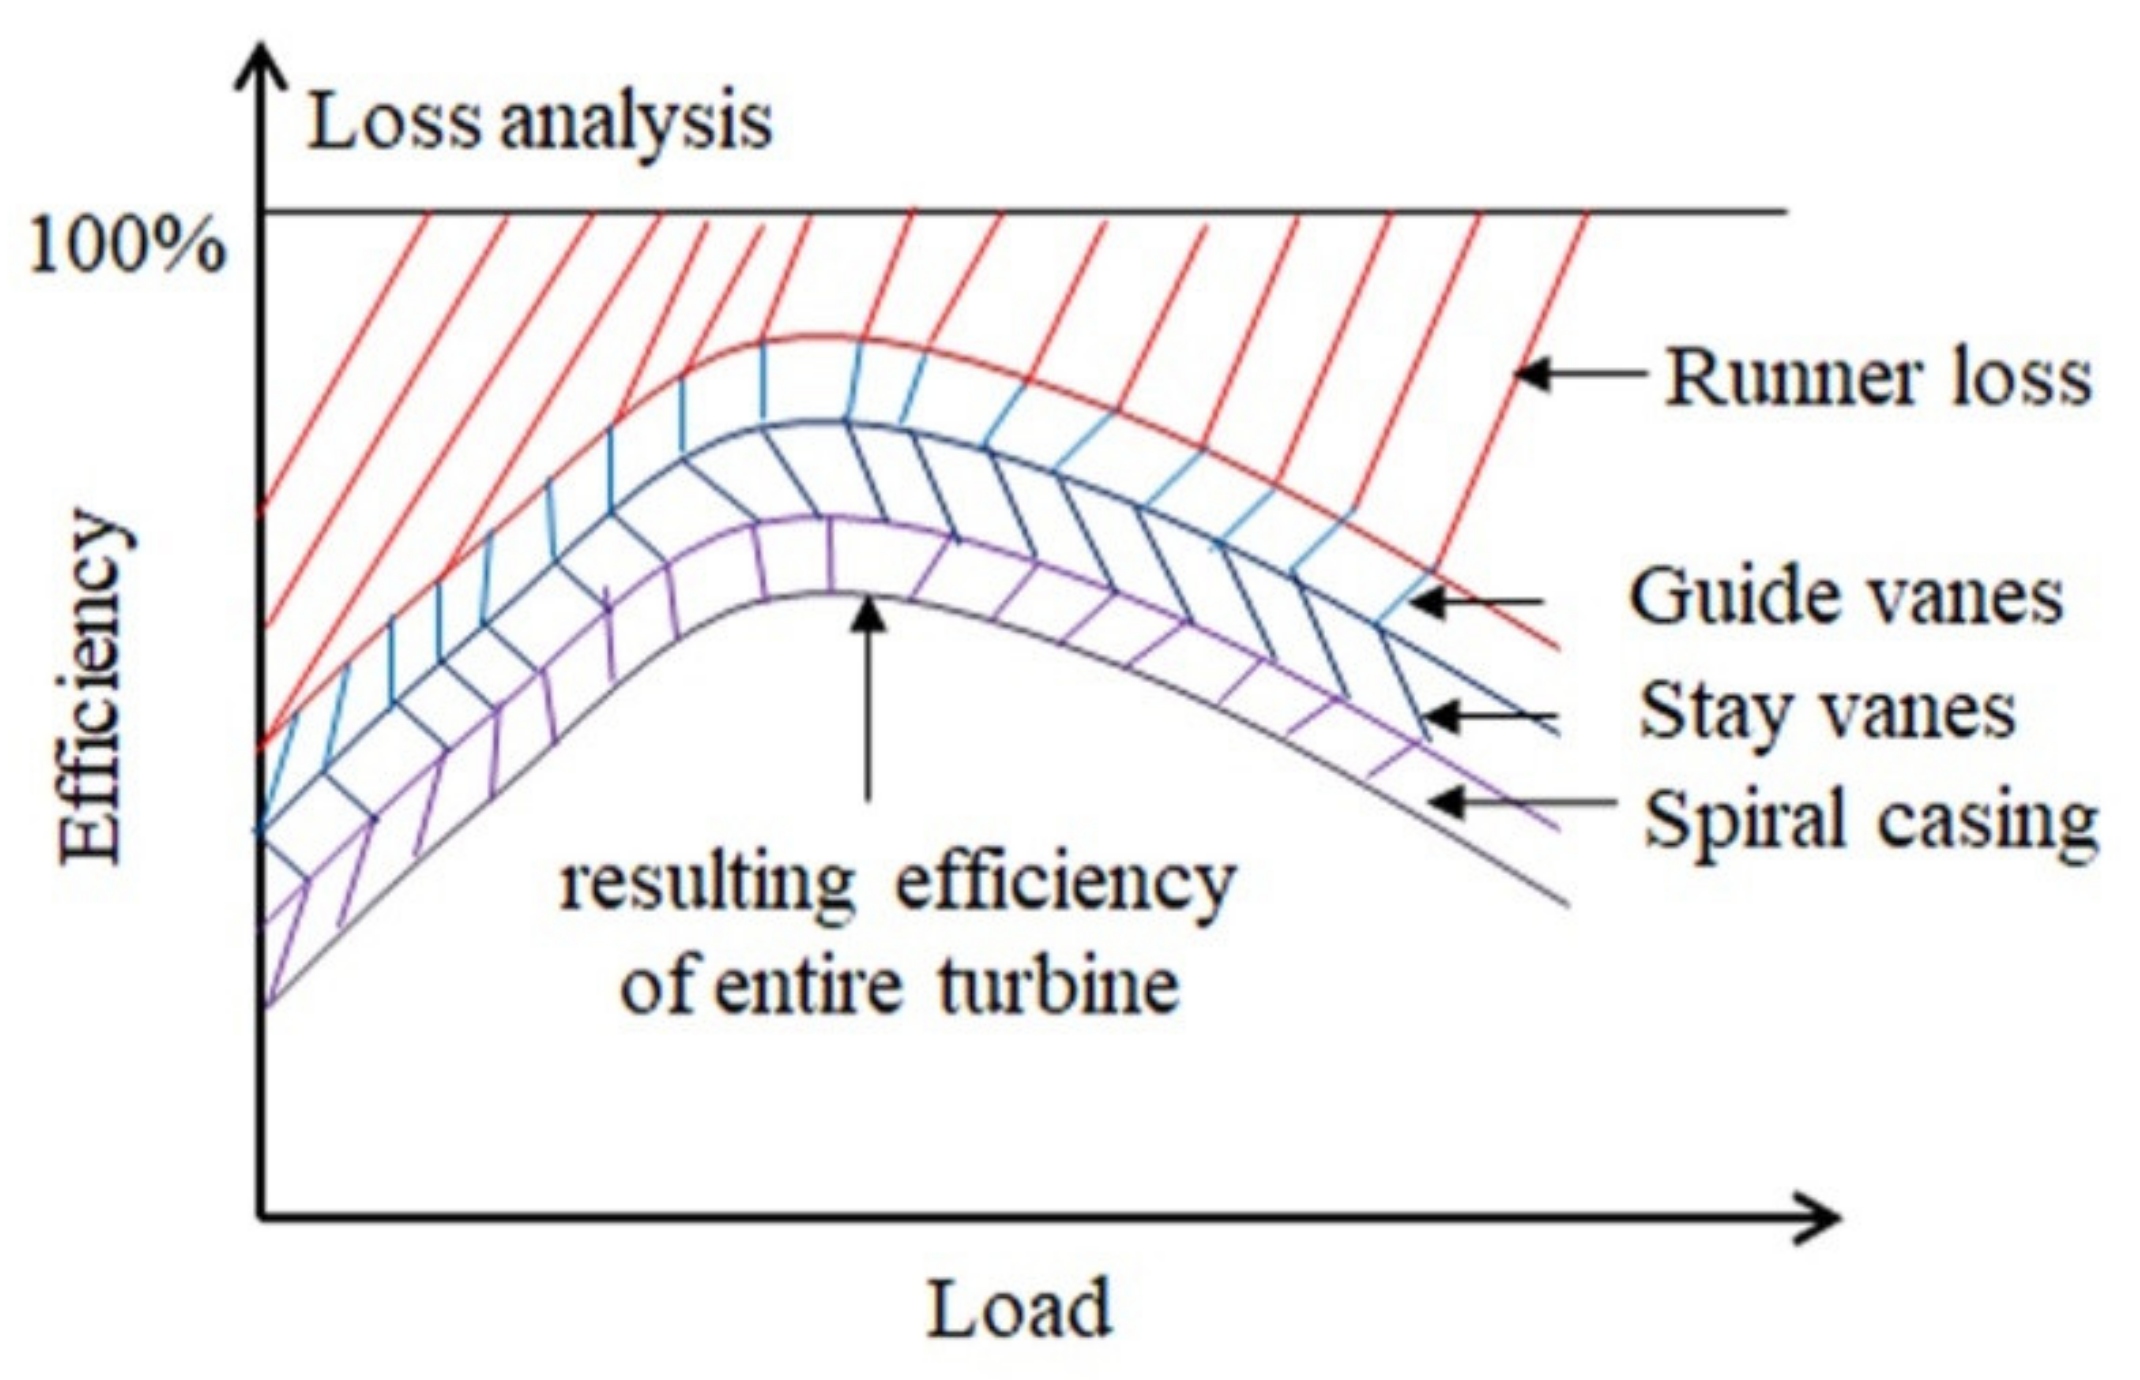
Processes 09 00266 g018
Figure 19. Turbine loss analysis.
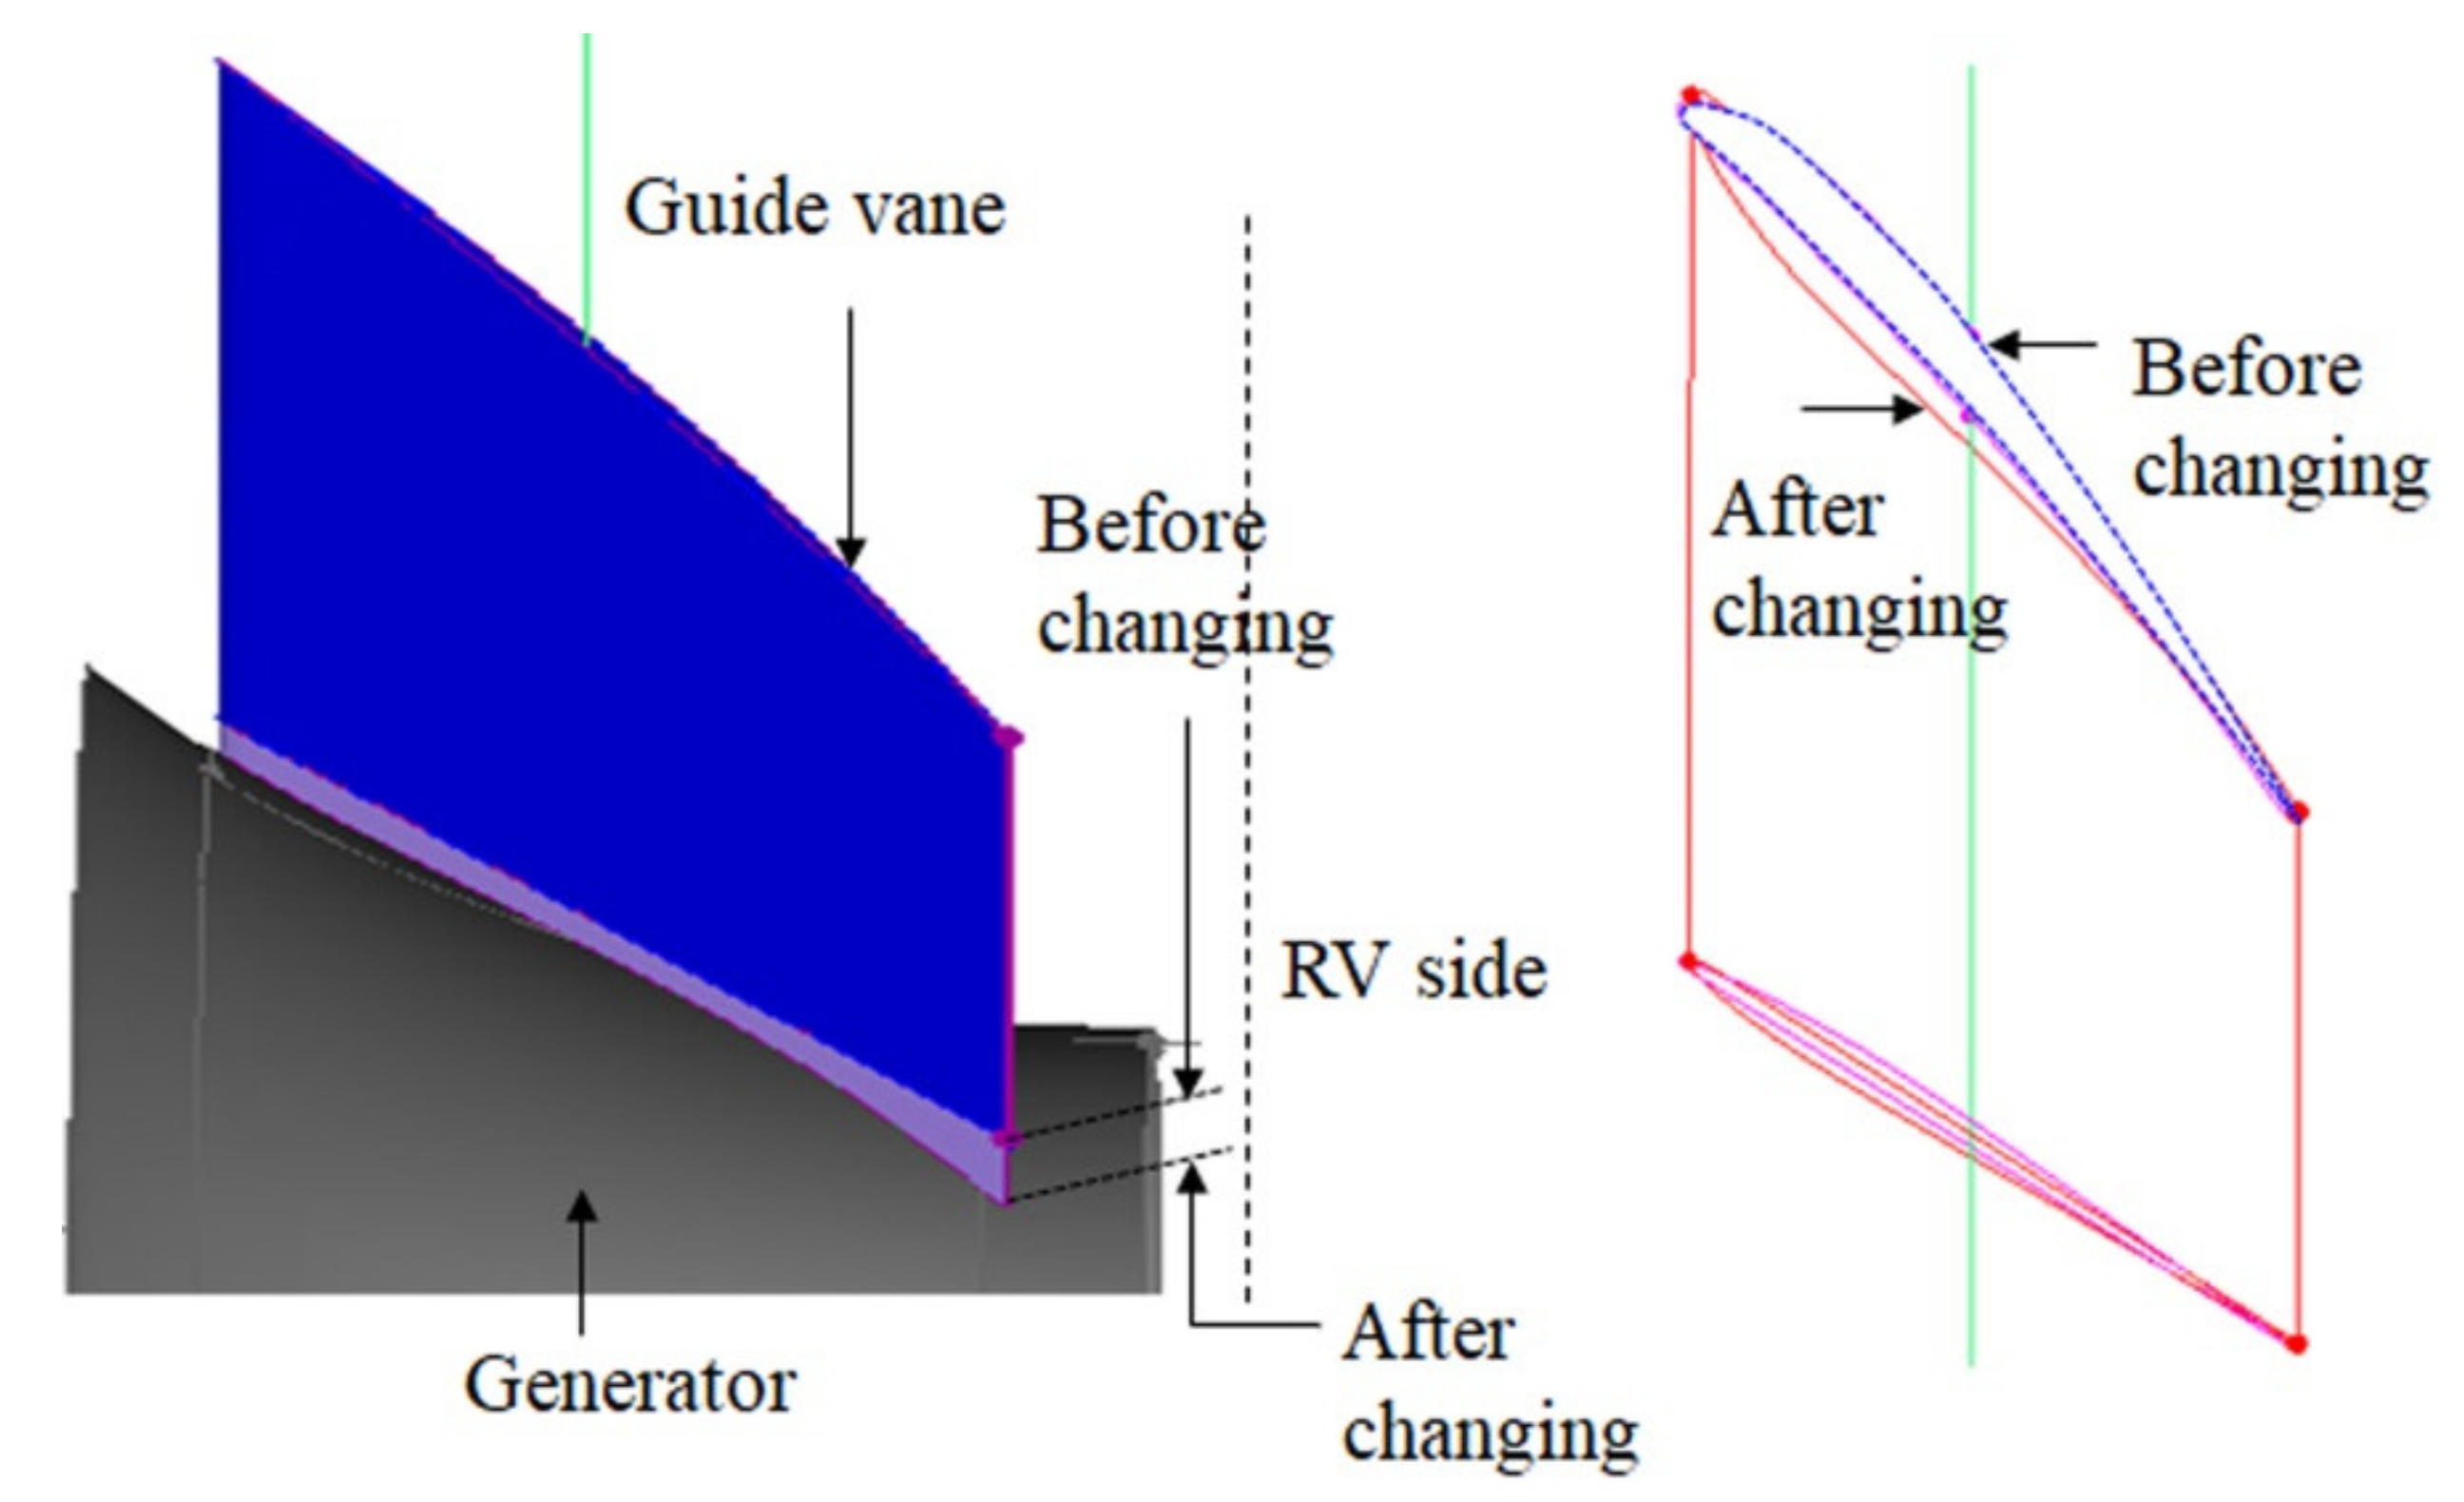
Processes 09 00266 g019
Figure 20. Guide vane attached to the generator side (short chord).
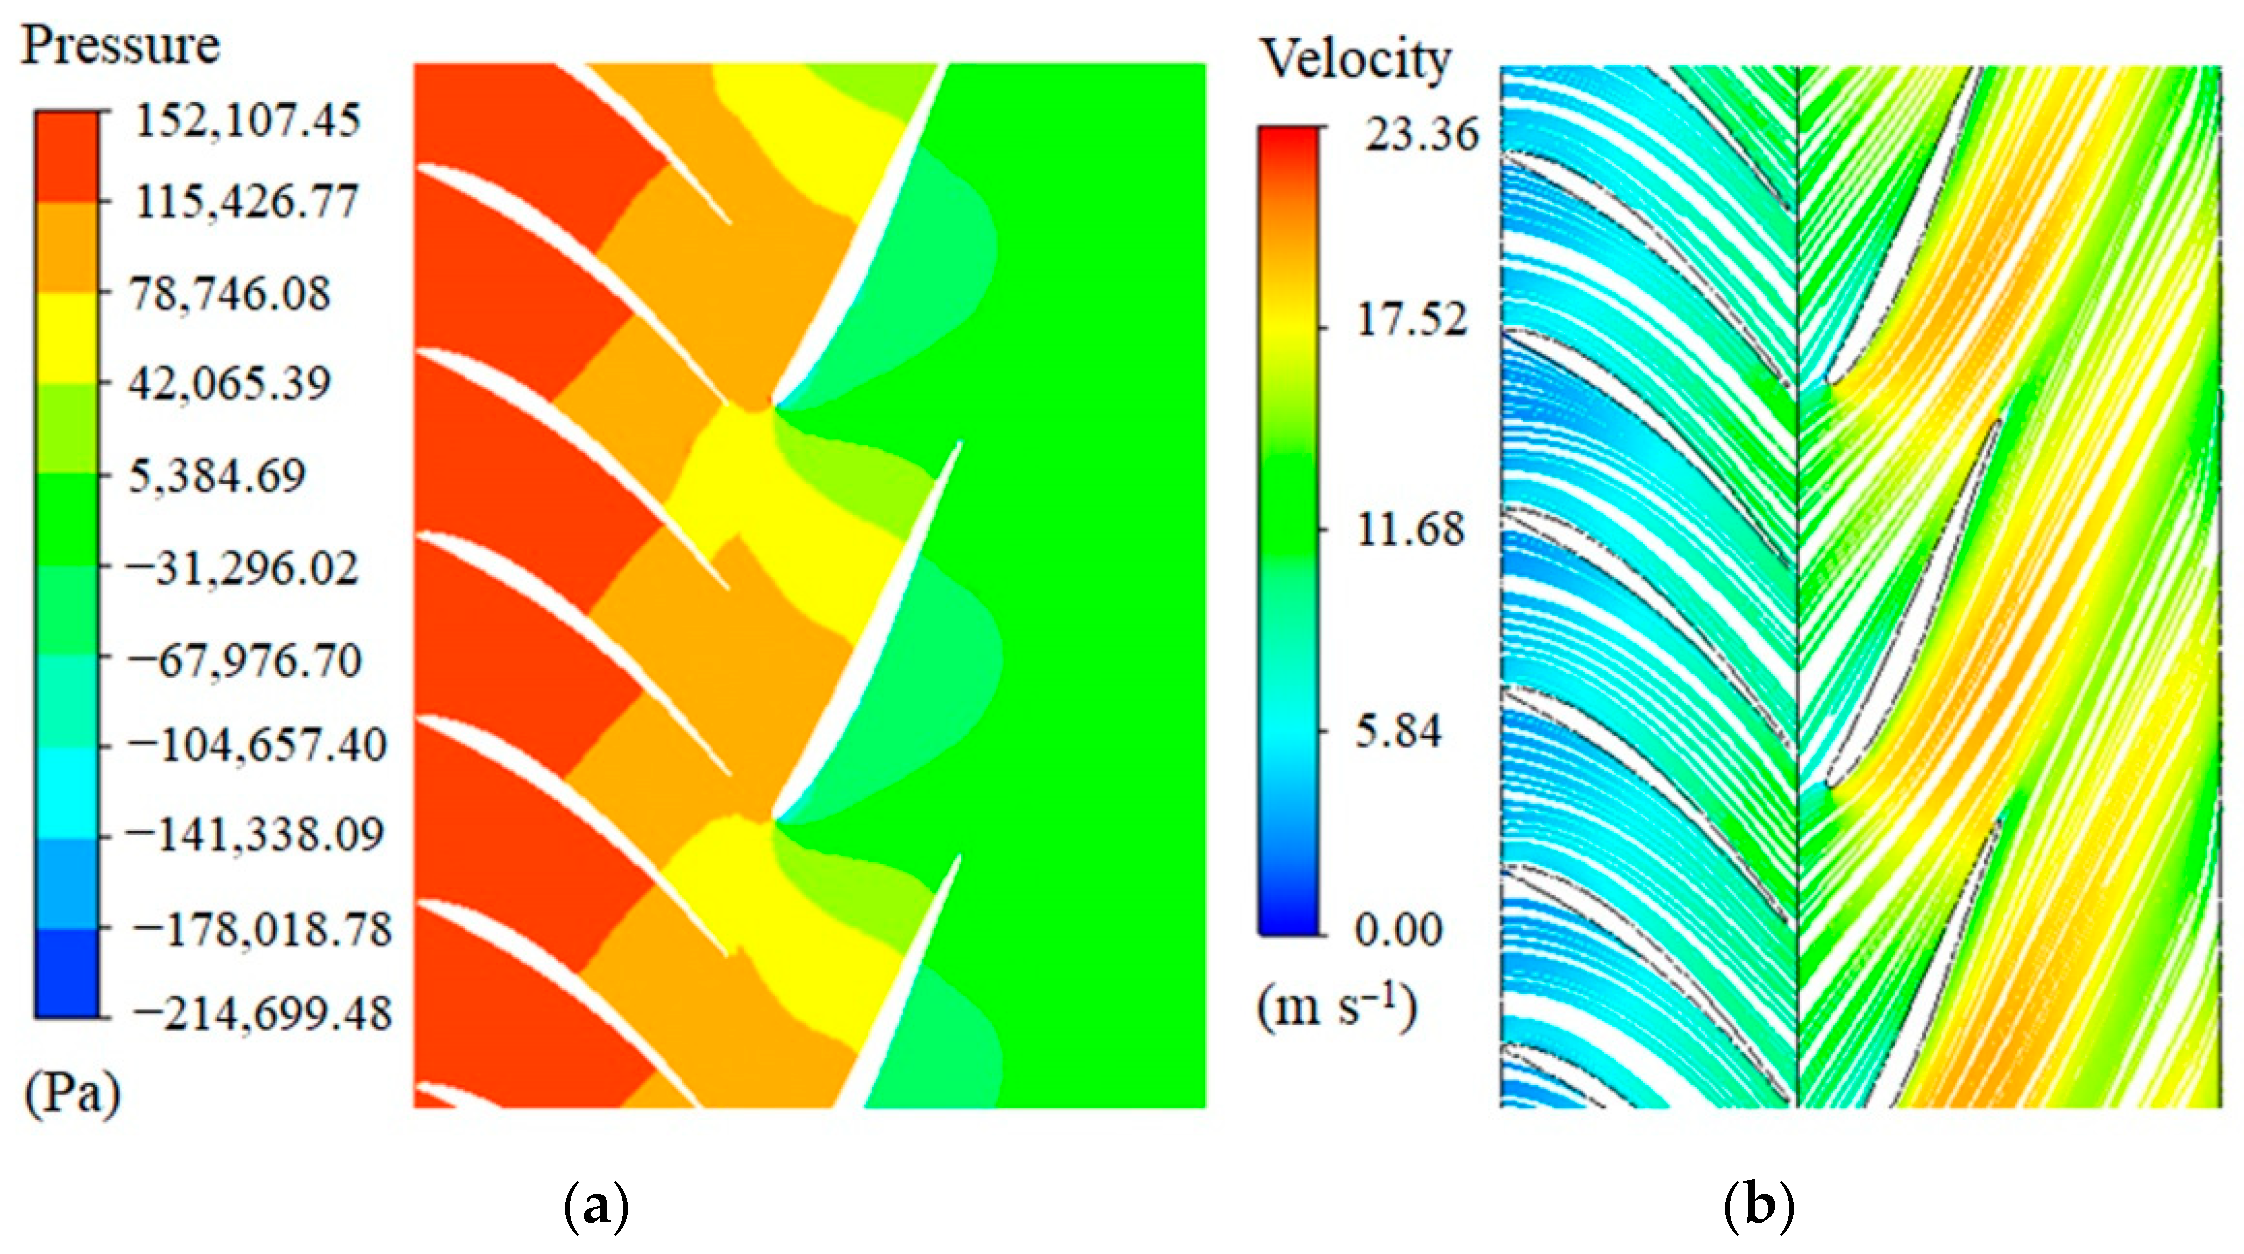
Processes 09 00266 g020
Figure 21. Vane-to-vane pressure and streamline distribution of guide vanes and runner vanes: (a) pressure contours; (b) streamline contours.
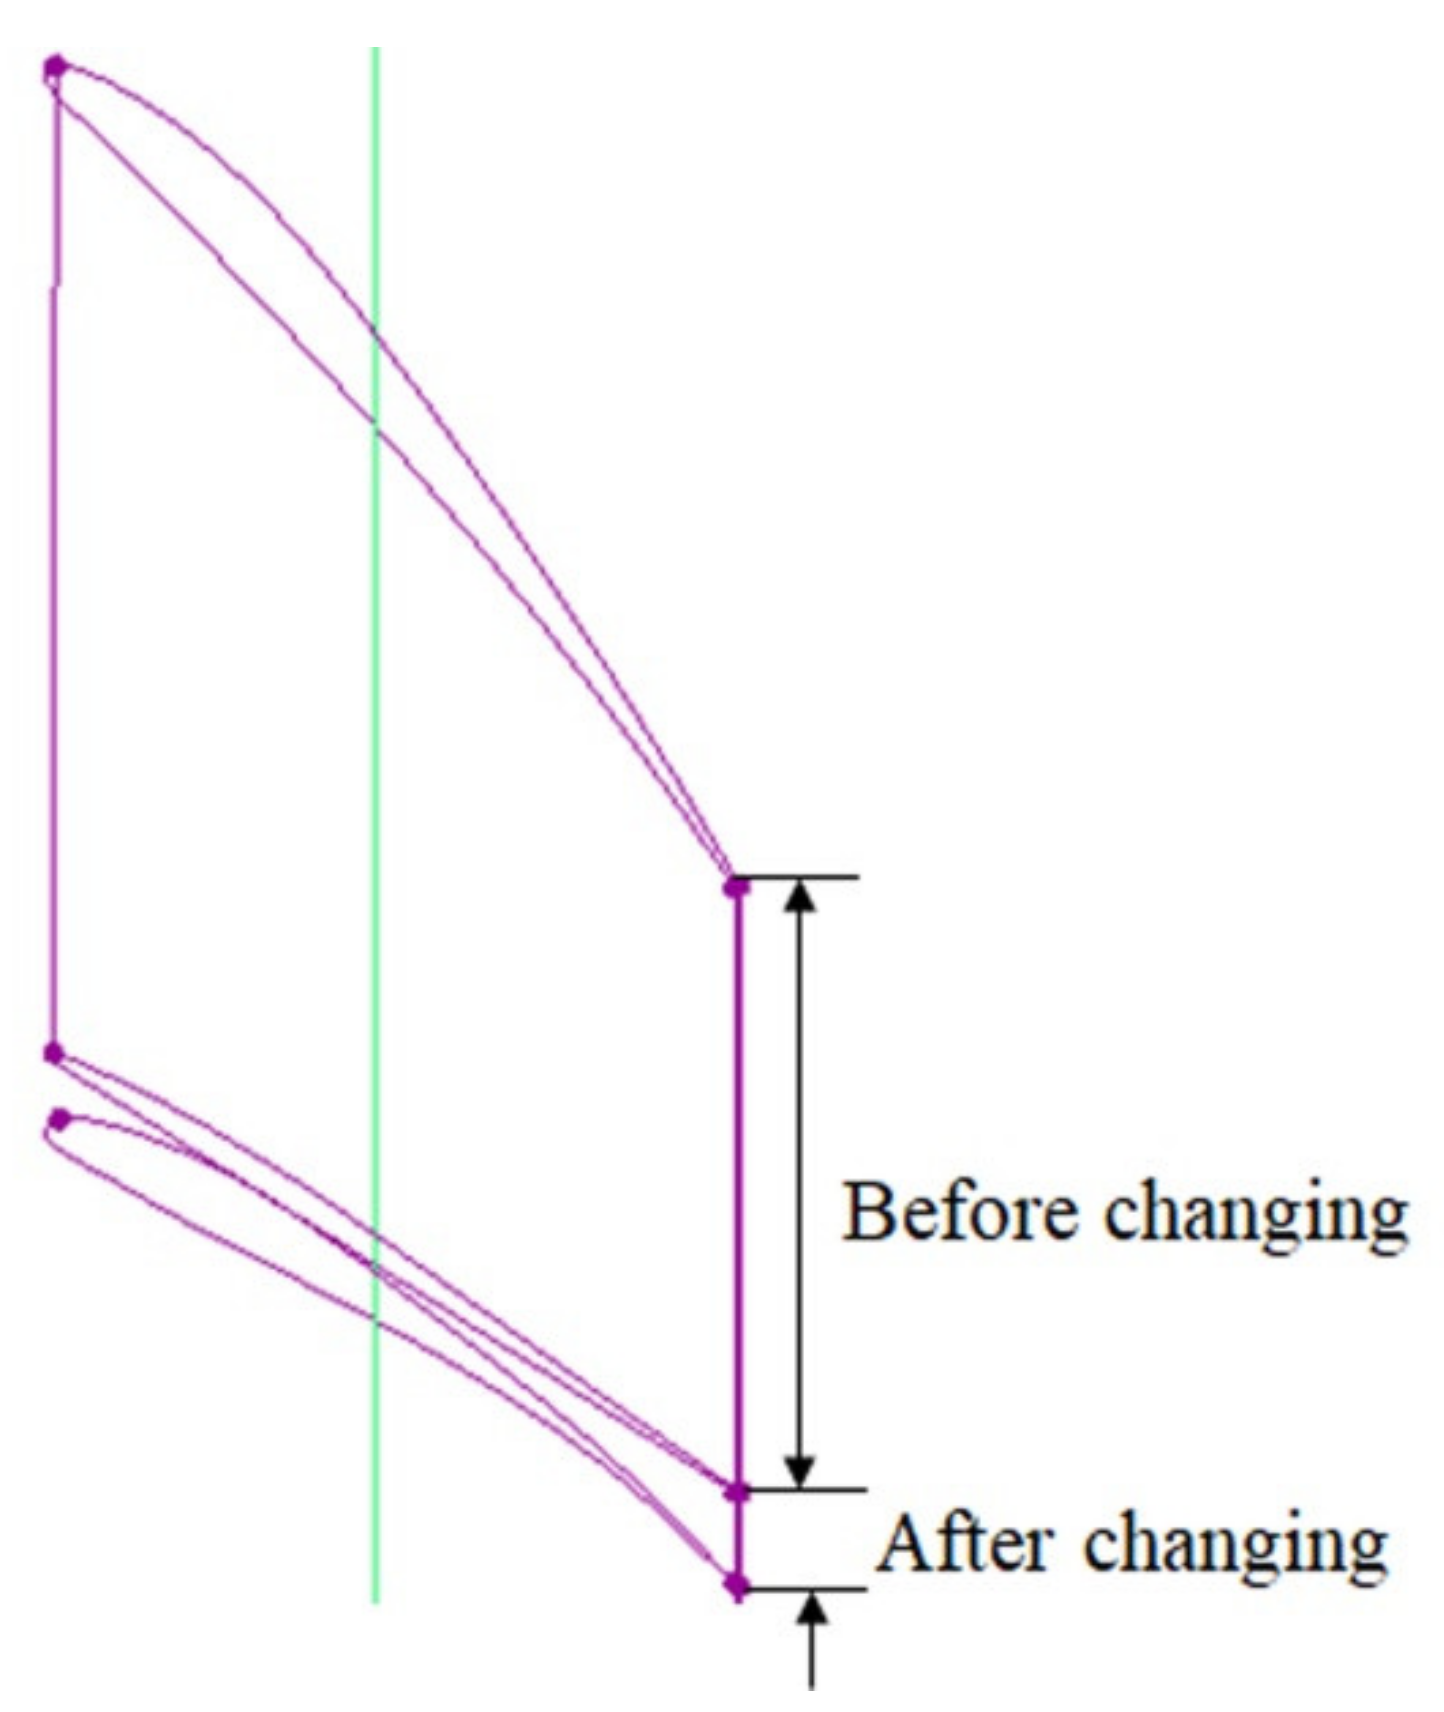
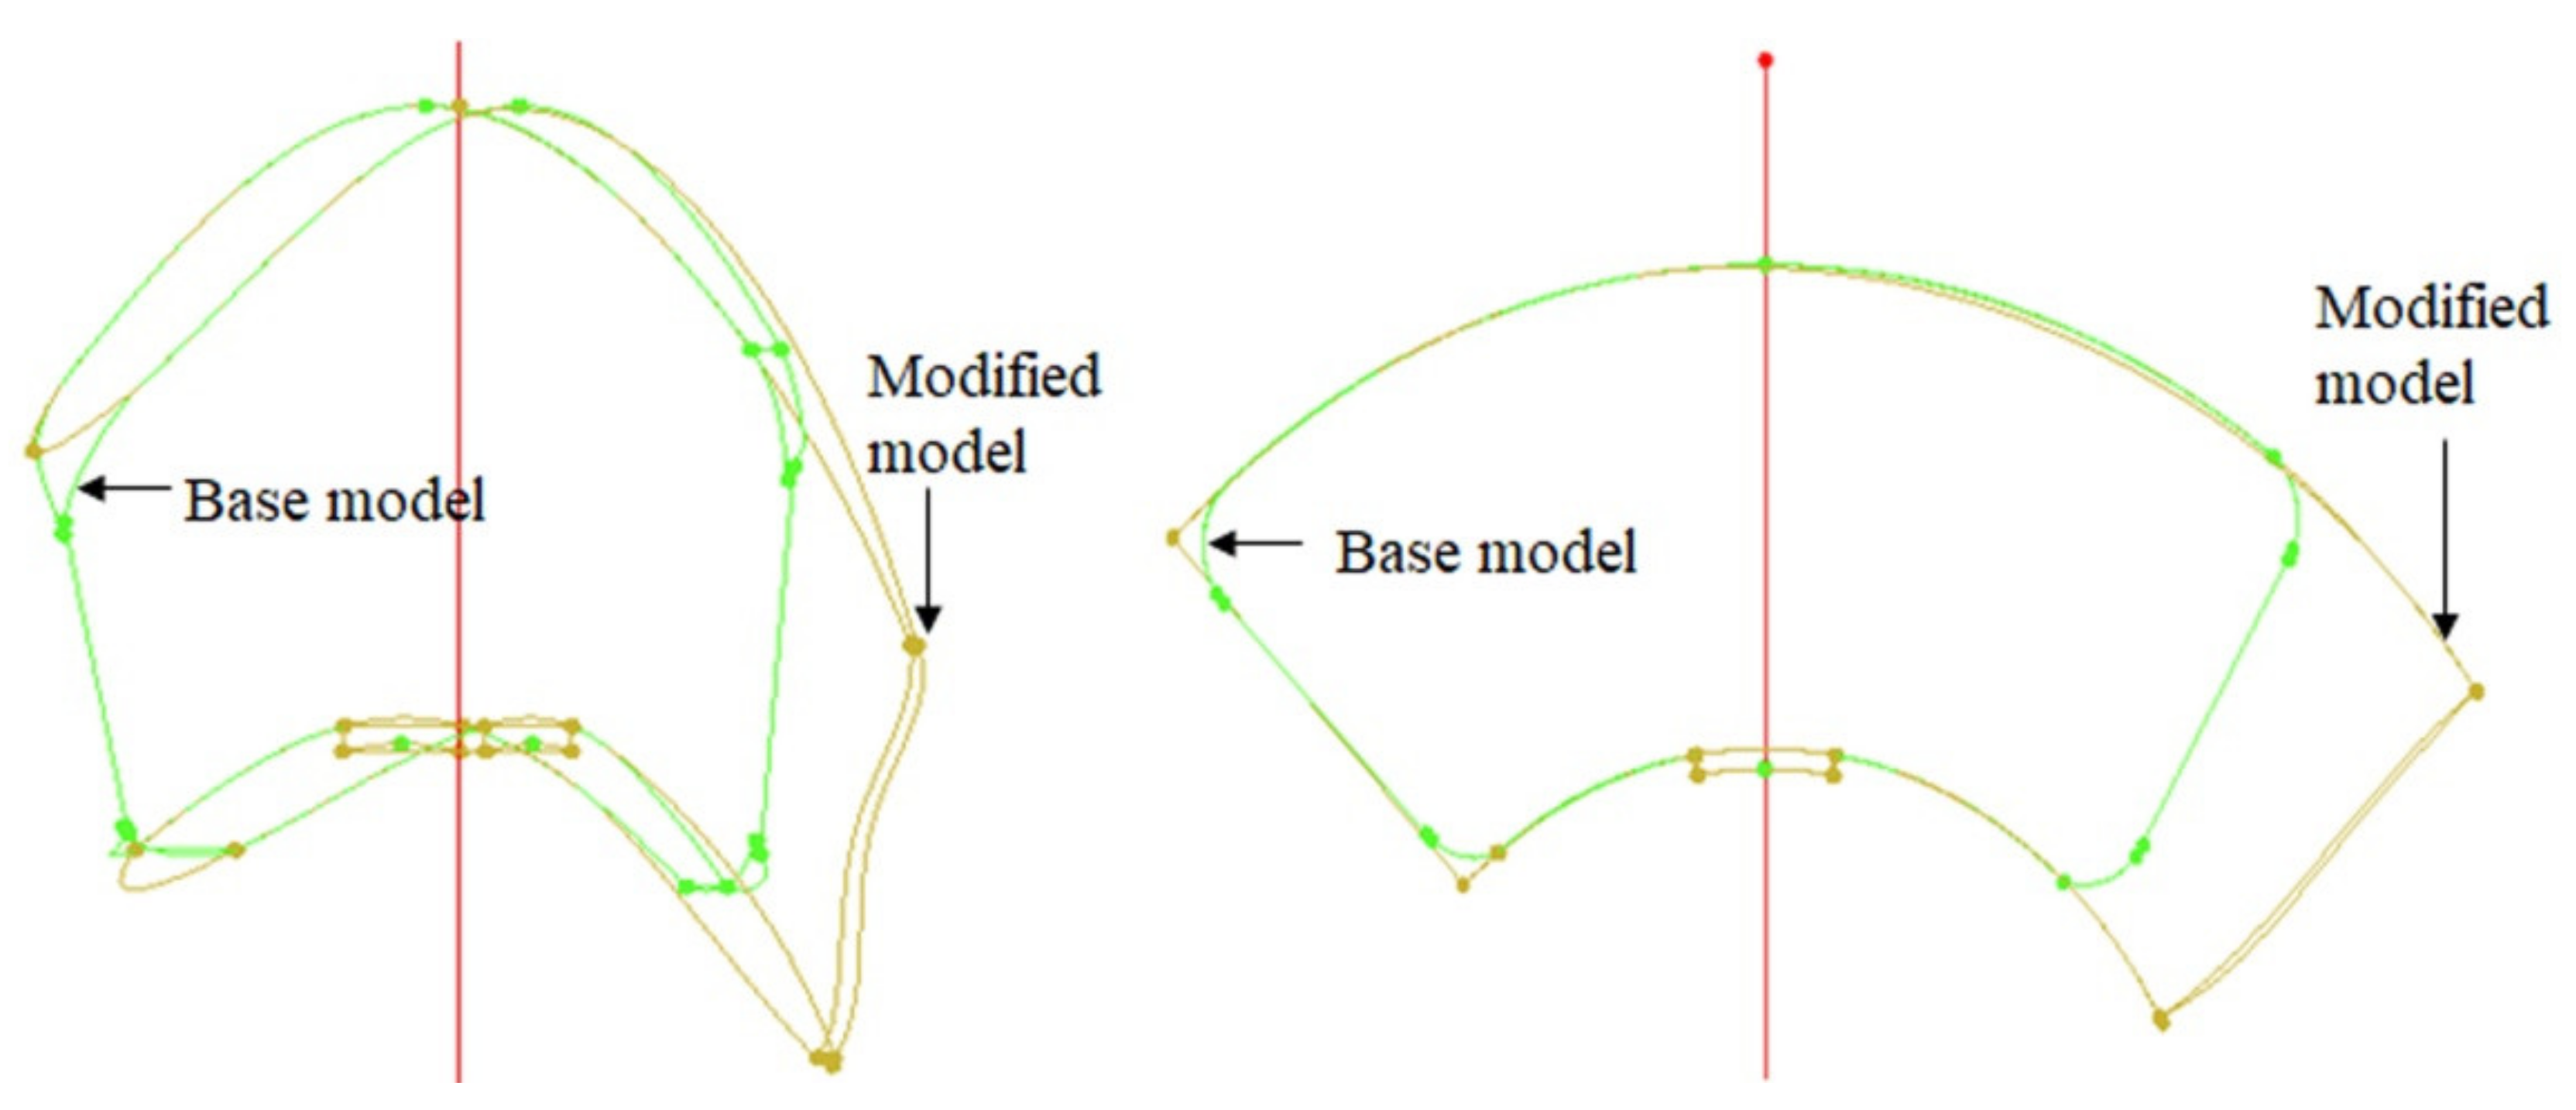
Processes 09 00266 g021
Figure 22. Changing the shape of guide vanes with short chords to make them streamlined.
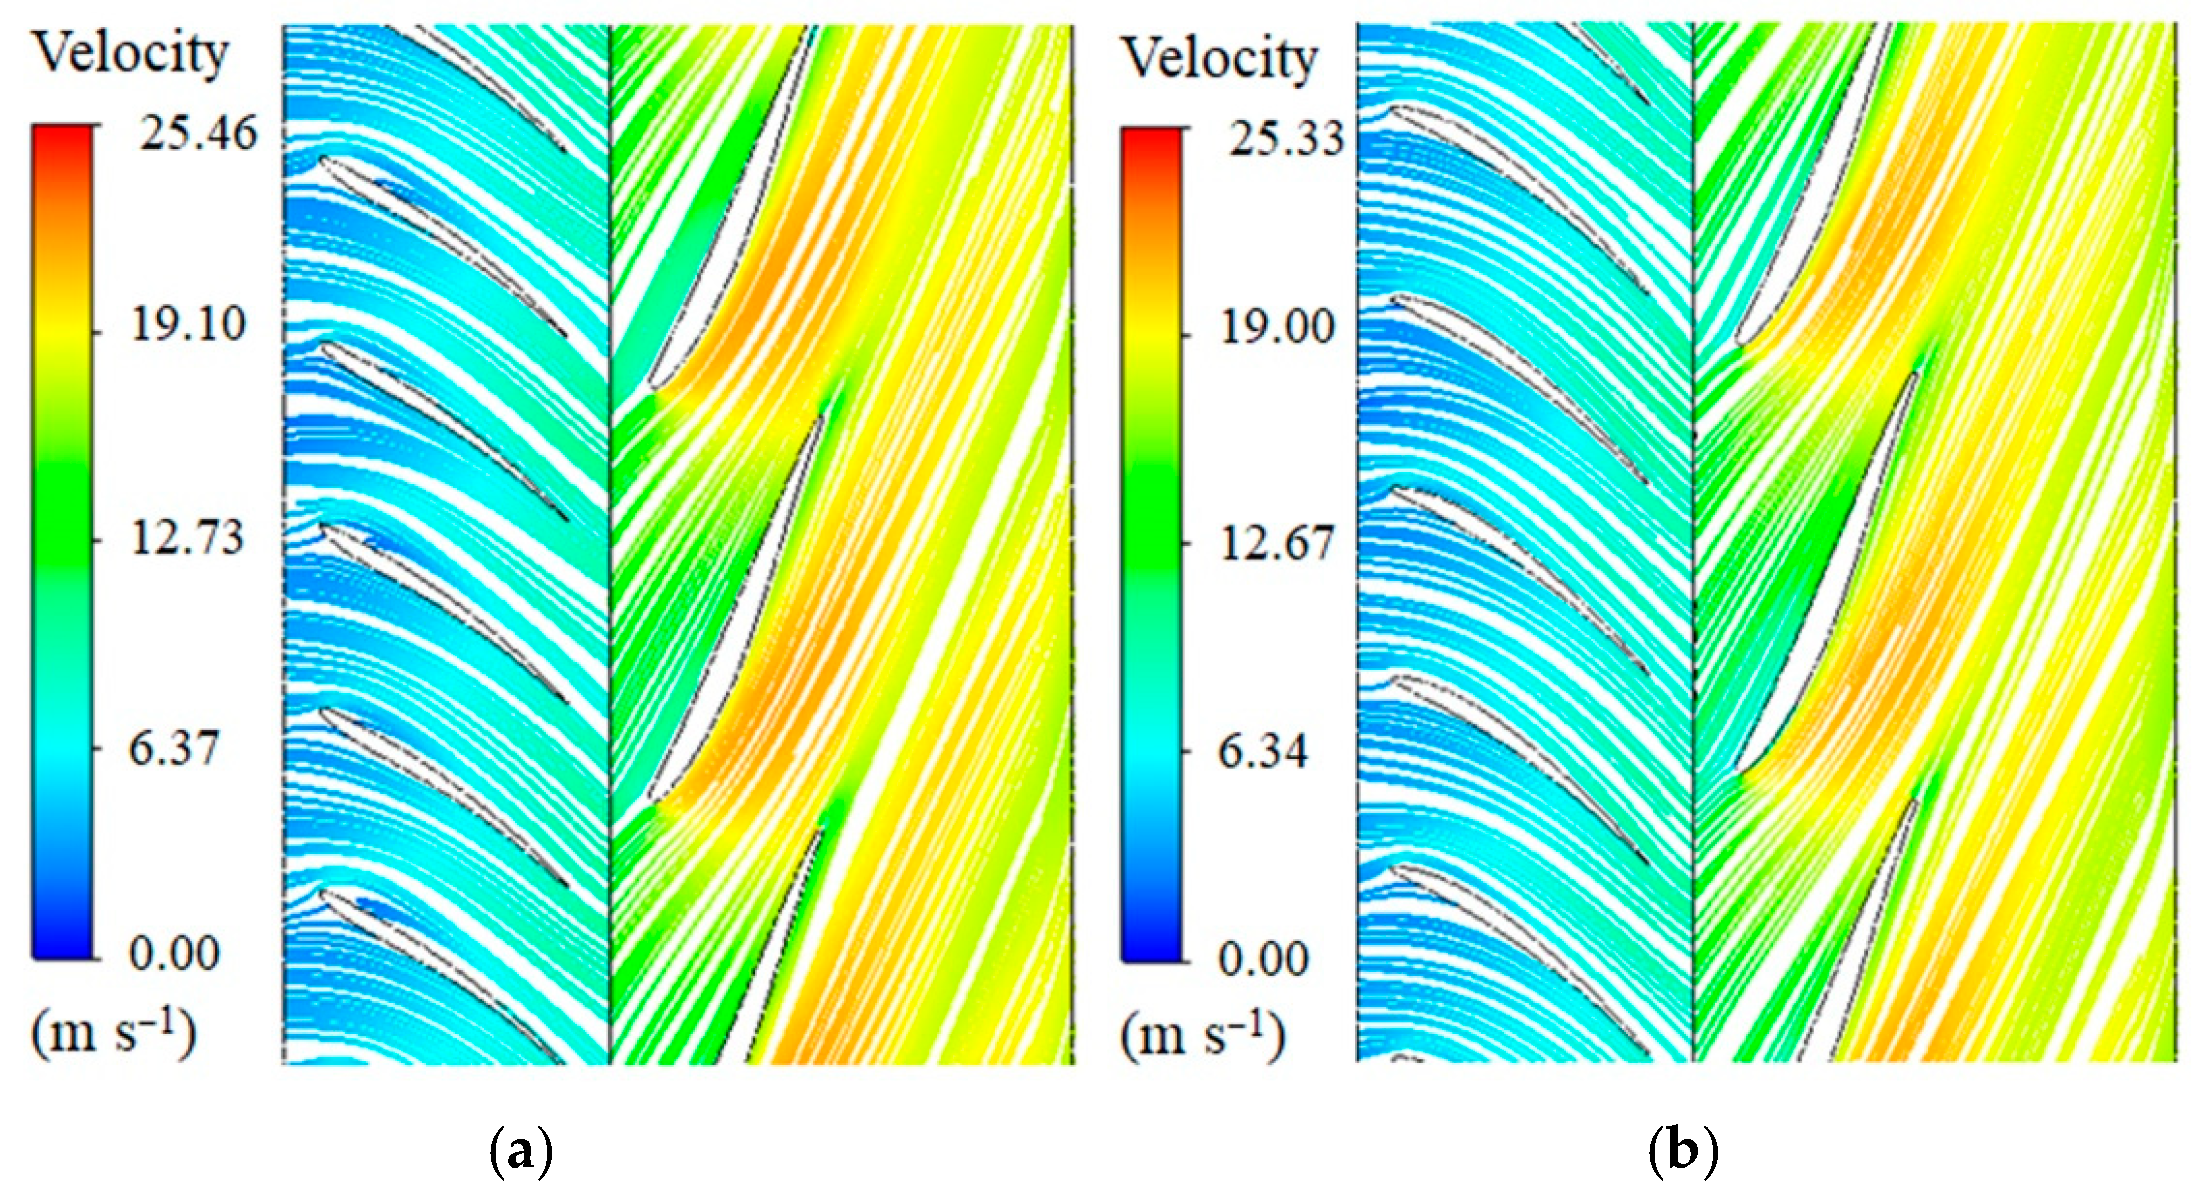
Processes 09 00266 g022
Figure 23. Vane-to-vane streamline distribution of guide vanes and runner vanes: (a) streamline distribution before shape change; (b) streamline distribution after shape change.
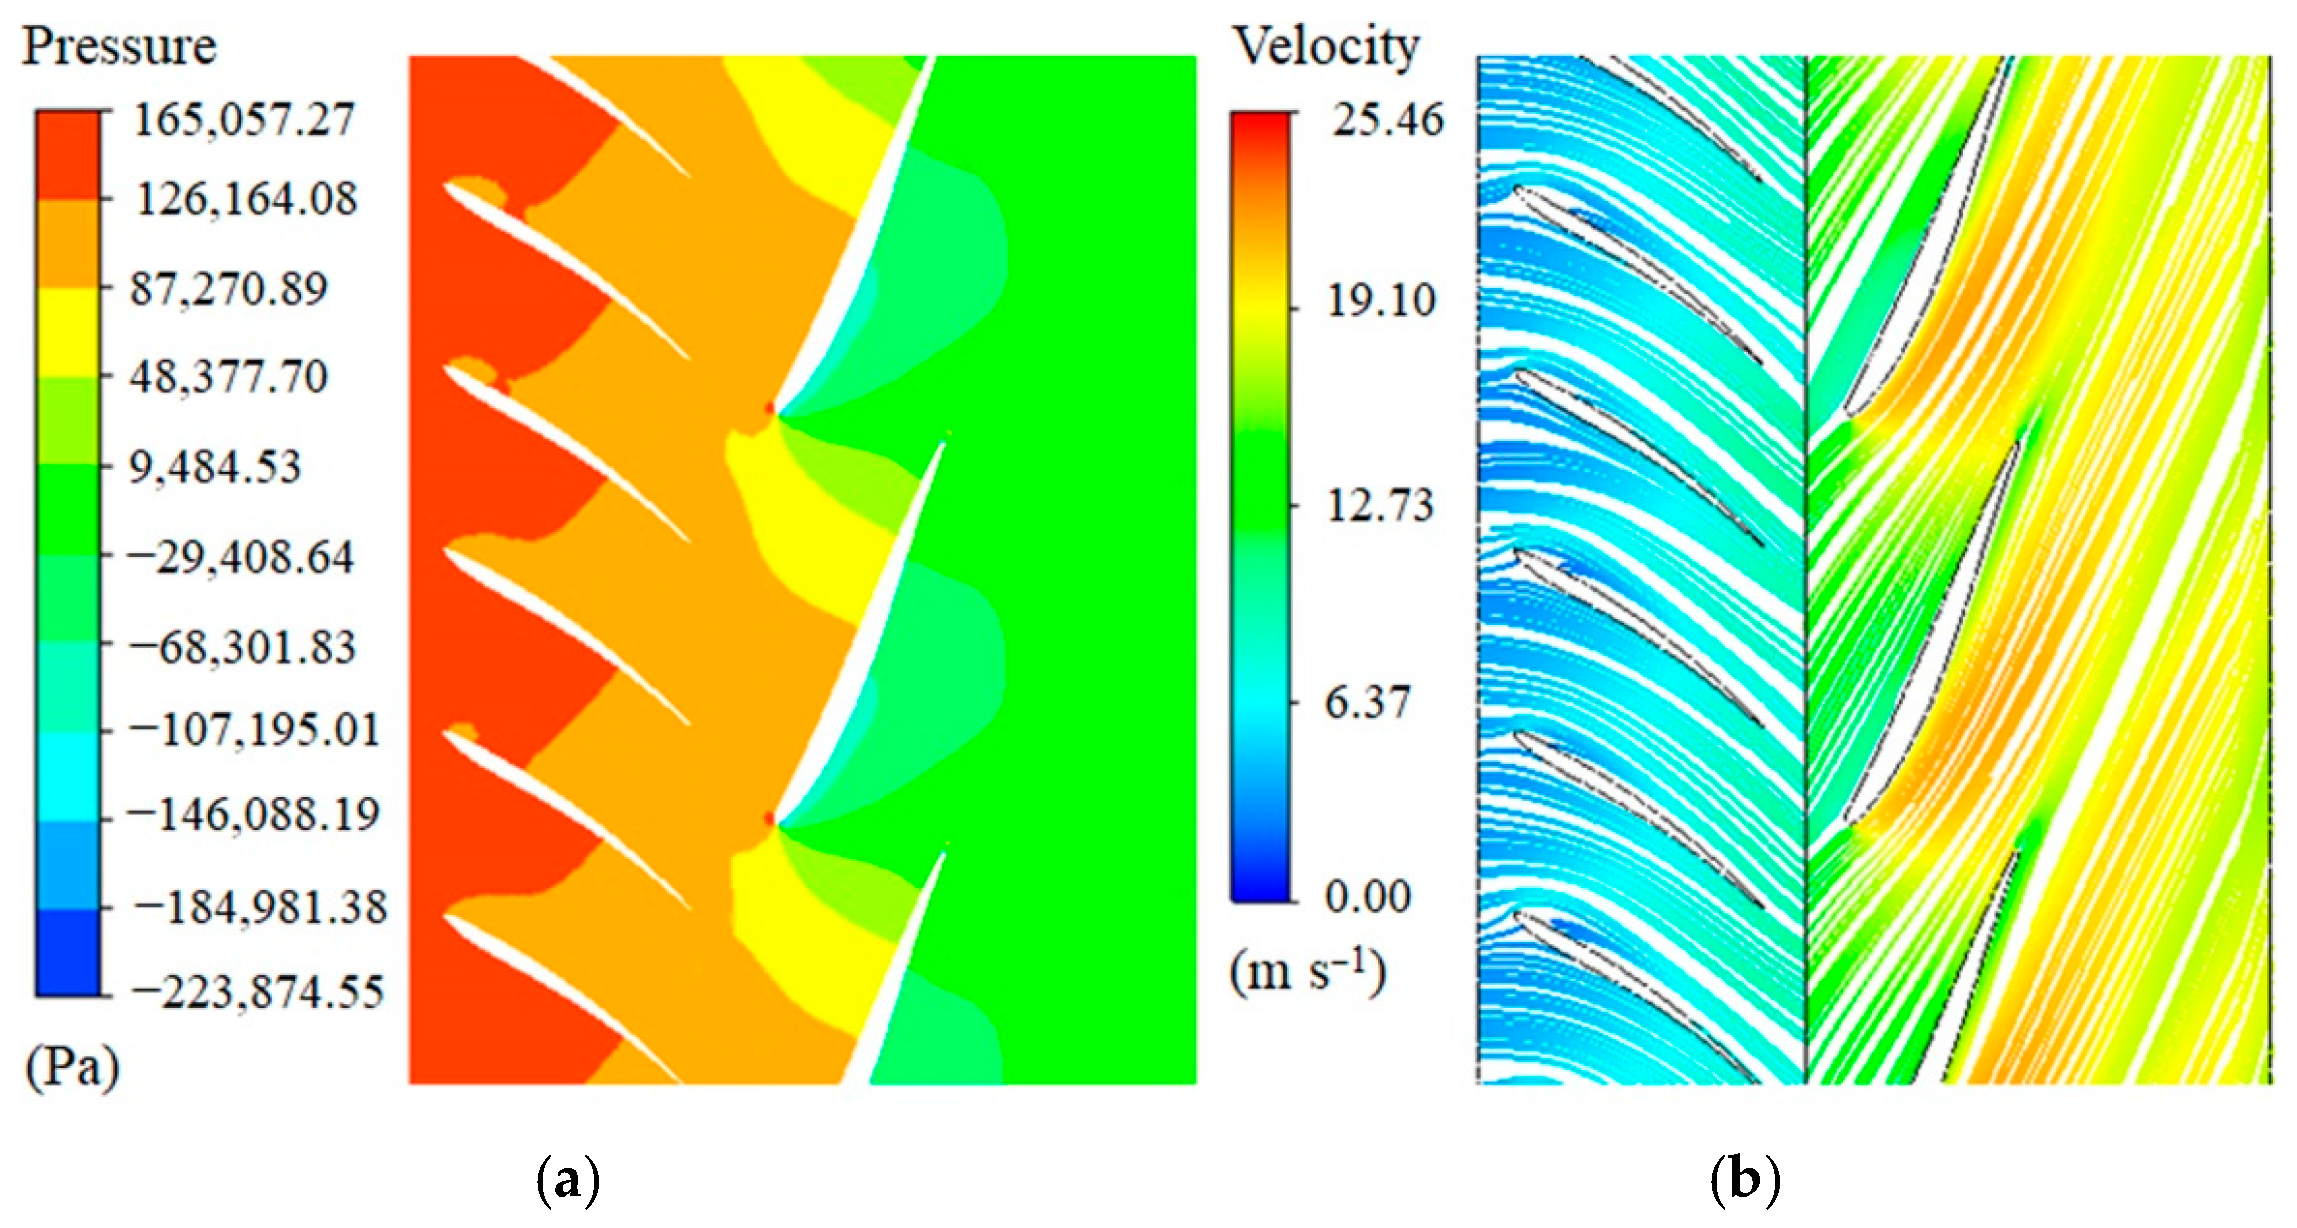
Processes 09 00266 g023
Figure 24. Vane-to-vane pressure and streamline distribution of guide vanes and runner vanes when chords were long: (a) pressure distribution; (b) streamline distribution.
Processes 09 00266 g024
Figure 25. Changing the shape of the runner vane.
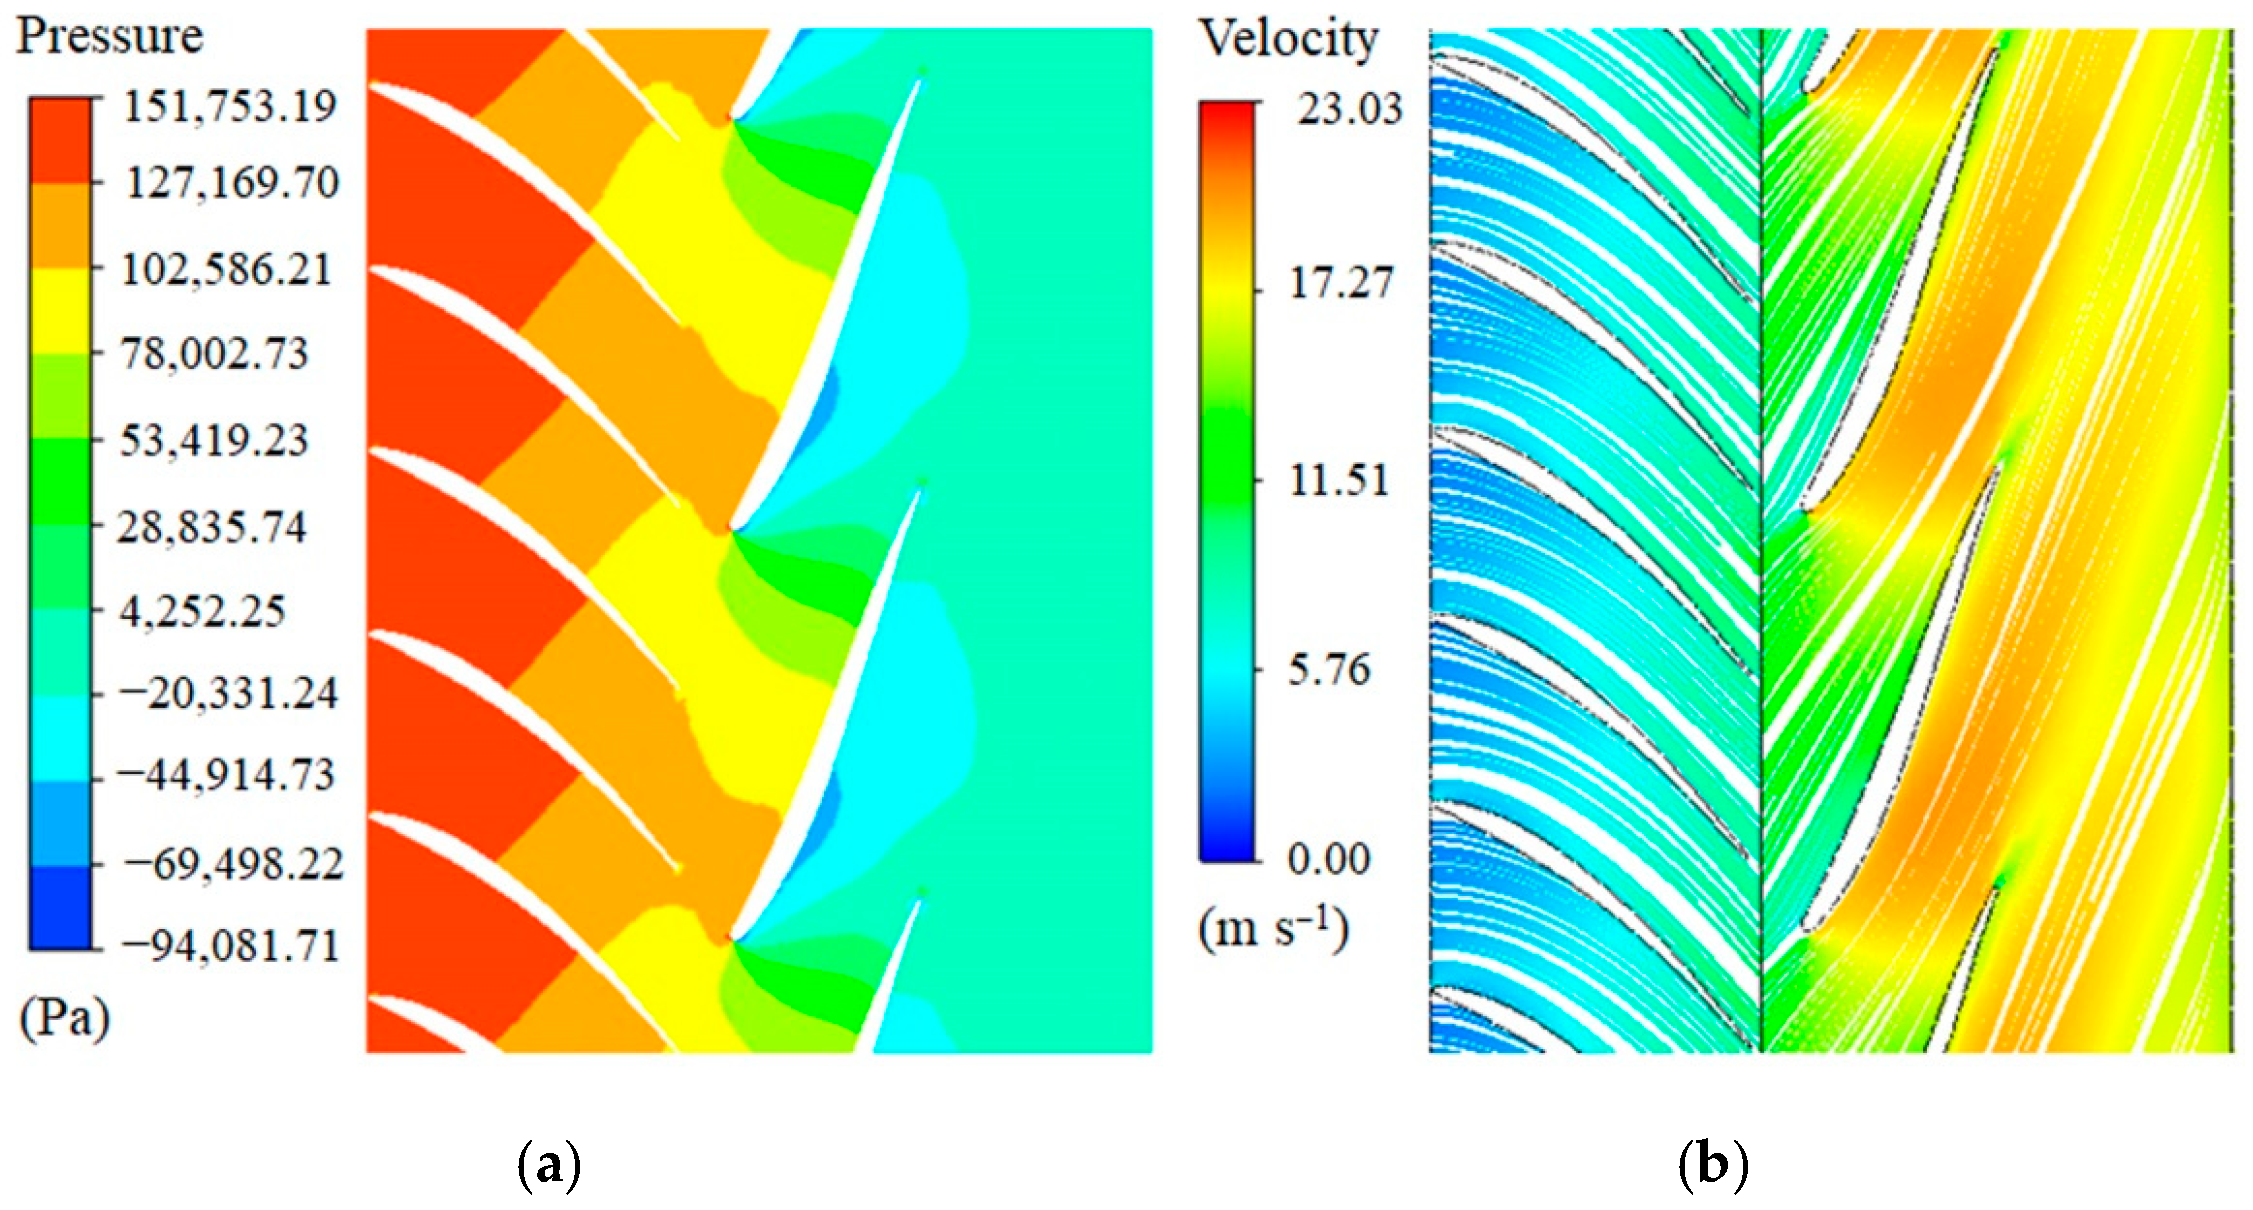
Processes 09 00266 g025
Figure 26. Pressure and streamline distribution between guide vanes and runner vanes: (a) pressure contour after shape change; (b) streamline contour after shape change.
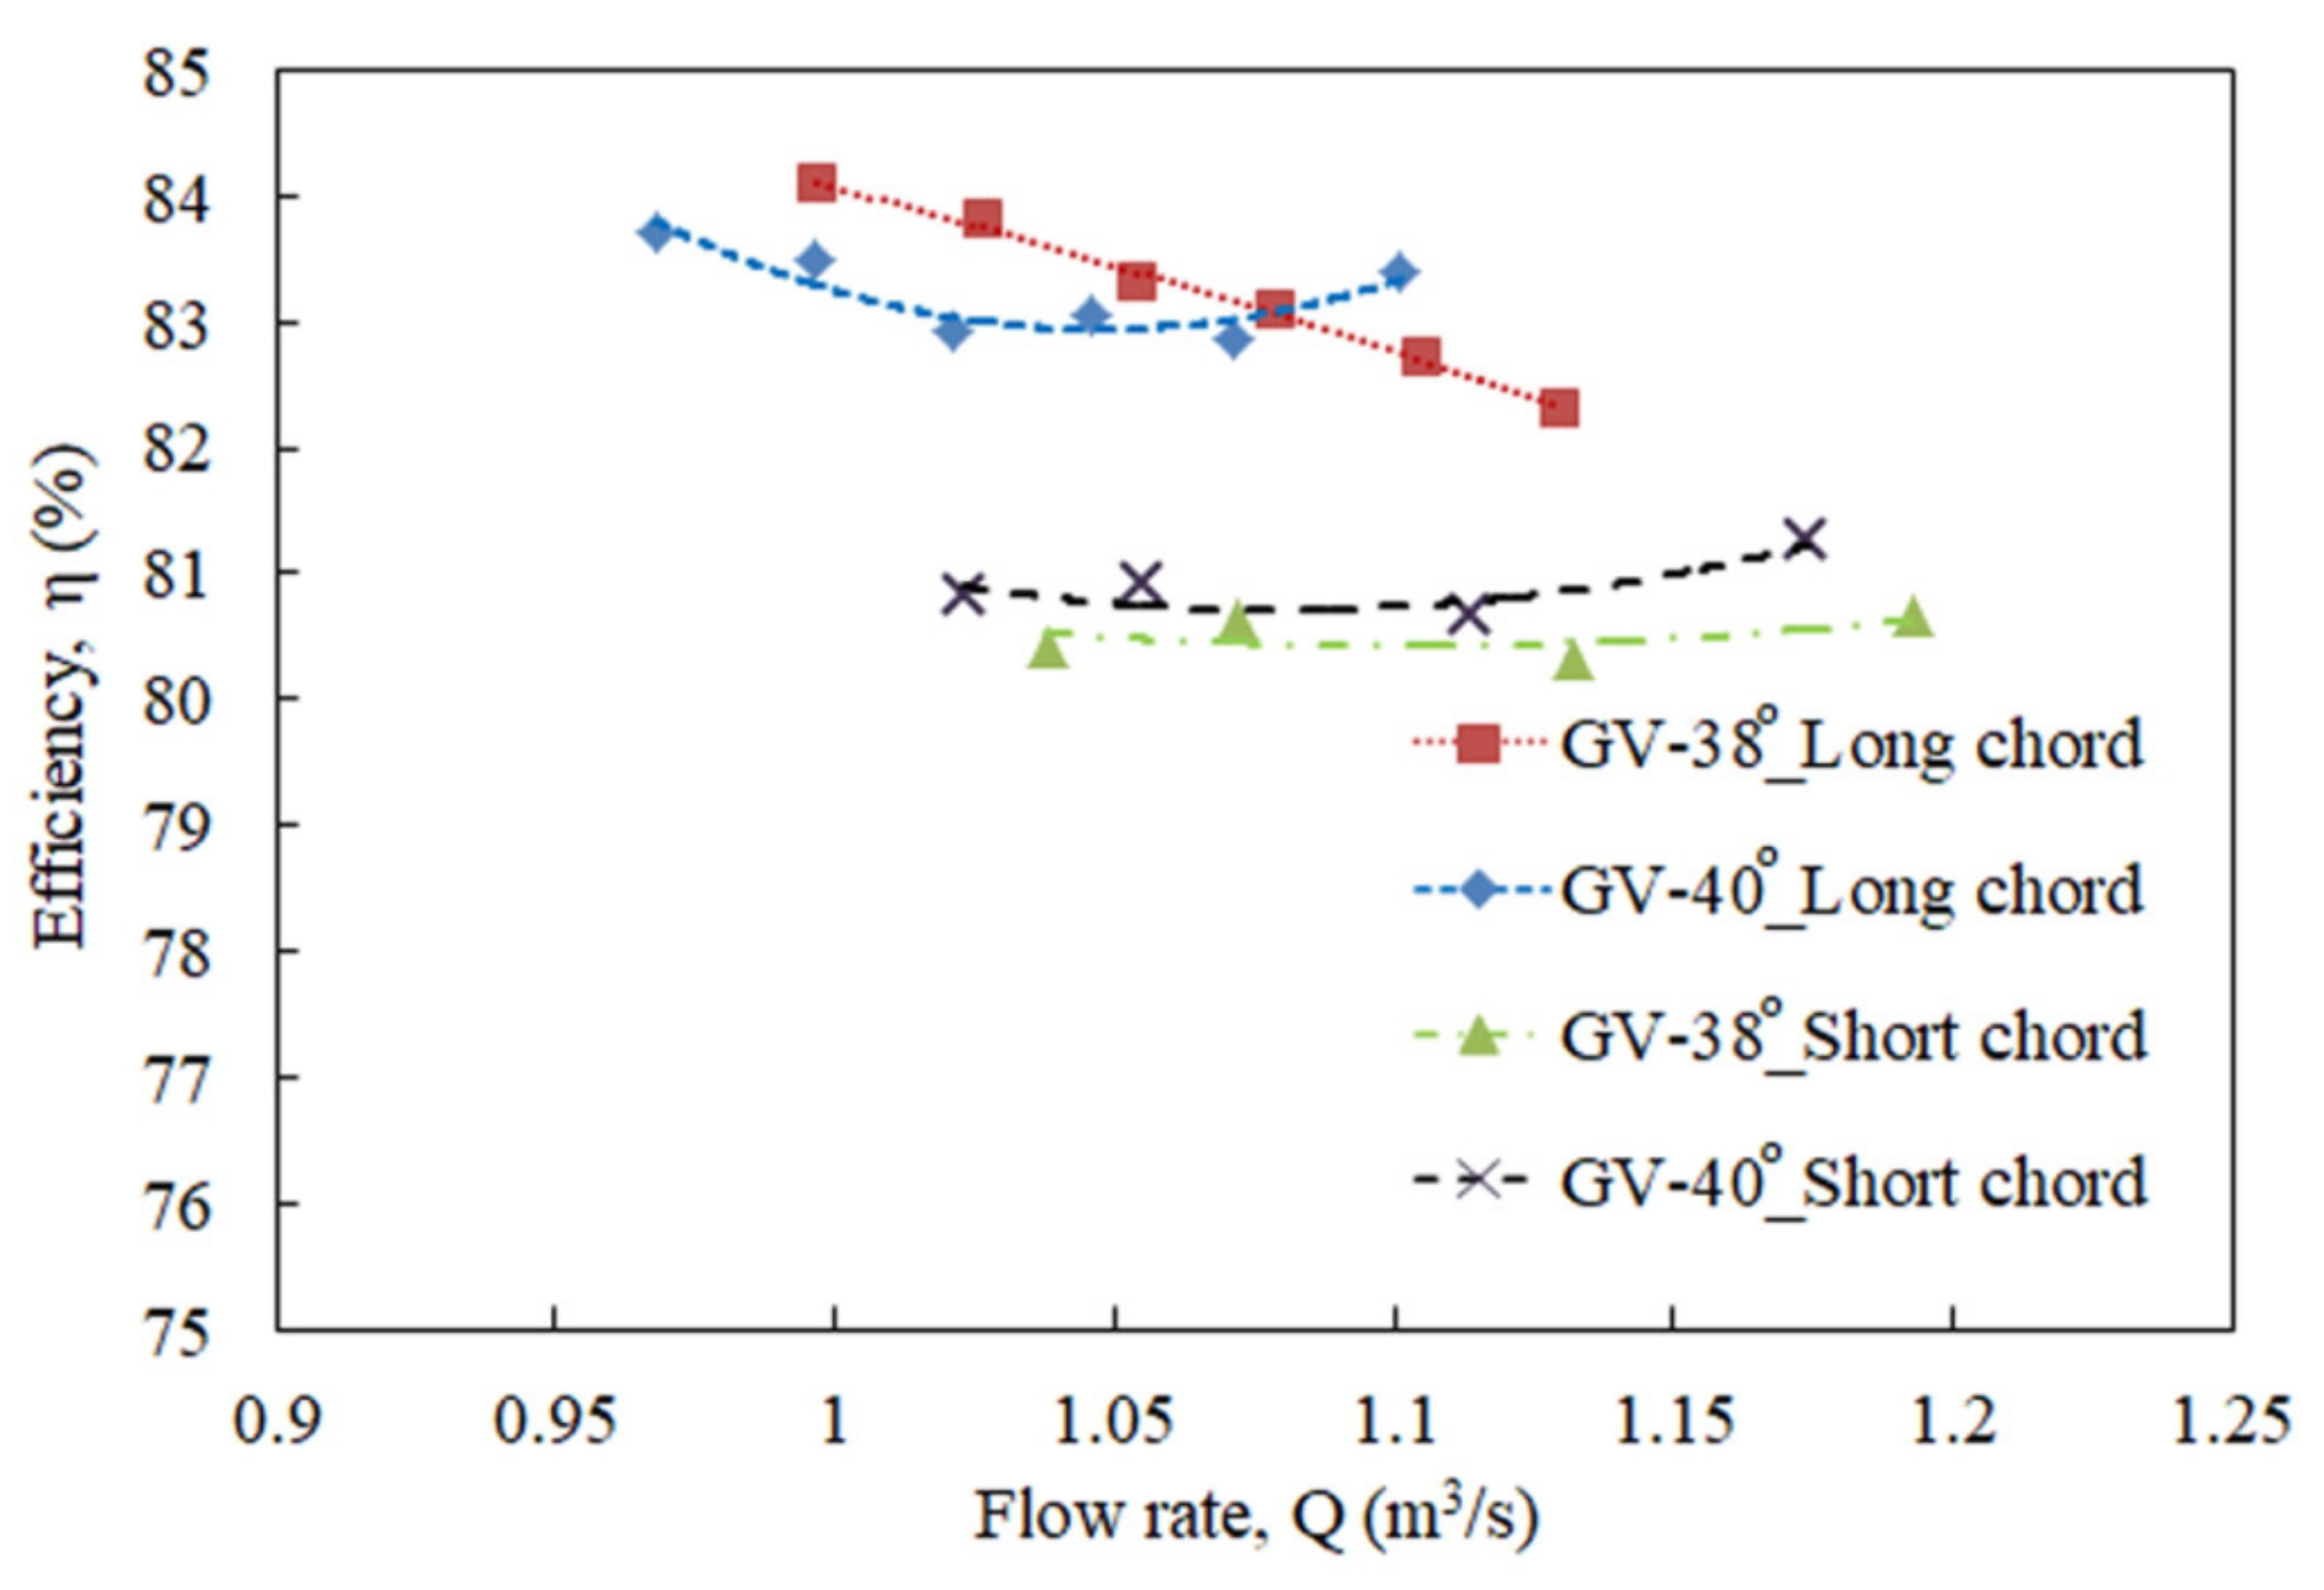
Processes 09 00266 g026
Figure 27. Comparison of efficiency and flow rate according to guide vane opening (RV-19~24°).
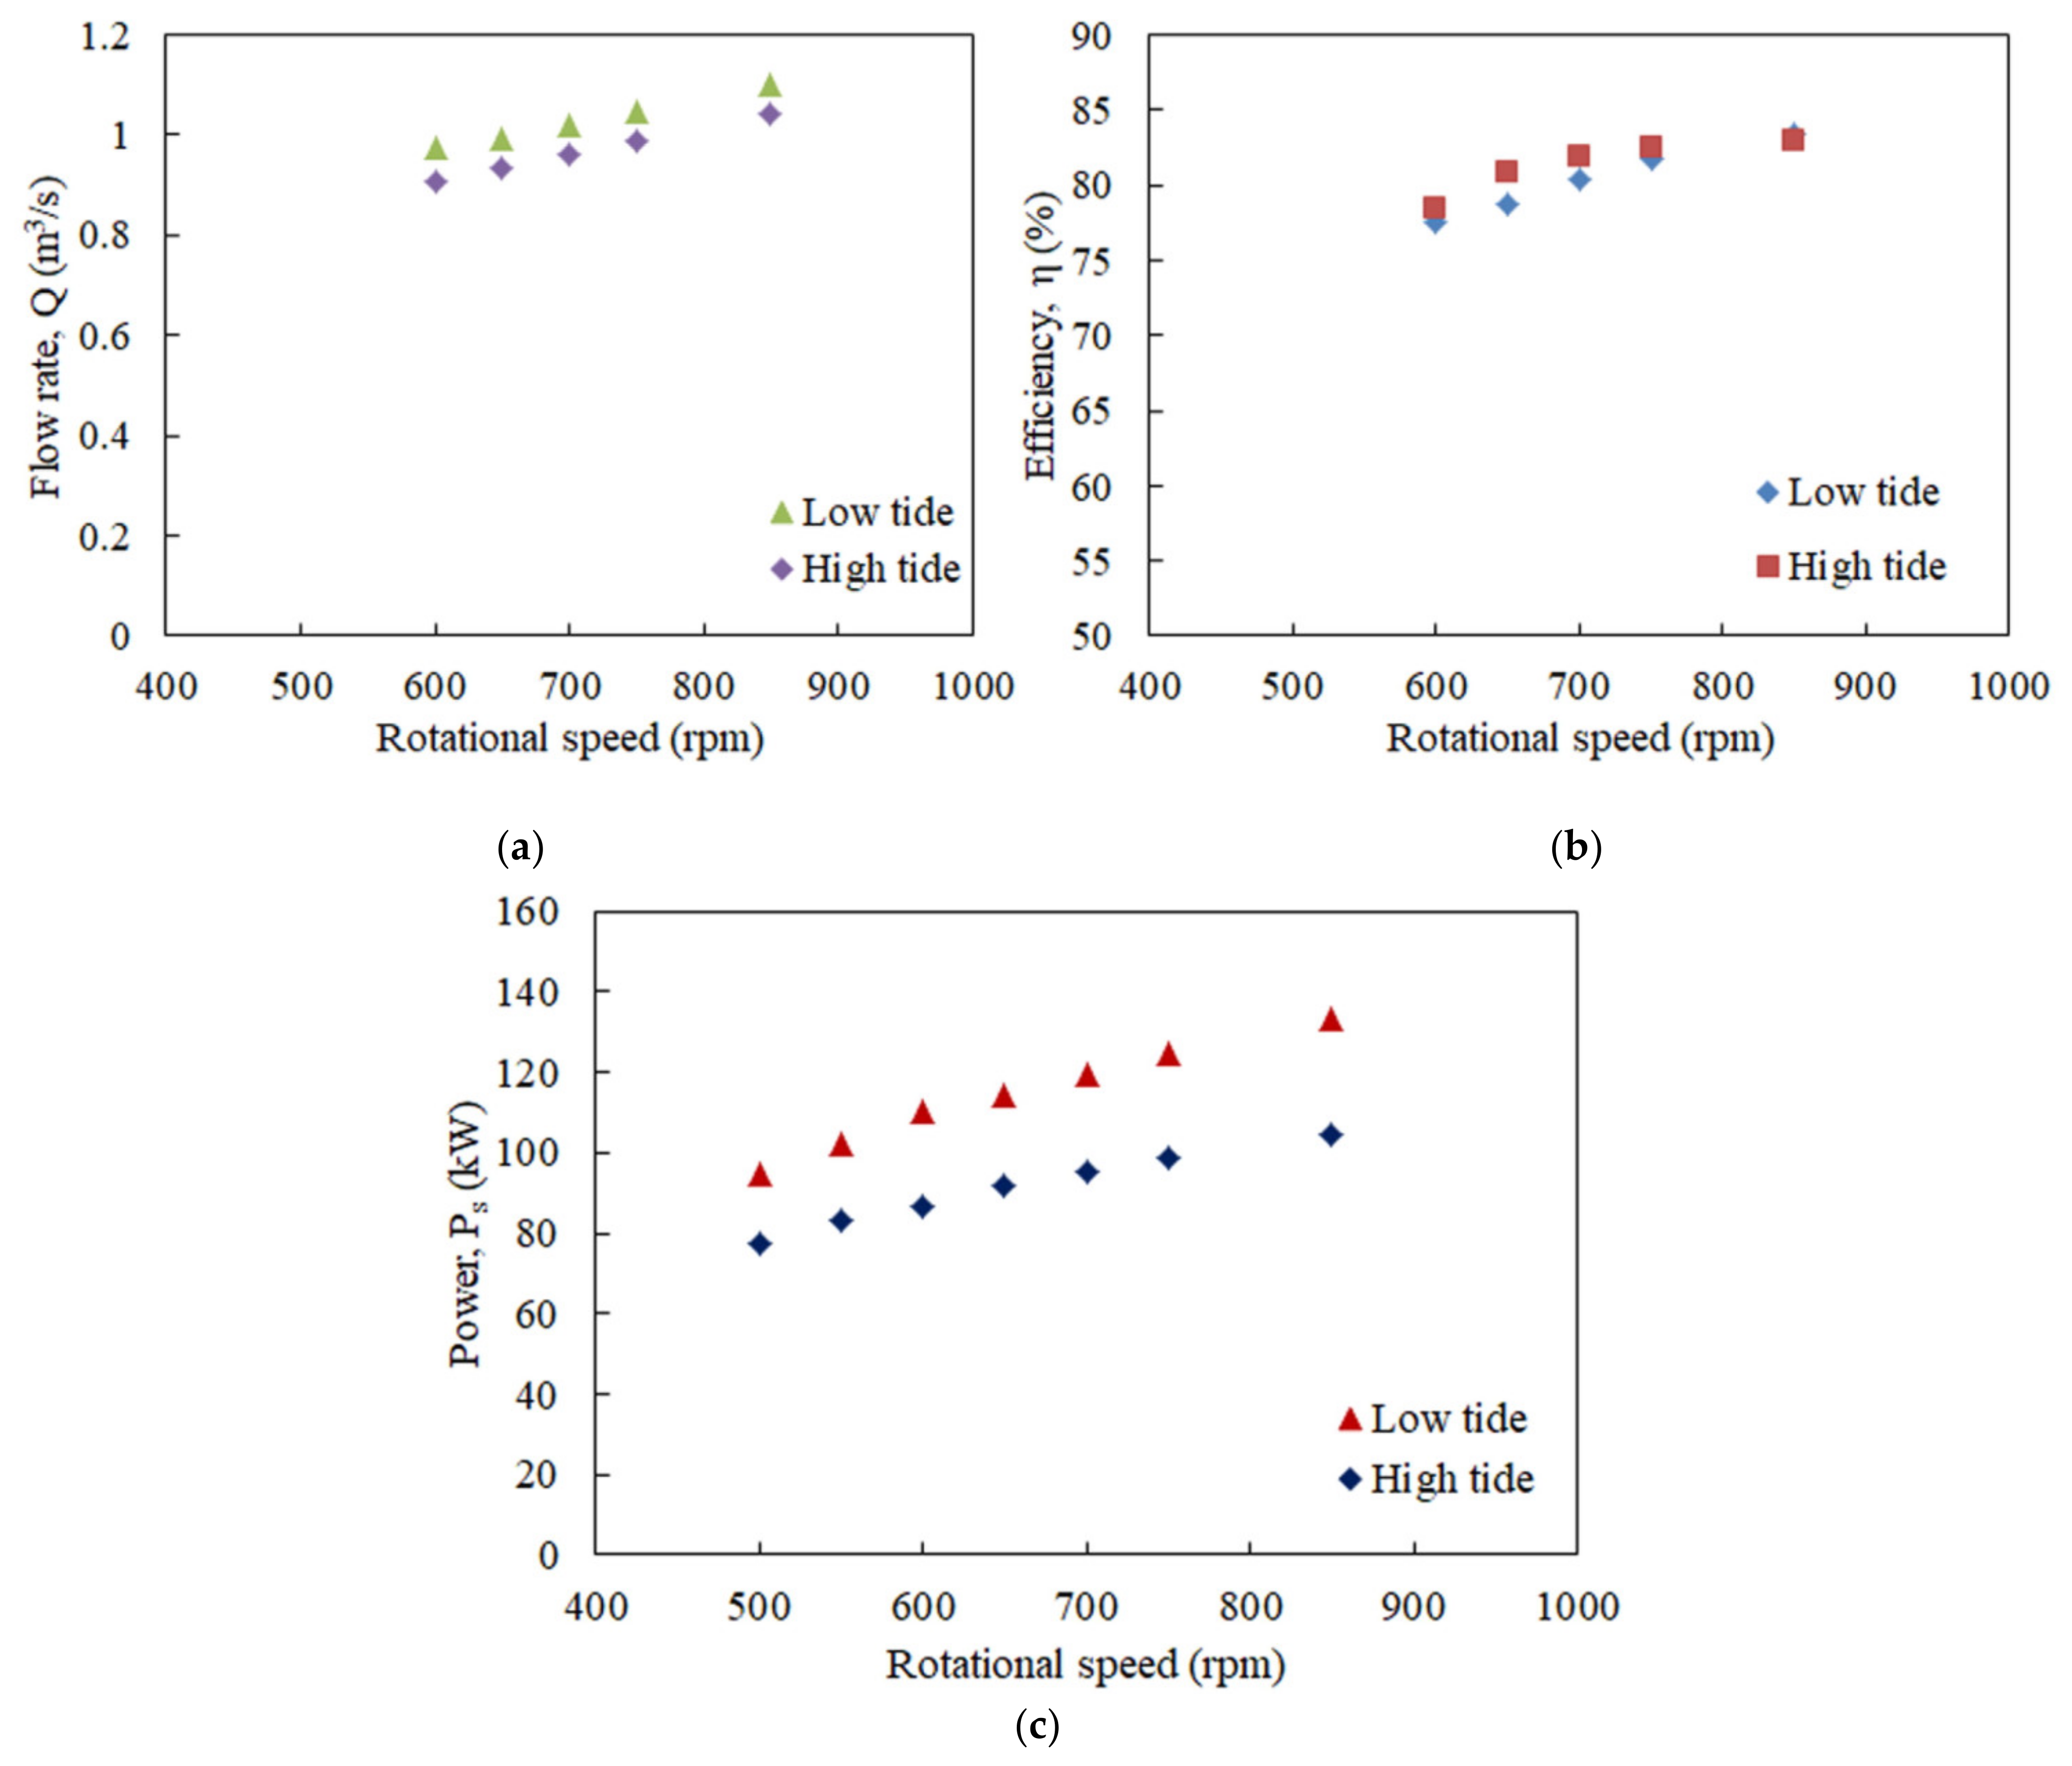
Processes 09 00266 g027
Figure 28. Performance changes according to rotational speed and tidal level: (a) rotational speed versus flow rate; (b) rotational speed versus efficiency; (c) rotational speed versus power.
Processes 09 00266 g028
Table 1. Design specifications of the tubular turbine.
DescriptionDimension
Theoretical head (m)15.00
Flow rate (m3/s)1.13
Max. power (kW)100
Rotational speed (rpm)850
Runner blade4
Guide vane9
Table 2. Main design parameters of the turbine blade.
DescriptionDimension
Runner blade diameter (m)0.50
Runner blade4
Hub diameter (m)0.25
Hub ratio0.50
Table 3. Grid quality of the tubular turbine.
DescriptionElementsNodesMin. Y+Max. Y+
Inlet pipe1,089,171299,3482.6064.85
Guide vane562,824152,0611.41360.67
Runner1,583,989453,3841.25343.16
Draft tube1,066,591287,2541.3385.19
Total4,302,5751,192,047
Table 4. Grid convergence uncertainties in the numerical solutions.
No.NodesGrid Ratio, rEfficiency (%)Error, εaGCI
19120971.3177.740.900431.5896
211920471.2178.440.420701.1502
314389761.0778.110.384073.0851
415468931.1378.410.714193.3582
517404010.9077.850.154141.0281
Table 5. Comparison of experimental and simulation test results of the tubular turbine.
DescriptionRotational Speed (rpm)Head (m)Flow Rate (m3/s)Power (kW)Efficiency (%)
Experimental49613.000.9598.7079.90
Simulation50012.970.9791.4573.43
Error (%)0.8060.2312.1057.3458.097
Table 6. Performance according to guide vane shape (H = 14.84 m).
DescriptionRunner Vane Angle (°)Guide Vane Angle (°)Flow Rate (m3/s)Power (kW)Efficiency (%)
Short chord19401.127126.8477.13
Long chord19401.091123.4777.69
Table 7. Performance of guide vane attached to the generator side (short chord, H = 14.84 m).
DescriptionRunner Vane Angle (°)Guide Vane Angle (°)Flow Rate (m3/s)Power (kW)Efficiency (%)
Before attachment19401.127126.8477.13
After attachment19401.113127.2378.46
Table 8. Performance characteristics according to guide vane shape (short chord, H = 14.84 m).
DescriptionRunner Vane Angle (°)Guide Vane Angle (°)Flow Rate (m3/s)Power (kW)Efficiency (%)
Before change19401.113127.2378.46
After change19401.086123.9178.35
19421.067121.0677.95
19381.110126.6978.67
19451.016115.1677.83
20401.118126.5277.71
Table 9. Performance characteristics according to guide vane shape (long chord, H = 14.84 m).
DescriptionRunner Vane Angle (°)Guide Vane Angle (°)Flow Rate (m3/s)Power (kW)Efficiency (%)
Attached short chord19381.110126.6978.67
Attached long chord19401.011114.5777.84
19381.043118.8078.24
20401.040117.7877.58
20450.966107.4476.38
22401.104124.2277.78
Table 10. Performance characteristics according to runner vane shape (H = 14.84 m).
DescriptionRunner Vane Angle (°)Guide Vane Angle (°)Flow Rate (m3/s)Water Power (kW)Power (kW)Efficiency (%)
Compact shape19401.011147.20114.5777.84
Expanded shape19400.966140.55116.5382.91
24401.101159.96133.4383.41
24381.131164.50135.3782.31
Table 11. Performance characteristics according to runner vane rotation speed (H = 14.84 m, GV-40°).
Rotational Speed (rpm)Runner Vane Angle (°)Flow Rate (m3/s)Power (kW)Efficiency (%)
850241.101133.4383.41
750241.046124.4681.77
700241.019119.2980.37
650240.994114.0378.75
650230.975113.0879.61
650271.076123.8479.02
Publisher’s Note: MDPI stays neutral with regard to jurisdictional claims in published maps and institutional affiliations.

