Article

Theoretical and Empirical Analysis of the Influence of Technology Gap on Carbon Emission: The Case of China

1
School of Economics, Zhongnan University of Economics and Law, Wuhan 430072, China
2
School of Computer Science, Wuhan Vocational College of Software and Engineering, Wuhan 430205, China
3
School of Economics & Trade, Guangdong University of Finance, Guangzhou 510521, China
*
Author to whom correspondence should be addressed.
Processes 2021, 9(11), 2013; https://doi.org/10.3390/pr9112013
Submission received: 6 August 2021 / Revised: 28 October 2021 / Accepted: 30 October 2021 / Published: 11 November 2021
(This article belongs to the Topic Sustainable Energy Technology)

Abstract

:
Numerous studies have examined the relationship between technological development and pollution. From a global economic perspective, the narrowing of one country’s technological gap relative to the world technology frontier (due to the technological progress) may affect its environmental pollution. However, few studies have focused on this issue. This study examined the relationship between technology gap and air pollution both theoretically and empirically. The theoretical model shows that narrowing the technology gap may help reduce pollution. Using patent data from USPTO, as well as industrial level pollution and socio-economic data in China, this paper found that the narrowing of technology gap plays a role in reducing air pollution emissions in China, which confirms the theoretical model. This study provides a new perspective on the relationship between technology progress and pollution.

1. Introduction

Researchers have conducted numerous studies on technology and pollution, especially on their relationship. Some studies show that technological progress can improve environmental quality by reducing energy use, changing consumption patterns, and developing cleaner and more efficient production technologies [1]. Other studies emphasize that technological progress cannot replace the use of natural resources. Additionally, technological progress can promote economic growth while increasing energy use and pollution emissions [2,3]. Therefore, technological progress has the potential to both improve environmental quality and increase potential environmental risks [4,5]. However, these discussions are limited to the absolute level of technological progress, and no consensus has been reached on whether technological progress increases or decreases pollution.
Research on the four common air pollutants shows that between 1972 and 2002, the real value of manufacturing output increased by 70% while the air pollution released by manufacturers reduced by 60% in the United States [6]. The decline in manufacturing pollution was predominantly due to technological innovation, while a small share of the decline comes from changes in the composition of the manufacturing industry. This raises the question: Do technological progress and changes in the composition of the manufacturing industry reduce pollution in other countries? This study compares the growth rates of technological progress, which is measured by the number of residents’ patent applications over the years and carbon emissions between China and the United States using the data from the World Development Indicators (WDI) database in Figure 1.
From the left part of Figure 1, we can see that China has a higher growth rate in patent applications than the United States. Patent applications are widely used as a proxy variable for technological progress. China may have had more technological progress between 1985 and 2013. If China’s development is similar to that of the United States, technological progress will play a major role in reducing pollution, and therefore the growth rate of carbon emissions in China will likely be lower than that of the United States. However, the right part of Figure 1 suggests something different. Technological progress may play a different role in the reduction of carbon emissions in different countries due to limited analysis of the absolute level of technological progress.
In an open economy, technological progress has two meanings, absolute level and relative technology progress [7]. The relative technology progress is the distance between the country’s technology and the world technology frontier, which means technology gap. The world’s technological frontier refers to the most technologically advanced economy among the economies participating in trade in the world. A narrower technology gap indicates a stronger comparative advantage at the technical level—it can improve the position of the economy in the international economy [8], make the country responsible for cleaner production, and indirectly affect the environment of the economy. This idea is linked to research on international trade and environmental pollution.
The technology gap is a factor that affects international trade. The research on technology gap was first proposed by Posner in 1961 [9]. In this paper, he discussed the relationship between technology gap and trade. The existence of technological gaps between different countries can enable the technologically leading countries to have a comparative advantage in exporting technology-intensive products and monopolize exports for a period of time. At the same time, due to the demonstrative effect of technology spillover, technology is gradually imitated and mastered by importing countries, which in turn causes the technological gap to converge, the comparative advantage gradually disappears, and the international trade based on the technological gap also disappears. To sum up, the technological gap will affect a country’s international trade [10], technological progress, and other key factors that affect pollution caused by production activities. Therefore, at least from the indirect mechanism, the technology gap affects pollution. However, few studies have focused on this issue.
The relative speed of technological progress in various countries determines the technology gap of countries, which largely determines the international division of labor. If technology in an economy develops but the world technological frontier advances faster, then the decrease in pollution caused by this technological progress may be offset by the pollution transfer caused by the weakening of the international industrial competitiveness of the economy. Therefore, under the conditions of an open economy, the technological progress of an economy not only affects the environment through a series of domestic mechanisms but also leads to changes in the technology gap between the economy and the world technology frontier. This, in turn, changes the international division of labor, indirectly affecting the environment of the economy through international trade and investment.
In international trade, the United States is already near the world’s technology frontier and in a high-end position in the international division of labor. It is responsible for high-end production, and this type of production emits less pollution. The status of the international division of labor brought by the technological progress of the United States has not changed much. Therefore, the changes in its technological progress are mainly to reduce pollution through improved production technology, rather than to affect pollution through changes in international trade [6]. However, non-frontier countries have different characteristics. For instance, China’s technological progress is rapid, promoting economic growth, which, in turn, increases pollution. However, prior studies have shown that technological gaps affect CO2 emissions. In terms of the relationship between technological progress and environmental pollution, countries cannot focus only on their technological progress; they must also account for their relative distance to the world technology frontier and speed of technological progress. Thus, if China’s technological progress is fast enough to narrow the gap between its own and the world’s frontier technological level, we define it as a technology gap, and it may change China’s manufacturing industry composition and reduce pollution.
Therefore, when studying the relationship between technology and pollution, it is not enough to explore the effect of the absolute level of technological progress on pollution. Attention must be paid to technological progress at the relative level, that is, the technology gap to the world frontier. However, existing studies have rarely considered whether changes in the technology gap affect pollution. This study attempts to distinguish the effects of technological gaps and absolute-level technological progress on carbon emissions, providing a new perspective for narrowing the technological gaps and reducing pollution.
This study aims to figure out whether the narrowing of technological gap caused by technological progress reduces air pollution and its potential mechanisms. First, on the basis of the Schumpeter growth model, we built a theoretical model to analyze the impact of the technology gap and technology progress on environmental pollution. Second, we examined the theoretical model by using industry level data in China, a good and representable sample to examine the impact of technological gap on air pollution empirically. The results show that technology gap due to technology progress reduces air pollution in Chia. Third, we further discuss the potential mechanisms and find that industrial comparative advantage plays a role.
The contributions of this paper lie in the following two areas. On the one hand, when the relationship between technology and pollution is studied, it is not enough to explore the effect of the absolute level of technological progress on pollution. Attention must be paid to technological progress at the relative level, that is, the technology gap to the world frontier. Few studies have considered whether changes in the technology gap affect pollution. Hence, this paper fills this gap by attempting to distinguish the effects of technological gaps and absolute-level technological progress on carbon emissions, both theoretically and empirically, providing a new perspective for narrowing the technological gaps and reducing pollution. On the other, this paper further discusses how the narrowing of technology gap alleviates air pollution from the industrial comparative advantage perspective, which contributes to the literature about how technology progress affects the environment.

2. Literature Review

Prior research has provided ample evidence on the relationship between technological progress and environmental pollution. This section reviews the literature on technology progress, technology gaps, and carbon emissions. The basic consensus is that technological progress can directly and indirectly affect carbon emissions. Regarding the direct mechanism of this effect, technological progress has been found to improve energy efficiency and production methods, as well as decrease the use of polluting resources to reduce carbon emissions. Levinson [6] showed that technological progress in the United States has had a significant impact on carbon emissions. Acemoglu et al. [3] found that the initial type of technology determines whether technological progress plays a role in increasing or decreasing emissions. For instance, technological progress in the cleaning sector that uses clean inputs will reduce carbon emissions, while technological progress in the dirty sector that uses dirty inputs will increase carbon emissions [3]. Regarding the indirect mechanism of the aforementioned effect, technological progress (one of the main sources of economic growth) can impact carbon emissions by promoting economic growth. Prior research has focused on analyzing the environmental Kuznets curve (EKC). Many scholars believe that the impact of economic growth on pollution emissions occurs according to the “inverted U” hypothesis; thus, when emission reduction technologies meet certain conditions, environmental pollution will undergo an “inverted U” transformation [11,12,13].
The aforementioned studies discuss the effects of technological progress on pollution emissions under closed economic conditions. As mentioned earlier, in the context of an open economy, technological progress implies a change in the technological gap of a given economy, which will affect its position in the global economy, thus altering international trade patterns. A change in international trade patterns directly affects the economic environment. Therefore, to examine how technological progress affects pollution, we should not limit the study to a closed economy. It is also necessary to examine the environmental effects caused by changes in the technological gap in the context of an open economy.
There are two main paths in the study of international trade patterns and environmental pollution under open conditions: one is the international trade of products, and the other is to discuss issues in the context of global value chains (GVC) from a production perspective. The former is mainly concentrated on the pollution haven hypothesis (PHH), theoretically exploring the existence of PHH [14,15,16] and empirically testing the reality of PHH [17,18]. A technological gap exists among different countries; thus, the position of countries in GVC varies [7]. In the global economy, technologically advanced countries will transfer pollution production to technically underdeveloped countries and produce clean products themselves. These underdeveloped countries undertaking pollution production may become pollution paradises [3]. If such countries increase the speed of technological progress and narrow the technological gap relative to the world technological frontier, they can improve their position in the GVC and possibly reduce their pollution production. Therefore, under the conditions of an open economy, technological progress can affect a country’s environmental pollution by changing the technological gap of a country and its global economic position.
It can be seen that what is important here is not the absolutely level of technological progress but the relative technological progress. This study uses the technological gap to portray the relative technological progress of a country. Compared with the literature on technological progress and environmental pollution, the marginal contribution of this study is its observation of the technological progress of an economy from a global perspective. This study also examined the relative changes in the position of a country in the global economy by analyzing its technological gap to assess the environmental effects of relative technological progress. This is the first study to integrate technological progress, relative technological gaps, and pollution into one theoretical model using the 1985–2011 data from China’s industry sector to empirically verify the relationship between technology gaps and carbon emissions.

3. Theoretical Model

On the basis of the Schumpeter growth model of Aghion et al. in [19], this study adds pollution to the model to examine the effects of technological gaps on carbon emissions. In this model, there are m economies, which do not exchange goods or factors but share technology. Each economy has a fixed population L, and we normalize it to 1; the aggregate quantities are equal to per capita quantities. Each individual has two periods of survival and has two units of labor endowment in the first period and no labor endowment in the second period. The utility function is a linear function of consumption: U = c 1 + β c 2 , where c 1 is the first period of consumption, c 2 is the second period of consumption, and β 0 , 1 is the discount rate of the second period of consumption relative to the first period.

3.1. General Product Sector

The general product sector uses labor and intermediate products to produce general products. The production function is as follows:
Y t = L 1 α 0 1 A i t 1 α x i t α d i α 0 , 1
Y t is the general product quantity, while general products are used as inputs for consumption, intermediate products, and enterprise innovation; L is labor supply; and x i t is the intermediate product i under time t and technology level A i t . It is assumed that the general product sector is fully competitive. The general product sector can maximize profits by choosing the amount of labor and intermediate inputs. Further, w t is used for wages and p i t for intermediate product prices for the intermediate products i at time t . The profit maximization function of the general product sector is as follows:
m a x L 1 α 0 1 A i t 1 α x i t α d i w t L 0 1 p i t x i t d i
Solving the profit-maximizing problem in function (2), we obtain the price of each intermediate product.
p i t = α A i t / x i t 1 α

3.2. Intermediate Product Sectors

In period t 1 , each intermediate product is capable of producing innovation with a probability μ i t e . If the innovation is successful, then the technical level of the sector becomes the world’s technology frontier level A t ¯ in period t . The growth rate of A t ¯ is g . If the intermediate product fails to innovate in period t 1 , the technical level in period t is maintained at the level of t 1 . The technical level A i t of intermediate product i during period t is defined as
A i t = A ¯ t with   probability   μ i t e A i t 1 with   probability   1 μ i t e
The effect of innovation only exists in the current period.
The intermediate product sector uses the general products as inputs. The intermediate product sector that fails to innovate can only produce a one-unit intermediate product with χ   ( χ > 1 ) units of general product input, and the production is carried out under perfect competition conditions. Therefore, the cost of the intermediate product is χ , which equals the price. Thus, the intermediate product price is p i t = χ , and the profit is zero. The intermediate product sector that innovates successfully can use one unit of general product input to produce one unit of intermediate products. The profit of the successful innovator in the intermediate product sector is χ 1 per unit of the intermediate product. Combined with formula (3), we obtain
x i t = α / χ 1 / 1 α A i t
The profit of the intermediate product sector that successfully innovated during period t was π i t = χ 1 α / χ 1 / 1 α A ¯ i t , which means π i t = π A ¯ i t ,   where   π = χ 1 α / χ 1 / 1 α .

3.3. Aggregate Behavior

A country’s average productivity A t is defined as follows:
A t = 0 1 A i t d i
Replacing (5) in (1), we obtain Y t = ξ A t , where ξ = α / χ α / 1 α .
Since the general production sector is fully competitive, the wages are as follows:
w t = 1 α Y t = 1 α ξ A t
The added value of the general product sector is the wage income, and the added value of the intermediate product sector is the profit income. Per capita GDP is the sum of the added value of each sector:
G t = w t + μ t π t = 1 α ξ A t + μ t π A ¯ t

3.4. Pollution Emission

Pollution was positively correlated with the scale of output. Economic growth and technological progress are also important factors affecting pollution emissions. Therefore, this study assumes that pollution is a function of per capita GDP growth rate, per capita GDP, and technological progress A t :
P t = g t F G t , A t = g t G t a A t b
where g t is the per capita GDP growth rate, G t is the per capita GDP, and A t is technological progress. Economic growth inevitably leads to an increase in pollution emissions; a > 0 .

3.5. Innovation

In any given successful innovation probability μ t , the R&D investment required for each sector’s innovation is given by the cost function:
N t 1 = n ˜ μ t A ¯ t = η μ t + δ μ t 2 / 2 A ¯ t , η , δ > 0
where N t 1 is the average number of products that must be used as an investment. n ˜ A ¯ t represents the “fishing-out effect”: the farther the technology frontier advances, the more difficult it is to innovate. From Equation (10), the probability that a producer who invests in n A ¯ t as an intermediate product for research and development investment will succeed in the next phase of innovation is as follows:
μ ˜ n = n ˜ 1 μ t = η 2 + 2 δ n η / δ
The expected net income of the innovation sector is the difference in the profit of the intermediate product sector and the innovation cost: β μ t π A ¯ t n ˜ μ t A ¯ t . In equilibrium, μ t will be chosen to maximize the expected net benefit.
The μ t that satisfies the maximization of the expected net return is
μ t = β π η / δ
assuming η < β π < η + δ . This assumption ensures that the equilibrium probability μ t is strictly between 0 and 1.

3.6. Equilibrium Analysis

In equilibrium, the probability of innovation in each sector is the same: μ i t e = μ t , and therefore the average productivity evolves as follows:
A t = μ t A ¯ t + 1 μ t A t 1
That is, the productivity parameter will be equal to A t in the sector of the μ t part (the sector that successfully innovated in the t 1 period) and equal to A t 1 in the other 1 μ t sectors (the sector that did not successfully innovate in period t 1 ). Since innovation is randomly distributed across sectors, the average A i t 1 in sectors without innovation will be equal to the average A t 1 in the economy.
The technical gap between a country and the world technology frontier is defined as follows:
a t = A t / A ¯ t 0 , 1
Here, a t obeys the following rules:
a t = μ t + [ 1 μ t ) / 1 + g a t 1
The larger the value of a t , the smaller the gap between the technical level of a country and the world technology frontier.
Assuming that the credit market is complete, each innovator can borrow money from other young people indefinitely, according to the current interest rate r = β 1 1 . After the project is successful, they promise to repay the debt. Then, μ t will be chosen as unconstrained to maximize the expected net benefit. This means μ t = μ * , where μ * = β π η / δ , and the equilibrium R&D consumption is
N t 1 * = n * A ¯ t = n ˜ μ * A ¯ t
At   this   time ,   a t + 1 = μ * + 1 μ * / 1 + g a t H 1 a t
In the long run, it will converge to steady-state values:
a * = 1 + g μ * / g + μ * 0 , 1
The steady-state per capita income is
G t * = 1 α ξ a * + μ * π A ¯ t
Its growth rate is the same as the technology frontier A ¯ t .
Substituting (17) and (19) into (9) can result in pollution, as follows:
P t = g t G t a A t b = g 1 α ξ a * + μ * π A ¯ t a A t b = g 1 α ξ a * + μ * π a b t a A t a + b
Taking logarithm (20),
l n P t = l n g + a   l n 1 α ξ a * + μ * π + a l n a t + a + b l n A t
Therefore, pollution is a function of the technological gap a t and economic growth A t .
The narrowing of the technology gap means that as a t increases, the value of ln a t increases as well. Additionally, a t has a coefficient of ( a ) < 0 for the logarithm of pollution emissions. This shows that narrowing the technology gap will lead to a decline in pollution. The possible economic channel is that when the technology gap narrows (i.e., a t increases), the country’s position in global value chain increases. Thus, the country can produce environment-friendly products, and thus it can improve its industrial structure and facilitate cleaning production. Therefore, when the technology gap is narrowed, pollution emissions are reduced.
The coefficient of the logarithm of A t to the logarithm of carbon emissions is (a + b). If a > −b, then A t plays an increasing role in emissions. At this time, the effect of technological progress on carbon emissions is not enough to offset the increase in economic growth; as a whole, a country’s technological progress plays a role in increasing emissions. When a < −b, the effect of technological progress on carbon emissions is greater than the effect of increasing emissions; then, technological progress will play a role in reducing emissions. Therefore, the effects of technological progress on carbon emissions are not uniform and depend on the relative power between the direct emission reduction effects of technological advancement and growth increase emission effects.

4. Empirical Design

This study focuses on the relationship among technological gaps, technological progress, and pollution emissions. The conclusion of the theoretical model in the previous section indicates that the narrowing of the technological gap between a country, and the world technological frontier will reduce the country’s pollution emissions. Next, this study constructs China’s industry-level data to empirically explore whether the role of technology gaps in carbon emissions is consistent with the theoretical model’s conclusions.

4.1. Method

On the basis of the theoretical model, this study used the system GMM method to conduct empirical analysis. The empirical model is as follows:
l n C O 2 i t = β 0 + β 1 l n C O 2 i t - 1 + β 2 t e c h i t + β 3 t e c h g a p i t + β 4 Z i t + μ i + μ t + ε i t
where l n C O 2 i t is the logarithm of carbon dioxide emissions; t e c h g a p i t is the logarithm of the industry technology gap; t e c h i t is the logarithm technology of the industry; and Z i t indicates the control variables, including the logarithms of industry added value, industry capital stock, industrial labor force, and industry total energy use. The empirical model (22) focuses on the coefficient of the technology gap.
The effect of technological progress on carbon emissions is difficult to determine. While technological progress plays a role in reducing emissions, it also promotes economic growth and brings about carbon emissions. If the direct effect of technological progress in reducing emissions is greater than the indirect effect of promoting economic growth, technological progress generally plays a role in reducing carbon emissions, whereas technological progress plays a role in increasing emissions. This study used data from China’s industry sector to empirically explore whether the effect of the technology gap on carbon emissions is consistent with the conclusions of the theoretical model and also helps us understand whether China’s technological progress plays an overall role in increasing or decreasing emissions.
Light and heavy industries generally differ in their degree of dependence on technology and polluting emissions; technological gaps and technological progress may play different roles in their carbon emissions. To explore this issue, this study divided the data into light and heavy industry sectors. On the basis of the benchmark model, we added dummy variables for the light and heavy industries sector and interaction terms between the dummy variables and all the explanatory variables of the benchmark model to construct an empirical model (23):
l n C O 2 i t = β 0 + β 1 l n C O 2 i t - 1 + β 2 t e c h i t + β 3 t e c h g a p i t + β 4 Z i t + κ 0 i n d u s i t + i n d u s i t × κ 1 l n C O 2 i t - 1 + κ 2 t e c h i t + κ 3 t e c h g a p i t + κ 4 Z i t + μ i + μ t + ε i t
In model (23), the i n d u s i t is an industry grouping dummy variable. If i n d u s i t is 0, the industry is a light industry, and a heavy industry if i n d u s i t equals 1. β 2 and β 3 are the effects of technological progress and the technological gap in carbon emissions in the light industry, respectively. Model (23) focuses on κ 2 and κ 3 . If these two coefficients are significant, the effects of technological progress and technological gaps on carbon emissions are significantly different between the light and heavy industries.

4.2. Data and Variable

4.2.1. Industry Consolidation and Matching

This study attempted to analyze China’s industry-level carbon emissions, economic input and output, and technical data from 1985 to 2011. Since its publication in 1984, China’s National Economic Industry Classification Standard has undergone three revisions in 1994, 2002, and 2011.
These revisions have led to mismatches in the economic industry before and after classification. Therefore, it is necessary to merge the Chinese industry’s classifications over the years. Following Chen [20], we matched industry classifications from 1985 to 2011. The technical data used in this study are from the U.S. Patent and Trademark Office (USPTO) patent application database, and there is no industry classification information in the USPTO raw data. Hsu et al. in [21] and Bhattacharya et al. in [22] matched the three-digit technical classification code of the USPTO patent with the United States double-digit industry code. United States industry classification criteria can be obtained using their classification methods. Then, according to the four-digit industry comparison between China and the United States, the two-digit industry in both countries was matched.
The matching results are listed in Table A1. To explore whether technological progress and gap play different roles between light and heavy industries, this study refers to Chen [20] to separate the two industry sectors. The US_SIC code values of 10, 12, 13, 14, 20, 21, and 22 (industry merge with original US_SIC codes 22, 23, 24), 24, 25, 26, 27, and 39 are regarded as light industry, and other industries are regarded as heavy industries.

4.2.2. Variables and Descriptive Statistics

First, we constructed the input and output data of China’s industry level from 1985 to 2011, including the total industrial output value, added value, capital stock, labor, and total energy consumption. This study refers to the method used by Chen [20] to unify the industrial caliber, using 1990 as the base period for price deflation. The missing value is supplemented by linear interpolation. Ex-factory price indices of industrial producer (1985–2011) (preceding year = 100) that comes from the “2012 China Urban Life and Price Yearbook” are employed as an output deflator index. The capital stock is deflated by the price index for investment in fixed assets, and the data are from the “China Statistical Yearbook”. The total industrial output value data were obtained from the “China Industry Economy Statistical Yearbook”. Referring to Chen [20], we obtained the industrial added value, capital stock, and labor data from 1985 to 2008.
Since the industrial value-added rate is not given in the 2009–2011 statistical yearbook, this study assumed that the industrial value-added rate is stable and uses the mean value of the industrial value-added rate in 2005–2007 to represent the industrial value-added rate in 2009–2011. We then used the industrial output value data of 2009–2011 to multiply the industrial added-value rate to calculate the industrial added-value data for 2009–2011 and then used the price index to convert the industrial value-added data into a sequence with a constant price of 1990, and the missing value was supplemented by linear interpolation. The capital stock of 2009–2011 was constructed as follows: First, we obtained the original value of fixed assets, net fixed assets, and accumulated depreciation data of the sub-sectors from 2008 to 2011 from the China Industrial Economics Statistical Yearbook. Then, we calculated the depreciation rate from these three data points. The difference between the original value of the fixed assets in the current year and the original value of the fixed assets in the previous year was used to construct the current annual investment amount; we used the fixed asset investment price index to convert it into a sequence based on 1990. Then, we obtained all caliber investment data at comparable prices. Finally, we used the perpetual inventory method to estimate the industrial capital stock. The total energy consumption data of the industry was obtained from the China Energy Statistics Yearbook, and the missing value was supplemented by linear interpolation.
Air pollution variable is the core variable of this paper. This paper used carbon emissions to represent pollution because greenhouse gases are an important part of air pollution caused by economic growth. There are many methods to measure carbon emissions. Some measurement methods pay attention to the carbon emissions caused by production [23,24], and some pay attention to the carbon footprint [25]. This paper focuses on the carbon emissions directly related to a country’s economic growth. Therefore, the carbon emissions were calculated by using the energy consumption used in production to represent air pollution. This study used energy consumption data to estimate CO2 emissions on the basis of the methodology provided by the United Nations Intergovernmental Panel on Climate Change (IPCC) Guidelines for National Greenhouse Gas Inventories. Since the National Bureau of Statistics adjusted the energy data in 2008, the data for 1995–2011 are based on the data reported in the China Energy Statistics Yearbook since 2008. At the same time, this paper summarized data from the China Energy Statistics Yearbook from 1985 to 1994. Using the above methods and data, this study estimated industry carbon dioxide emissions data from 1985 to 2011 in China. Missing values were supplemented using linear interpolation methods.
There were three methods employed to measure the technology gap: indicator method, index method, and frontier production function method.
The basic logic of using the indicator method to measure the technological gap is to select an indicator to measure the technical level, and then measure the technological gap between the sample points by using the difference in the indicator value of different sample points. The indicators to measure the technical level include production input–output indicators and R&D input–output indicators. The production input–output indicators mainly include labor productivity or total factor productivity [26,27,28]. The R&D input and output indicators mainly include the number of patent applications and the proportion of R&D expenditure in GDP [7,21]. The index method such as superlative index method improves the traditional production input–output indicators. It is not restricted by the setting of the production function form and is used to calculate the total factor productivity [28,29,30]. The core of the frontier production function method is to calculate the frontier and calculate the degree of inefficiency of the sample points compared to the technological frontier [31,32].
Among the three measurement methods, the index method and the frontier production function method need to use the traditional production input indicators of the world’s technological frontier. We want to obtain comparable data across countries and industries. There are doubts about the comparability of economic and social indicators among different countries, different industries, and different years. Therefore, we selected the R&D input-output index method in the index method to measure the technology gap. Referring to Hsu et al. [21], we used the patent data of the USPTO to construct technology variables. Using patent information as a “technical” proxy indicator has several advantages: patents are open data, provide a wealth of information, include all countries and technology types, are relatively standardized inventions, and provide longer time-series data [33].
In this paper, the technology gap was calculated as follows:
Technology   Gap C i t = Technology   Progress C i t / Technology   Frontier i t
where C denotes China, i denotes the industry, t denotes time, and the technology gap value is between 0 and 1; the larger the value, the smaller the gap between the industry and the world technology frontier level.
This study used the Harvard Business School patent inventor database [34] to obtain patent data to proxy for the technology gap and technological progress. There is a certain time lag between patent approval and patent applications. In the literature, patent data from the previous period is usually put into the model as a technical variable [22]. We used patent data from the Chinese industry level and from the world technology frontier. We calculated the patent number for each industry in each year on the basis of the year the patent is approved. The technical level of an industry in a certain year is the number of patents approved by the USPTO in the industry in the previous year. This study also used this dataset to construct the world technology frontier and thus obtain a proxy variable of the industry-level technology gap. The world technology frontier of industry i in year t refers to the largest technical index value of the industry i among all countries in year t obtained in the data. The technological frontiers of different industries in different years may appear in different countries.
The number of patents approved does not comprehensively reflect the technical level of a particular industry. For example, the number of patents approved in industry i is larger than that approved in industry j, but this does not mean that the technical level of industry i is higher than that of industry j. The number of patent citations reflects the influence of patents, which can better capture the total quality and market value of patents [35,36,37]. Therefore, this study used patent citation numbers as another proxy indicator of the industry’s technical variables.
When using patent citations as a proxy variable, we should note that it is difficult to assess whether the patents that were approved in 2000 and cited 10 times are of higher quality than those approved in 2008 that were only cited five times. This truncation error must also be considered. In this study, the weighting factor developed by Hall et al. in [35] was used to adjust for patent citations.
In the empirical estimation, all variable values were logarithmically taken, and the descriptive statistics of the data are shown in Table 1. In this study, the technical variables were lagged by one year, and the data for 1984–2010 were used. The data for the other variables were data from the period of 1985–2011. In this empirical estimation, all variable values were taken as logarithms. Descriptive statistics of the data are presented in Table 1. The technical variables were lagged by one year, which means that the technical data were from 1984 to 2010 and industrial panel data were from 1985 to 2011. As shown in Table 2, the logarithmic average of carbon emissions and carbon emission intensity of the light industry was lower than that of the heavy industry. The capital stock, energy consumption, total number of employed workers, industrial added value, and the total industrial output value of heavy industry were all higher than those of the light industry. From the perspective of the number of patents, the average value of the logarithm of the technological progress of the light industry and the logarithm of the technological gap were slightly smaller than that of the heavy industry. It can be seen from descriptive statistics that although heavy industries bring more added value, they also consume more energy and capital, and the data do not reflect the technical advantages of the heavy industry sector over the light industry sector.
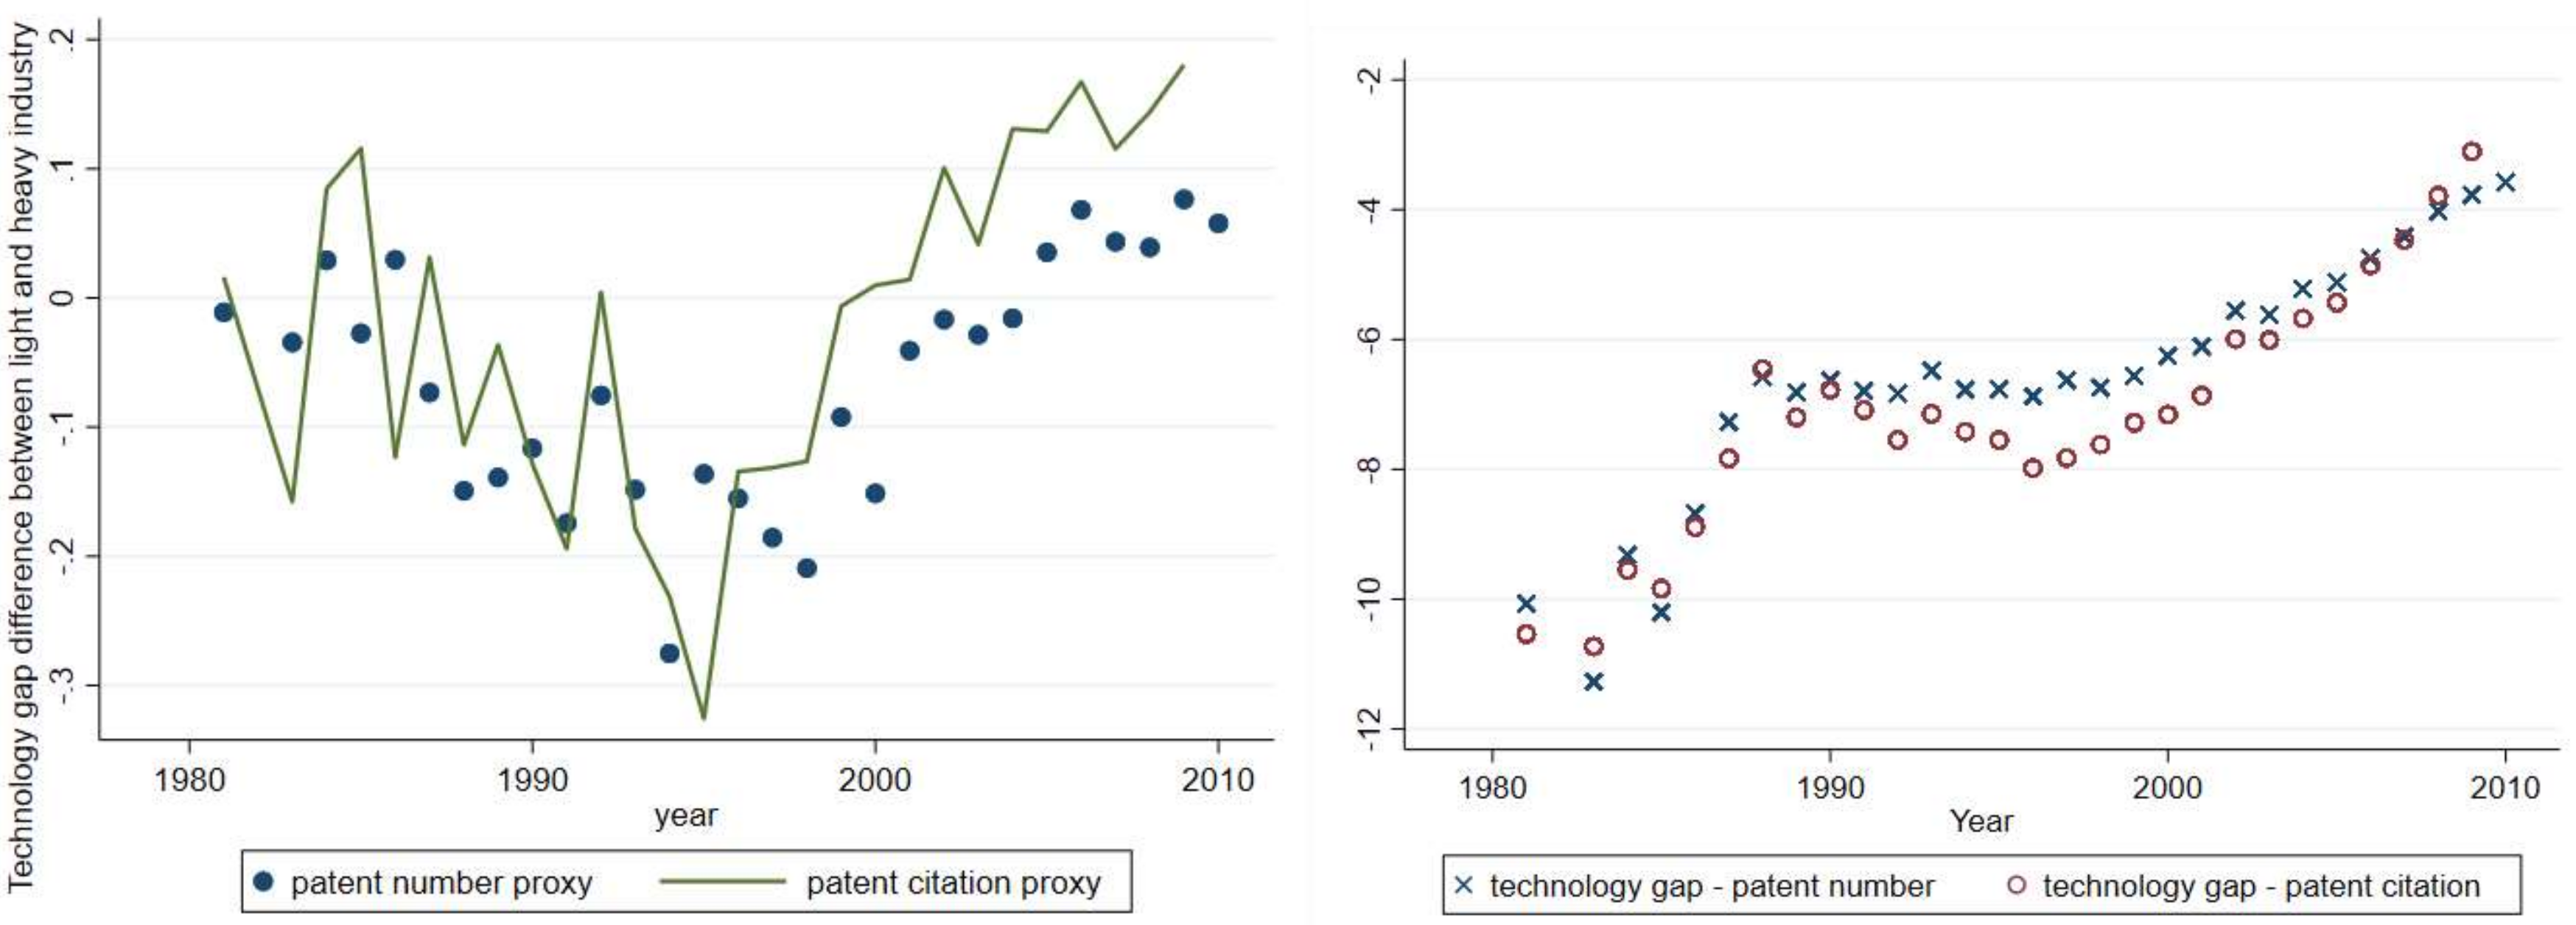
To make a clearer comparison of the technological gap between light and heavy industries, this study depicts the values of the technological gap and the difference in technology gaps in Figure 2. The left part of Figure 2 shows the trend of technological gaps over time in terms of patent quantity and quality in various industries in China from 1982 to 2010. The trends of the two indicators were relatively consistent. It can be seen from the figure that the gap between China’s technological level and technological-frontier countries rapidly narrowed from 1982 to 1990; however, it experienced a relatively gradual decline from 1990 to 1995 and continued to shrink rapidly from 1995 to 2010.
The right part of Figure 2 shows the logarithm of China’s light industry technology gap minus the logarithm of the heavy industry technology gap. A difference greater than 0 means that the technology of the light industry has a smaller gap relative to the world technology frontier, and a difference less than 0 indicates that the heavy industry has a smaller gap relative to the world technology frontier. It can be seen from the figure that before 2000, the technological gap in heavy industry was smaller, whereas after 2000, the technological gap in the light industry was smaller.
The mechanism analysis component of this study examined how technology gaps affect carbon emissions. The analysis believes that narrowing the technological gap will change the comparative advantage of a country relative to international competition and enable the country to improve its industrial structure and engage in more advanced and cleaner production, thereby reducing carbon emissions. What is more important in this mechanism is the industry-level comparative advantage data of a country. This study used data from the World Input–Output Database (WIOD) to estimate the industry’s explicit comparative advantage on the basis of the added value of manufacturing exports.
This study adopted the industry-explicit comparative advantage index to measure the industry’s explicit comparative advantage in export value:
R i j = E X i j E X j / E X i E X
E X i j is the export value of country i and industry j, and E X j is the sum of the export value added of industry j of all countries. E X i is the sum of export value added of all industries in country i. E X is the sum of export value added of all industries in all countries. Export value-added data can be calculated using the Koopman, Powers, Wang, and Wei (KPWW) [38] method with the world input–output table. After calculating the explicit comparative advantage of the industry, this study matched the industry classification of the WIOD data with the industry classification of this study and finally obtained the explicit comparative advantage data of industries between 1995 and 2011.

5. Results

5.1. Baseline Estimation Results

The empirical study used the system GMM with a two-stage robust standard error model. The estimated results are listed in Table 3. The Sagan test of the models in the empirical estimates (1) and (2) in Table 2 did not reject the null hypothesis; there were no over-constrained problems. The AR (2) test in the estimation result (2) indicates that there was no second-order sequence correlation in the residual term, indicating that the instrumental variable was valid.
In model (1) of Table 2, the technology gap and progress are indexed with patent numbers, while in model (2), the technical variables are constructed by patent citation. The empirical result of model (1) shows that the proxy variable of the technology gap was negatively correlated with carbon emissions. The widening of the technology gap will increase carbon emissions, which is consistent with the theoretical conclusion. A possible explanation is that when a country’s technological progress in an industry becomes closer to the world technological frontier, it will acquire an advantageous position in international production and transfer the labor- and resource-intensive production to other economies, thus decreasing pollution during production. This means that the technological gap may have a monotonous diminishing impact on carbon emissions. To verify this effect, this study added the quadratic term of the technology gap to the following empirical estimation: the technical level of the patent quantity agency plays a role in increasing carbon emissions.
The empirical results of model (2) show that the coefficient of the technology gap was not significant. This result may have been due to missing variables. The patent data used here were patents filed and approved in the United States between 1984 and 2010. During this period, China’s marketization process continued to advance, and its openness has continuously increased. An increasing number of Chinese innovation entities have applied for patents in the United States. Therefore, the number of patents approved in the United States used in this study not only portrays technological progress but also reflects China’s marketization process. However, estimations using patent citations to measure technological variables do not control the degree of marketization, thus causing the problem of missing variables and resulting in likely bias estimation results.

5.2. Estimation Results Including Market Impact

According to the previous analysis, Chinese industry-level patent data are patents filed and approved in the United States. The number of patents in this study may not only depict some technological advances but also portray the marketization process in China. To verify this problem, this study compared the 1997–2009 China marketization index data published by Fan et al. (2011) with patent numbers and patent citations by Chinese companies in the USPTO. Given that the numerical difference between the marketization index and the patent data is large, for the convenience of comparison, the data were transformed logarithmically, and the values after this logarithmic data are plotted with time in Figure 3.
As shown in Figure 3, the logarithm of the number of patents and the marketization index were relatively consistent, and the number of patents increased more rapidly than the marketization index. After dividing the logarithm of the number of patents by two, we found that the trend of the 1/2 logarithm of the number of patents was consistent with the trend of the marketization index logarithm. Therefore, this study believes that the number of patents portrays not only technological progress but also the marketization process. The trend in patent citations is not consistent with the market trends.
Since the marketization data of Fan et al. (2011) are based on data at the provincial level, it is difficult to add this index as a control variable in the empirical model of this study. To control the degree of marketization, this study regarded 1/2 logarithm of the number of patents as a proxy variable of the marketization process.
As mentioned earlier, it is necessary to further analyze whether the effect of the technology gap on carbon emissions is monotonous, and therefore the secondary term of the technology gap was added to the empirical estimation in this study. The results are listed in Table 4. In the estimation in Table 3, the Sagan test did not reject the null hypothesis, there was no second-order serial correlation in the residual term, and the model setting was reasonable. From the estimation results, when the degree of marketization was not controlled, the technological gap coefficient was negative and insignificant, and the quadratic term coefficient was negative and significant. After controlling for marketization, we found that the effect of the technology gap on carbon emissions showed a monotonous diminishing effect. Technological progress has significantly reduced carbon emissions, contradicting previous analyses. This result also indicates that the estimation results that omit market-oriented variables may be biased.

5.3. Heterogeneity Analysis

The empirical model points out that it is necessary to explore whether technological gaps and progress play different roles in light and heavy industries. Thus, we then estimate the empirical model (23). In model (23), a dummy variable for light and heavy industry group is added, and the value of the group dummy variable does not change with time. To avoid collinearity, the estimation does not control for the time fixed effect. In addition, the dummy variable and interaction terms for all interaction terms are added to the model. To avoid the problem of collinearity, the estimation does not control for individual fixed effects. The group estimation results are listed in Table 4.
The estimated coefficient of technological progress and the technological gap reflect the effect of technological progress and the technological gap on carbon emissions in the light industry. The coefficients of the interaction terms between technological progress and technological gaps and grouped dummy variables reflect whether there are differences in the effects of technological advances and technological gaps on carbon emissions in light and heavy industries. Neither the Sagan test or the AR(2) test estimated in Table 5 reject the null hypothesis, and therefore the model setting and the selection of instrumental variables are reasonable.
First, we focused on the effects of technology gaps on carbon emissions. In the estimation without marketization control, the technology gap coefficient was not significant. In the estimation of controlling marketization, the technology gap had no significant impact on the carbon emissions of the light industry sector, but the effect of the technology gap on carbon emissions was significantly different in the light and heavy industry sectors. The F test showed that the sum of coefficients of technology gap and interaction of technology gap and grouping variables was negative and significantly different from 0, which indicates that the technology gap will significantly reduce the carbon emissions of the heavy industry sector.
Therefore, the results in Table 4 show that the narrowing of the technology gap had a positive impact on reducing the carbon emissions of China’s heavy industry sector. The reason for this may be that China’s heavy industrial sector experienced extensive growth in the early days, with low technological content and relatively low-end production. As the technology of the heavy industry sector continues to approach the world technology frontier, the innovative capacity of the heavy industry sector has improved. In the international division of labor, the division in China’s heavy industry sector has gradually become high. As a result, the technology gap has narrowed, and the heavy industry sector’s carbon emissions have reduced.
Then, we focused on the effect of technological progress on carbon emissions. The estimated results without control of marketization show that technological progress plays a role in reducing emissions in the light industry sector, and there is no significant difference in the role played by the light and heavy industries. The F test showed that the sum of the coefficients of technological progress and the interaction terms of technological progress and dummy variables were not significantly different from 0. This shows that when marketization is not controlled, technological progress will play a greater role in reducing emissions in the light industry sector. In the estimation that marketization is added as a control variable, technological progress does not have a significant effect on carbon emissions in the light industry sector, but this effect is significantly different in the light and heavy industry sectors. The F test shows that the sum of the coefficients of technological progress and the interaction terms of technological progress and dummy variables were positive and significantly different from 0; this indicates the increasing effect of China’s technology on the heavy industry sector’s carbon emissions. A possible reason for this result is that technological progress in the heavy industry sector has brought about an improvement in production methods and an increase in industrial added value. Therefore, the indirect increase in emissions brought about by technological progress in the heavy industry sector may be greater than the direct reduction in emissions. Technological progress in the heavy industry sector has arguably played a role in increasing emissions.
The results of the analysis of technological progress and the technological gap seem to be contradictory; however, they are not. If there is only technological progress in the heavy industry, and the technological gap has not narrowed, the division of labor will not change, and only technological progress will play a role. When the technological gap narrows and the division of labor in the heavy industry sector is optimized, then not only technological progress but also the technological gap is at play.
On the basis of the previous analysis, we found that China’s technological progress generally plays a role in reducing emissions, but technological progress in the heavy industry sector increases emissions. Technological progress is still meaningful for reducing carbon emissions, and it is necessary to pay attention to the types of technological progress in the heavy industry sector to promote the development of clean technology. At the same time, narrowing the technology gap will significantly reduce China’s carbon emissions, and the role of the technology gap will be more significant in the heavy industry sector.

5.4. Mechanism Analysis

The previous analysis assumes that the technological gap may affect carbon emissions by changing a country’s industrial comparative advantage in the world economy, thereby obtaining a cleaner production division in the international division of labor. To verify this, we used Sobel and Goodman mediation tests. The intermediary variable is a dominant comparative advantage. First, a full sample estimation is conducted. The estimation controlled the time and industry fixed effects. The control variables included the level of technological progress, level of marketization, logarithm of capital stock, logarithm of total energy consumption, logarithm of the industrial labor force, and logarithm of industry added value. After all the variables were centrally processed, a mediation effect test was carried out. The test results are shown in Table 5.
It can be observed from Table 6 that both the Sobel test and the Goodman test significantly rejected the null hypothesis, indicating that there was a mediating effect. The indirect effect was significantly negative; that is, the technological gap had significantly reduced carbon emissions through a comparative advantage. The insignificant total and direct effects indicated that there was a masking effect.
Next, the samples were divided into light and heavy industry groups, and a mediation effect test was performed. The results are provided in Table 6. The test results after grouping showed that the light industry group had a significant partial mediating effect. Technology gaps affect carbon emissions by influencing an industry’s explicit comparative advantages. However, the mediation effect of the heavy industry group was not significant. The mediation effect test shows that the mechanism of the technological gap in carbon emissions affects the emissions by influencing a country’s industry’s apparent comparative advantage. This mechanism was fully reflected in the analysis of the light industry sector. The heavy industry sector has always been a weak sector in China. Although the technological gap has been narrowing and the comparative advantage of China’s heavy industry sector has continued to increase, this may have more of a role in enabling China’s heavy industry sector to develop many industries from scratch in the international division of labor. However, the process of transforming from quantity to quality has not yet been realized.

6. Conclusions

Technological progress has changed the international production division and trade pattern by narrowing the technological gap relative to international frontiers, which affects pollution. From the perspective of the global economy, a country’s technological progress implies a change in the technology gap, resulting in changes to the division of international production and industrial competition, which in turn influences trade patterns. These industrial structure and trade patterns directly affect air pollution. This study developed a Schumpeter growth model incorporating technological progress, the technology gap, and pollution to explore the effect of technology gaps on pollution, and then empirically examined the model using the data of China. The main results are as follows: First, the theoretical model showed that narrowing the technology gap reduces pollution, while the technology progress’s effect remains unsure. Second, the empirical results showed that narrowing the gap between China’s industrial technology and the world technology frontier significantly reduces carbon emissions, indicating that narrowing the technology gap is crucial for a country’s growth and environment. Third, there are significant differences in the effects of technological progress on carbon emissions between light and heavy industries: innovation in the heavy industry sector has played a role in increasing emissions. Lastly, the mechanism analysis showed that the industry’s explicit comparative advantage is the intermediary variable of the technology gap and carbon emissions. The narrowing of the technological gap will reduce carbon emissions by influencing the industry’s apparent comparative advantage, and this effect is even more pronounced in the light industry sector.
At present, the economies of all countries influence each other, and the technological gap has a significant impact on a country’s status in the world economy. This study shows that the technological gap will affect a country’s carbon emission level and that narrowing the technology gap is crucial for a country’s growth and environment. Hence, the policy implications may be that a country must pay attention not only to its technological progress but also to the relative speed of its technological progress relative to the progress of the world technology frontier. Maintaining high-speed technological growth and continuously narrowing the technological gap will not only benefit economic growth but also contribute to green development. At the same time, empirical data research at the industry level in China show that technological progress and technological gaps in the heavy industry sector with advanced manufacturing industries, such as major equipment, need substantial further attention.

Author Contributions

Conceptualization, Q.Y. and C.Z.; methodology, W.W.; software, W.W.; validation, Q.Y., C.Z. and W.W.; formal analysis, Q.Y.; investigation, Q.Y.; resources, C.Z.; data curation, W.W.; writing—original draft preparation, Q.Y.; writing—review and editing, Q.Y. and C.Z.; visualization, C.Z.; supervision, Q.Y. and C.Z. and W.W.; funding acquisition, C.Z. All authors have read and agreed to the published version of the manuscript.

Funding

This research was funded by National Natural Science Fund of China (grant no. 71903037).

Institutional Review Board Statement

Not applicable.

Informed Consent Statement

Not applicable.

Data Availability Statement

Data were selected from “2012 China Urban Life and Price Yearbook” at http://cdi.cnki.net/Search/ReportPreview?FileName=N2012080023000041, China Statistical Yearbook at http://cdi.cnki.net/Titles/SingleNJ?NJCode=N2019110002, China Industry Economy Statistical Yearbook at http://cdi.cnki.net/Titles/SingleNJ?NJCode=N2011050044, China Energy Statistics Yearbook at https://data.cnki.net/trade/Yearbook/Single/N2009060138?z=Z024, Disambiguation and Co-authorship Networks of the U.S. Patent Inventor Database (1975–2010) at https://dataverse.harvard.edu/dataset.xhtml?persistentId=doi:10.7910/DVN/5F1RRI.

Conflicts of Interest

The authors declare no conflict of interest.

Appendix A

Table A1. Matching of industries.
USA_SICIndustry NameCN_SICIndustry Name
Light industry10Metal, mining8Extracting and dressing of ferrous metal mines
9Extracting and dressing of non-ferrous metal ores
12Coal mining6Coal exploitation and washing
13Oil and gas extraction7Exploitation of petroleum and natural gas
14Nonmetallic minerals, except fuels10Extracting and dressing of nonmetal ores
20Food and kindred products13Manufacturing of agricultural and non-staple foodstuff
14Foodstuff manufacturing industry
15Beverage manufacturing industry
21Tobacco products16Tobacco industry
22,23,31Textile mill products17Textile industry
Apparel and other textile products18Manufacturing industry of textile costumes, shoes, and caps
Leather and leather products19Manufacturing industry of leather, fur, feather (cloth with soft nap) and their products
24Lumber and wood products20Wood processing and manufacturing industry of wood, bamboo, rattan, palm, and straw-made articles
25Furniture and fixtures21Furniture manufacturing
26Paper and allied products22Papermaking and paper product industry
27Printing and publishing23Printing industry and reproduction of record media
39Miscellaneous manufacturing industries24Manufacturing industry for culture, education, and sports goods
42Artwork and other manufacturing industries
Heavy industry28Chemical and allied products26Chemical feedstock and chemical manufacturing industry
27Medicine manufacturing industry
28Chemical fiber manufacturing industry
29Petroleum and coal products25Petroleum processing, coking, and nuclear fuel manufacture
30Rubber and miscellaneous plastics products29Rubber production industry
30Plastic industry
32Stone, clay, and glass products31Non-metallic minerals product industry
33Primary metal industries32Ferrous metal smelting and extrusion
33Non-ferrous smelting and extrusion
34,35,38Fabricated metal products34Metalwork industry
Industrial machinery and equipment35General-purpose equipment manufacturing industry
Instruments and related products36Specialized facility manufacturing industry
41Manufacturing industry of instruments and meters, and machinery for culture and office
36Electronic and other electric equipment39Electric machinery and equipment manufacturing industry
40Manufacturing industry of communication equipment, computers, and other electronic equipment
37Transportation equipment37Transport and communication facilities of the manufacturing industry
49Electric, gas, and sanitary services11Other mining industries
44Production and supply of electric power and heat power
45Gas generation and supply
46Water production and supply
Industry deleted43Processing of discarded resources, and waste and scrap recovery

References

  1. Wang, S.; Ma, Y. Influencing factors and regional discrepancies of the efficiency of carbon dioxide emissions in Jiangsu, China. Ecol. Indic. 2018, 90, 460–468. [Google Scholar] [CrossRef]
  2. Shahbaz, M.; Loganathan, N.; Muzaffar, A.T.; Ahmed, K.; Jabran, M.A. How urbanization affects CO2 emissions in Malaysia? The application of STIRPAT model. Renew. Sustain. Energy Rev. 2016, 57, 83–93. [Google Scholar] [CrossRef] [Green Version]
  3. Acemoglu, D.; Aghion, P.; Bursztyn, L.; Hemous, D. The Environment and Directed Technical Change. Am. Econ. Rev. 2012, 102, 131–166. [Google Scholar] [CrossRef] [PubMed] [Green Version]
  4. Amri, F.; Ben Zaied, Y.; Ben Lahouel, B. ICT, total factor productivity, and carbon dioxide emissions in Tunisia. Technol. Forecast. Soc. Chang. 2019, 146, 212–217. [Google Scholar] [CrossRef]
  5. Jaffe, A.B.; Newell, R.G.; Stavins, R.N. Environmental Policy and Technological Change. Environ. Resour. Econ. 2002, 22, 41–70. [Google Scholar] [CrossRef]
  6. Levinson, A. Technology, International Trade, and Pollution from US Manufacturing. Am. Econ. Rev. 2009, 99, 2177–2192. [Google Scholar] [CrossRef] [Green Version]
  7. Ye, C.; Ye, Q.; Shi, X.; Sun, Y. Technology gap, global value chain and carbon intensity: Evidence from global manufacturing industries. Energy Policy 2020, 136, 111094. [Google Scholar] [CrossRef]
  8. Cimoli, M.; Pereima, J.B.; Porcile, G. A technology gap interpretation of growth paths in Asia and Latin America. Res. Policy 2019, 48, 125–136. [Google Scholar] [CrossRef]
  9. Posner, M.V. International trade and technical change. Oxf. Econ. Pap. 1961, 13, 323–341. [Google Scholar] [CrossRef]
  10. Du, K.; Yu, Y.; Li, J. Does international trade promote CO2 emission performance? An empirical analysis based on a partially linear functional-coefficient panel data model. Energy Econ. 2020, 92, 104983. [Google Scholar] [CrossRef]
  11. Grossman, G.M.; Krueger, A.B. Economic Growth and the Environment. Q. J. Econ. 2006, 110, 353–377. [Google Scholar] [CrossRef] [Green Version]
  12. Andreoni, J.; Levinson, A. The simple analytics of the environmental Kuznets curve. J. Public Econ. 2001, 80, 269–286. [Google Scholar] [CrossRef] [Green Version]
  13. Brock, W.A.; Taylor, M.S. The Green Solow model. J. Econ. Growth 2010, 15, 127–153. [Google Scholar] [CrossRef]
  14. Walter, I.; Ugelow, J.L. Environmental policies in developing countries. Ambio 1979, 8, 102–109. [Google Scholar] [CrossRef]
  15. Conrad, K. Locational competition under environmental regulation when input prices and productivity differ. Ann. Reg. Sci. 2005, 39, 273–295. [Google Scholar] [CrossRef] [Green Version]
  16. Ben Kheder, S.; Zugravu-Soilita, N. The Pollution Haven Hypothesis: A Geographic Economy Model in a Comparative Study; FEEM Working Paper; Fondazione Eni Enrico Mattei: Corso Magenta, Milan, 2008. [Google Scholar]
  17. Eskeland, G.S.; Harrison, A.E. Moving to greener pastures? Multinationals and the pollution haven hypothesis. J. Dev. Econ. 2003, 70, 1–23. [Google Scholar] [CrossRef] [Green Version]
  18. Millimet, D.L.; Roy, J. Empirical Tests of the Pollution Haven Hypothesis When Environmental Regulation is Endogenous. J. Appl. Econom. 2016, 31, 652–677. [Google Scholar] [CrossRef]
  19. Aghion, P.; Howitt, P.; Mayer-Foulkes, D. The Effect of Financial Development on Convergence: Theory and Evidence. Q. J. Econ. 2005, 120, 173–222. [Google Scholar] [CrossRef]
  20. Chen, S. Reconstruction of sub-industrial statistical data in China (1980–2008). China Econ. Q. 2011, 10, 735–776. [Google Scholar]
  21. Hsu, P.-H.; Tian, X.; Xu, Y. Financial development and innovation: Cross-country evidence. J. Financ. Econ. 2014, 112, 116–135. [Google Scholar] [CrossRef] [Green Version]
  22. Bhattacharya, U.; Hsu, P.-H.; Tian, X.; Xu, Y. What Affects Innovation More: Policy or Policy Uncertainty? J. Financ. Quant. Anal. 2017, 52, 1869–1901. [Google Scholar] [CrossRef] [Green Version]
  23. Chen, D.; Chen, S.; Jin, H. Industrial agglomeration and CO2 emissions: Evidence from 187 Chinese prefecture-level cities over 2005–2013. J. Clean. Prod. 2018, 172, 993–1003. [Google Scholar] [CrossRef]
  24. Iqbal, W.; Altalbe, A.; Fatima, A.; Ali, A.; Hou, Y. A DEA Approach for Assessing the Energy, Environmental and Economic Performance of Top 20 Industrial Countries. Processes 2019, 7, 902. [Google Scholar] [CrossRef] [Green Version]
  25. Giama, E.; Papadopoulos, A.M. Carbon footprint analysis as a tool for energy and environmental management in small and medium-sized enterprises. Int. J. Sustain. Energy 2018, 37, 21–29. [Google Scholar] [CrossRef]
  26. Verspagen, B. Convergence in the global economy. A broad historical viewpoint. Struct. Chang. Econ. Dyn. 1995, 6, 143–165. [Google Scholar] [CrossRef]
  27. Timmer, M.P.; Szirmai, A. Productivity growth in Asian manufacturing: The structural bonus hypothesis examined. Struct. Chang. Econ. Dyn. 2000, 11, 371–392. [Google Scholar] [CrossRef]
  28. Vandenbussche, J.; Aghion, P.; Meghir, C. Growth, distance to frontier and composition of human capital. J. Econ. Growth 2006, 11, 97–127. [Google Scholar] [CrossRef]
  29. Caves, D.W.; Christensen, L.R.; Diewert, W.E. Multilateral Comparisons of Output, Input, and Productivity Using Superlative Index Numbers. Econ. J. 1982, 92, 73–86. [Google Scholar] [CrossRef]
  30. Bellone, F.; Kiyota, K.; Matsuura, T.; Musso, P.; Nesta, L. International productivity gaps and the export status of firms: Evidence from France and Japan. Eur. Econ. Rev. 2014, 70, 56–74. [Google Scholar] [CrossRef]
  31. Fally, T.; Hillberry, R. A Coasian model of international production chains. J. Int. Econ. 2018, 114, 299–315. [Google Scholar] [CrossRef] [Green Version]
  32. Giannini, M.; Vitali, L. Productivity Growth of Transition Economies: An Assessment. Adv. Econ. Bus. 2014, 2, 133–147. [Google Scholar] [CrossRef]
  33. Mogee, M.E. Using Patent Data for Technology Analysis and Planning. Res. Manag. 1991, 34, 43–49. [Google Scholar] [CrossRef]
  34. Li, G.C.; Lai, R.; D’Amour, A.; Doolin, D.M.; Sun, Y.; Torvik, V.I.; Yu, A.Z.; Lee, F. Disambiguation and co-authorship networks of the U.S. patent inventor database (1975–2010). Res. Policy 2014, 43, 941–955. [Google Scholar] [CrossRef]
  35. Hall, B.H.; Jaffe, A.B.; Trajtenberg, M. The NBER Patent Citation Data File: Lessons, Insights and Methodological Tools; NBER Working Paper; National Bureau of Economic Research: Washington, DC, USA, 2001. [Google Scholar]
  36. Harhoff, D.; Narin, F.; Scherer, F.M.; Vopel, K. Citation Frequency and the Value of Patented Inventions. Rev. Econ. Stat. 1999, 81, 511–515. [Google Scholar] [CrossRef]
  37. Aghion, P.; Van Reenen, J.; Zingales, L. Innovation and Institutional Ownership. Am. Econ. Rev. 2013, 103, 277–304. [Google Scholar] [CrossRef] [Green Version]
  38. Koopman, R.; Powers, W.; Wang, Z.; Wei, S.-J. Give Credit Where Credit Is Due: Tracing Value Added in Global Production Chains; National Bureau of Economic Research: Cambridge, MA, USA, 2010. [Google Scholar]
Figure 1. Trends of the growth rate of technological progress and carbon emission in China and the United States. Data source: Calculated by the author using data from the WDI database.
Processes 09 02013 g001
Figure 2. Technology gap in light industry and heavy industry from 1982 to 2010 in China.
Processes 09 02013 g002
Figure 3. Marketization index logarithm and technical variable logarithmic time trend graph.
Processes 09 02013 g003
Table 1. Descriptive statistics.
Light Industry
VariableDefinitionObservationMeanStd. Dev.MinMax
lnpatpatent number3245.0822.478−13.8169.263
lntechgapppatent gap324−6.4091.646−13.816−3.444
lncitpatent citation324−1.4472.710−13.8160.548
lntechgapccitation gap324−7.2032.173−13.816−2.484
lnco2CO2 emission3247.2791.7924.18410.842
lnco2denCO2 emission density3241.4461.691−2.7274.756
lncapcapital stock3246.2731.3613.2199.089
lneneenergy consumption3246.9571.2744.4209.356
lnlabnumber of employees3245.2701.0622.9447.603
lnvalindustrial added value3245.8321.2033.4669.196
lngrosstotal industrial output 3246.6723.0890.00012.943
compareadvindustry explicit comparative advantage852.0852.6460.1049.154
Heavy Industry
NameObservationMeanStd. Dev.MinMax
lnpatpatent number2435.9191.8890.69310.366
lntechgapppatent gap243−6.2781.503−10.697−3.473
lncitpatent citation243−1.4622.496−13.8160.557
lntechgapccitation gap243−7.0692.022−13.816−3.007
lnco2CO2 emission2439.2431.7576.50012.748
lnco2denCO2 emission density2432.3092.308−3.3086.183
lncapcapital stock2437.6221.1295.00410.367
lneneenergy consumption2438.6351.1756.45711.197
lnlabnumber of employees2436.1720.8123.6647.591
lnvalindustrial added value2436.9341.3094.69110.490
lngrosstotal industrial output 2438.0583.0060.00013.075
compareadvindustry explicit comparative advantage1190.7790.32320.1081.867
Table 2. Baseline estimation results.
Dependent Variable: Logarithm of Carbon Emissions
(1)(2)
First-order lag term for the logarithm of carbon emissions1.062 ***0.981 ***
(18.82)(23.41)
Logarithm of technology gap−0.204 *0.00364
(−1.95)(0.13)
Logarithm of technology progress0.0667 *−0.00767
(1.77)(−0.70)
Control variableYESYES
Time fixed effectYESYES
Industry fixed effectYESYES
Observations546546
Sargan p0.7100.694
ar2p0.06650.473
Notes: Z-value in parentheses, * p ≤ 0.10, *** p ≤ 0.01.
Table 3. Estimation results including market impact.
Dependent Variable: Logarithm of Carbon Emissions
(1)(2)
First-order lag term for logarithm of carbon emissions0.894 ***0.940 ***
(42.36)(88.91)
Logarithm of technology gap−0.207−0.263 ***
(−1.44)(−2.66)
The quadratic term of the logarithm of the technology gap−0.0234 *−0.0216 ***
(−1.71)(−2.87)
Logarithm of technology progress−0.0850 *−0.0390 ***
(−1.80)(−3.55)
Marketization −0.290 ***
(−3.71)
Control variableYESYES
Time fixed effectYESYES
Industry fixed effectYESYES
Observations546546
Sargan p0.5390.693
ar2p0.8560.582
Note: Z-value in parentheses, * p ≤ 0.10, *** p ≤ 0.01.
Table 4. Heterogeneity analysis.
Dependent Variable: Logarithm of Carbon Emissions
(1)(2)
First-order lag term for logarithm of carbon emissions0.2370.326
(0.72)(0.93)
Logarithm of technology gap0.162−0.0278
(1.55)(−0.42)
Interaction terms of technology gap and grouping dummy variables−0.265−0.262 **
(−1.43)(−2.45)
Logarithm of technology progress−0.0909 *−0.00644
(−1.76)(−0.23)
Interaction terms of technology progress and grouping dummy variables0.1450.136 **
(1.60)(2.52)
Marketization −0.191 ***
(−4.72)
Interaction terms of Marketization and grouping dummy variables 1.190 ***
(4.15)
Control variableYESYES
Observations546546
Sargan p0.8830.260
ar2p0.1790.394
Note: Z-value in parentheses, * p ≤ 0.10, ** p ≤ 0.05, *** p ≤ 0.01.
Table 5. Full sample mediation effect estimation results.
Coef.Std. Err.ZP > Z
Sobel−0.2480.091−2.7140.007
Goodman-1−0.2480.092−2.6980.007
Goodman-2−0.2480.091−2.7300.006
Coef.Std. Err.ZP > Z
Indirect effect−0.2480.091−2.7140.007
Direct effect0.1810.1551.1720.241
Total effect−0.0660.131−0.5070.612
Table 6. Mediating effect test based on sub-samples of light and heavy industries.
Light IndustryHeavy Industry
Coef.Std. Err.ZP > ZCoef.Std. Err.ZP > Z
Sobel−0.4300.174−2.4760.0130.0110.2090.0530.957
Goodman-1−0.4300.176−2.4390.0150.0110.2140.0520.958
Goodman-2−0.4300.171−2.5160.0120.0110.2040.0550.956
Coef.Std. Err.ZP > ZCoef.Std. Err.ZP > Z
Indirect effect−0.430 0.174 −2.476 0.013 0.0110.2090.0530.957
Direct effect−0.916 0.217 −4.229 0.000 −0.1360.468−0.2900.772
Total effect−1.346 0.246 −5.461 0.000 −0.1250.511−0.2440.807
Notes: Coef.: coefficient; Std. Err.: standard error.
Publisher’s Note: MDPI stays neutral with regard to jurisdictional claims in published maps and institutional affiliations.

