Article

Effects of Pore Structure of Different Rank Coals on Methane Adsorption Heat

1
School of Geology and Mining Engineering, Xinjiang University, Urumqi 830046, China
2
Xinjiang Key Laboratory for Geodynamic Processes and Metallogenic Prognosis of the Central Asian Orogenic Belt, Xinjiang University, Urumqi 830046, China
3
School of Civil Engineering, Xuzhou University of Technology, Xuzhou 221018, China
4
School of Resource and Environment Sciences, Xinjiang University, Urumqi 830046, China
5
School of Safety Engineering, China University of Mining and Technology, Xuzhou 221116, China
*
Authors to whom correspondence should be addressed.
Processes 2021, 9(11), 1971; https://doi.org/10.3390/pr9111971
Submission received: 3 September 2021 / Revised: 30 October 2021 / Accepted: 3 November 2021 / Published: 4 November 2021

Abstract

:
Adsorption thermodynamic characteristics are an important part of the methane adsorption mechanism, and are useful for understanding the energy transmission mechanism of coalbed methane (CBM) migration in coal reservoirs. To study the effect of coal pore characteristics on methane adsorption heat, five different types of rank coals were used for low-pressure nitrogen, low-pressure carbon dioxide, and methane adsorption experiments. Pore structure and adsorption parameters, including maximum adsorption capacity and adsorption heat, were obtained for five coal samples, and their relationships were investigated. The results show that the low-pressure nitrogen adsorption method can measure pores within 1.7–300 nm, while the low-pressure carbon dioxide adsorption method can measure micropores within 0.38–1.14 nm. For the five coal samples, comprehensive pore structure parameters were obtained by combining the results of the low-pressure nitrogen and carbon dioxide adsorption experiments. The comprehensive results show that micropores contribute the most to the specific surface area of anthracite, lean coal, fat coal, and lignite, while mesopores contribute the most to the specific surface area of coking coal. Mesopores contribute the most to the pore volume of the five coal samples. The maximum adsorption capacity has a significant positive correlation with the specific surface area and pore volume of micropores less than 2 nm, indicating that methane is mainly adsorbed on the surface of micropores, and can also fill the micropores. The adsorption heat has a significant positive correlation with the specific surface area and pore volume of micropores within 0.38–0.76 nm, indicating that micropores in this range play a major role in determining the methane adsorption heat.

1. Introduction

As the main source of coal mine accidents, coalbed methane (CBM) is a type of unconventional natural gas resource [1,2]. CBM mainly consists of methane, most of which is adsorbed in coal seams [3,4]. The study of coal adsorption characteristics is of great significance in CBM exploration and mine gas disaster prevention [5,6,7].
Currently, extensive research has been performed on coal adsorption characteristics, most of which focused on the effects of the coal properties [8,9,10]. Coal is a type of natural porous material with a large internal surface area due to the abundance of pores [11,12,13], and coal pores are the main storage space for CBM. The adsorption capacity of CBM is closely related to the pore characteristics of coal, thus the relationship between the pore structure of coal and the adsorption capacity of CBM has become an important research topic. Several classification methods have been proposed to classify coal pores, and the Hodot method (micropores, <10 nm; transitional pores, 10–100 nm; mesopores, 100–1000 nm; macropores, >1000 nm) and IUPAC method (micropores, <2 nm; mesopores, 2–50 nm; macropores, >50 nm) have been widely used [14,15]. In this work, the IUPAC method is applied to analyse pore characteristics. Currently, there are many techniques for investigating coal pore characteristics, such as scanning electron microscopy (SEM) [16], small-angle X-ray scattering (SAXS) [17], nuclear magnetic resonance (NMR) [18], mercury intrusion porosimetry (MIP) [19], low-pressure nitrogen adsorption (LP-N2GA) [20], and low-pressure carbon dioxide adsorption (LP-CO2GA) [21]. Among the above methods, the LP-N2GA and LP-CO2GA methods have been widely used to quantitatively analyse the pore structure of coal [20,21,22,23,24]. Because activation diffusion is limited during N2 adsorption at 77 K, the LP-N2GA method cannot be used to analyse pores less than 1.2 nm. Whereas CO2 can access pores within 0.3–1.5 nm at 273.15 K. Therefore, the LP-CO2GA method is more suitable for analysing micropores [21]. Based on the above experimental techniques, many studies have shown that the SSA of micropores is positively correlated with the saturated adsorption capacity of CBM [20,21,22,23,24].
In addition to matter transmission, energy transmission also exists during the process of CBM adsorption and desorption. Some studies have shown that coal temperature increases during the process of CBM adsorption [25,26]. The CBM adsorption process belongs to physical adsorption, which is a spontaneous exothermic process. The heat released in the adsorption process is the adsorption heat [27]. The adsorption heat directly reflects the adsorption energy between the adsorbent molecule and the adsorbed molecule [28]. The adsorption thermodynamic characteristics are important for understanding the energy transmission mechanism of CBM migration in coal seams [29]. Currently, direct calorimetric and indirect non-calorimetric methods are two experimental methods for measuring adsorption heat [27]. The direct calorimetric method is based on the measurement of the heat evolved when a known amount of gas is adsorbed on the surface. The indirect non-calorimetric method is based on the adsorption isotherms at different temperatures and the adsorption heat can be calculated using the Clausius–Clapeyron equation. Because of the simple experimental device, the indirect non-calorimetric method is the most commonly used, whereas the direct calorimetric is considered more expensive [30]. Based on the above experimental methods, some studies have focused on the effects of coal properties (such as maceral composition [31], functional group [32], and adsorbates [33]) on methane adsorption heat. At present, many studies focus on the pore structure of coal and its influence on the adsorption capacity of CBM. The adsorption capacity reflects the number of adsorption sites, and simple research on the adsorption capacity of CBM is insufficient to roundly understand the adsorption mechanism of CBM. Therefore, the adsorption heat of CBM should be also well studied as an important adsorption parameter. The main objectives of this study were to quantitatively characterise the pore structure of coal and explore the influence of the pore structure on the adsorption heat of CBM. Based on the low-pressure nitrogen adsorption (LP-N2GA), low-pressure carbon dioxide adsorption (LP-CO2GA), and methane adsorption isotherm experiments, the effects of the coal pore characteristics on methane adsorption heat were studied in this work.

2. Experimental Section

2.1. Sample Preparation

In this work, five types of coal samples with different metamorphic grades were collected from different coal mines in China. The geological information of coal seams from which the samples were collected is shown in Table 1, and the basic parameters of the five coal samples are shown in Table 2. According to the National Standard GB/T 5751-2009 [34], the coal types of the five coal samples are anthracite, lean coal, coking coal, fat coal, and lignite from the high rank to the low rank, respectively. Fresh coals were collected and crushed and coal samples with a mesh size fraction of 60–80 (0.177–0.250 mm) were sieved for the following experiments.

2.2. Experimental Methods

2.2.1. Measurement of Pore Characteristics

The LP-N2GA experiments were performed at 77 K by the ASAP 2020 experimental system (Micromeritics Instrument, Norcross, GA USA). The specific surface area (SSA), total pore volume (TPV) and pore size distribution (PSD) were obtained using the Barrett–Joyner–Halenda (BJH) theory. The LP-CO2GA experiments were performed at 273.15 K by the same experimental system, and the SSA, TPV, and PSD were obtained using the density functional theory (DFT).

2.2.2. Measurement of Adsorption Isotherms

The methane adsorption isotherms of the coal samples were measured with a BSD-PH ultrahigh-pressure gas sorption analyser (Beishide Instrument, Beijing, China) with a volumetric method. The equilibrium pressure of the adsorption experiments ranges from 0 to 5 MPa, and the equilibrium temperature ranges from 303.15 to 323.15 K. Because of its simple mathematical form, the Langmuir equation has been widely used by the CBM industry [10]. Hence, the methane adsorption isotherms were modelled using the Langmuir equation [35] as follows:
n a = n m b p 1 + b p
where nm is the maximum adsorption capacity (mmol/g); p is the pressure (MPa); b is the Langmuir constant (MPa−1). The Langmuir constant b has the following form [35]
b = b exp ε R T
where b is the pre-exponential factor (MPa−1); ε is the adsorption energy (kJ/mol); R is the universal gas constant (8.314 J mol−1·K−1), and T is the temperature (K).

2.2.3. Measurement of Adsorption Heat

The typical adsorption heat usually refers to the isosteric heat of adsorption (qst) or the enthalpy change of adsorption ( Δ H ) [29]. Because the physical adsorption process is exothermic, the value of the enthalpy change is negative. The isosteric heat of adsorption usually represents the positive value of the enthalpy change in the references [29], namely,
q s t = Δ H
For ease of exposition, in this work, the adsorption heat refers to the isosteric heat. The enthalpy change of adsorption can be obtained using the Clausius–Clapeyron equation [36] as follows:
d ln p d T = Δ H R T
Integrating Equation (4) yields:
ln p = Δ H R T + C
where C is a constant.
The pressure values at a fixed adsorption capacity can be calculated for each T after fitting the isotherms. Then, the pressure can be plotted as lnp versus 1/T at a fixed adsorption capacity, and the enthalpy change of adsorption can be obtained from the slope of the line [27].

3. Results and Discussion

3.1. Pore Structure Characteristics of Coal Samples

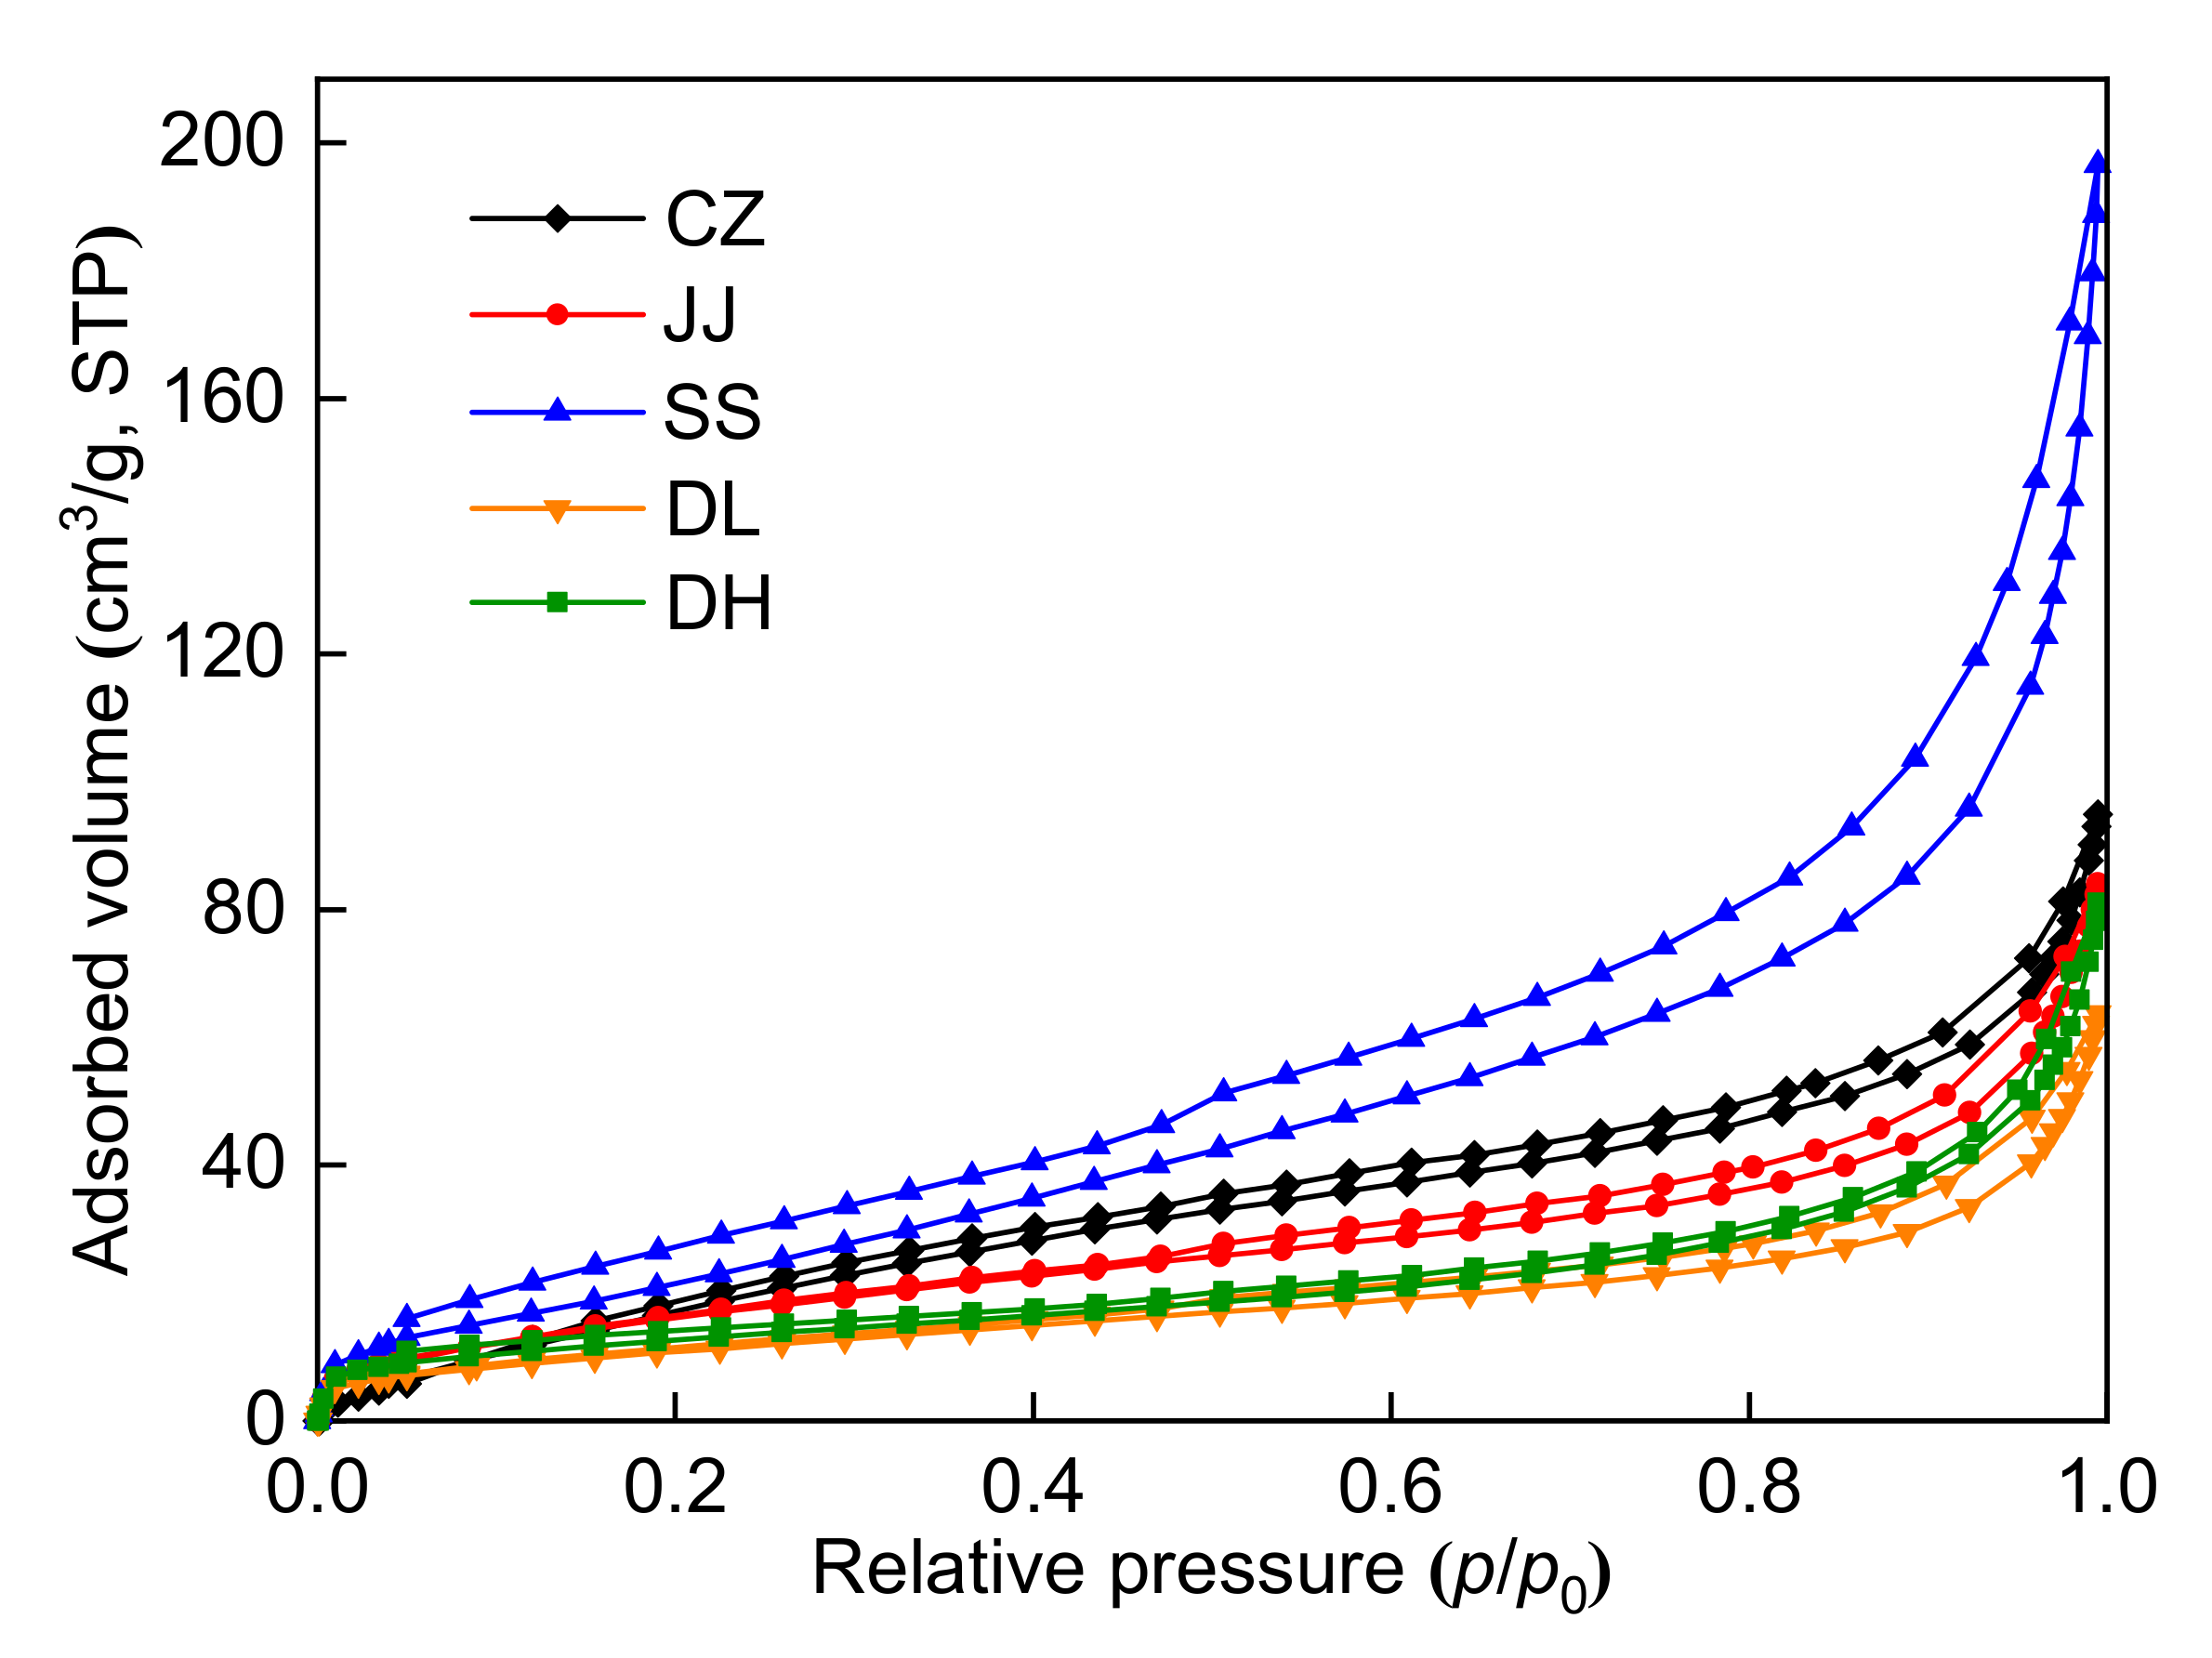
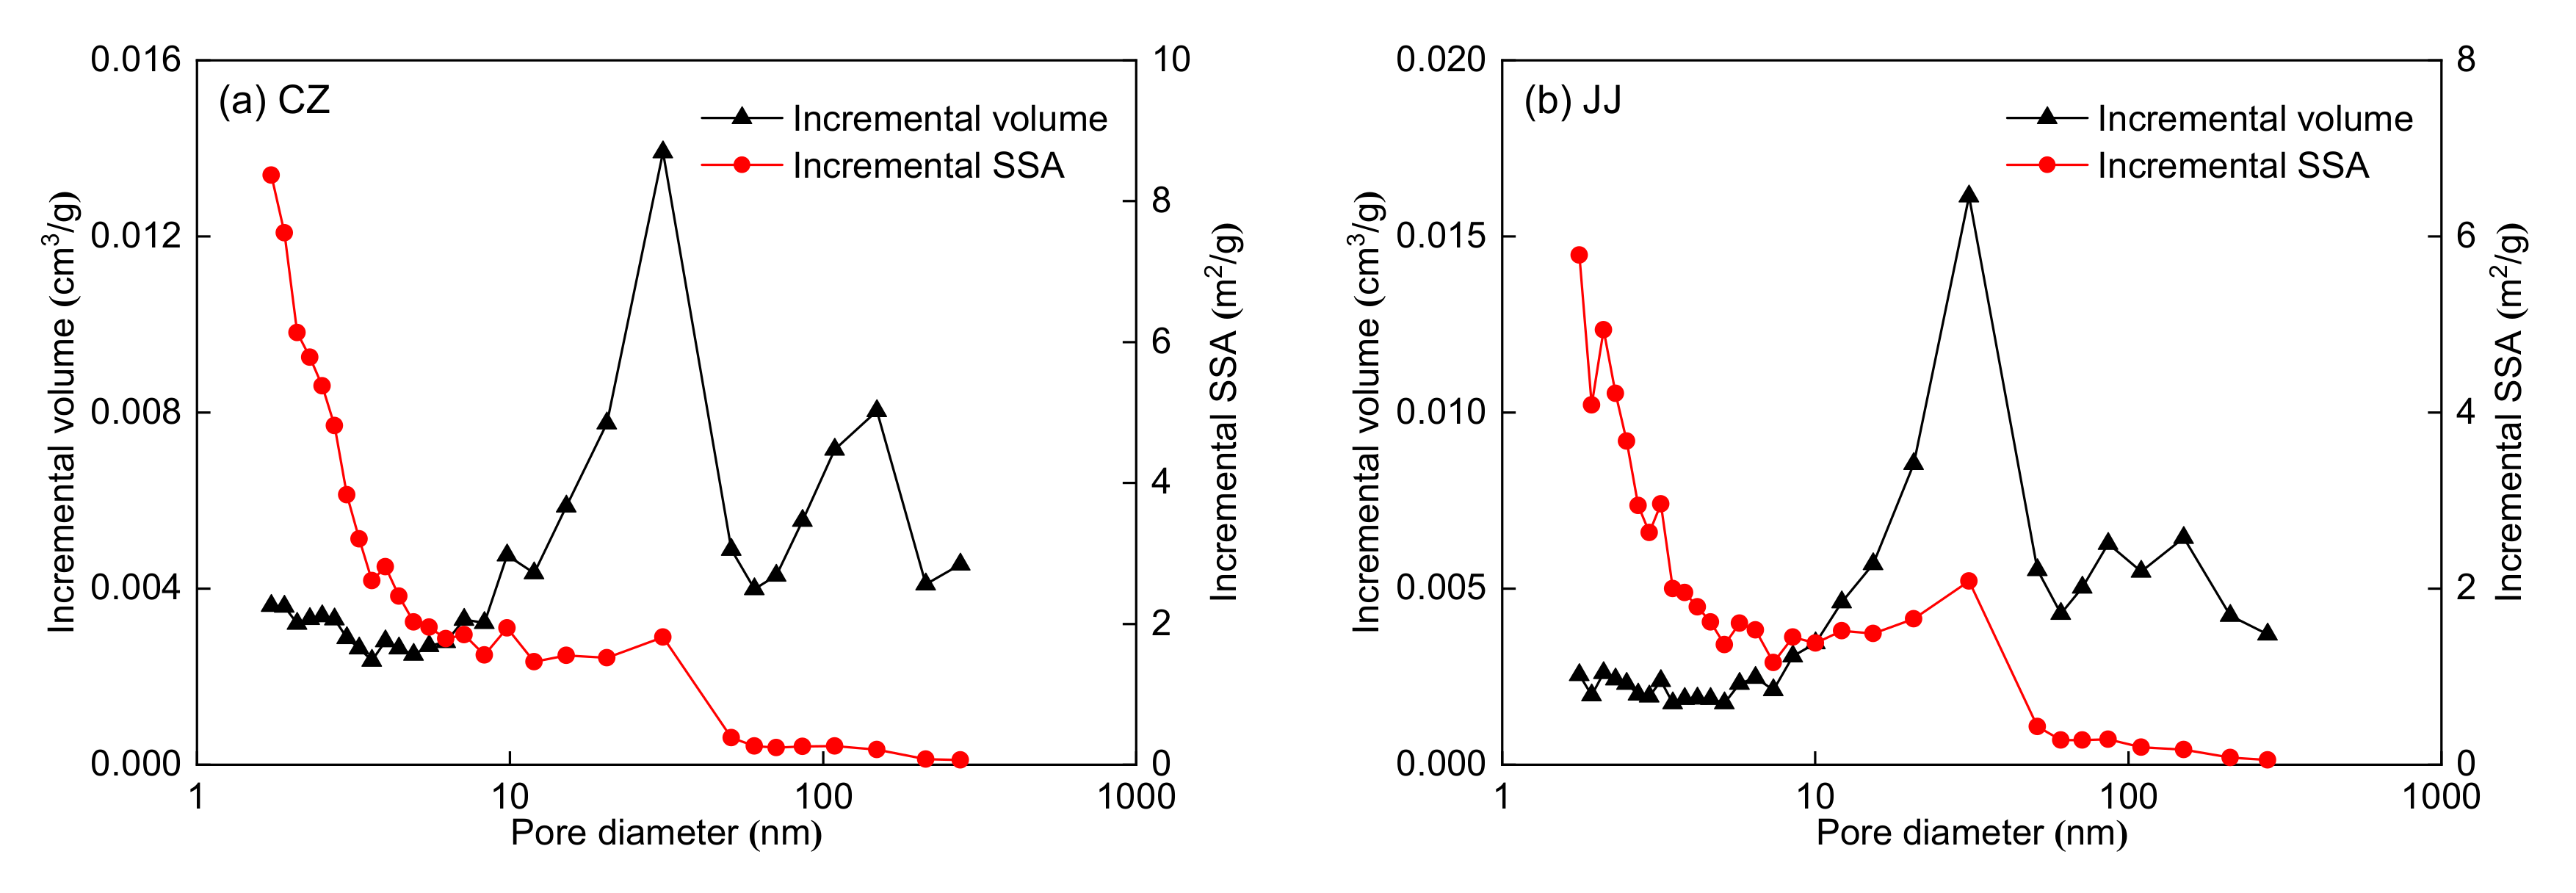
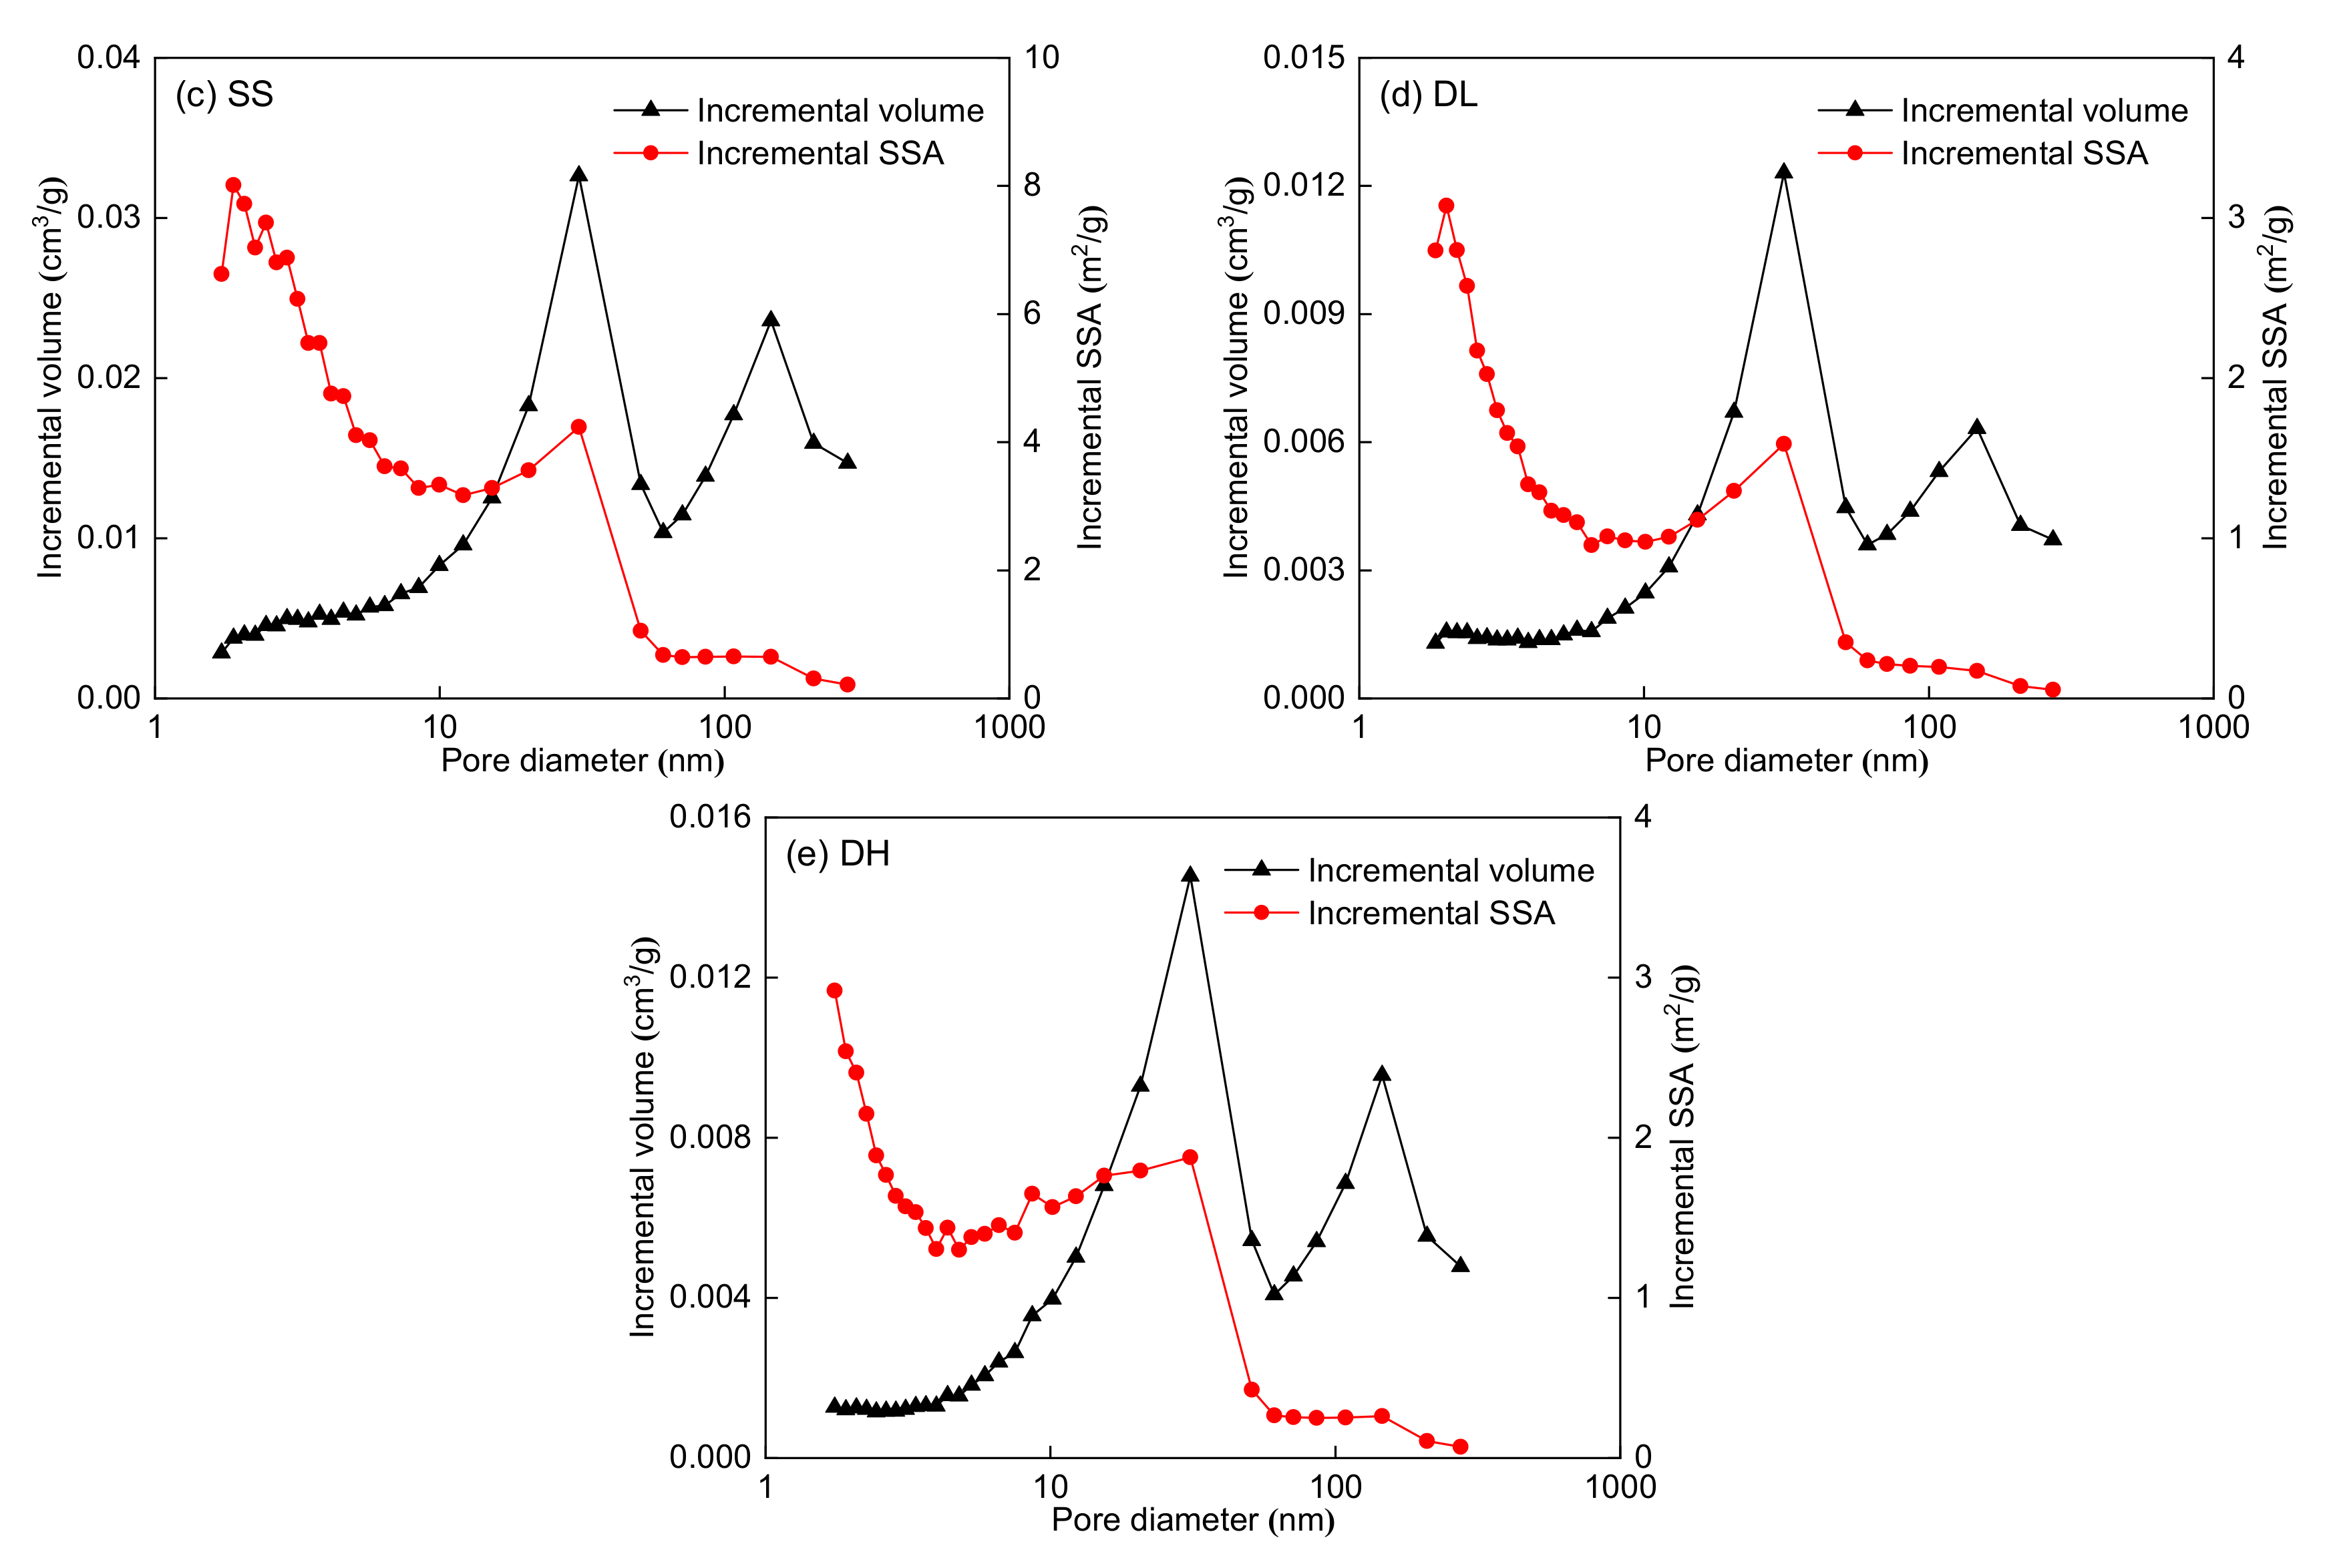
3.1.1. Pore Structure Measurement by LP-N2GA

The N2 adsorption-desorption isotherms of the five coal samples at 77 K are shown in Figure 1 and can be classified as a type II isotherm based on the IUPAC [23]. The adsorption curves show a slow increase at a low relative pressure and a rapid increase at a high relative pressure. Micropore filling (p/p0 < 0.1) and multilayer adsorption (0.4 < p/p0 < 0.8) phenomena appear at a low relative pressure. When the relative pressure is higher than 0.8, N2 starts to concentrate, and the adsorption volume grows suddenly with increasing relative pressure. Except for the DH coal sample, there are significant hysteresis loops among the adsorption-desorption isotherms. Because semi-open pores do not form hysteresis loops [23], the DH coal sample may have some semi-open pores. According to IUPAC, the type of loops for the CZ, JJ, SS, and DL coal samples can be classified as type H3. When the relative pressure is within 0.5–1, there are narrow hysteresis loops among these isotherms, indicating that the pore type is a parallel plate or cylinder [23].
The pore structure parameters obtained by LP-N2GA are shown in Table 3. Notably, the SSA and pore volume range from 36.96 to 118.40 m2/g and 0.0902 to 0.2865 cm3/g, respectively. The SSA and pore volume of the SS coal sample are the largest, while the SSA and pore volume of the DL coal sample are the smallest. As seen in Table 3, mesopores (2–50 nm) contribute the most to the SSA for all five coal samples, followed by micropores (1.7–2 nm). In addition, mesopores (2–50 nm) also contribute the most to pore volume for the five coal samples, followed by macropores (>50 nm). The pore volume and SSA distributions are shown in Figure 2. Figure 2 shows that the LP-N2GA can measure the pores within 1.7–300 nm. The incremental SSA value at 1.7–50 nm is higher than that at 50–300 nm, indicating that micropores and mesopores develop and contribute mainly to the specific surface area. The incremental volume value at 10–100 nm is higher than that of the other pore sizes, indicating that mesopores in this range contribute the most to pore volume.

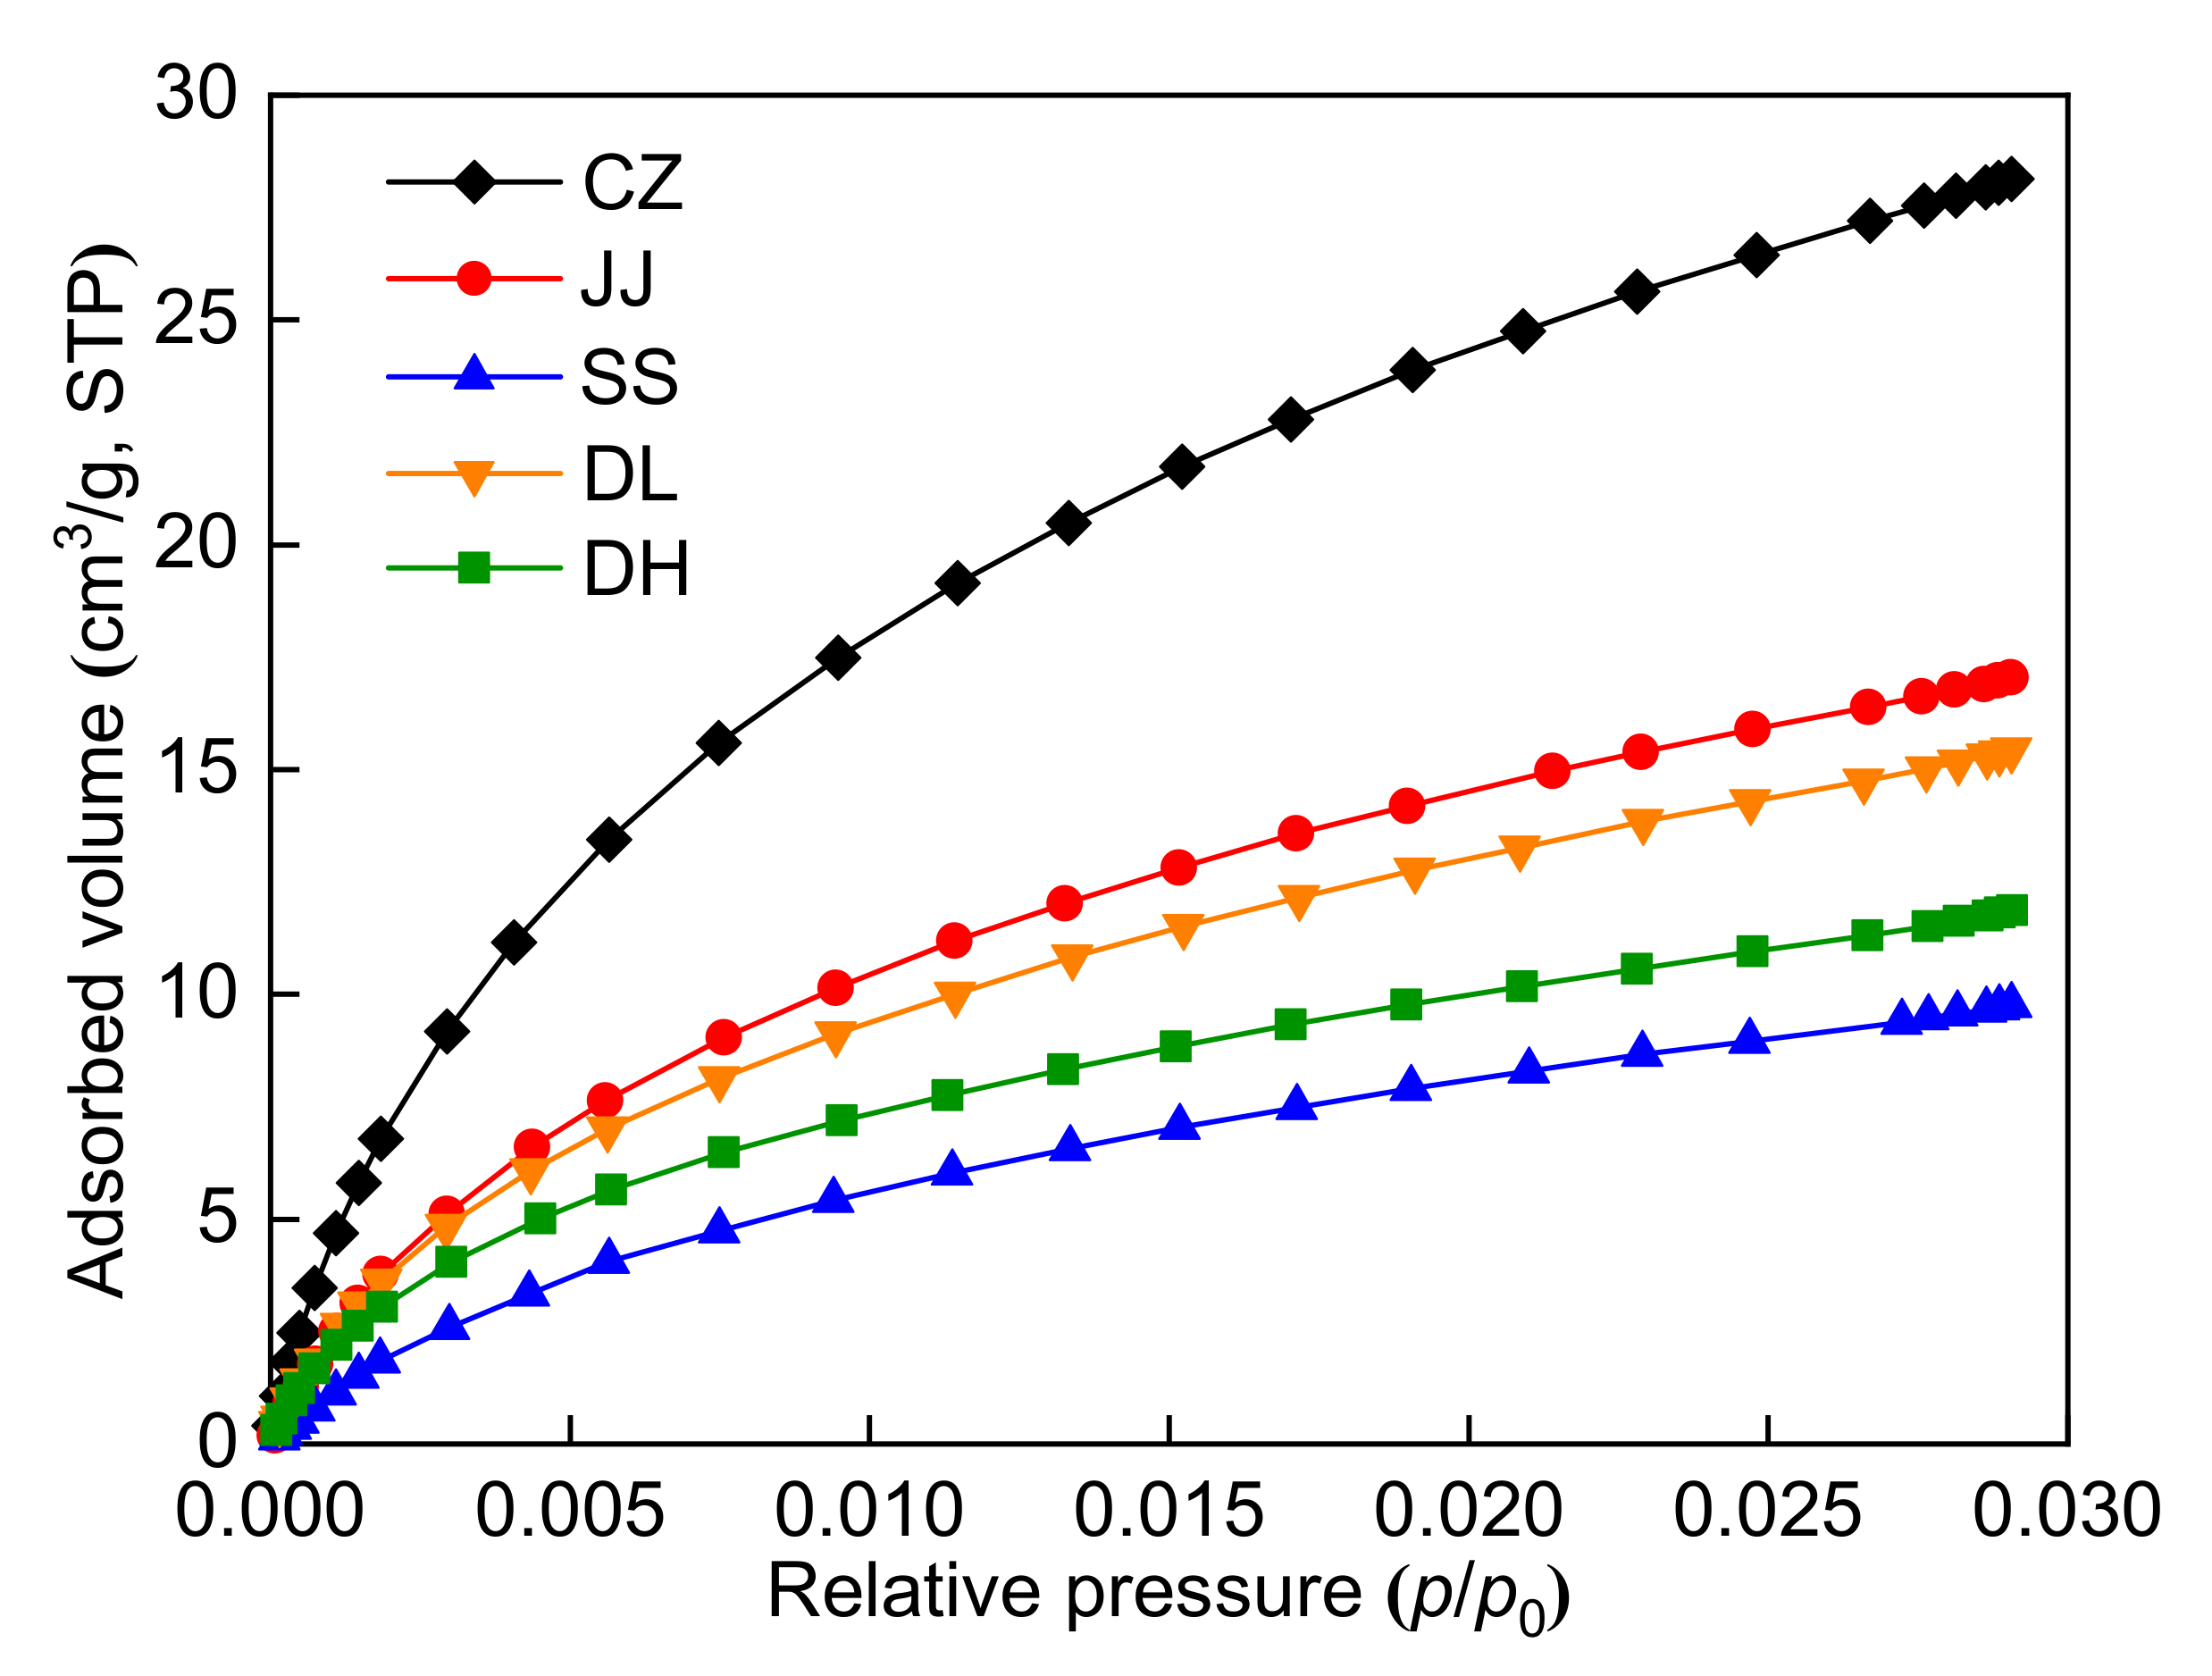
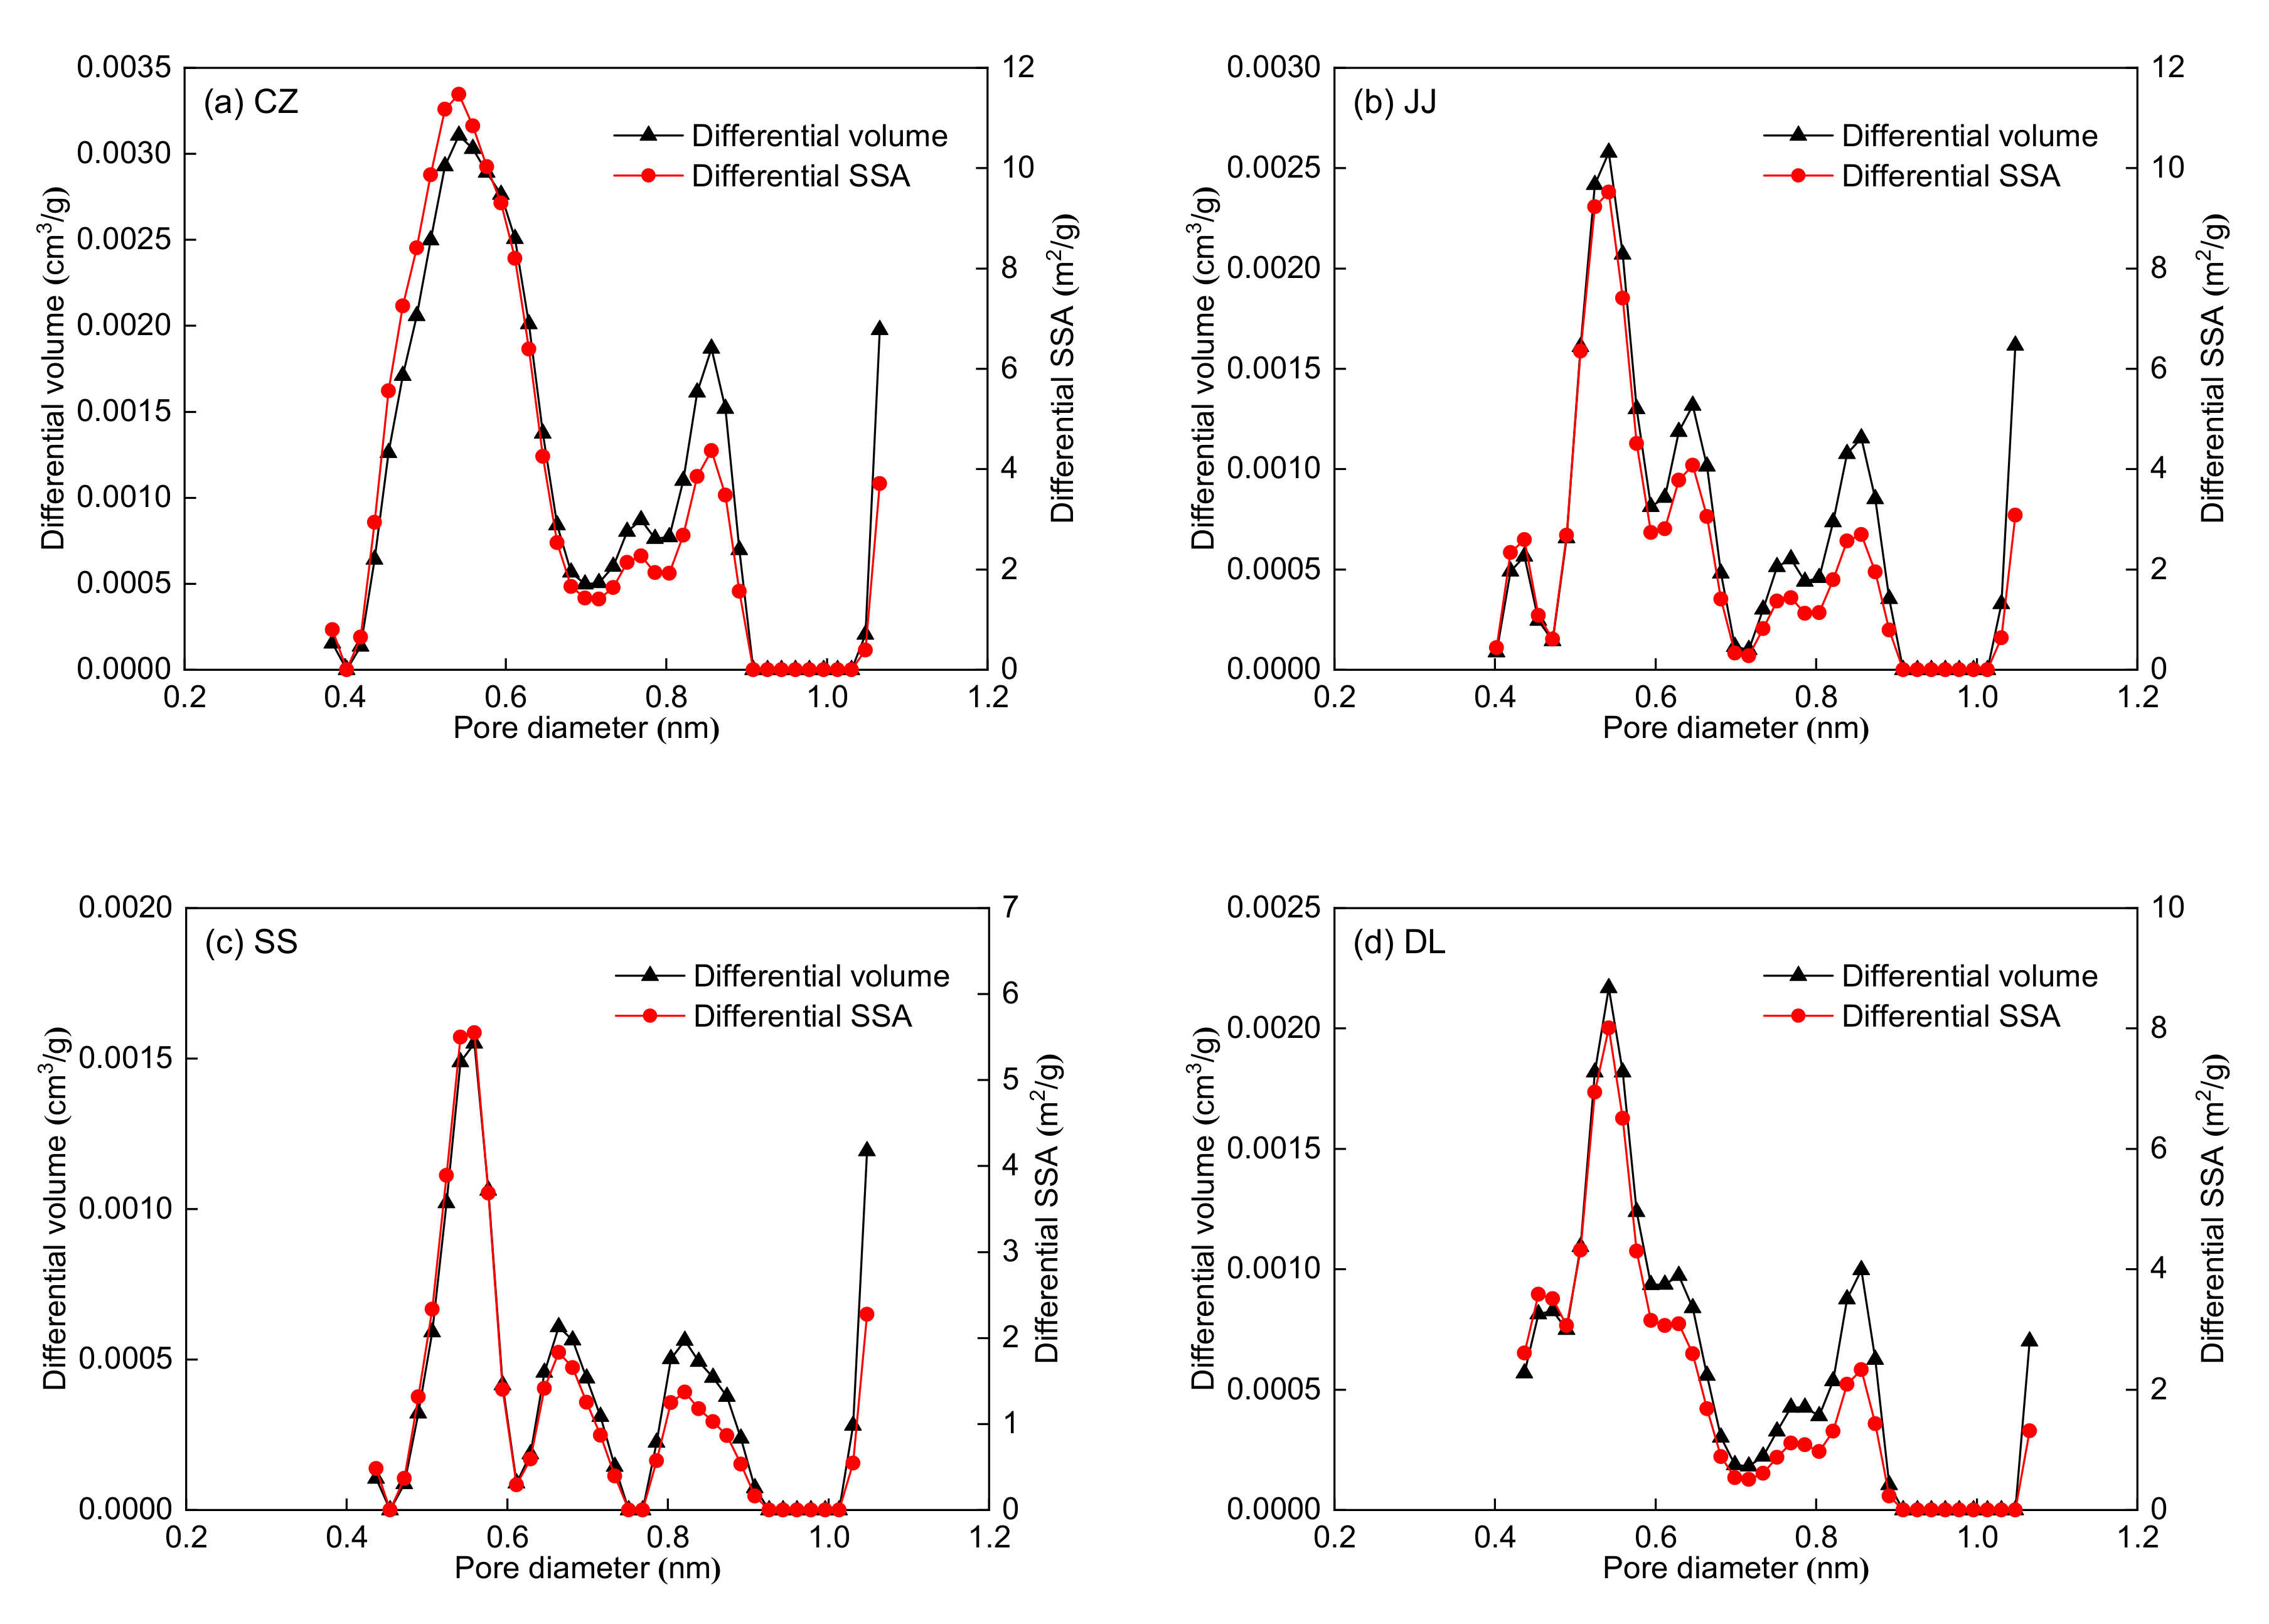
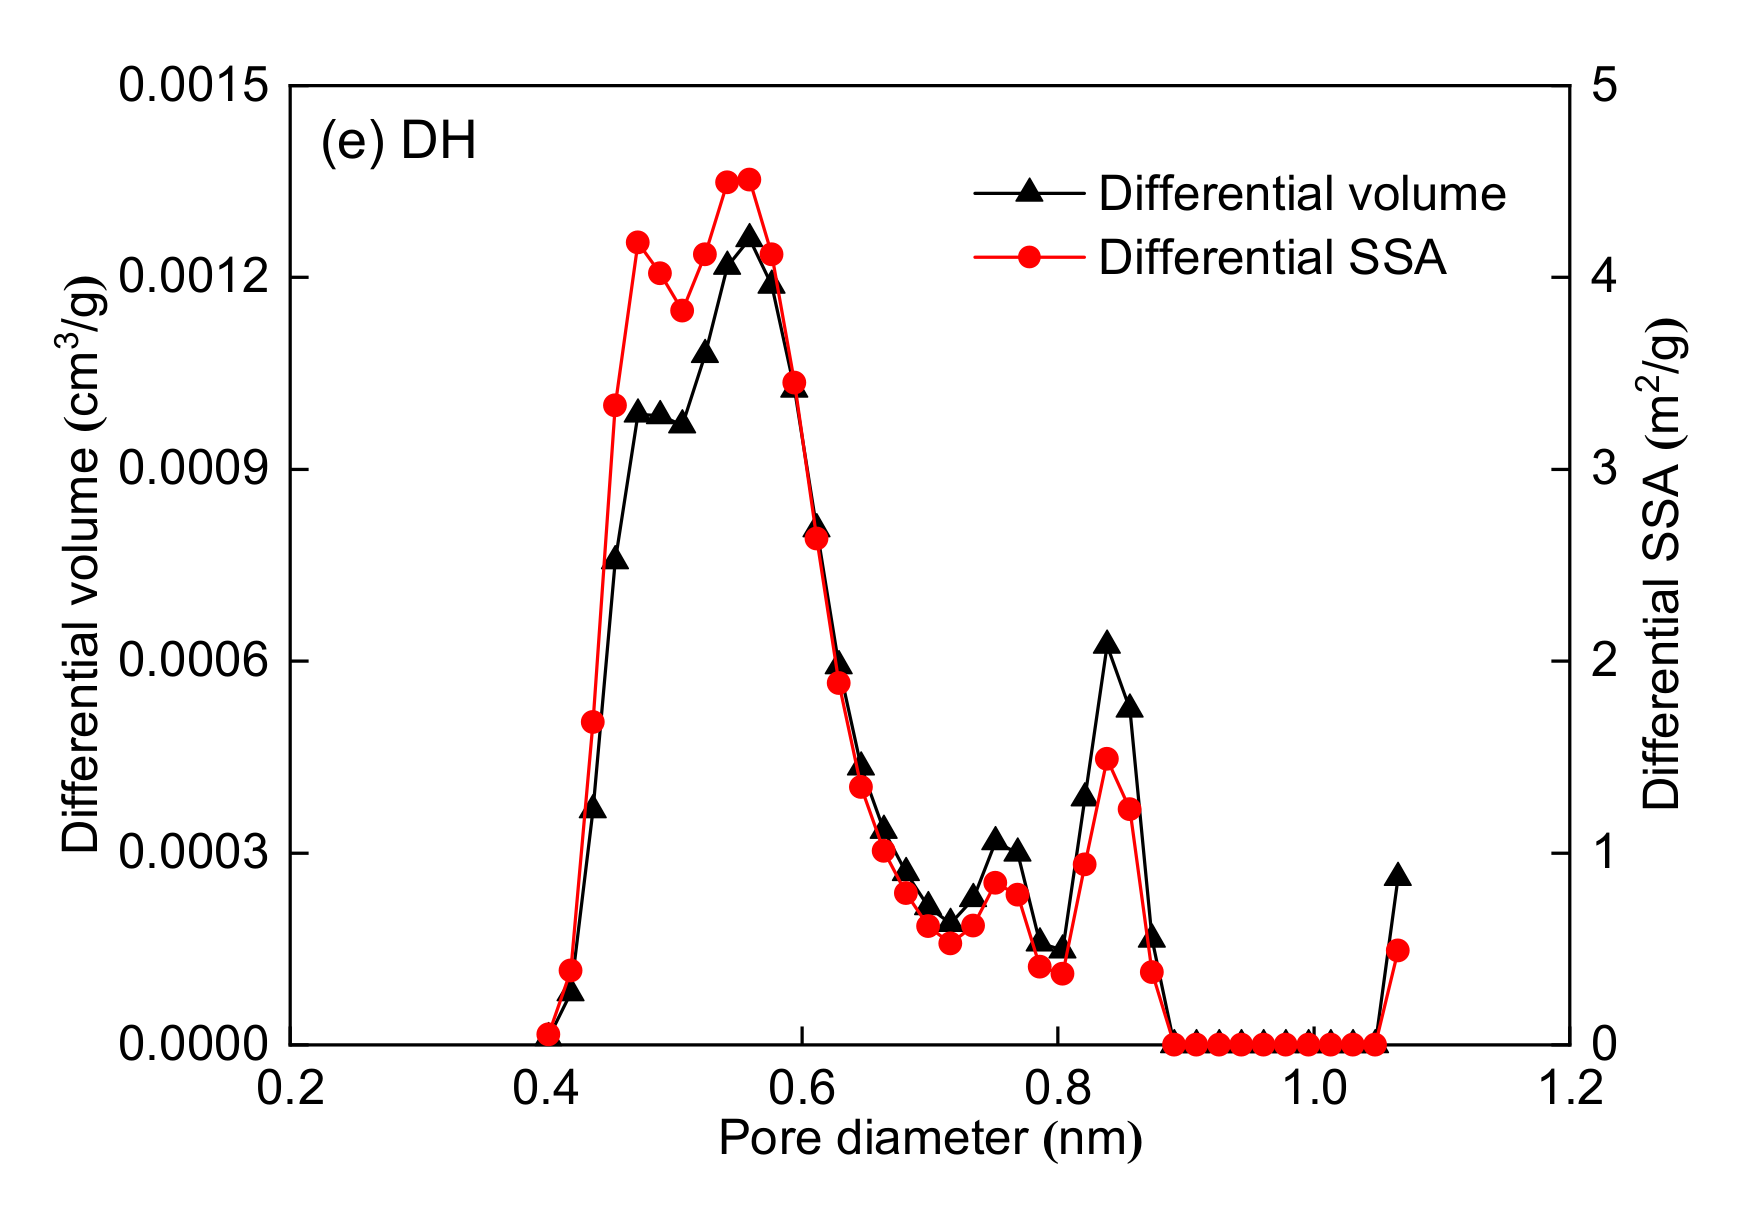
3.1.2. Pore Structure Measurement by LP-CO2GA

Figure 3 shows that the CO2 adsorption isotherms of the five coal samples at 273.15 K increase slowly with increasing pressure, and all of them have a slightly convex shape. The pore structure parameters calculated by LP-CO2GA are shown in Table 4. Notably, the SSA and pore volume range from 42.60 to 144.14 m2/g and 0.0138 to 0.0443 cm3/g, respectively. The SSA and pore volume of the CZ coal sample are the largest, while the SSA and pore volume of the SS coal sample are the smallest. These results show that the micropores of the CZ coal sample are more developed, and the micropores of the SS coal sample are poorly developed.
The pore volume and SSA distributions are shown in Figure 4. Figure 4 shows that the LP-CO2GA can measure micropores within 0.38–1.14 nm. The PSD lines of the five coal samples show a multi-peak type, and the main peaks are at 0.5–0.6 nm. The dynamic diameter of methane is 0.38 nm; therefore, methane can only access pores larger than 0.38 nm. According to the dynamic diameter of methane, the pore structure can be divided into two parts, as shown in Table 4. The pore diameter range of the first part is 0.38–0.76 nm, which is one to two times the dynamic diameter of methane. The pore diameter range of the second part is 0.76–1.14 nm, which is two to three times the dynamic diameter of methane. Table 4 shows that the SSA and pore volume of the 0.38–0.76 nm micropores are significantly larger than those of 0.76–1.14 nm. Moreover, the 0.38–0.76 nm micropores are the main contributors to the SSA and pore volume of the five coal samples.

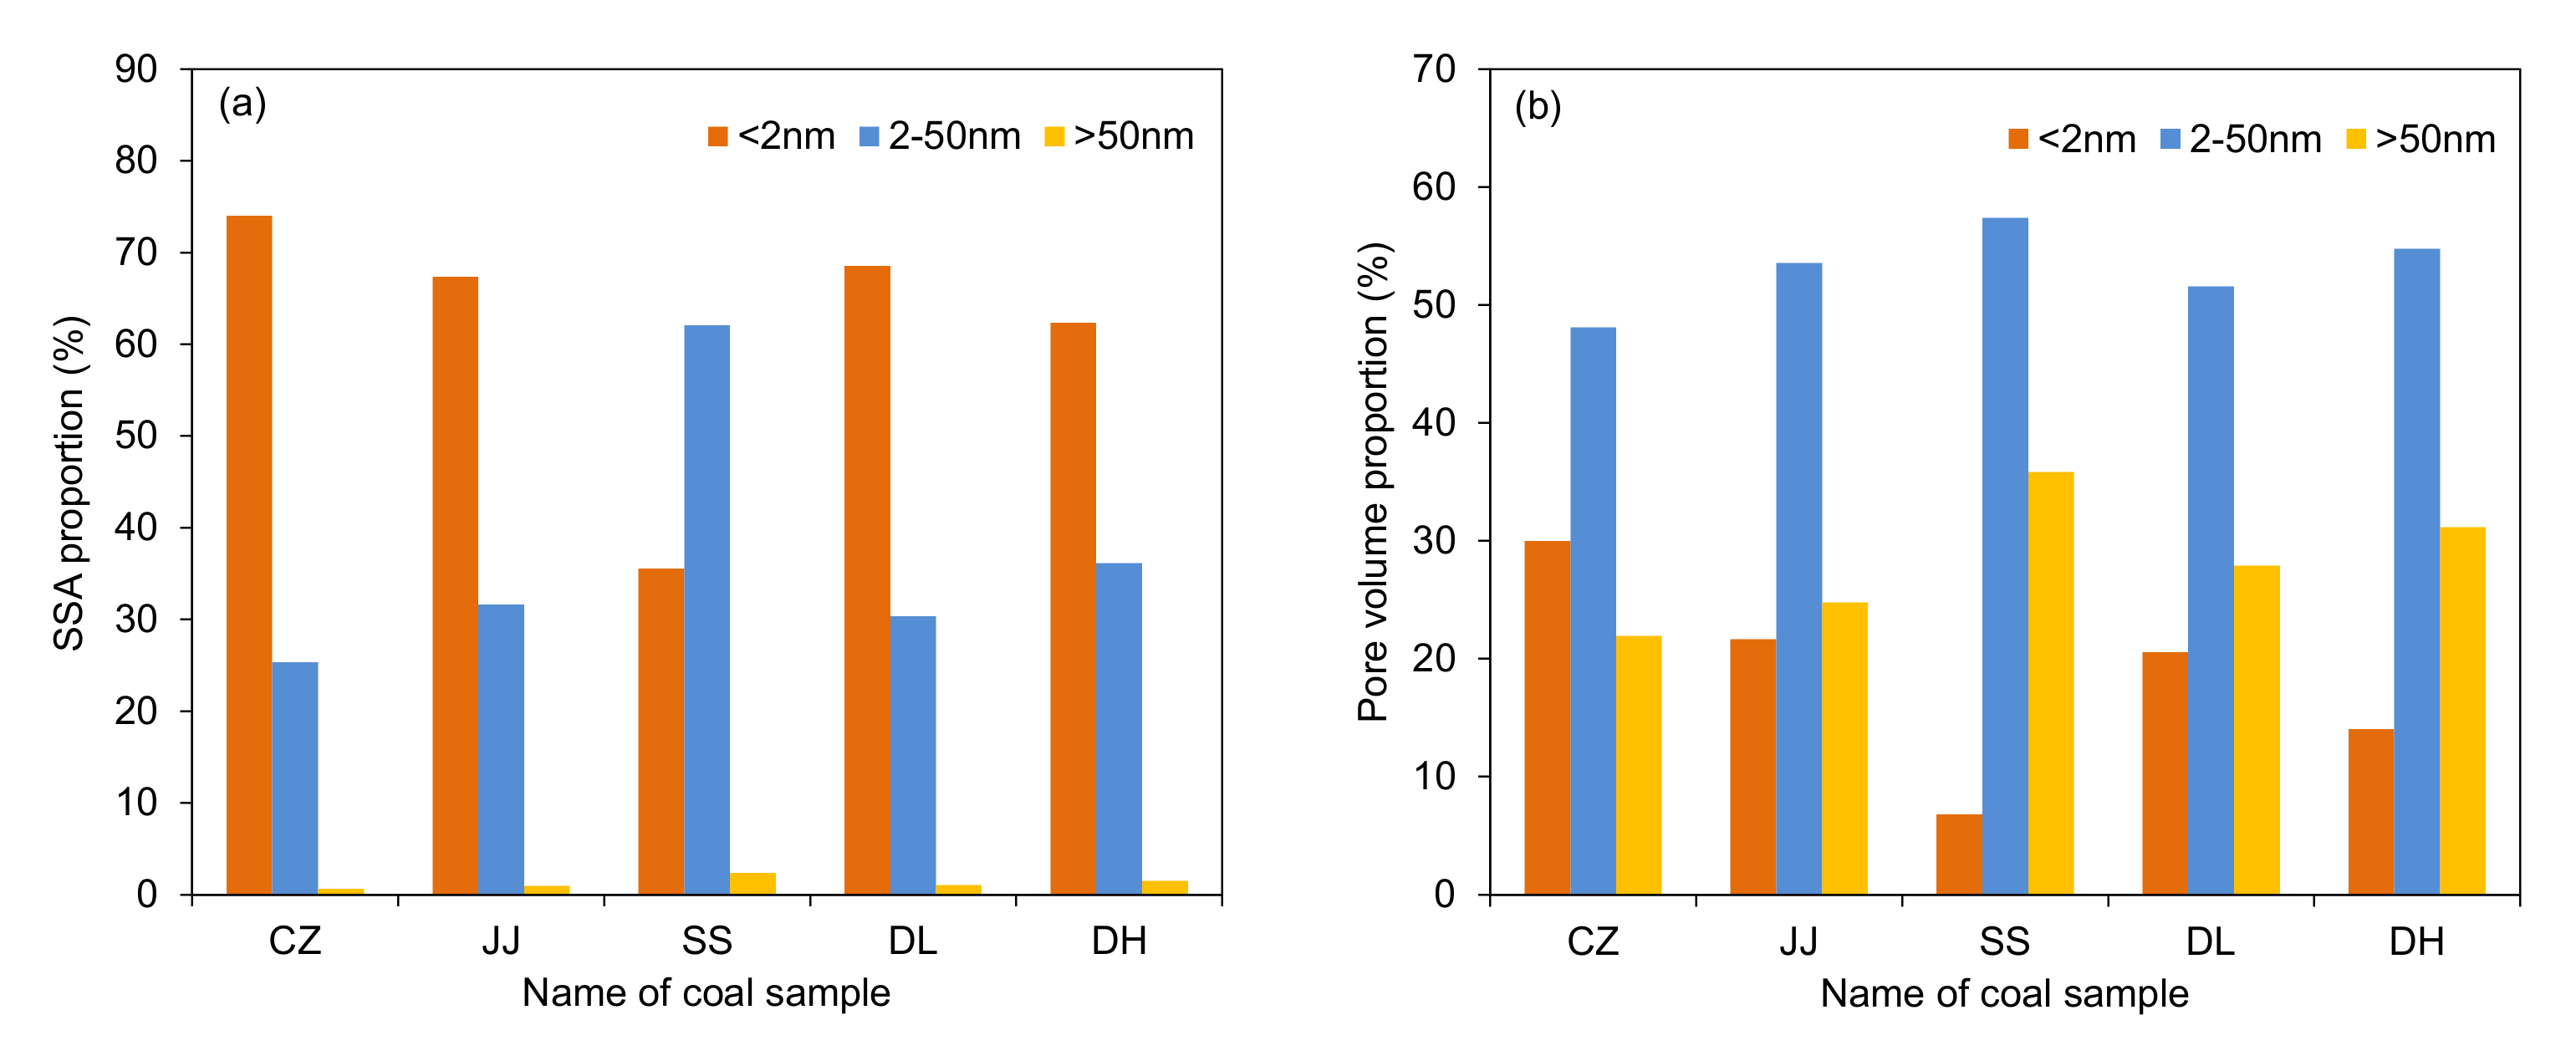
3.1.3. Comprehensive Pore Structure Obtained by LP-N2GA and LP-CO2GA

In this study, the pore structure parameters were obtained by combining the results of LP-N2GA and LP-CO2GA. According to the test range, both LP-N2GA and LP-CO2GA were used to characterise micropores (<2 nm), and only LP-N2GA was used to characterise mesopores (2–50 nm) and macropores (>50 nm). The comprehensive pore structure parameters are shown in Table 5. Notably, the total SSA and pore volume range from 96.25 to 216.25 m2/g and 0.1119 to 0.3003 cm3/g, respectively. The SSA of the CZ coal sample is the largest, whereas the SSA of the DH coal sample is the smallest. The pore volume of the SS coal sample is the largest, whereas the pore volume of the DL coal sample is the smallest. Figure 5 shows the SSA and pore volume ratios for the different pore types. From Table 5 and Figure 5, it can be seen that micropores (<2 nm) are the major contributors to SSA for the CZ, JJ, DL, and DH coal samples, followed by mesopores (2–50 nm). Mesopores are the largest contributors to SSA for the SS coal sample, followed by micropores. Moreover, mesopores contribute the most to the pore volume in all the five coal samples.

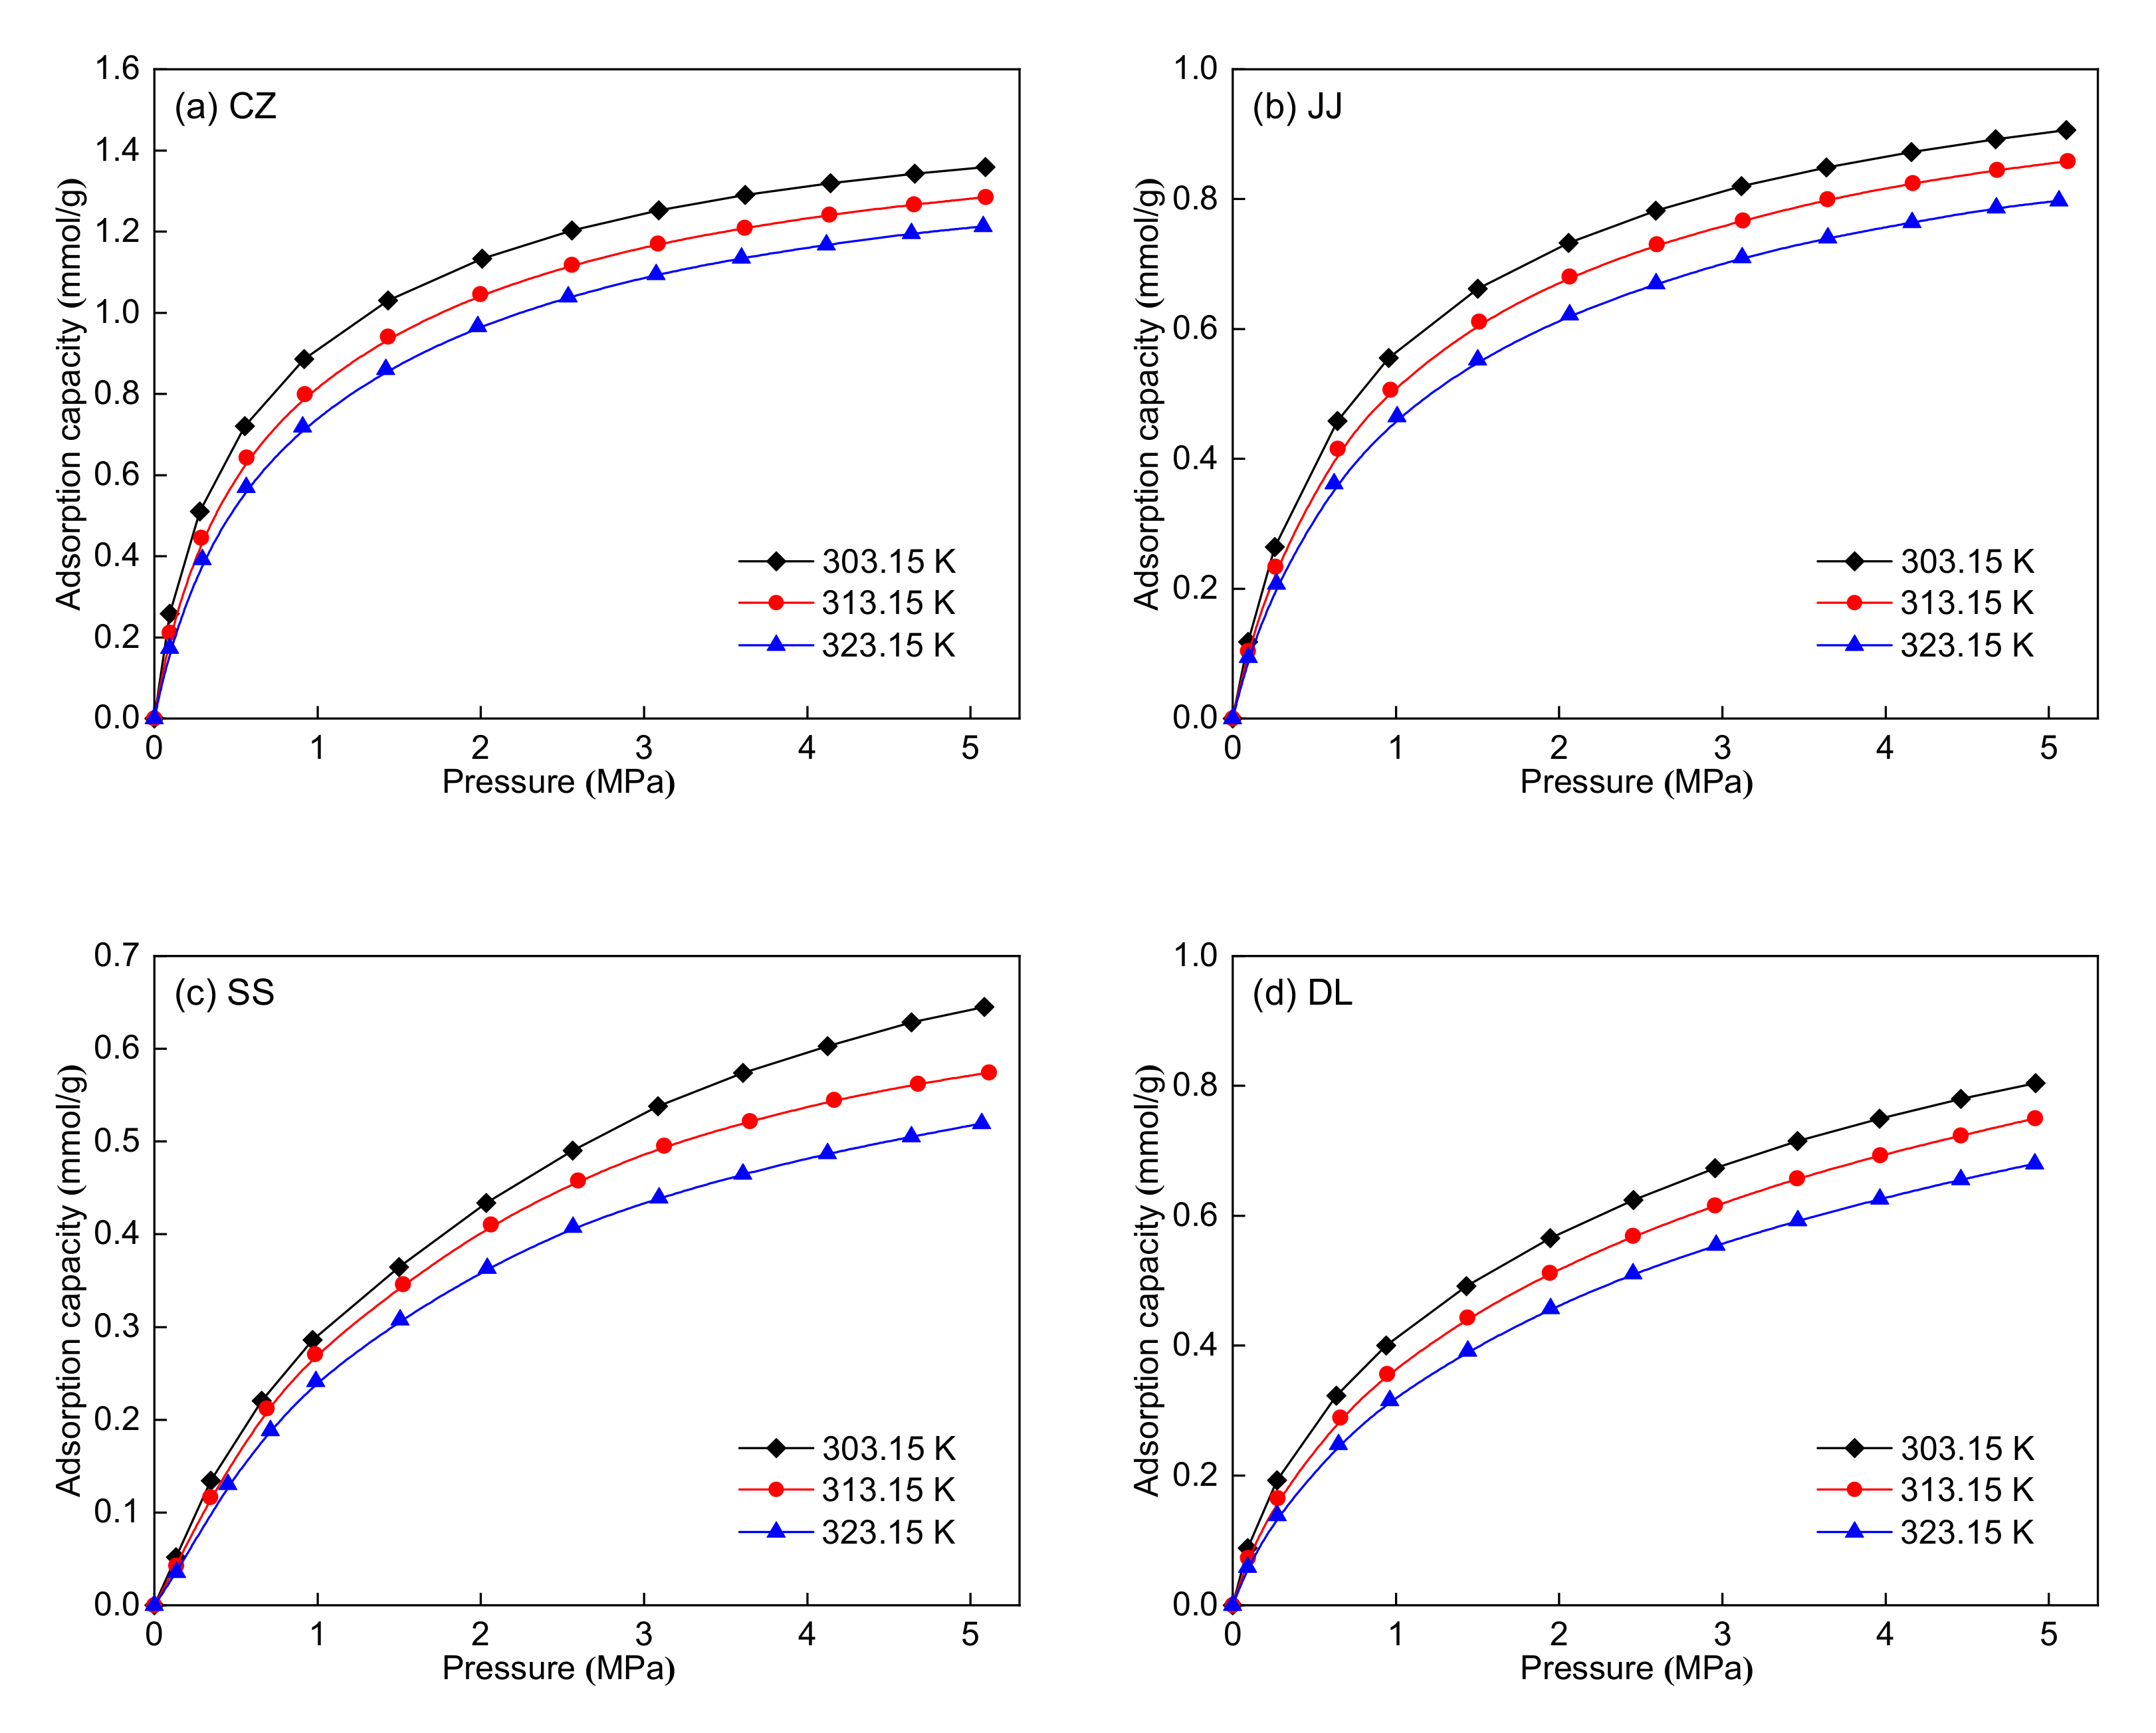
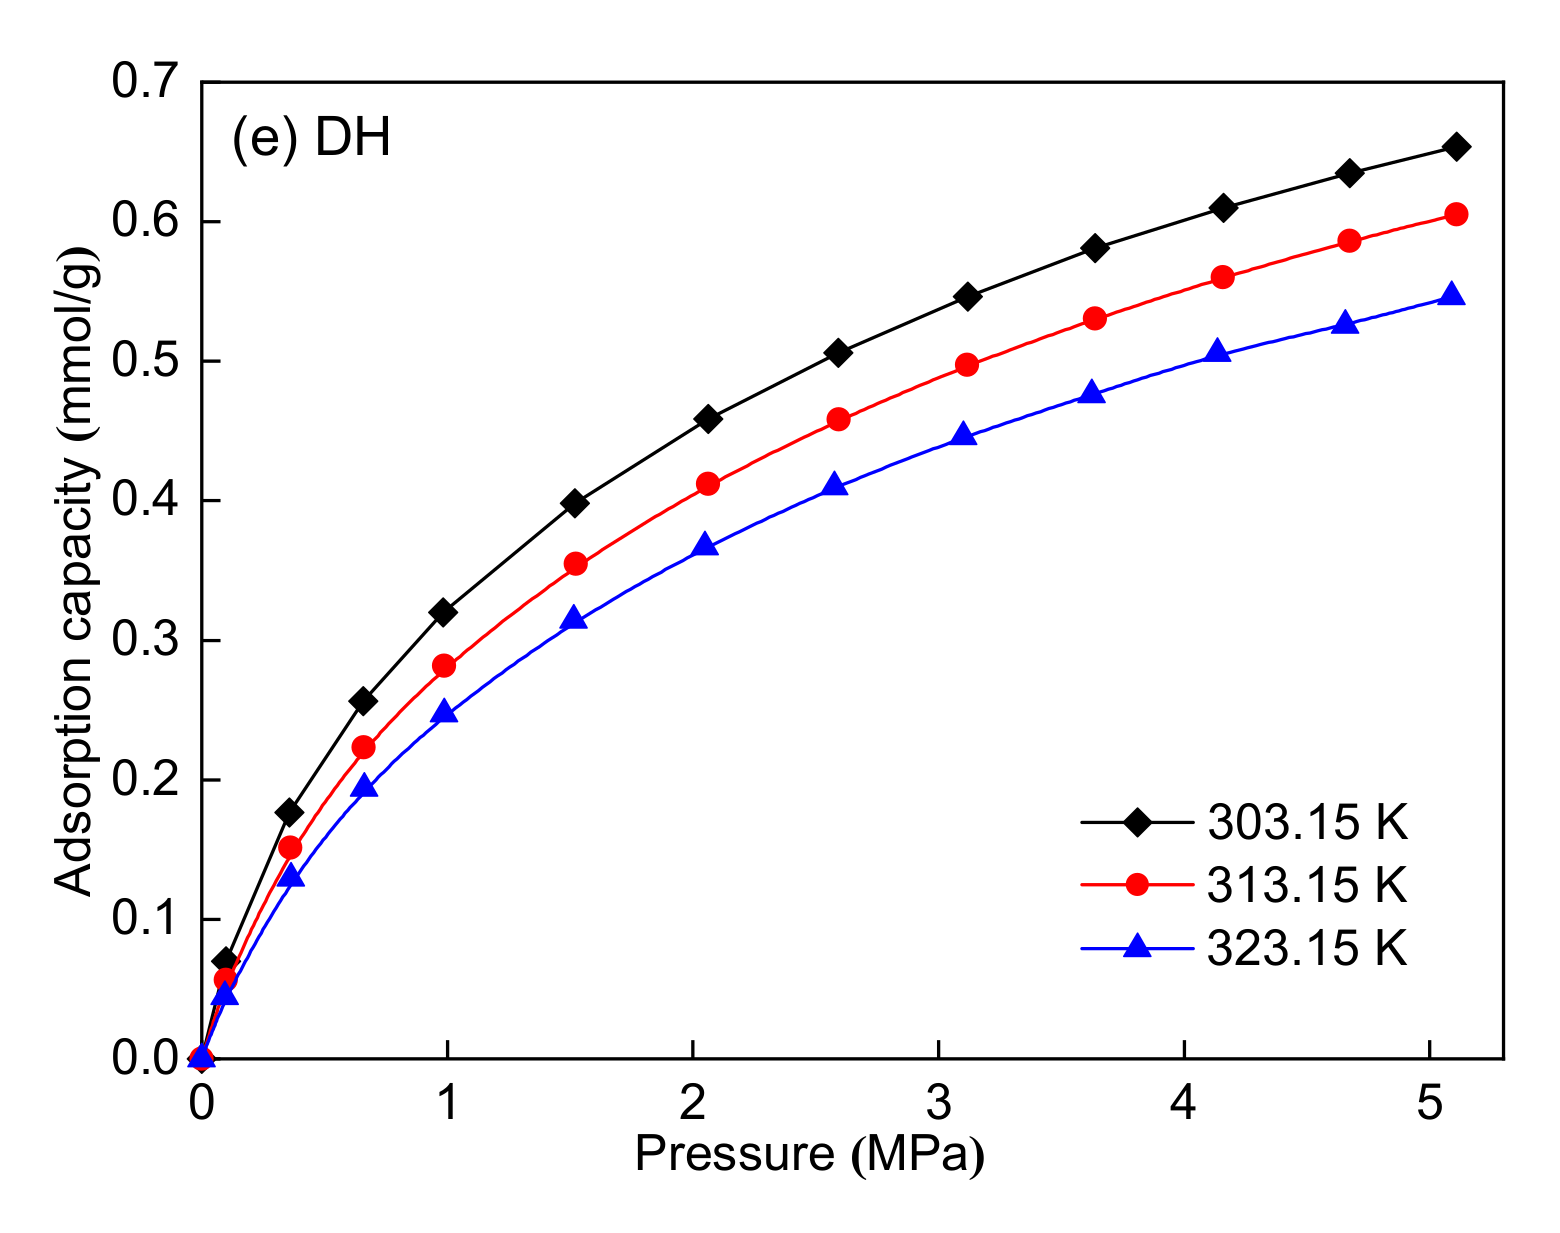
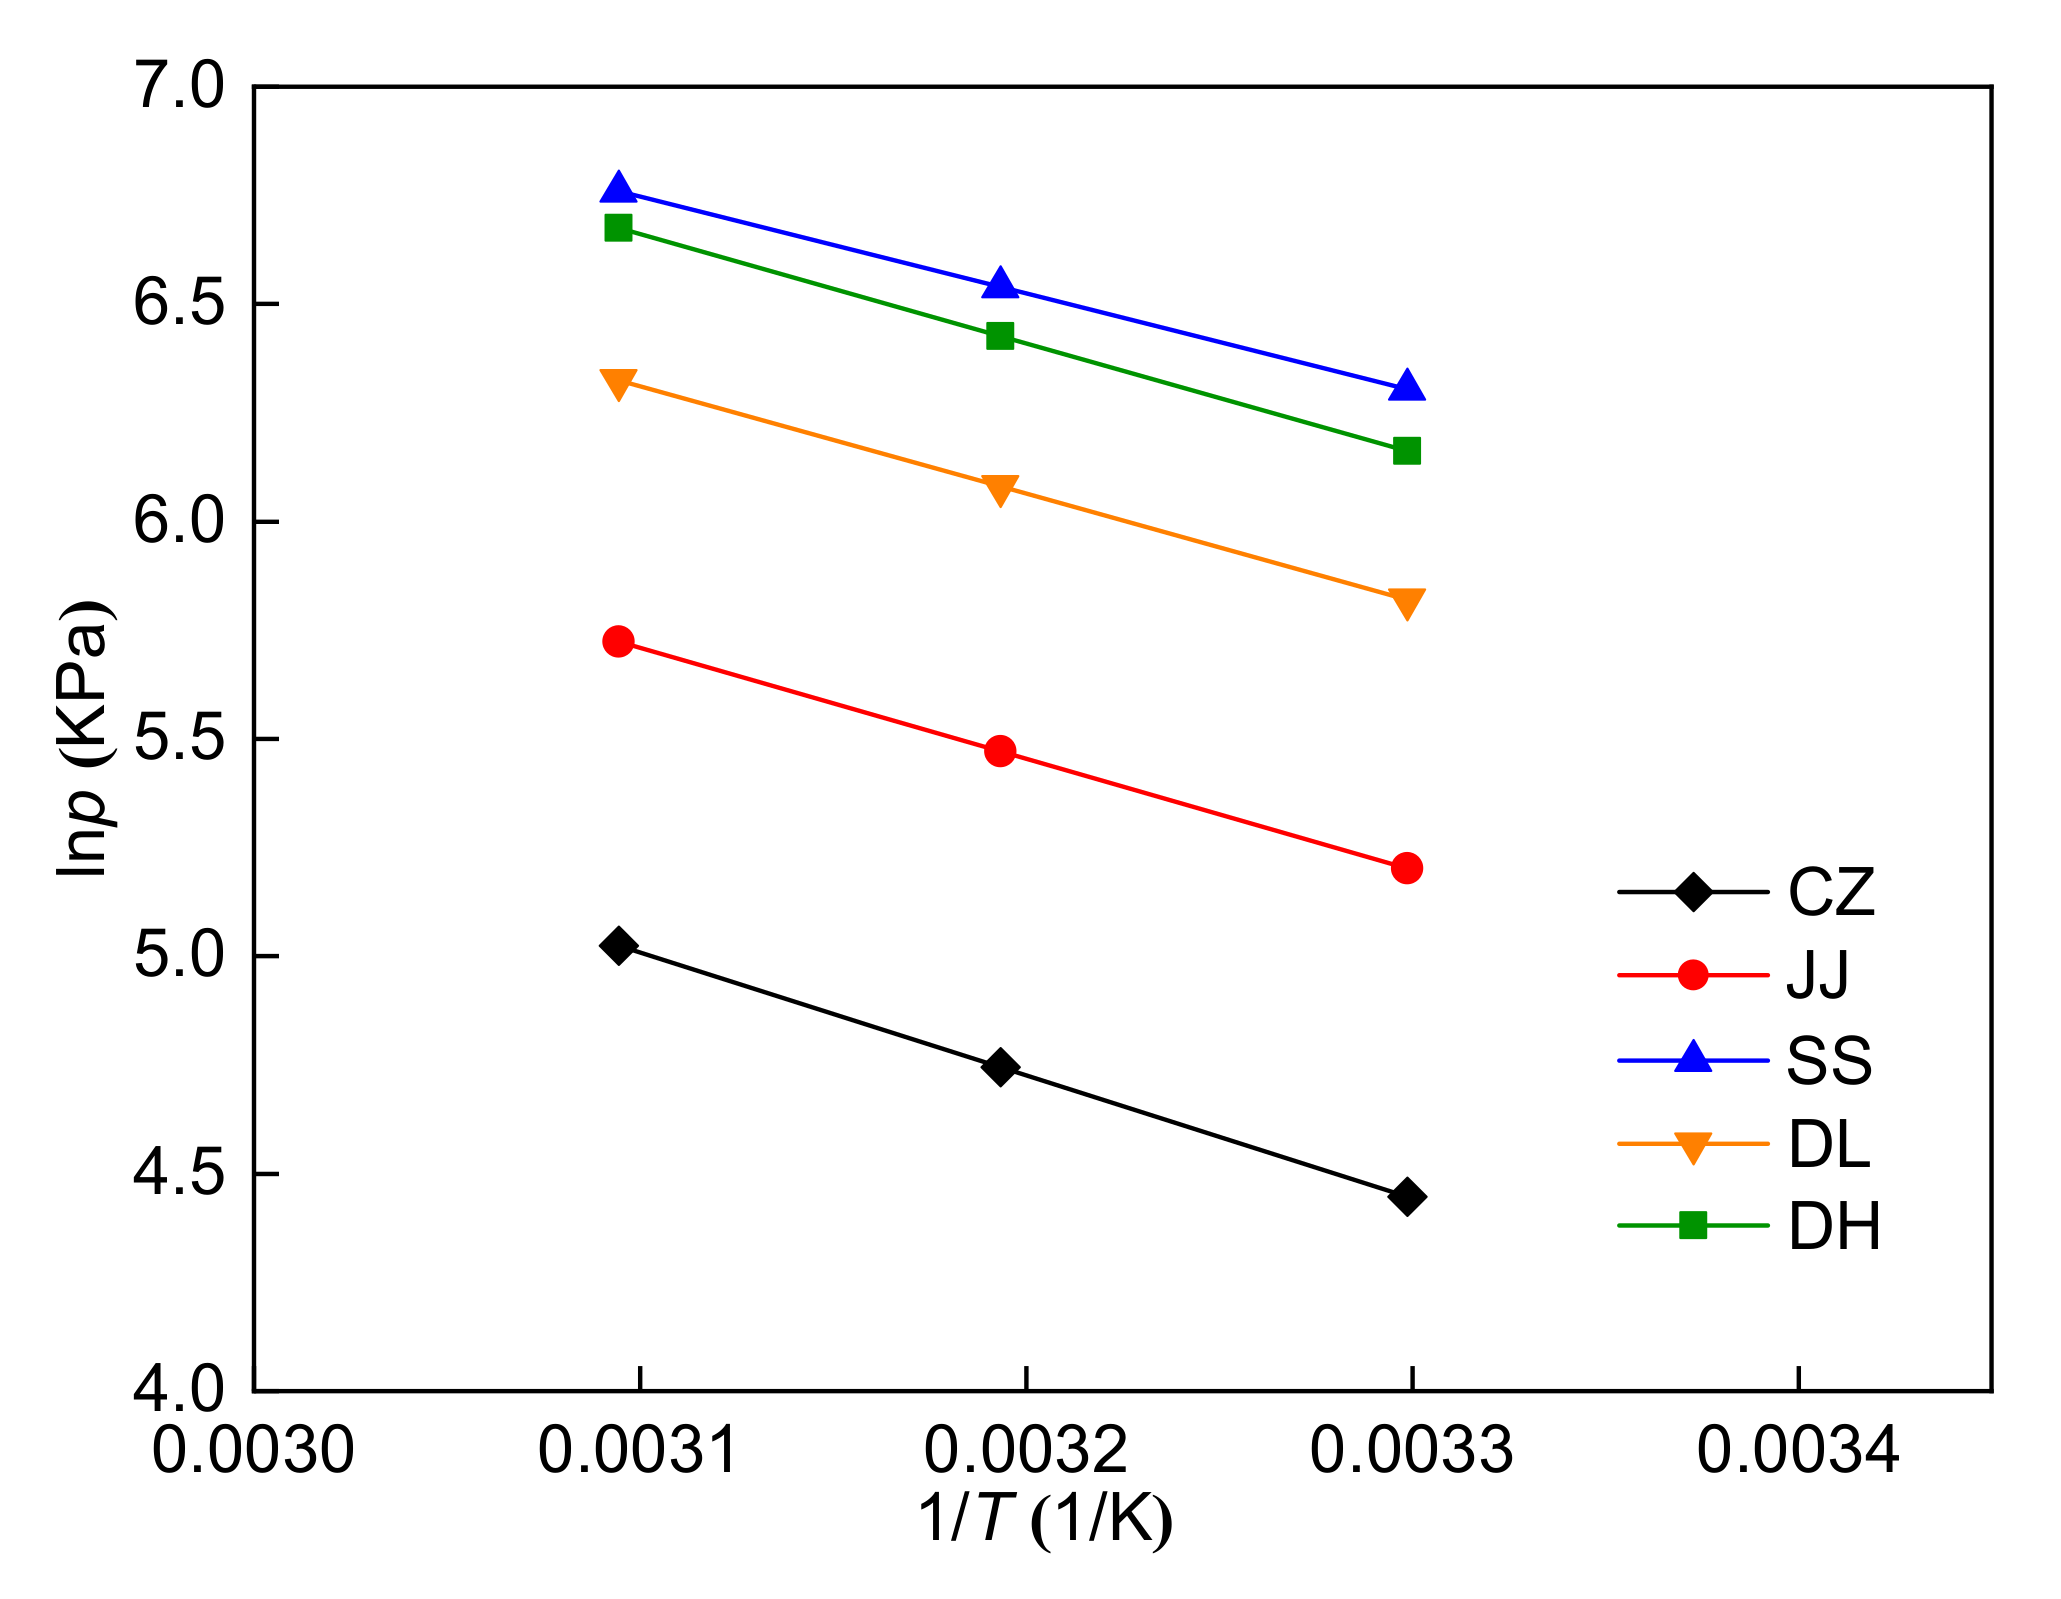
3.2. Methane Adsorption Capacity and Adsorption Heat

Figure 6 shows the methane adsorption isotherms of the five coal samples at three different temperatures. For the five coal samples, the adsorption capacity first increases rapidly and then increases slowly with increasing pressure from 0 MPa to 5 MPa. Moreover, the adsorption capacity decreases with increasing temperature. The adsorption isotherms at three different temperatures were simultaneously fitted using the Langmuir equation for each coal sample. The 1stOpt 6.0 fitting software was used to process the experimental data, and the fitted parameters are listed in Table 6. Table 6 shows that the Langmuir equation fits the adsorption isotherms well with R2 > 0.99. The maximum adsorption capacity (nm) can be used for the evaluation of the adsorption ability of coal seams. The maximum adsorption capacity ranges from 0.84 to 1.45 mmol/g. The CZ coal sample has the highest maximum adsorption capacity, whereas the SS coal sample has the lowest. The maximum adsorption capacity decreases with the reduction of coal rank for the CZ, JJ, SS, and DH coal samples, indicating that coal rank has a certain influence on the adsorption capacity. In addition, the maximum adsorption capacity has no clear relationship with the maceral composition of the five coal samples. The isometric adsorption lines (lnp vs. 1/T at a fixed adsorption capacity, 0.2 mmol/g in this study) are plotted in Figure 7, and the adsorption heat was obtained from the slope of these lines. Table 7 shows that the adsorption heat ranges from 18.61 to 23.50 kJ/mol. The CZ coal sample has the highest adsorption heat, whereas the SS coal sample has the lowest. The adsorption heat decreases first and then increases with the reduction of coal rank for the five coal samples. Similarly, the adsorption heat has no clear relationship with the maceral composition of the five coal samples.

3.3. Effect of Pore Structure on Methane Adsorption

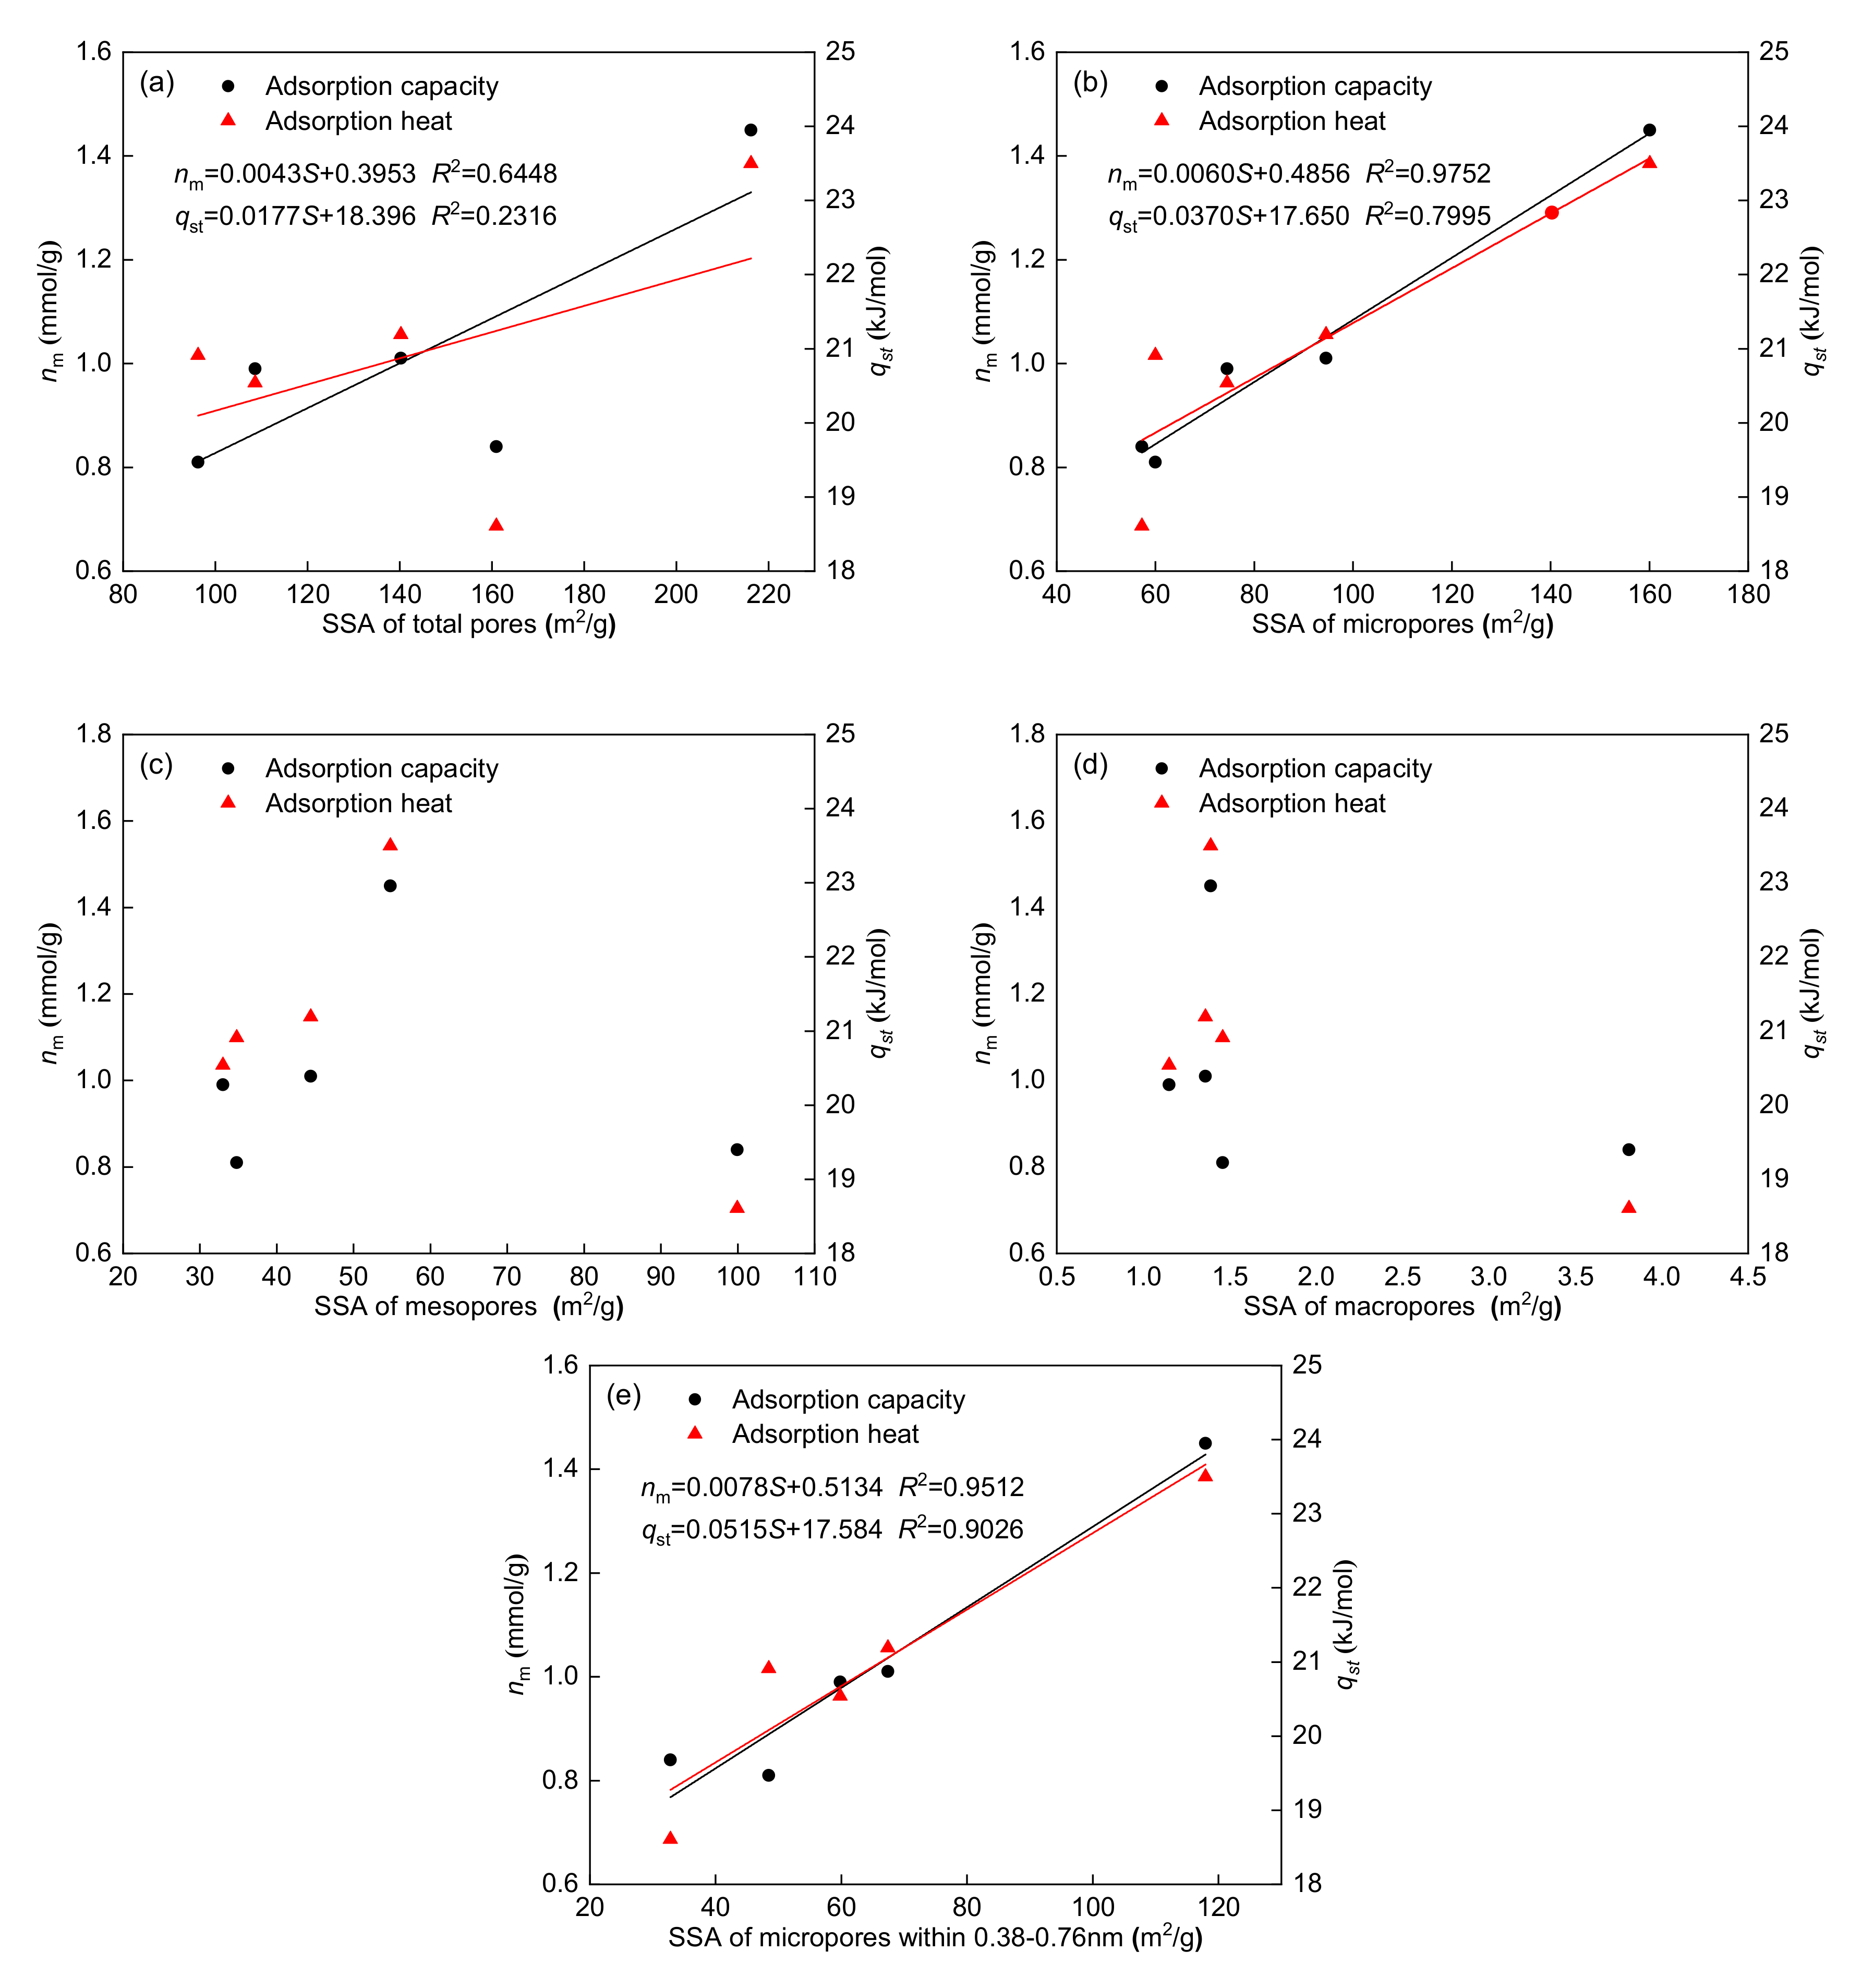
3.3.1. Effect of SSA on Methane Adsorption

Figure 8 shows the relationships between the maximum adsorption capacity and SSA for each pore type (total pores, 0.38–300 nm; micropores, 0.38–2 nm; mesopores, 2–50 nm; macropores, 50–300 nm; and micropores, 0.38–0.76 nm). Figure 8 shows that the maximum adsorption capacity has a strong positive correlation with the SSA of 0.38–2 nm micropores (R2 = 0.9752) and 0.38–0.76 nm micropores (R2 = 0.9512). However, their relationship with the SSA of mesopores and macropores is not evident. These results show that methane is mainly adsorbed on the surface of micropores (<2 nm) in coal, and the SSA of micropores (<2 nm) contributes the most to the adsorption capacity. Table 3 and Table 4 also show that 0.38–0.76 nm micropores occupy the largest proportion of micropores (<2 nm); thus, 0.38–0.76 nm micropores have a stronger influence on methane adsorption capacity. In addition, the maximum adsorption capacity has a positive correlation with the SSA of total pores (R2 = 0.6448), indicating that mesopores and macropores may provide mild adsorption sites.
The adsorption heat reflects the interaction energy of methane with the coal surface at each adsorption site. The relationships between the adsorption heat and SSA for each pore type are also shown in Figure 8. Notably, the adsorption heat has a significant positive correlation with the SSA of 0.38–2 nm micropores (R2 = 0.7995) and 0.38–0.76 nm micropores (R2 = 0.9026), whereas the adsorption heat has no clear relationship with the SSA of mesopores and macropores. These results show that micropore SSA has a strong influence on the adsorption heat. Because of the potential energy overlap between methane molecules and micropore walls, the interaction energy of methane with the coal surface was enhanced [37], which increased the adsorption heat. The adsorption energy of micropore walls can reach twice that of flat surfaces when the distance between the micropore walls is approximately the gas dynamic diameter [38]. The adsorption energy of micropore walls can be higher than that of flat surfaces when the distance between the micropore walls is larger than the gas dynamic diameter. With increasing pore size, this potential energy overlapping effect will be reduced gradually. According to the dynamic diameter of methane, micropores within 0.38–0.76 nm can contain 1–2 methane molecules along the pore diameter direction. Therefore, the overlapping effect of the adsorption energy in micropores (0.38–0.76 nm) is stronger, and the corresponding adsorption heat is higher. Figure 8 shows that the correlation (R2 = 0.9026) between adsorption heat and SSA of micropores within 0.38–0.76 nm is higher than that (R2 = 0.7995) between adsorption heat and SSA of micropores within 0.38–2 nm. Thus, 0.38–0.76 nm micropores play a dominant role in determining the adsorption heat of methane.

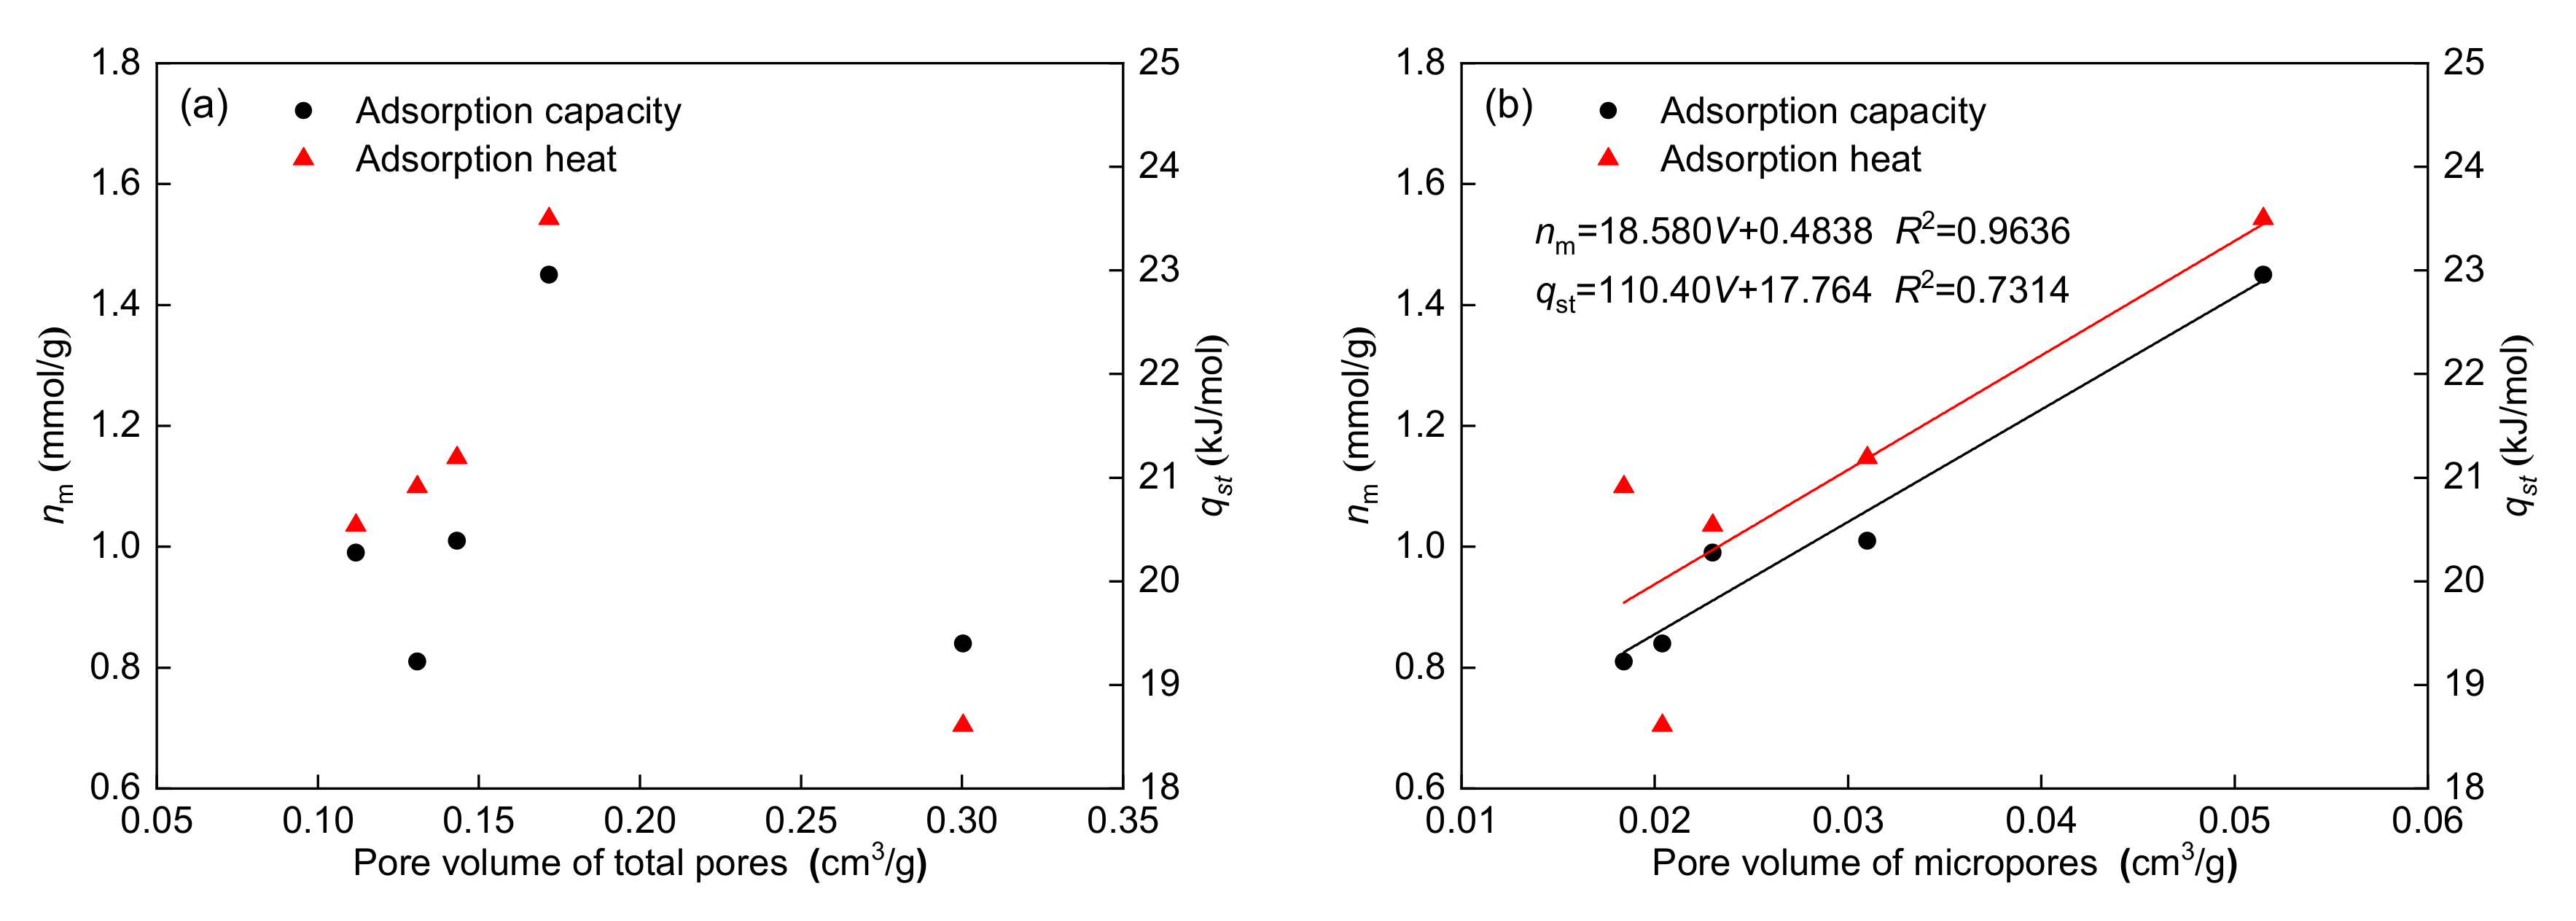
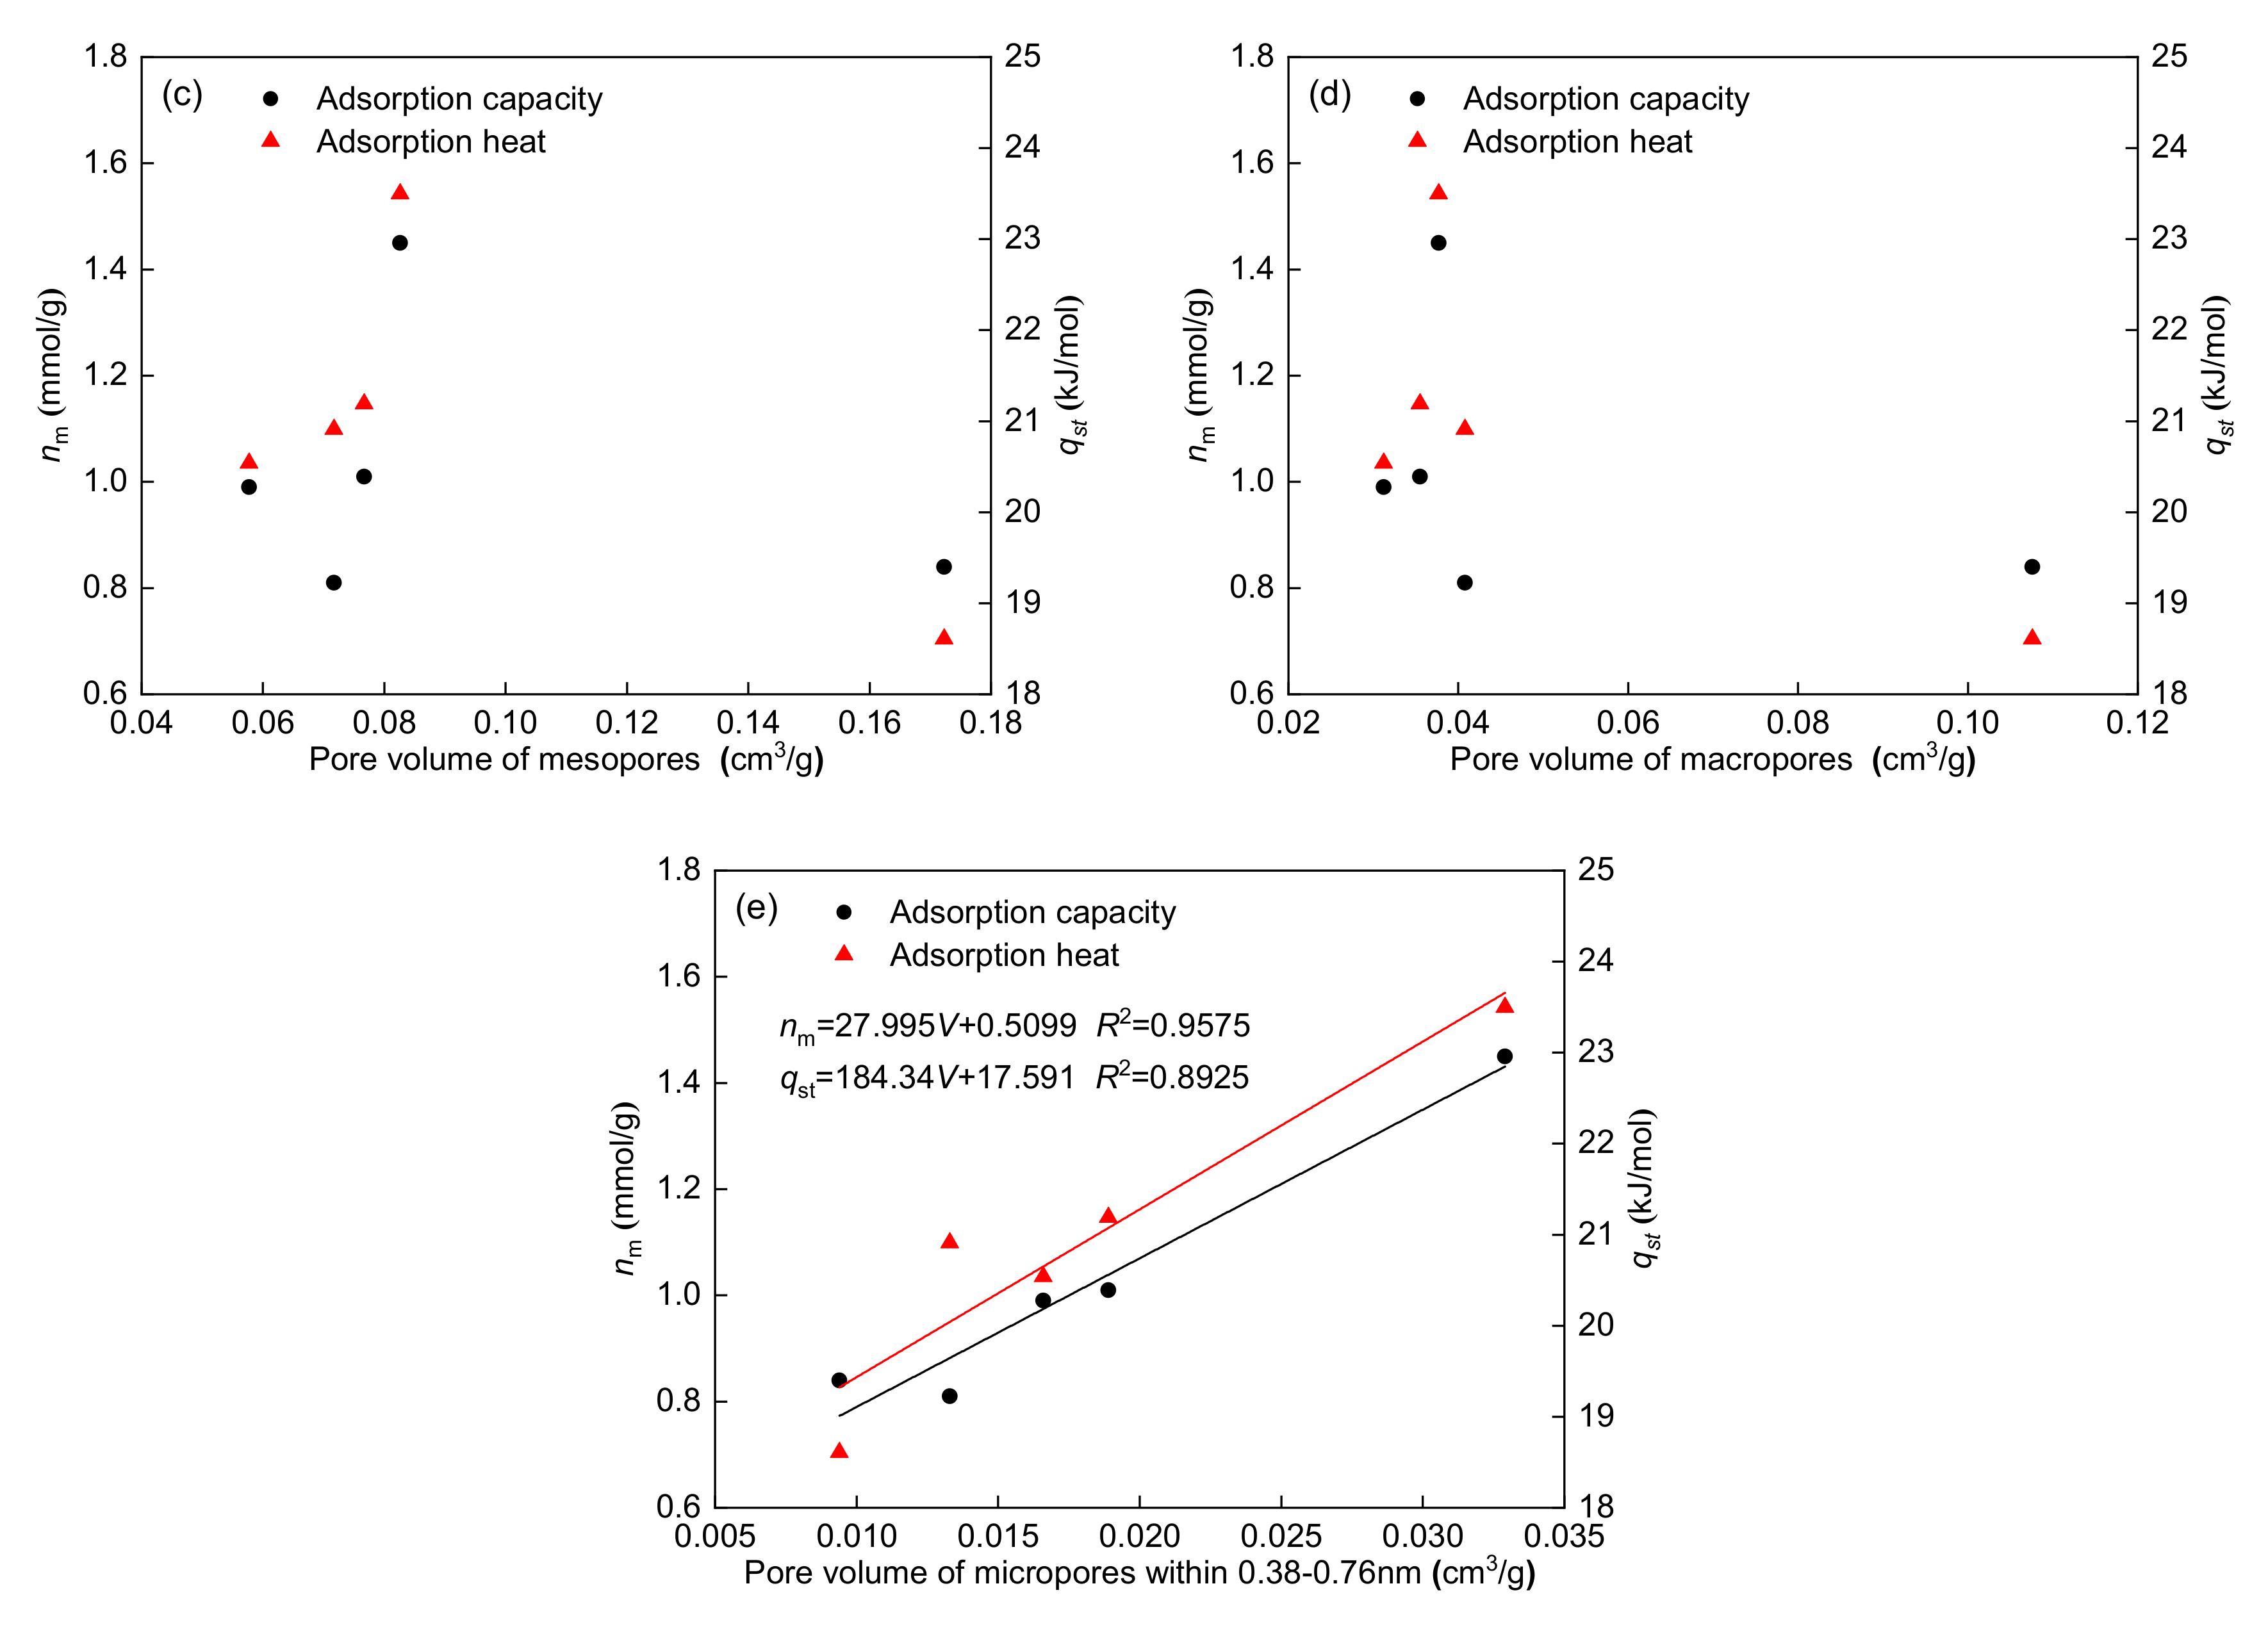
3.3.2. Effect of Pore Volume on Methane Adsorption

The relationship between maximum adsorption capacity and pore volume for each pore type is shown in Figure 9. Notably, the maximum adsorption capacity has a significant positive correlation with the pore volume of 0.38–2 nm micropores (R2 = 0.9636) and 0.38–0.76 nm micropores (R2 = 0.9575), whereas the maximum adsorption capacity has no clear relationship with the pore volume of total pores, mesopores, and macropores. According to the dynamic diameter of methane, methane molecules can only be adsorbed on the inner surface of micropores (0.38–0.76 nm) due to the limited pore space. For larger micropores, methane can not only be adsorbed on the inner surface of the micropores, but also can be filled into the pore volume [39]. Figure 9 shows that the correlations of the maximum adsorption capacity with the pore volume of 0.38–2 nm micropores and 0.38–0.76 nm micropores are both high. The above results indicate that methane can not only be adsorbed on the surface of micropores, but also can fill the micropores.
The relationships between the adsorption heat and pore volume for each pore type are also shown in Figure 9. Figure 9 shows that the adsorption heat has a significant positive correlation with the pore volume of 0.38–2 nm micropores (R2 = 0.7314) and 0.38–0.76 nm micropores (R2 = 0.8925), whereas the adsorption heat has no significant relationship with the pore volume of total pores, mesopores, and macropores. These results show that a higher pore volume of micropores corresponds to a higher adsorption heat. The correlation (R2 = 0.8925) between the adsorption heat and pore volume of the micropores within 0.38–0.76 nm is higher than that (R2 = 0.7314) between the adsorption heat and pore volume of the micropores within 0.38–2 nm, also indicating that micropores (0.38–0.76 nm) play a major role in determining the methane adsorption heat.

4. Conclusions

The adsorption heat is not only helpful to understand the methane adsorption mechanism, but also a key parameter to reveal the energy evolution mechanism during gas migration in coal seams. The in-depth research of the adsorption heat can provide a theoretical basis for CBM extraction technology. In this work, the pore structure of five coal samples with different coal ranks was tested using LP-N2GA and LP-CO2GA. The methane adsorption isotherms at different temperatures were also tested, and the maximum adsorption capacity and heat were obtained. Then, the effects of the pore characteristics on methane adsorption were analysed. The following conclusions can be drawn from this study:
(1) Due to the different pore test ranges, the pore structure parameters obtained by LP-N2GA and LP-CO2GA have significant differences. The LP-N2GA results show that micropores and mesopores contribute the most to the specific surface area, and mesopores contribute the most to the pore volume of the five coal samples. The LP-CO2GA results show that micropores within 0.38–0.76 nm contribute the most to the specific surface area and pore volume of the five coal samples.
(2) The comprehensive pore structure parameters of the five coal samples could be obtained by combining the LP-N2GA and LP-CO2GA results. The comprehensive results show that different types of pores make distinct contributions to the specific surface area for the five coal samples. Micropores contribute the most to the specific surface area of anthracite, lean coal, fat coal, and lignite, while mesopores contribute the most to the specific surface area of coking coal. Moreover, mesopores contribute the most to the pore volume of the five coal samples.
(3) For the five coal samples, methane is mainly adsorbed on the surface of micropores less than 2 nm, and can also fill the micropores. The maximum adsorption capacity has a significant positive correlation with the specific surface area and pore volume of the 0.38–2 nm micropores.
(4) Due to the strong overlapping effect of the adsorption energy, micropores within 0.38–0.76 nm play a major role in determining the methane adsorption heat. The adsorption heat has a significant positive correlation with the specific surface area and pore volume of the 0.38–0.76 nm micropores.

Author Contributions

H.L., S.W., W.G. and W.L. performed the experiments; H.L., S.W., Q.Z. and J.K. analyzed the data; H.L. and S.W. wrote the paper. All authors have read and agreed to the published version of the manuscript.

Funding

This research was supported by the Natural Science Foundation of Xinjiang Uygur Autonomous Region (2021D01C085), the National Natural Science Foundation of China (51904270, 51764050, 51974275), Tianshan Innovation Team of Coal Fire Disaster Prevention (2021D14018), and PhD Research Startup Foundation of Xinjiang University (2020BS08).

Institutional Review Board Statement

Not applicable.

Informed Consent Statement

Not applicable.

Data Availability Statement

Data sharing not applicable.

Acknowledgments

The authors thanks Fubao Zhou’s team at China University of Mining and Technology for their help.

Conflicts of Interest

The author declares no conflict of interest.

References

  1. Karacan, C.Ö.; Ruiz, F.A.; Cotè, M.; Phipps, S. Coal mine methane: A review of capture and utilization practices with benefits to mining safety and to greenhouse gas reduction. Int. J. Coal Geol. 2011, 86, 121–156. [Google Scholar] [CrossRef]
  2. Xue, S.; Yuan, L.; Xie, J.; Wang, Y. Advances in gas content based on outburst control technology in Huainan, China. Int. J. Min. Sci. Technol. 2014, 24, 385–389. [Google Scholar] [CrossRef]
  3. Milewska-Duda, J.; Duda, J.; Nodzeñski, A.; Lakatos, J. Absorption and adsorption of methane and carbon dioxide in hard coal and active carbon. Langmuir 2000, 16, 5458–5466. [Google Scholar] [CrossRef]
  4. Wang, L.; Chen, Z.; Wang, C.; Elsworth, D.; Liu, W. Reassessment of coal permeability evolution using steady-state flow methods: The role of flow regime transition. Int. J. Coal Geol. 2019, 211, 103210. [Google Scholar] [CrossRef]
  5. Yao, Y.; Liu, D.; Tang, D.; Tang, S.; Che, Y.; Huang, W. Preliminary evaluation of the coalbed methane production potential and its geological controls in the Weibei Coalfield, Southeastern Ordos Basin, China. Int. J. Coal Geol. 2009, 78, 1–15. [Google Scholar] [CrossRef]
  6. Li, Y.; Wu, S.; Nie, B.; Ma, Y. A new pattern of underground space-time tridimensional gas drainage: A case study in Yuwu coal mine, China. Energy Sci. Eng. 2019, 7, 399–410. [Google Scholar] [CrossRef] [Green Version]
  7. Jin, K.; Cheng, Y.; Ren, T.; Zhao, W.; Tu, Q.; Dong, J.; Wang, Z.; Hu, B. Experimental investigation on the formation and transport mechanism of outburst coal-gas flow: Implications for the role of gas desorption in the development stage of outburst. Int. J. Coal Geol. 2018, 194, 45–58. [Google Scholar] [CrossRef]
  8. Kotarba, M.J.; Rice, D.D. Composition and origin of coalbed gases in the lower Silesian basin, Southwest Poland. Appl. Geochem. 2001, 16, 895–910. [Google Scholar] [CrossRef]
  9. Švabova, M.; Weishauptova, Z.; Přibyl, O. The effect of moisture on the sorption process of CO2 on coal. Fuel 2012, 92, 187–196. [Google Scholar] [CrossRef]
  10. Busch, A.; Gensterblum, Y. CBM and CO2-ECBM related sorption processes in coal: A review. Int. J. Coal Geol. 2011, 87, 49–71. [Google Scholar] [CrossRef]
  11. Alexeev, A.D.; Vasilenko, T.A.; Ulyanova, E.V. Closed porosity in fossil coals. Fuel 1999, 78, 635–638. [Google Scholar] [CrossRef]
  12. He, X.Q.; Nie, B.S. Diffusion mechanism of porous gases in coal seams. J. China Univ. Min. Technol. 2001, 30, 1–4. [Google Scholar]
  13. Krooss, B.M.; Van Bergen, F.; Gensterblum, Y.; Siemons, N.; Pagnier, H.J.M.; David, P. High-pressure methane and carbon dioxide adsorption on dry and moisture-equilibrated Pennsylvanian coals. Int. J. Coal Geol. 2002, 51, 69–92. [Google Scholar] [CrossRef]
  14. Hodot, B.B. Outburst of Coal and Coalbed Gas; China Industry Press: Beijing, China, 1966. [Google Scholar]
  15. IUPAC: Everett, D.H. Manual of symbols and terminology for physicochemical quantities and units. Pure Appl. Chem. 1972, 31, 579–638. [Google Scholar]
  16. Yan, F.; Xu, J.; Lin, B.; Peng, S.; Zou, Q.; Zhang, X. Changes in pore structure and permeability of anthracite coal before and after high-voltage electrical pulses treatment. Powder Technol. 2019, 343, 560–567. [Google Scholar] [CrossRef]
  17. Rexer, T.F.; Mathia, E.J.; Aplin, A.C.; Thomas, K.M. High pressure methane adsorption and characterization of pores in Posidonia shales and isolated kerogens. Energy Fuels 2014, 28, 2886–2901. [Google Scholar] [CrossRef] [Green Version]
  18. Zhai, C.; Qin, L.; Liu, S.; Xu, J.; Tang, Z.; Wu, S. Pore structure in coal: Pore evolution after cryogenic freezing with cyclic liquid nitrogen injection and its implication on coalbed methane extraction. Energy Fuels 2016, 30, 6009–6020. [Google Scholar] [CrossRef]
  19. Suuberg, E.M.; Deevi, S.C.; Yun, Y. Elastic behaviour of coals studied by mercury porosimetry. Fuel 1995, 74, 1522–1530. [Google Scholar] [CrossRef]
  20. Liu, X.; He, X. Effect of pore characteristics on coalbed methane adsorption in middle-high rank coals. Adsorption 2017, 23, 3–12. [Google Scholar] [CrossRef]
  21. An, F.; Cheng, Y.; Wu, D.; Wang, L. The effect of small micropores on methane adsorption of coals from Northern China. Adsorption 2013, 19, 83–90. [Google Scholar] [CrossRef]
  22. Chen, S.; Tao, S.; Tang, D.; Xu, H.; Li, S.; Zhao, J.; Jiang, Q.; Yang, H. Pore structure characterization of different rank coals using N2 and CO2 adsorption and its effect on CH4 adsorption capacity: A case in Panguan syncline, western Guizhou, China. Energy Fuels 2017, 31, 6034–6044. [Google Scholar] [CrossRef]
  23. Zhang, M.; Fu, X. Characterization of pore structure and its impact on methane adsorption capacity for semi-anthracite in Shizhuangnan Block, Qinshui Basin. J. Nat. Gas Sci. Eng. 2018, 60, 49–62. [Google Scholar] [CrossRef]
  24. Wang, F.; Cheng, Y.; Lu, S.; Jin, K.; Zhao, W. Influence of coalification on the pore characteristics of middle−high rank coal. Energy Fuels 2014, 28, 5729–5736. [Google Scholar] [CrossRef]
  25. Yue, G.; Wang, Z.; Tang, X.; Li, H.; Xie, C. Physical simulation of temperature influence on methane sorption and kinetics in coal (II): Temperature evolvement during methane adsorption in coal measurement and modeling. Energy Fuels 2015, 29, 6355–6362. [Google Scholar] [CrossRef]
  26. Feng, Z.; Cai, T.; Zhou, D.; Zhao, D.; Zhao, Y.; Wang, C. Temperature and deformation changes in anthracite coal after methane adsorption. Fuel 2017, 192, 27–34. [Google Scholar] [CrossRef] [Green Version]
  27. Auroux, A. Calorimetry and Thermal Methods in Catalysis; Springer Science & Business Media: Berlin/Heidelberg, Germany, 2013. [Google Scholar]
  28. Horikawa, T.; Zeng, Y.; Do, D.D.; Sotowa, K.; Alcántara Avila, J.R. On the isosteric heat of adsorption of non-polar and polar fluids on highly graphitized carbon black. J. Colloid Interface Sci. 2015, 439, 1–6. [Google Scholar] [CrossRef] [PubMed]
  29. Li, H.; Li, G.; Kang, J.; Zhou, F.; Deng, J. Analytical model and experimental investigation of the adsorption thermodynamics of coalbed methane. Adsorption 2019, 25, 201–216. [Google Scholar] [CrossRef]
  30. Kloutse, A.F.; Zacharia, R.; Cossement, D.; Chahine, R.; Balderas-Xicohténcatl, R.; Oh, H.; Streppel, B.; Schlichtenmayer, M.; Hirscher, M. Isosteric heat of hydrogen adsorption R. on MOFs: Comparison between adsorption calorimetry, sorption isosteric method, and analytical models. Appl. Phys. A 2015, 121, 1417–1424. [Google Scholar] [CrossRef]
  31. Skoczylas, N.; Pajdak, A.; Kudasik, M.; Braga, L.T.P. CH4 and CO2 sorption and diffusion carried out in various temperatures on hard coal samples of various degrees of coalification. J. Nat. Gas Sci. Eng. 2020, 81, 103449. [Google Scholar] [CrossRef]
  32. Zhou, F.; Liu, S.; Pang, Y.; Li, J.; Xin, H. Effects of coal functional groups on adsorption microheat of coal bed methane. Energy Fuels 2015, 29, 1550–1557. [Google Scholar] [CrossRef]
  33. Pajdak, A.; Skoczylas, N.; Dębski, A.; Grzegorek, J.; Maziarz, W.; Kudasik, M. CO2 and CH4 sorption on carbon nanomaterials and coals–Comparative characteristics. J. Nat. Gas Sci. Eng. 2019, 72, 103003. [Google Scholar] [CrossRef]
  34. The National Standards Compilation Group of Peoples Republic of China. GB/T 5751–2009 Chinese Classification of Coals; Standards Press of China: Beijing, China, 2009. [Google Scholar]
  35. Do, D.D. Adsorption Analysis: Equilibria and Kinetics; Imperial College Press: London, UK, 1998. [Google Scholar]
  36. Chattaraj, S.; Mohanty, D.; Kumar, T.; Halder, G. Thermodynamics, kinetics and modeling of sorption behaviour of coalbed methane-A review. J. Unconv. Oil Gas Resour. 2016, 16, 14–33. [Google Scholar] [CrossRef]
  37. Yan, M.; Bai, Y.; Li, S.; Lin, H.; Yan, D.; Shu, C. Factors influencing the gas adsorption thermodynamic characteristics of low-rank coal. Fuel 2019, 248, 117–126. [Google Scholar] [CrossRef]
  38. Madani, S.H.; Hu, C.; Silvestre-Albero, A.; Biggs, M.J.; Rodríguez-Reinoso, F.; Pendleton, P. Pore size distributions derived from adsorption isotherms, immersion calorimetry, and isosteric heats: A comparative study. Carbon 2016, 96, 1106–1113. [Google Scholar] [CrossRef]
  39. Hu, B.; Cheng, Y.; He, X.; Wang, Z.; Jiang, Z.; Wang, C.; Li, W.; Wang, L. New insights into the CH4 adsorption capacity of coal based on microscopic pore properties. Fuel 2020, 262, 116675. [Google Scholar] [CrossRef]
Figure 1. N2 adsorption-desorption isotherms at 77 K.
Processes 09 01971 g001
Figure 2. Pore volume and SSA distributions for the five coal samples using Barrett–Joyner–Halenda (BJH) theory: (a) CZ coal sample, (b) JJ coal sample, (c) SS coal sample, (d) DL coal sample, and (e) DH coal sample.
Processes 09 01971 g002aProcesses 09 01971 g002b
Figure 3. CO2 adsorption isotherms at 273.15 K.
Processes 09 01971 g003
Figure 4. Pore volume and SSA distributions for the five coal samples obtained by density functional theory (DFT) model: (a) CZ coal sample, (b) JJ coal sample, (c) SS coal sample, (d) DL coal sample, and (e) DH coal sample.
Processes 09 01971 g004aProcesses 09 01971 g004b
Figure 5. (a) Specific surface area proportion and (b) volume proportion for each pore type.
Processes 09 01971 g005
Figure 6. Methane adsorption isotherms at three different temperatures: (a) CZ coal sample, (b) JJ coal sample, (c) SS coal sample, (d) DL coal sample, and (e) DH coal sample.
Processes 09 01971 g006aProcesses 09 01971 g006b
Figure 7. Isometric adsorption curves of the five coal samples.
Processes 09 01971 g007
Figure 8. Relationships between adsorption parameters and SSA of total pores (a), micropores (b), mesopores (c), macropores (d), and micropores within 0.38–0.76 nm (e).
Processes 09 01971 g008
Figure 9. Relationships between adsorption parameters and pore volume of total pores (a), micropores (b), mesopores (c), macropores (d), and micropores within 0.38–0.76 nm (e).
Processes 09 01971 g009aProcesses 09 01971 g009b
Table 1. Geological information of the coal samples.
Coal SampleCoal MineCoal SeamGeological FormationMaceral Composition (%)
VitriniteInertiniteExiniteMineral
CZChengzhuang3Shanxi formation of the lower Permian system67.2628.564.18
JJJinjia18Longtan formation of the upper Permian system68.1230.001.88
SSShoushan2Shanxi formation of the lower Permian system55.0342.012.96
DLDaliuta5Yan’an formation of the middle Jurassic system49.4547.801.101.65
DHDonghuai1Nadu formation of the lower Tertiary system72.021.192.9823.81
Table 2. Basic parameters of the coal samples.
Coal SampleRo,max (%)Coal TypeProximate Analysis(%)Ultimate Analysis (%)
MadAadVdafFCadCadHadOadNad
CZ2.37Anthracite0.7213.888.8377.8677.592.843.481.21
JJ2.04Lean coal0.5415.2010.5475.3876.633.302.891.20
SS1.35Coking coal0.7712.6620.9368.4575.803.964.231.32
DL0.76Fat coal3.625.3834.9959.1673.304.4811.721.03
DH0.58Lignite3.1742.0251.0126.8539.333.489.061.57
Notes: Ro,max (%), mean maximum reflectance of vitrinite; Mad, moisture content on air-dried basis; Aad, ash content on air-dried basis; Vdaf, volatile content on dry-ash-free basis; FCad, fixed carbon content on air-dried basis; Cad, carbon content on air-dried basis; Had, hydrogen content on air-dried basis; Oad, oxygen content on air-dried basis; Nad, nitrogen content on air-dried basis.
Table 3. Pore structure parameters of the coal samples obtained by LP-N2GA.
Coal SampleSSA
(m2/g)
TPV (cm3/g)Specific Surface Area (m2/g)Pore Volume (cm3/g)
1.7–2 nm2–50 nm50–300 nm1.7–2 nm2–50 nm50–300 nm
CZ72.110.127515.9254.801.390.00720.08260.0377
JJ55.640.11679.8744.411.360.00450.07670.0355
SS118.400.286514.6499.953.810.00660.17230.1076
DL36.960.09022.8033.011.150.00130.05770.0312
DH41.710.11505.4634.791.460.00250.07170.0408
Notes: SSA, specific surface area; TPV, total pore volume.
Table 4. Pore structure parameters of the five coal samples obtained by LP-CO2GA.
Coal SampleSSA
(m2/g)
TPV (cm3/g)Specific Surface Area (m2/g)Pore Volume (cm3/g)
0.38–0.76 nm0.76–1.14 nm0.38–0.76 nm0.76–1.14 nm
CZ144.140.0443117.9626.180.03290.0114
JJ84.640.026567.4217.220.01890.0076
SS42.600.013832.829.780.00940.0044
DL71.690.021759.8211.870.01660.0051
DH54.540.015948.466.080.01330.0026
Table 5. Comprehensive pore structure parameters obtained by LP-N2GA and LP-CO2GA.
Coal SampleSSA
(m2/g)
TPV (cm3/g)Specific Surface Area (m2/g)Pore Volume (cm3/g)
<2 nm2–50 nm>50 nm<2 nm2–50 nm>50 nm
CZ216.250.1718160.0654.801.390.05150.08260.0377
JJ140.280.143294.5144.411.360.03100.07670.0355
SS161.000.300357.2499.953.810.02040.17230.1076
DL108.650.111974.4933.011.150.02300.05770.0312
DH96.250.130960.0034.791.460.01840.07170.0408
Table 6. Langmuir equation parameters of the five coal samples.
Coal Samplenm (mol/g)b (×10−4 MPa−1)ε (kJ/mol)R2
CZ1.451.6723.500.9978
JJ1.013.0421.190.9989
SS0.843.5818.610.9975
DL0.992.1820.540.9974
DH0.811.7320.910.9973
Table 7. Fitting parameters of the isometric adsorption curves.
Coal SampleFitting FormulaR2 Δ H (kJ/mol) qst (kJ/mol)
CZlnp = 13.77–2826.47/T0.99−23.5023.50
JJlnp = 13.61–2548.41/T0.99−21.1921.19
SSlnp = 13.69–2238.43/T0.99−18.6118.61
DLlnp = 13.97–2470.20/T0.99−20.5420.54
DHlnp = 14.46–2514.90/T0.99−20.9120.91
Publisher’s Note: MDPI stays neutral with regard to jurisdictional claims in published maps and institutional affiliations.

