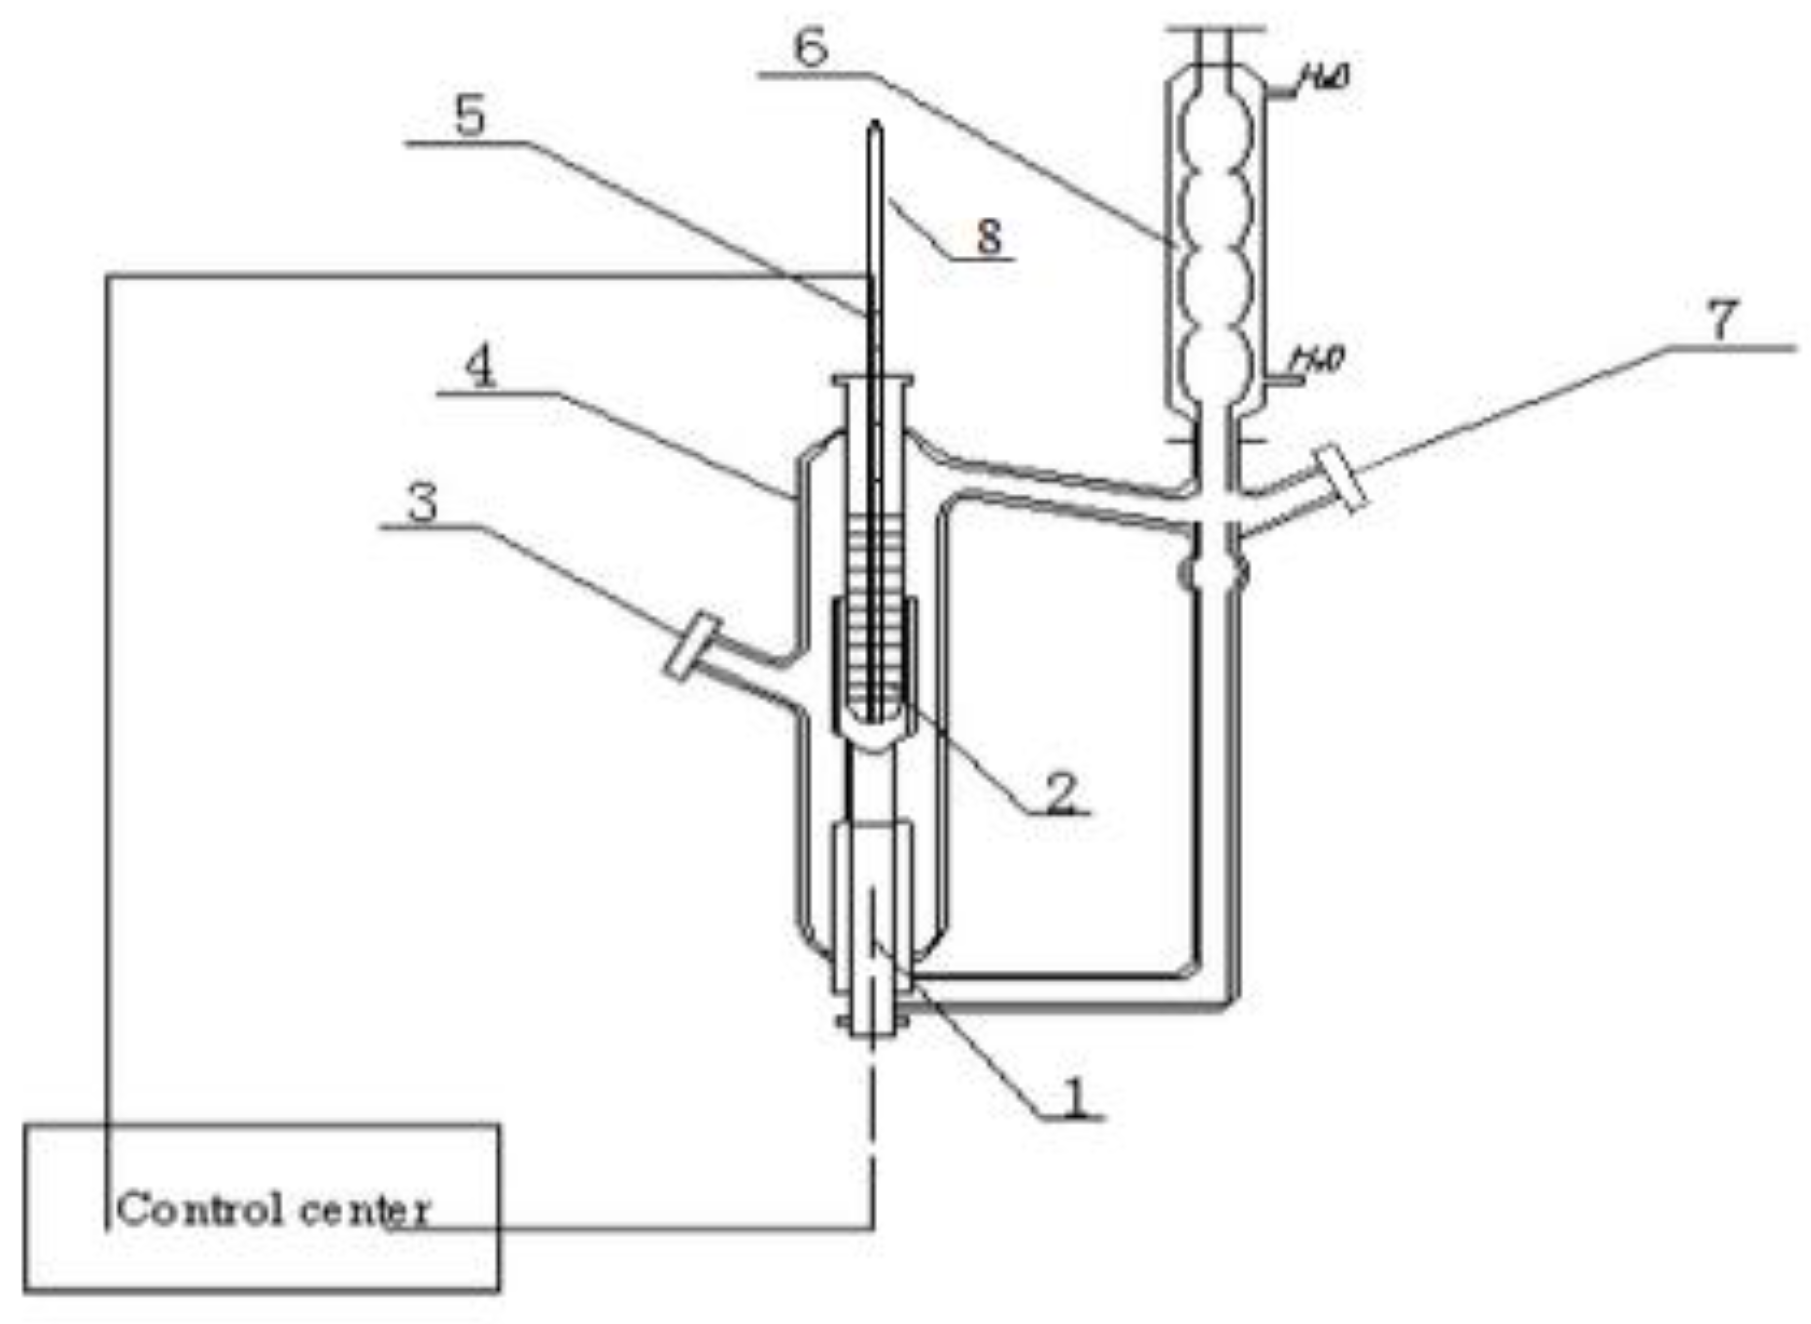
Figure 1.
Constant pressure double circulation vapor–liquid equilibrium kettle. 1—heater rod; 2—thermometer sleeve tube; 3—liquid phase sample connection; 4—liquid phase sample connection; 5—thermal resistance; 6—condenser; 7—vapor phase sample connection; 8—mercury thermometer.
Figure 1.
Constant pressure double circulation vapor–liquid equilibrium kettle. 1—heater rod; 2—thermometer sleeve tube; 3—liquid phase sample connection; 4—liquid phase sample connection; 5—thermal resistance; 6—condenser; 7—vapor phase sample connection; 8—mercury thermometer.
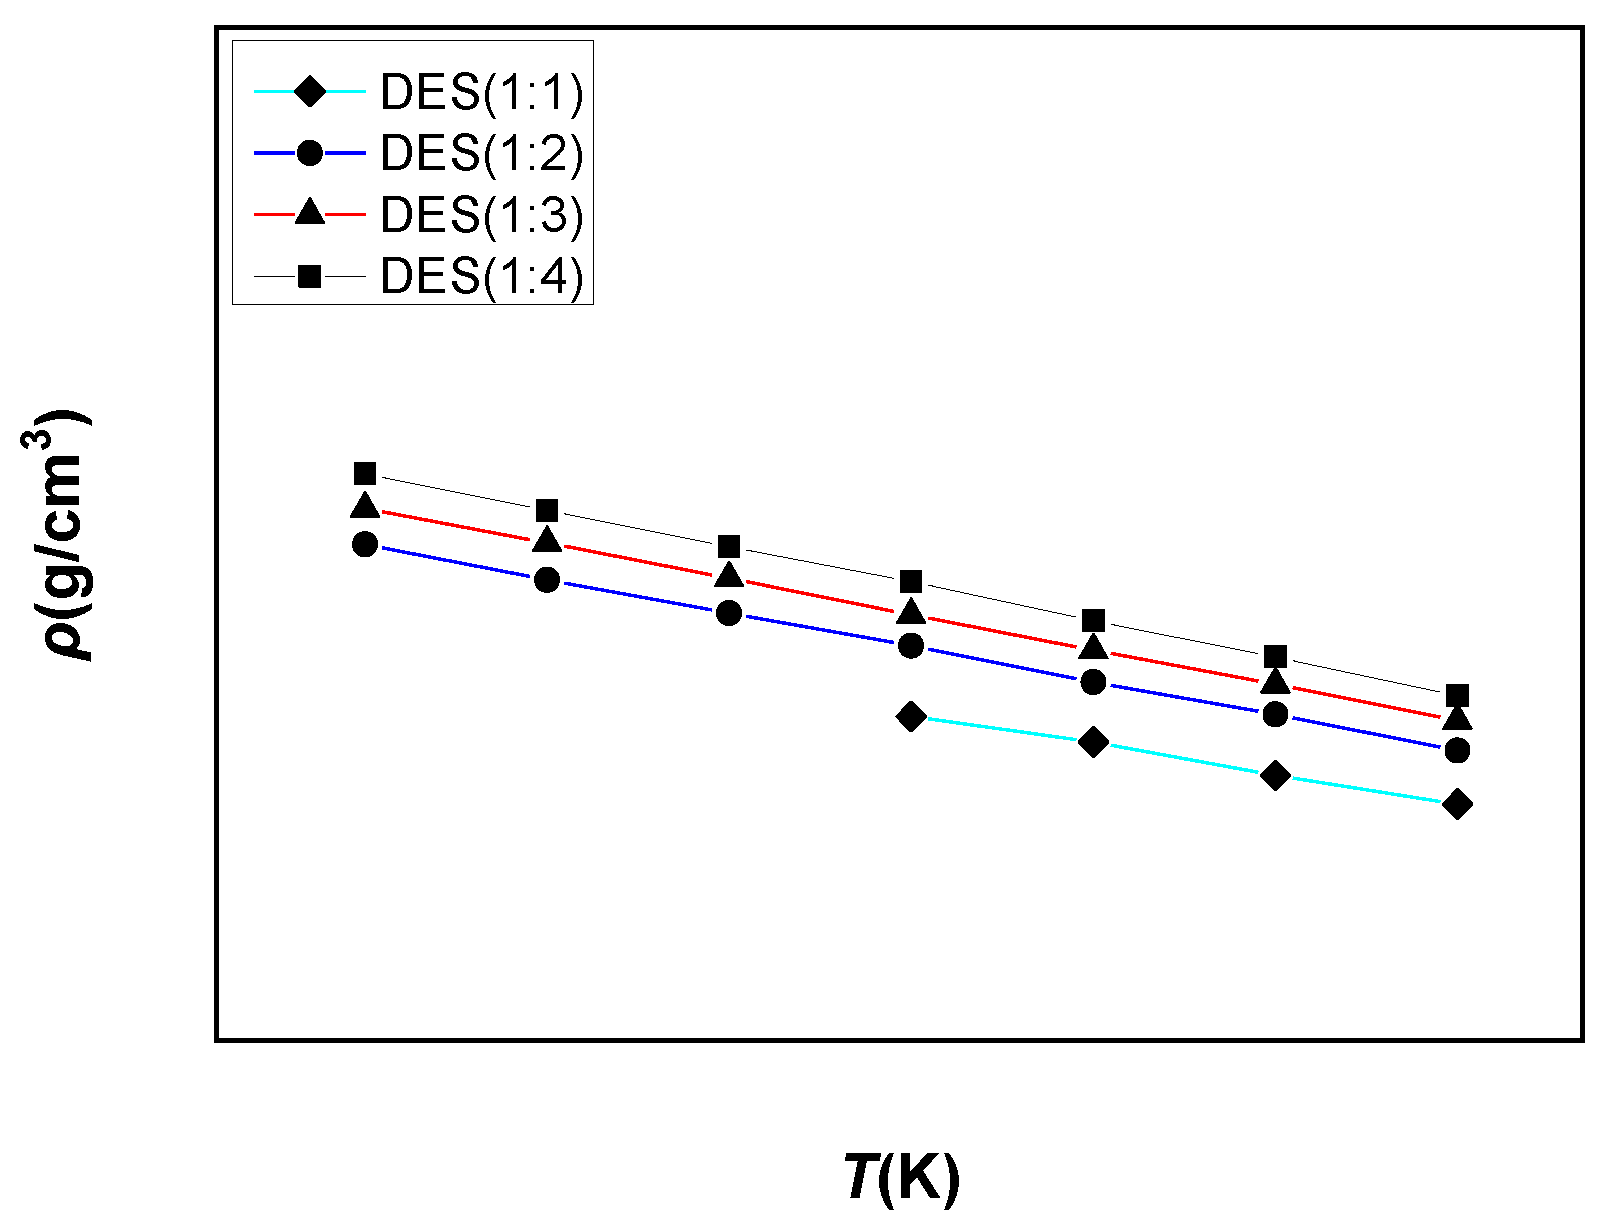
Figure 2.
The change in experimental density with respect to temperature for the prepared DESs.
Figure 2.
The change in experimental density with respect to temperature for the prepared DESs.
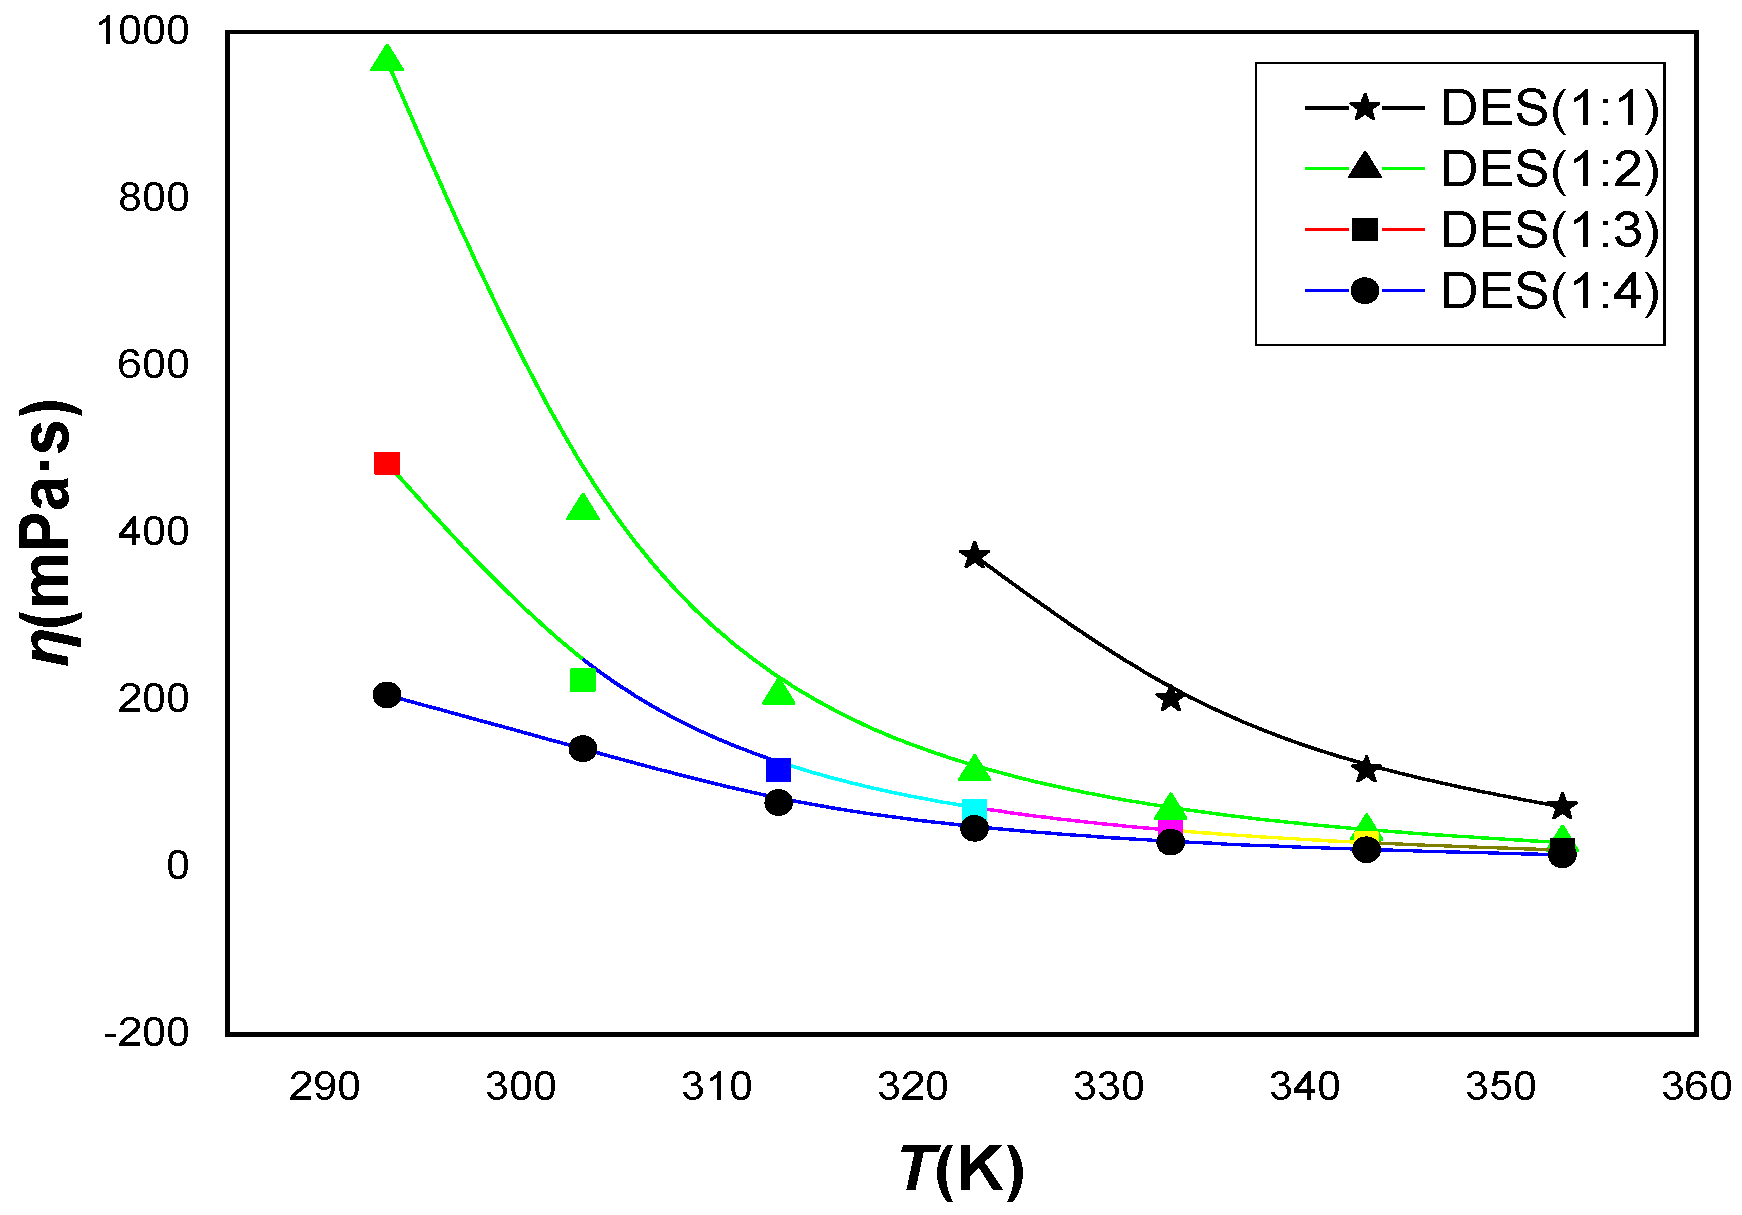
Figure 3.
The change in experimental viscosity values of prepared DESs with temperature.
Figure 3.
The change in experimental viscosity values of prepared DESs with temperature.
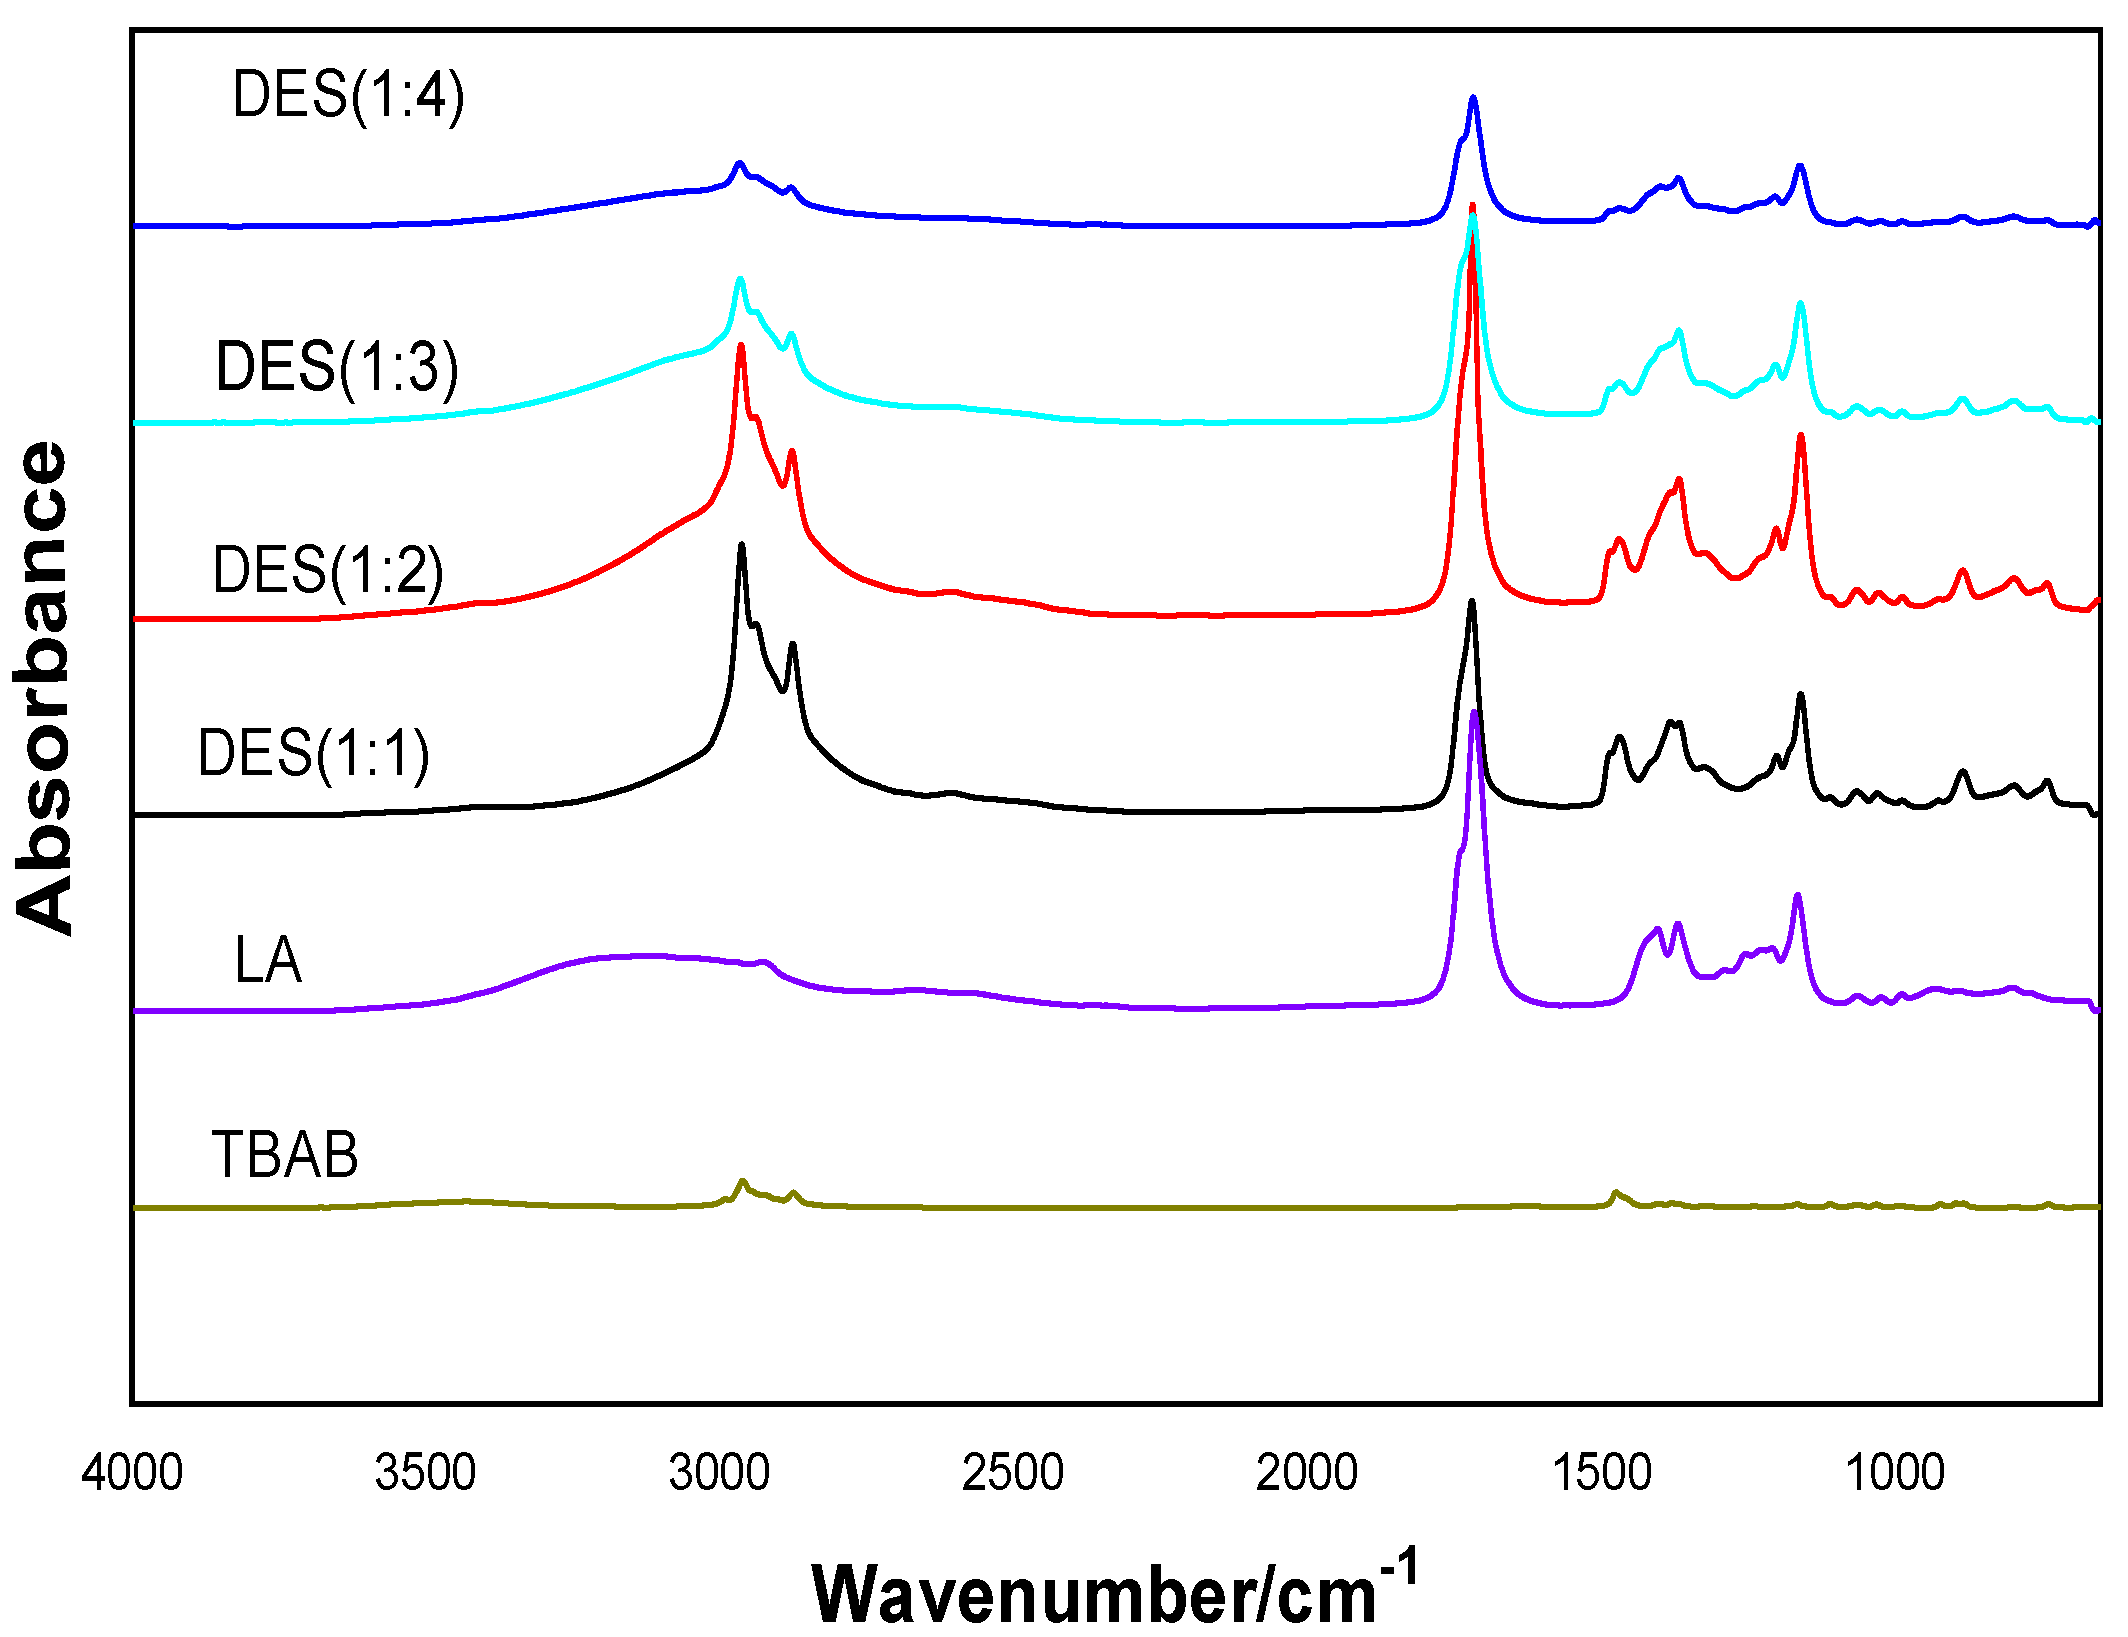
Figure 4.
FT-IR spectra of LA, TBAB, and DESs formed by LA and TBAB with a 1:1–1:4 mol ratio.
Figure 4.
FT-IR spectra of LA, TBAB, and DESs formed by LA and TBAB with a 1:1–1:4 mol ratio.
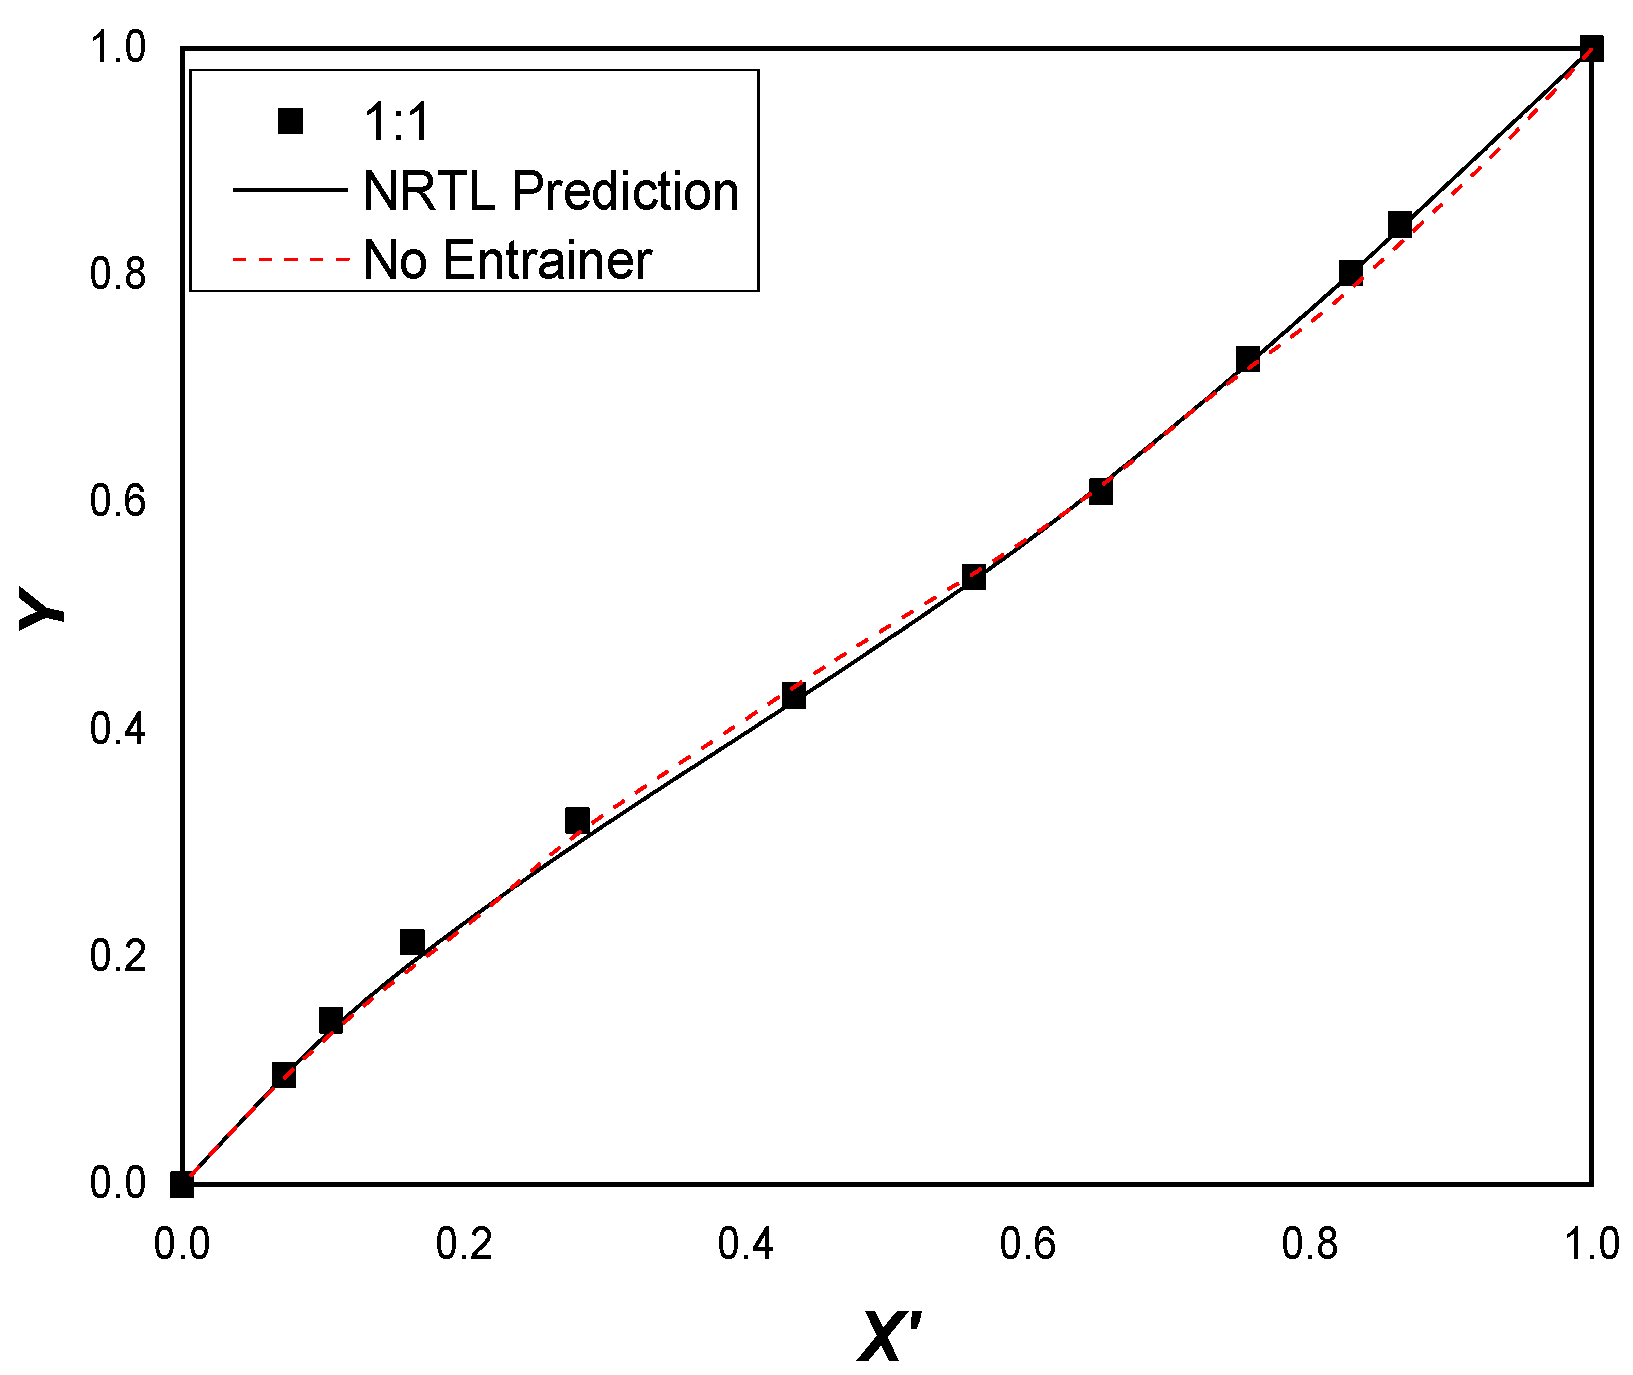
Figure 5.
Experimental and calculated data X’Y diagram for cyclohexane (1) + benzene (2) + DES(1:1) (3) at constant pressure (101.325 kPa) and constant DES molar fraction (X3 = 0.1).
Figure 5.
Experimental and calculated data X’Y diagram for cyclohexane (1) + benzene (2) + DES(1:1) (3) at constant pressure (101.325 kPa) and constant DES molar fraction (X3 = 0.1).
Figure 6.
Experimental and calculated data X’Y diagram for cyclohexane (1) + benzene (2) + DES(1:2) (3) at constant pressure (101.325 kPa) and constant DES molar fraction (X3 = 0.1).
Figure 6.
Experimental and calculated data X’Y diagram for cyclohexane (1) + benzene (2) + DES(1:2) (3) at constant pressure (101.325 kPa) and constant DES molar fraction (X3 = 0.1).
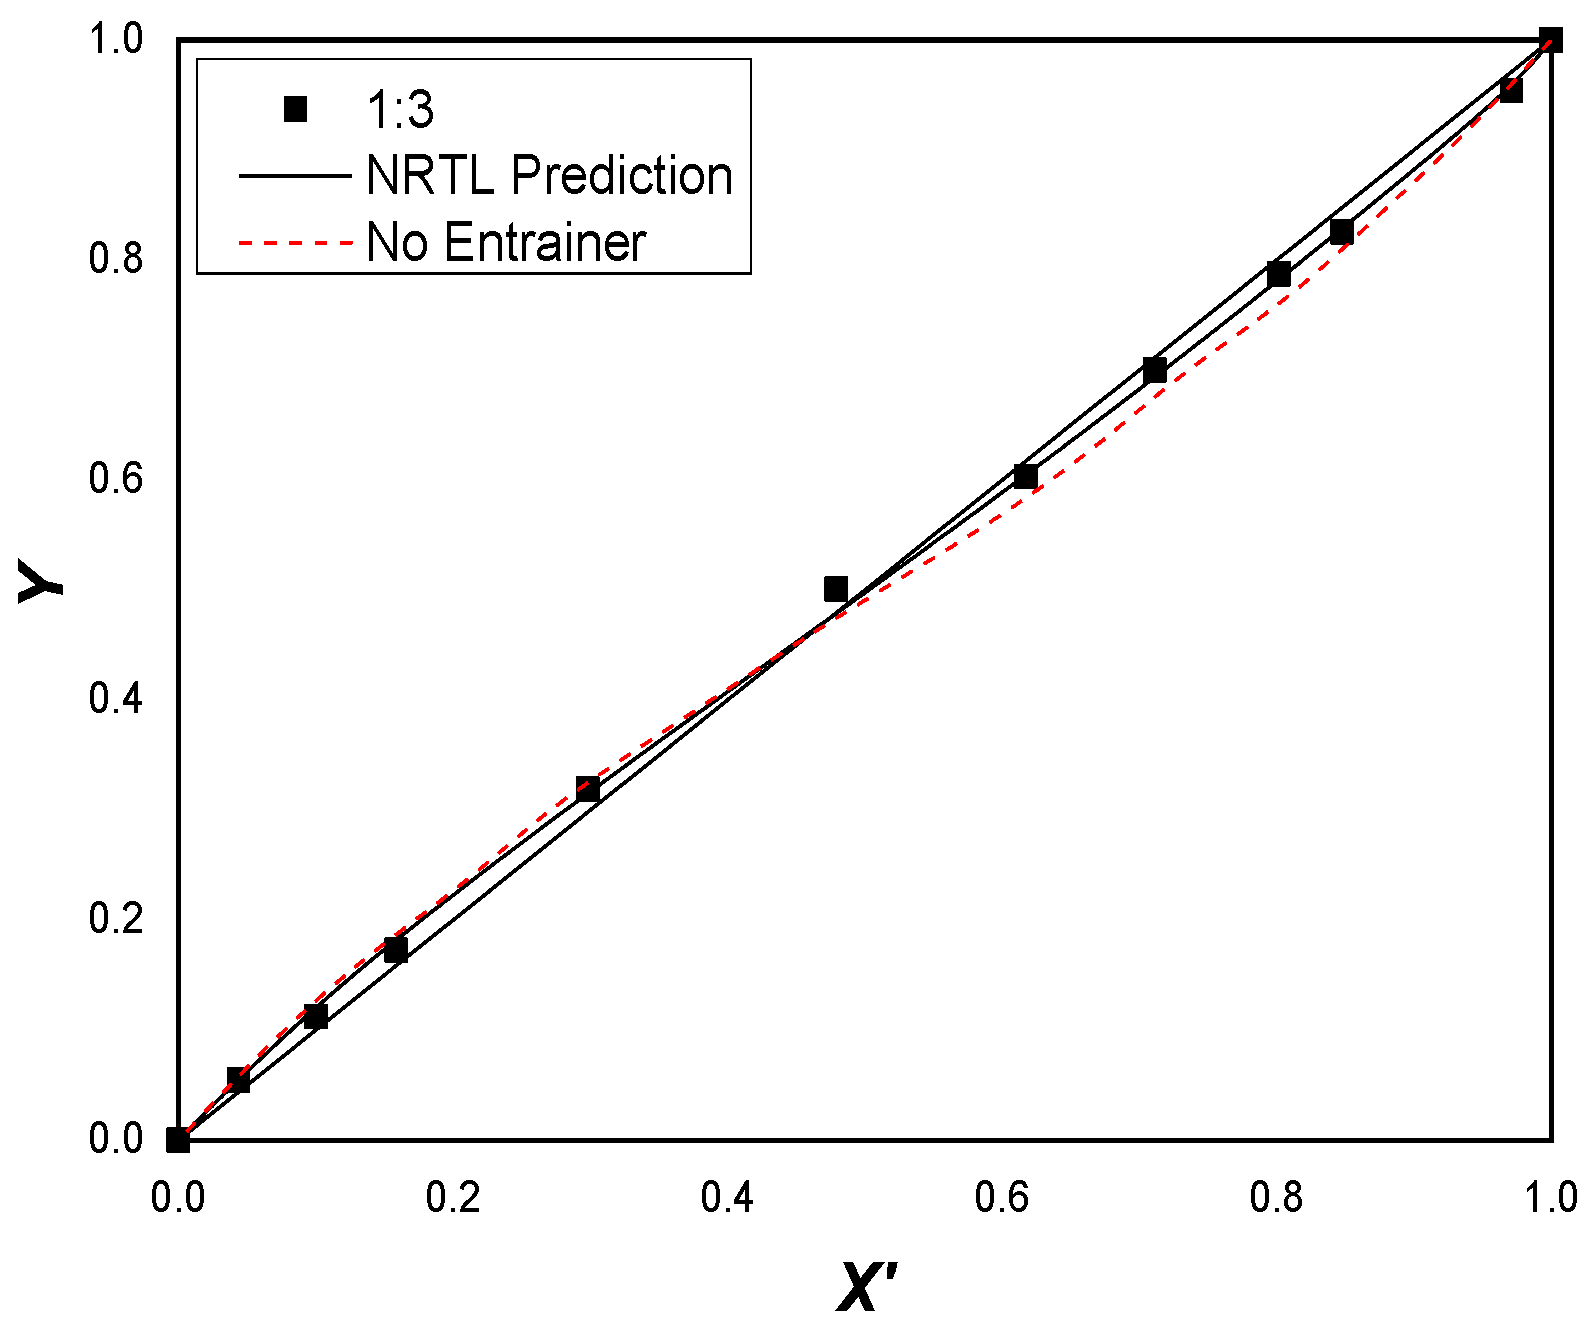
Figure 7.
Experimental and calculated data X’Y diagram for cyclohexane (1) + benzene (2) + DES(1:3) (3) at constant pressure (101.325 kPa) and constant DES molar fraction (X3 = 0.1).
Figure 7.
Experimental and calculated data X’Y diagram for cyclohexane (1) + benzene (2) + DES(1:3) (3) at constant pressure (101.325 kPa) and constant DES molar fraction (X3 = 0.1).
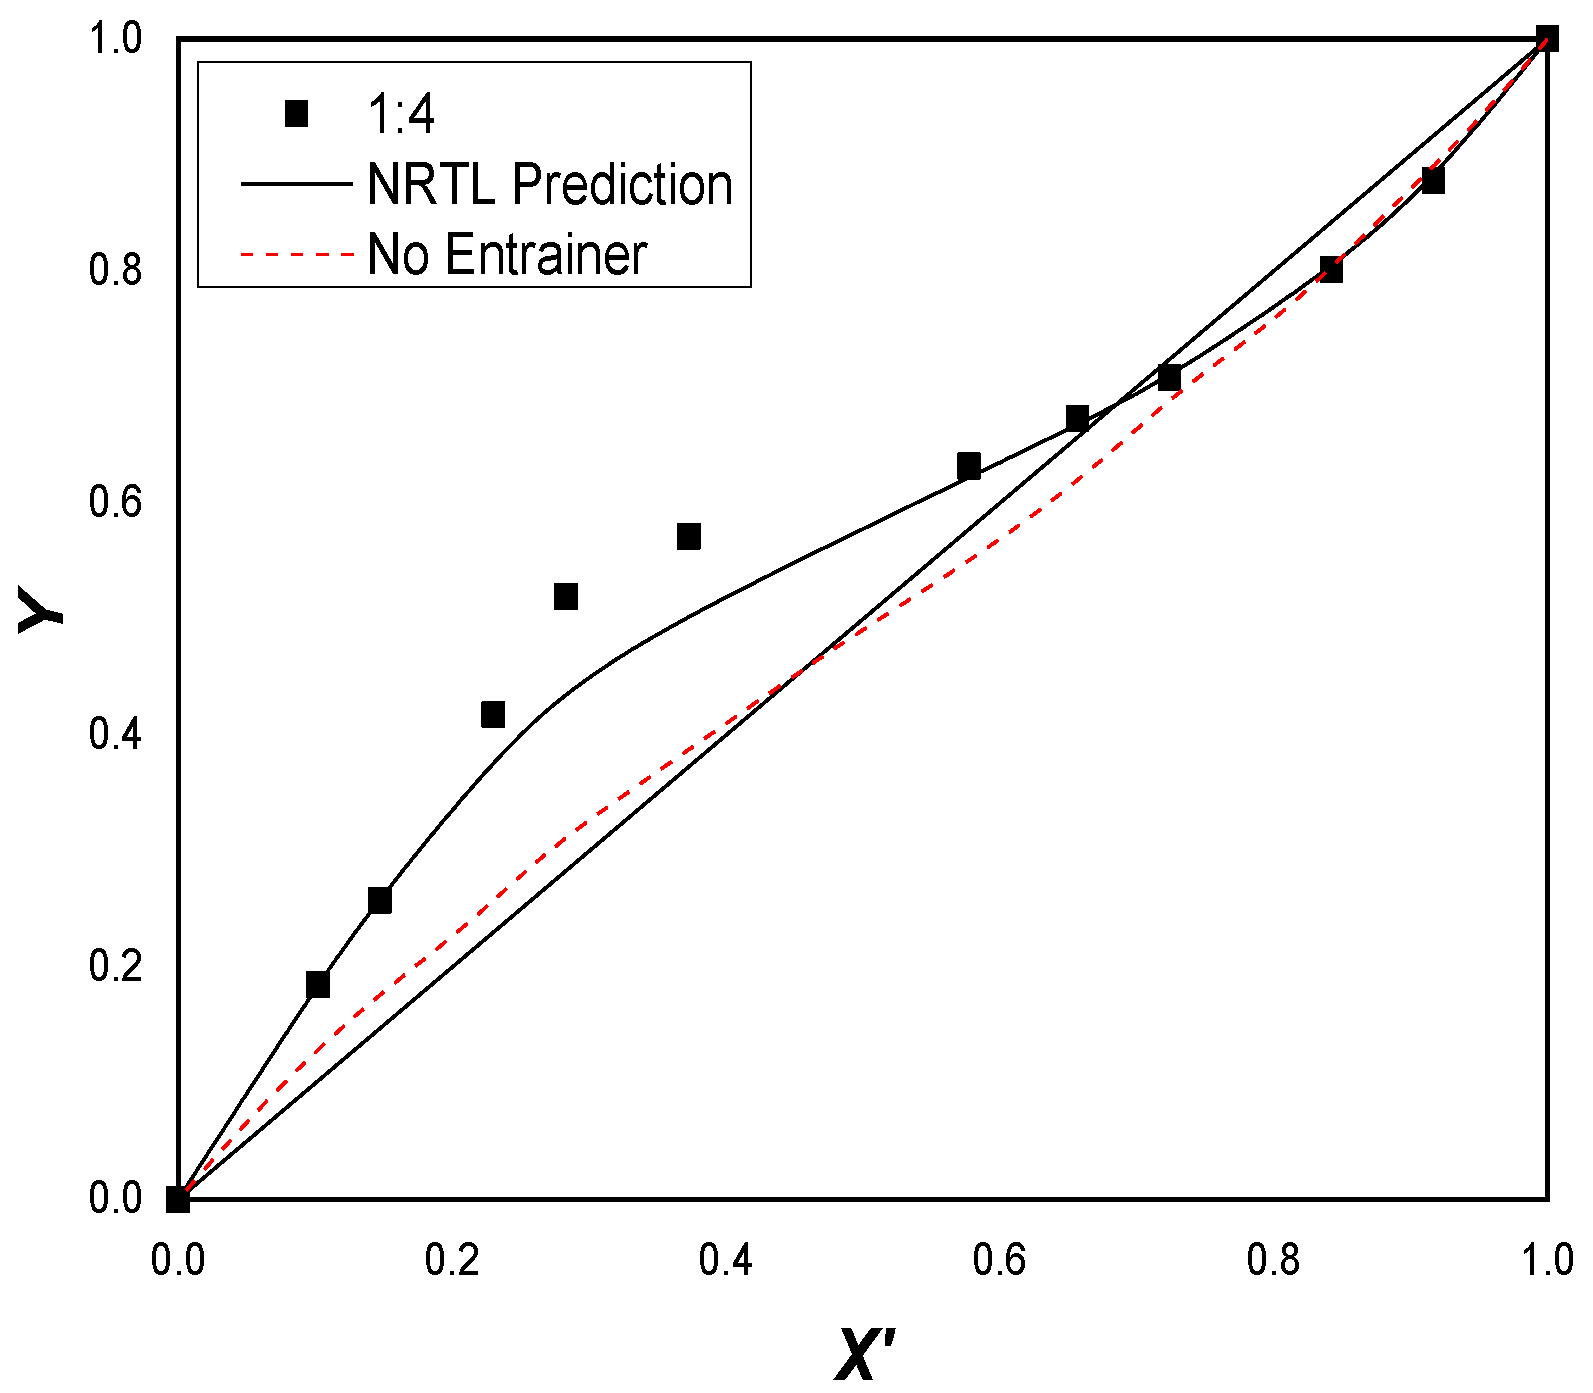
Figure 8.
Experimental and calculated data X’Y diagram for cyclohexane (1) + benzene (2) + DES(1:4) (3) at constant pressure (101.325 kPa) and constant DES molar fraction (X3 = 0.1).
Figure 8.
Experimental and calculated data X’Y diagram for cyclohexane (1) + benzene (2) + DES(1:4) (3) at constant pressure (101.325 kPa) and constant DES molar fraction (X3 = 0.1).
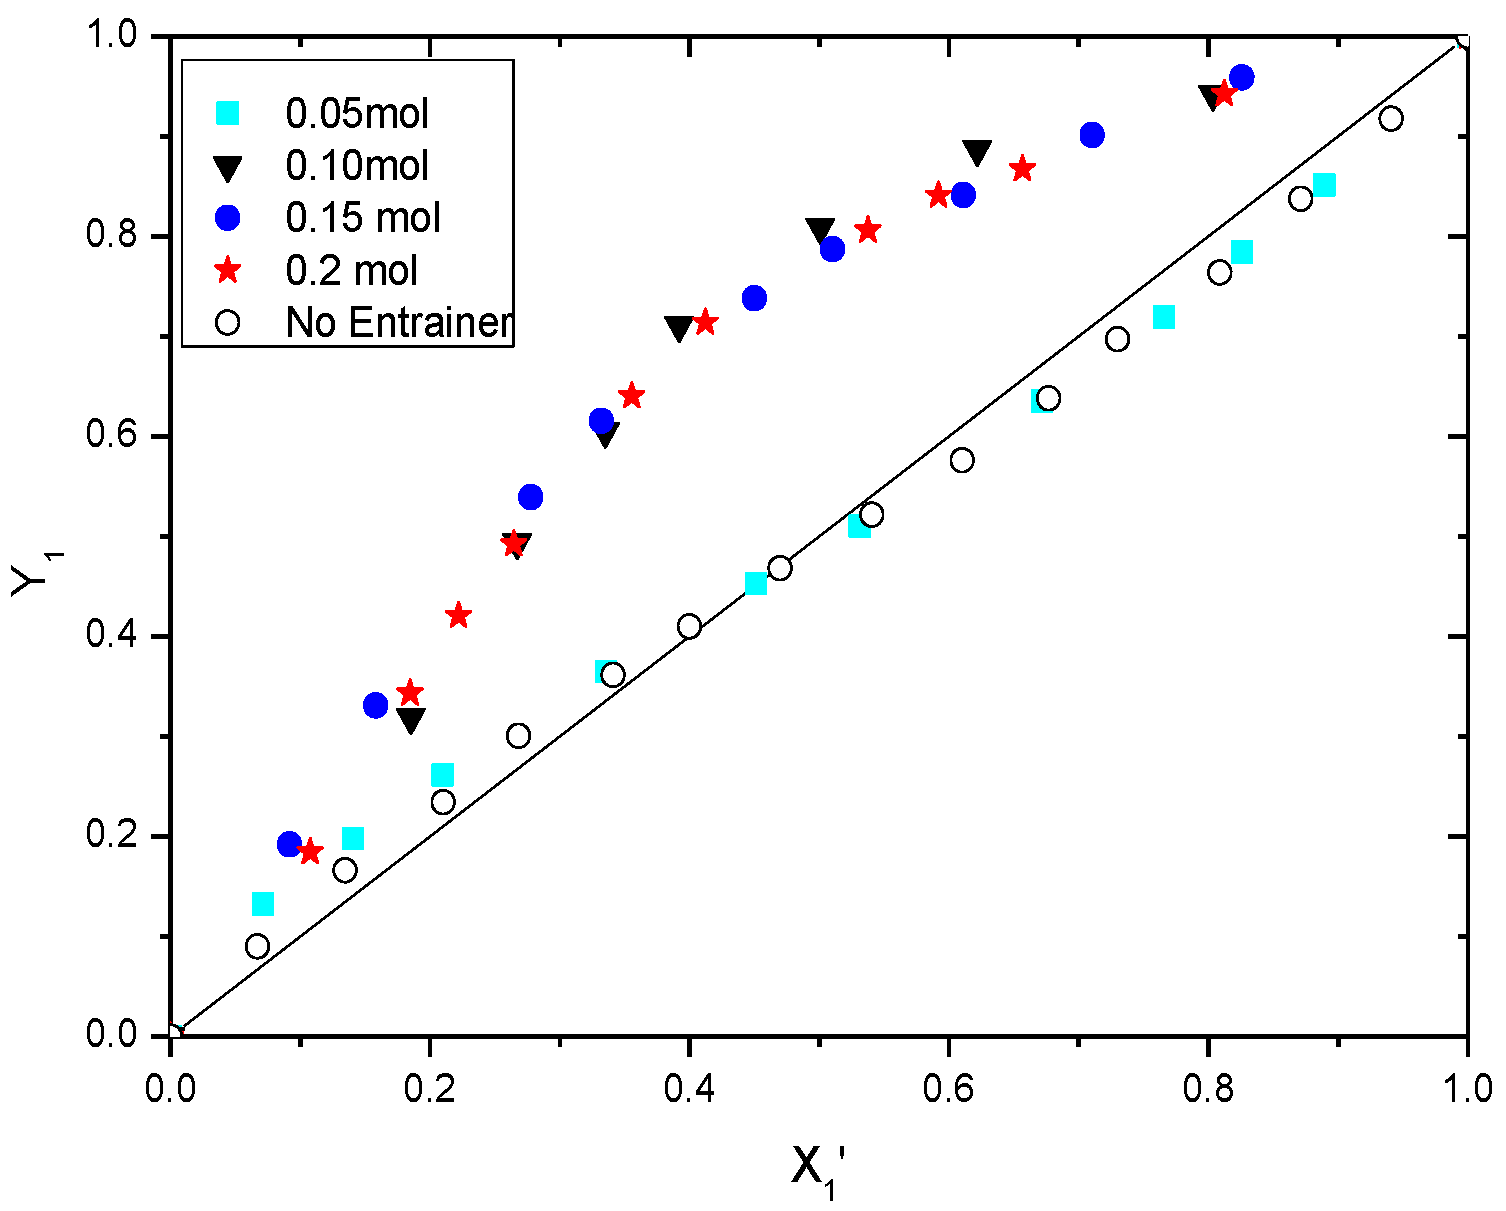
Figure 9.
Experimental X’Y diagram for the pseudo-ternary systems (cyclohexane (1) + benzene (2) + DES(1:2)(3)) at atmospheric pressure and constant DES molar fraction (X3 = 0.1), and the experimental XY diagram for binary system (cyclohexane (1) + benzene (2)).
Figure 9.
Experimental X’Y diagram for the pseudo-ternary systems (cyclohexane (1) + benzene (2) + DES(1:2)(3)) at atmospheric pressure and constant DES molar fraction (X3 = 0.1), and the experimental XY diagram for binary system (cyclohexane (1) + benzene (2)).
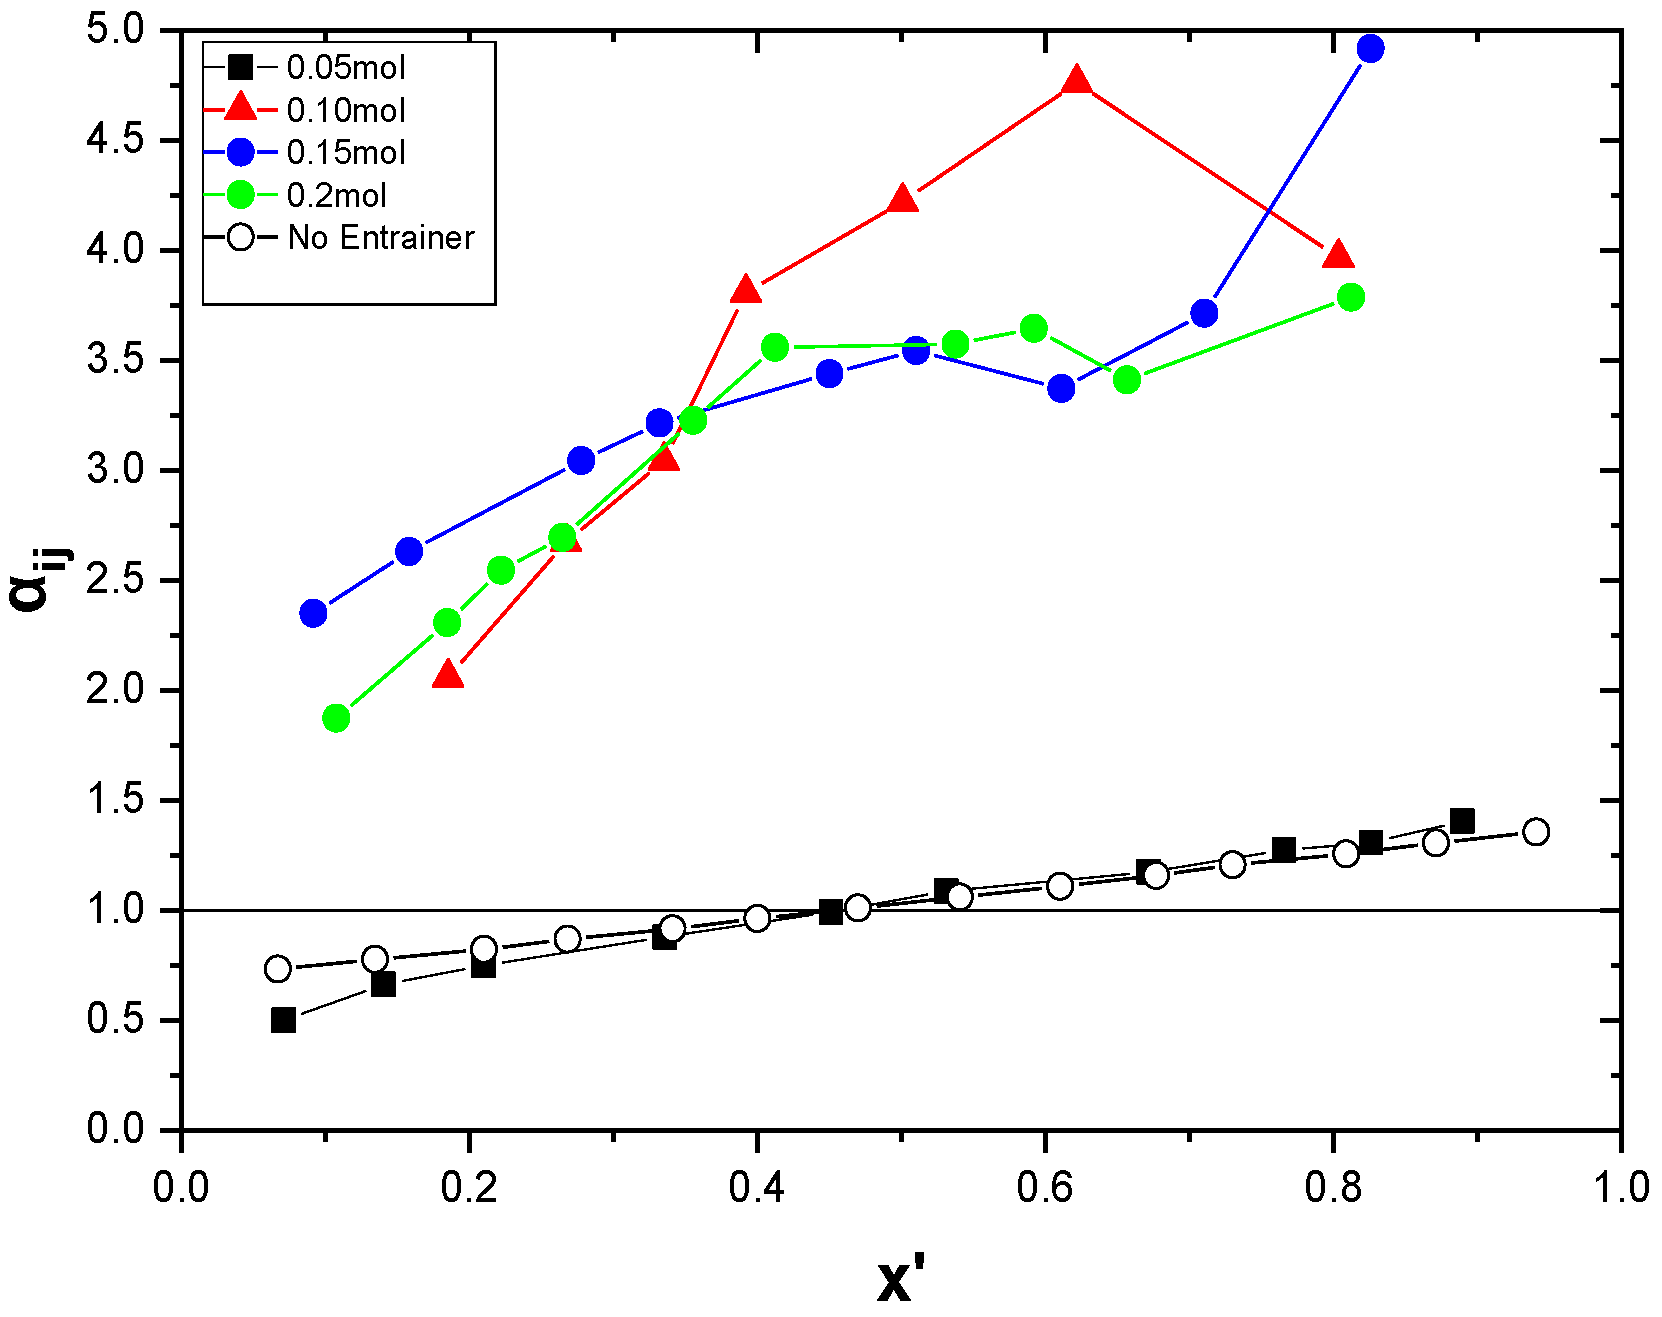
Figure 10.
Experimental relative volatility (aij) of the pseudo-ternary system cyclohexane (1) + benzene (2) + DES(1:2) (3) and binary system cyclohexane (1) + benzene (2).
Figure 10.
Experimental relative volatility (aij) of the pseudo-ternary system cyclohexane (1) + benzene (2) + DES(1:2) (3) and binary system cyclohexane (1) + benzene (2).
Figure 11.
Experimental and calculated data X’Y diagram for cyclohexane (1) + benzene (2) + DES (3) at constant pressure (101.325 kPa) and constant DES molar fraction (X3 = 0.1).
Figure 11.
Experimental and calculated data X’Y diagram for cyclohexane (1) + benzene (2) + DES (3) at constant pressure (101.325 kPa) and constant DES molar fraction (X3 = 0.1).
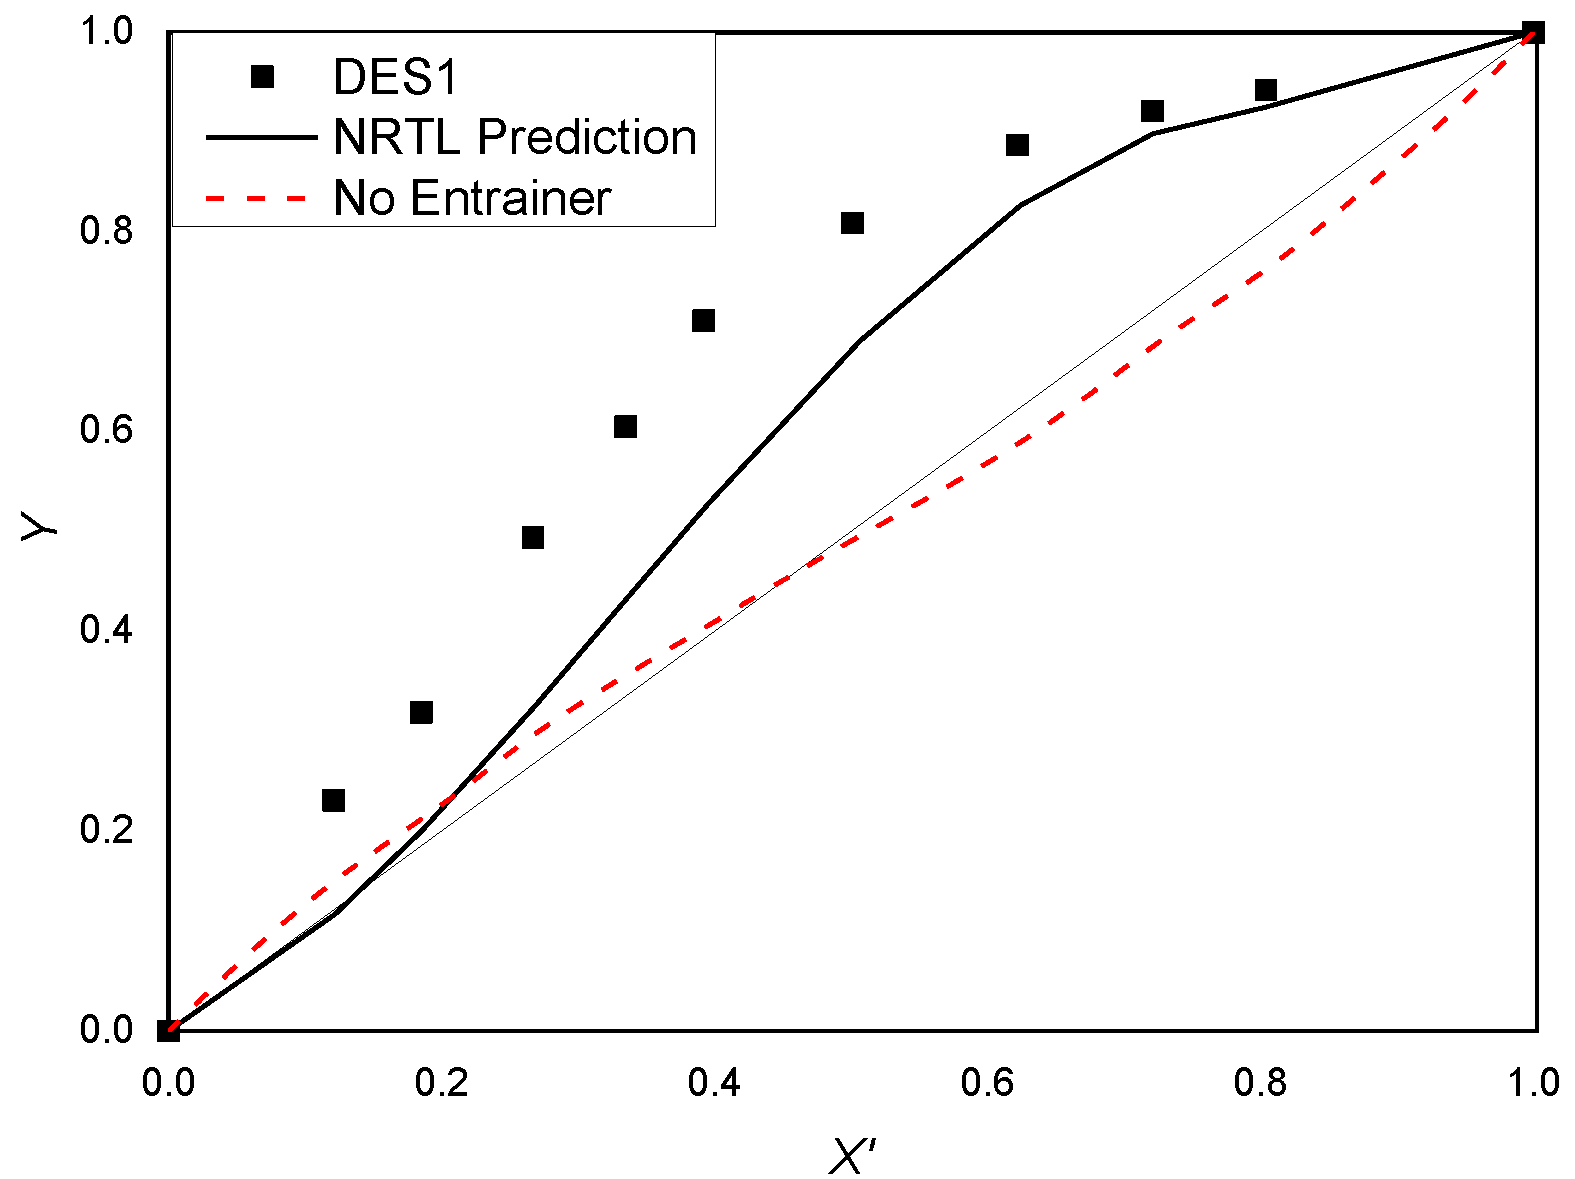
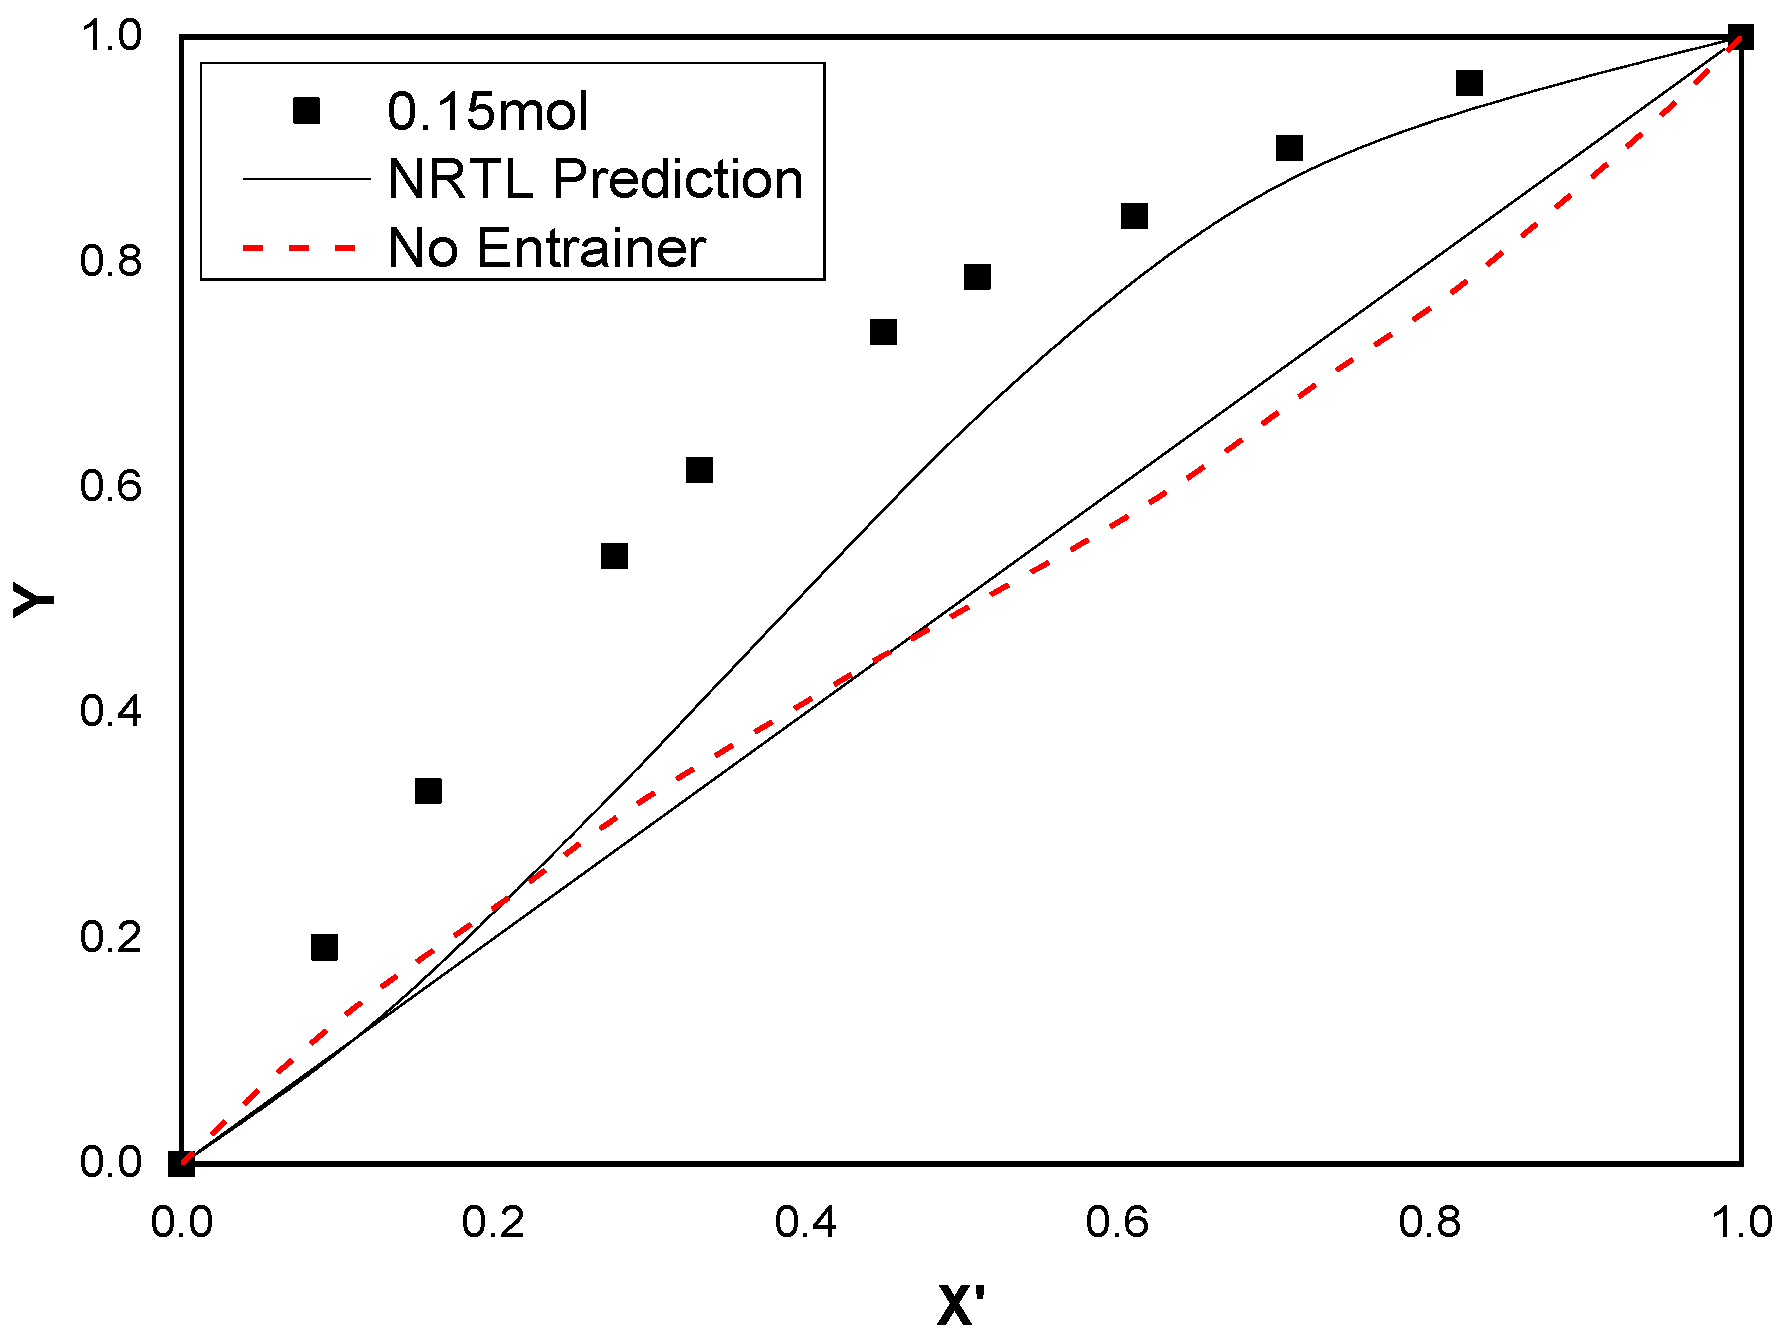
Figure 12.
Experimental and calculated data X’Y diagram for cyclohexane (1) + benzene (2) + DES (3) at constant pressure (101.325 kPa) and constant DES molar fraction (X3 = 0.15).
Figure 12.
Experimental and calculated data X’Y diagram for cyclohexane (1) + benzene (2) + DES (3) at constant pressure (101.325 kPa) and constant DES molar fraction (X3 = 0.15).
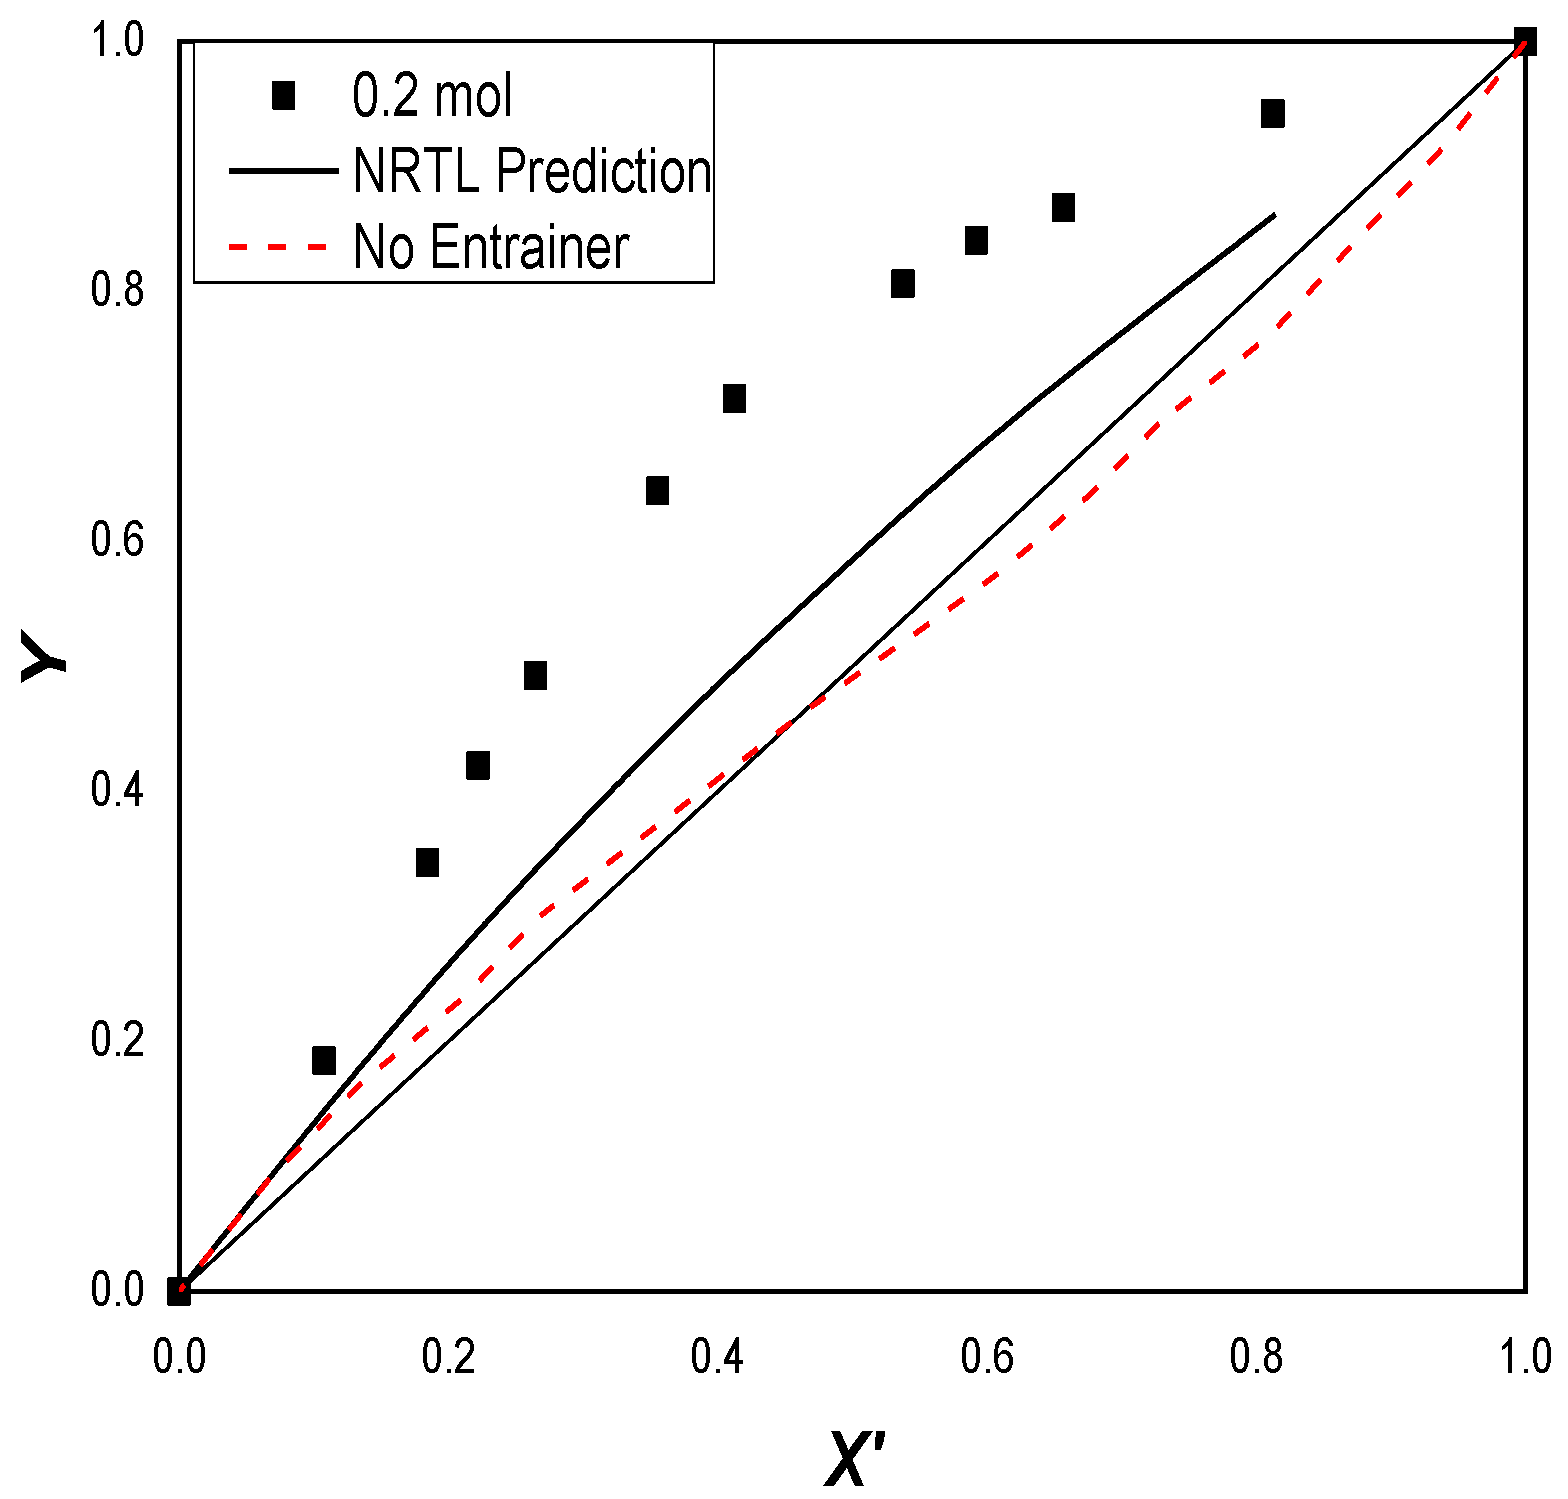
Figure 13.
Experimental and calculated data X’Y diagram for cyclohexane (1) + benzene (2) + DES (3) at constant pressure (101.325 kPa) and constant DES molar fraction (X3 = 0.2).
Figure 13.
Experimental and calculated data X’Y diagram for cyclohexane (1) + benzene (2) + DES (3) at constant pressure (101.325 kPa) and constant DES molar fraction (X3 = 0.2).
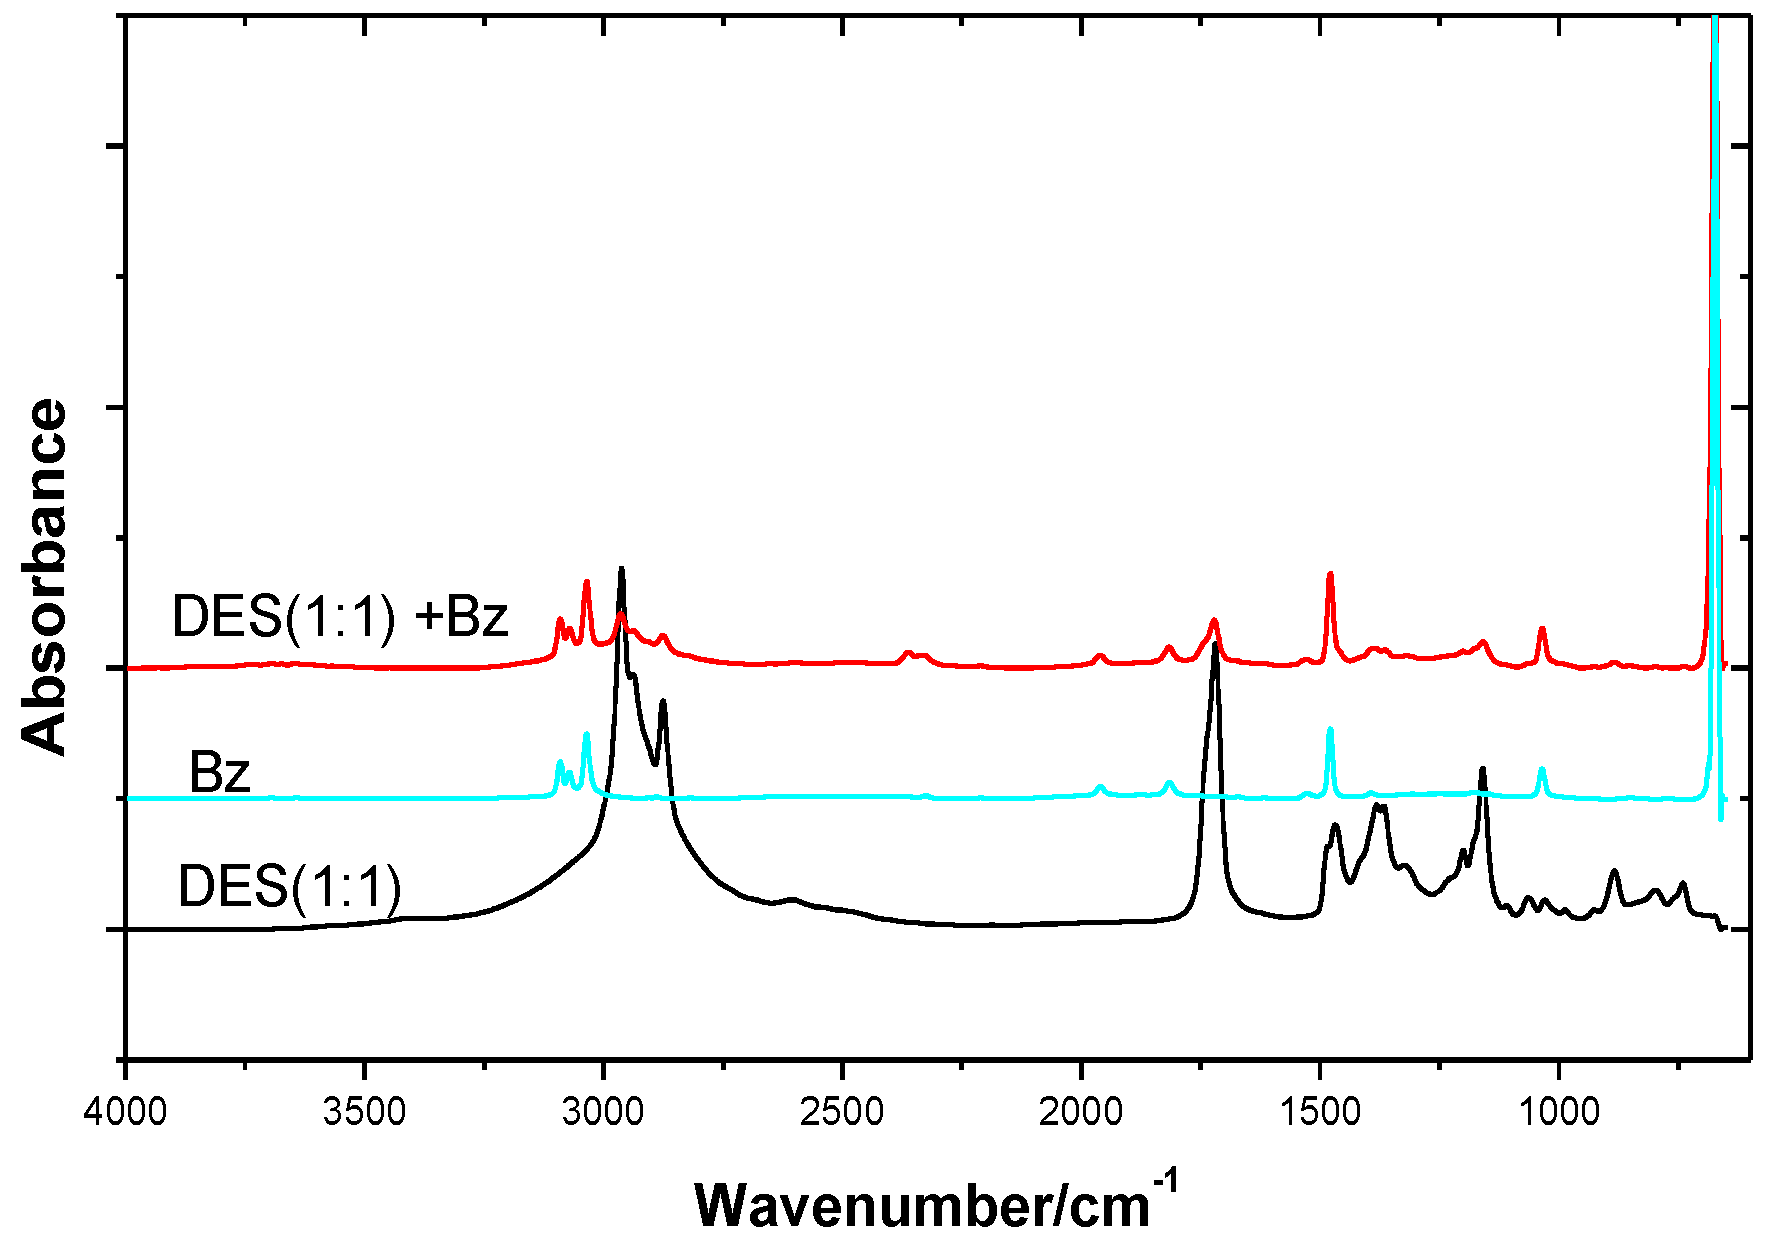
Figure 14.
FT−IR spectra of DES(1:1), benzene and DES(1:1) + benzene(DES 0.1 (molar concentration)).
Figure 14.
FT−IR spectra of DES(1:1), benzene and DES(1:1) + benzene(DES 0.1 (molar concentration)).
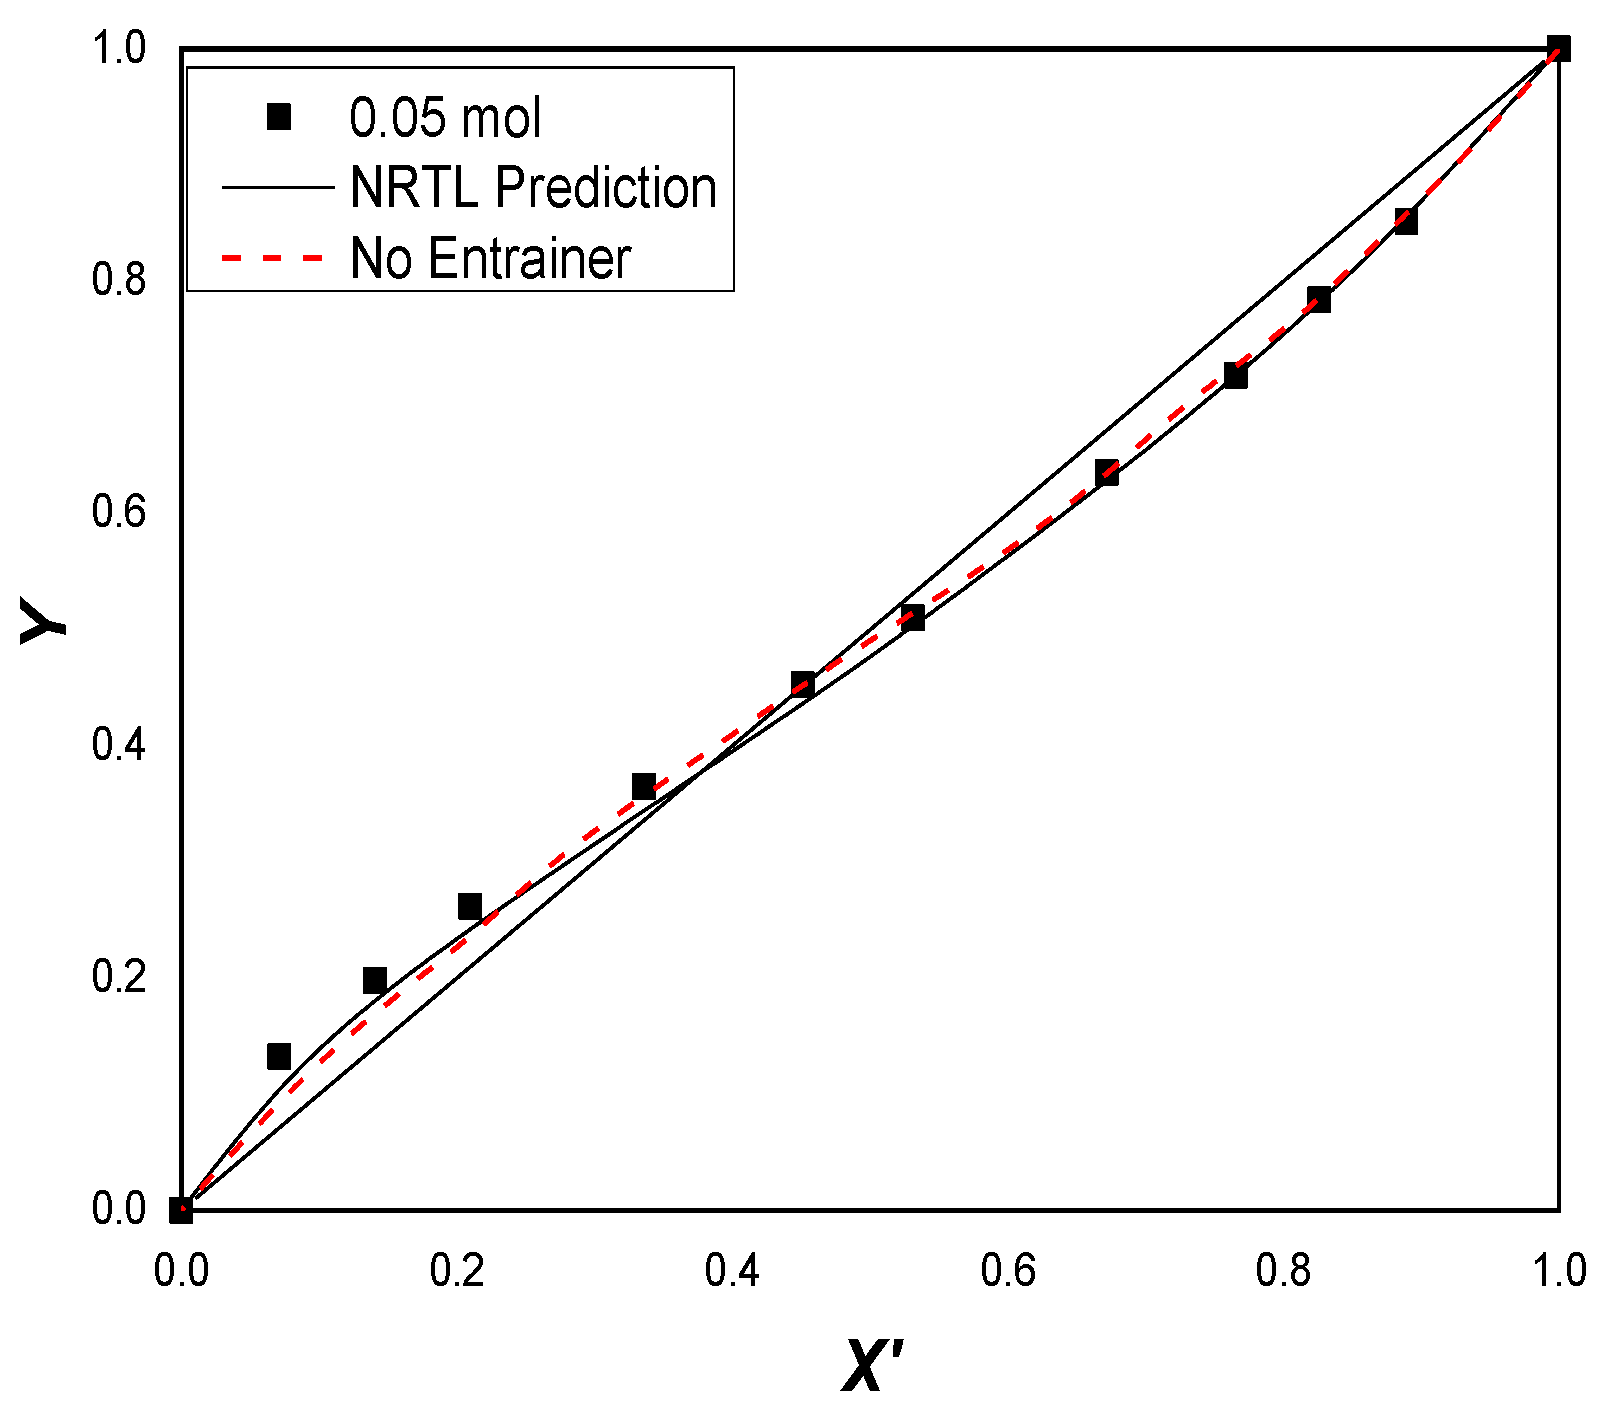
Figure 15.
Experimental and calculated data X’Y diagram for cyclohexane (1) + benzene (2) + DES (3) at constant pressure (101.325 kPa) and DES molar fraction (X3 = 0.05).
Figure 15.
Experimental and calculated data X’Y diagram for cyclohexane (1) + benzene (2) + DES (3) at constant pressure (101.325 kPa) and DES molar fraction (X3 = 0.05).
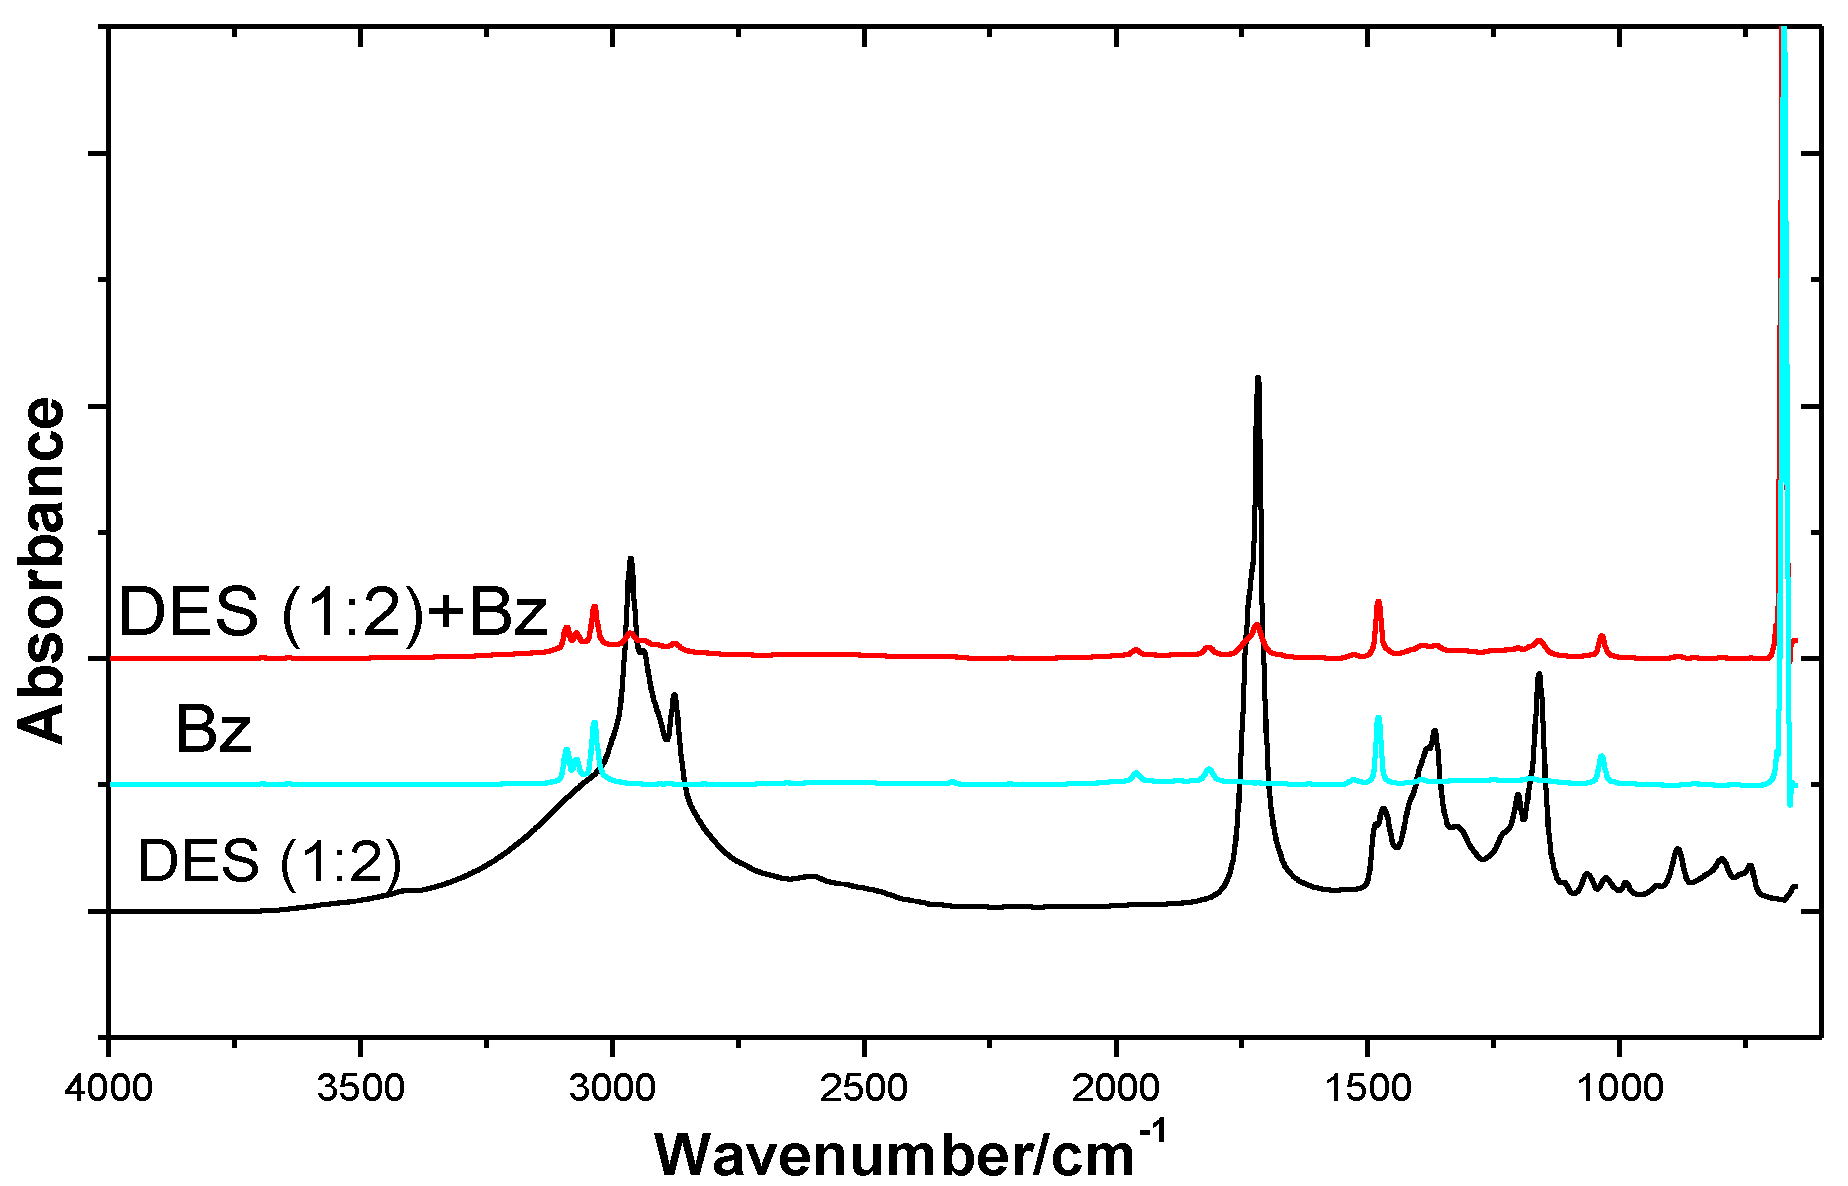
Figure 16.
FT−IR spectra of DES(1:2), benzene and DES(1:2) + benzene(DES 0.1 (molar concentration)).
Figure 16.
FT−IR spectra of DES(1:2), benzene and DES(1:2) + benzene(DES 0.1 (molar concentration)).
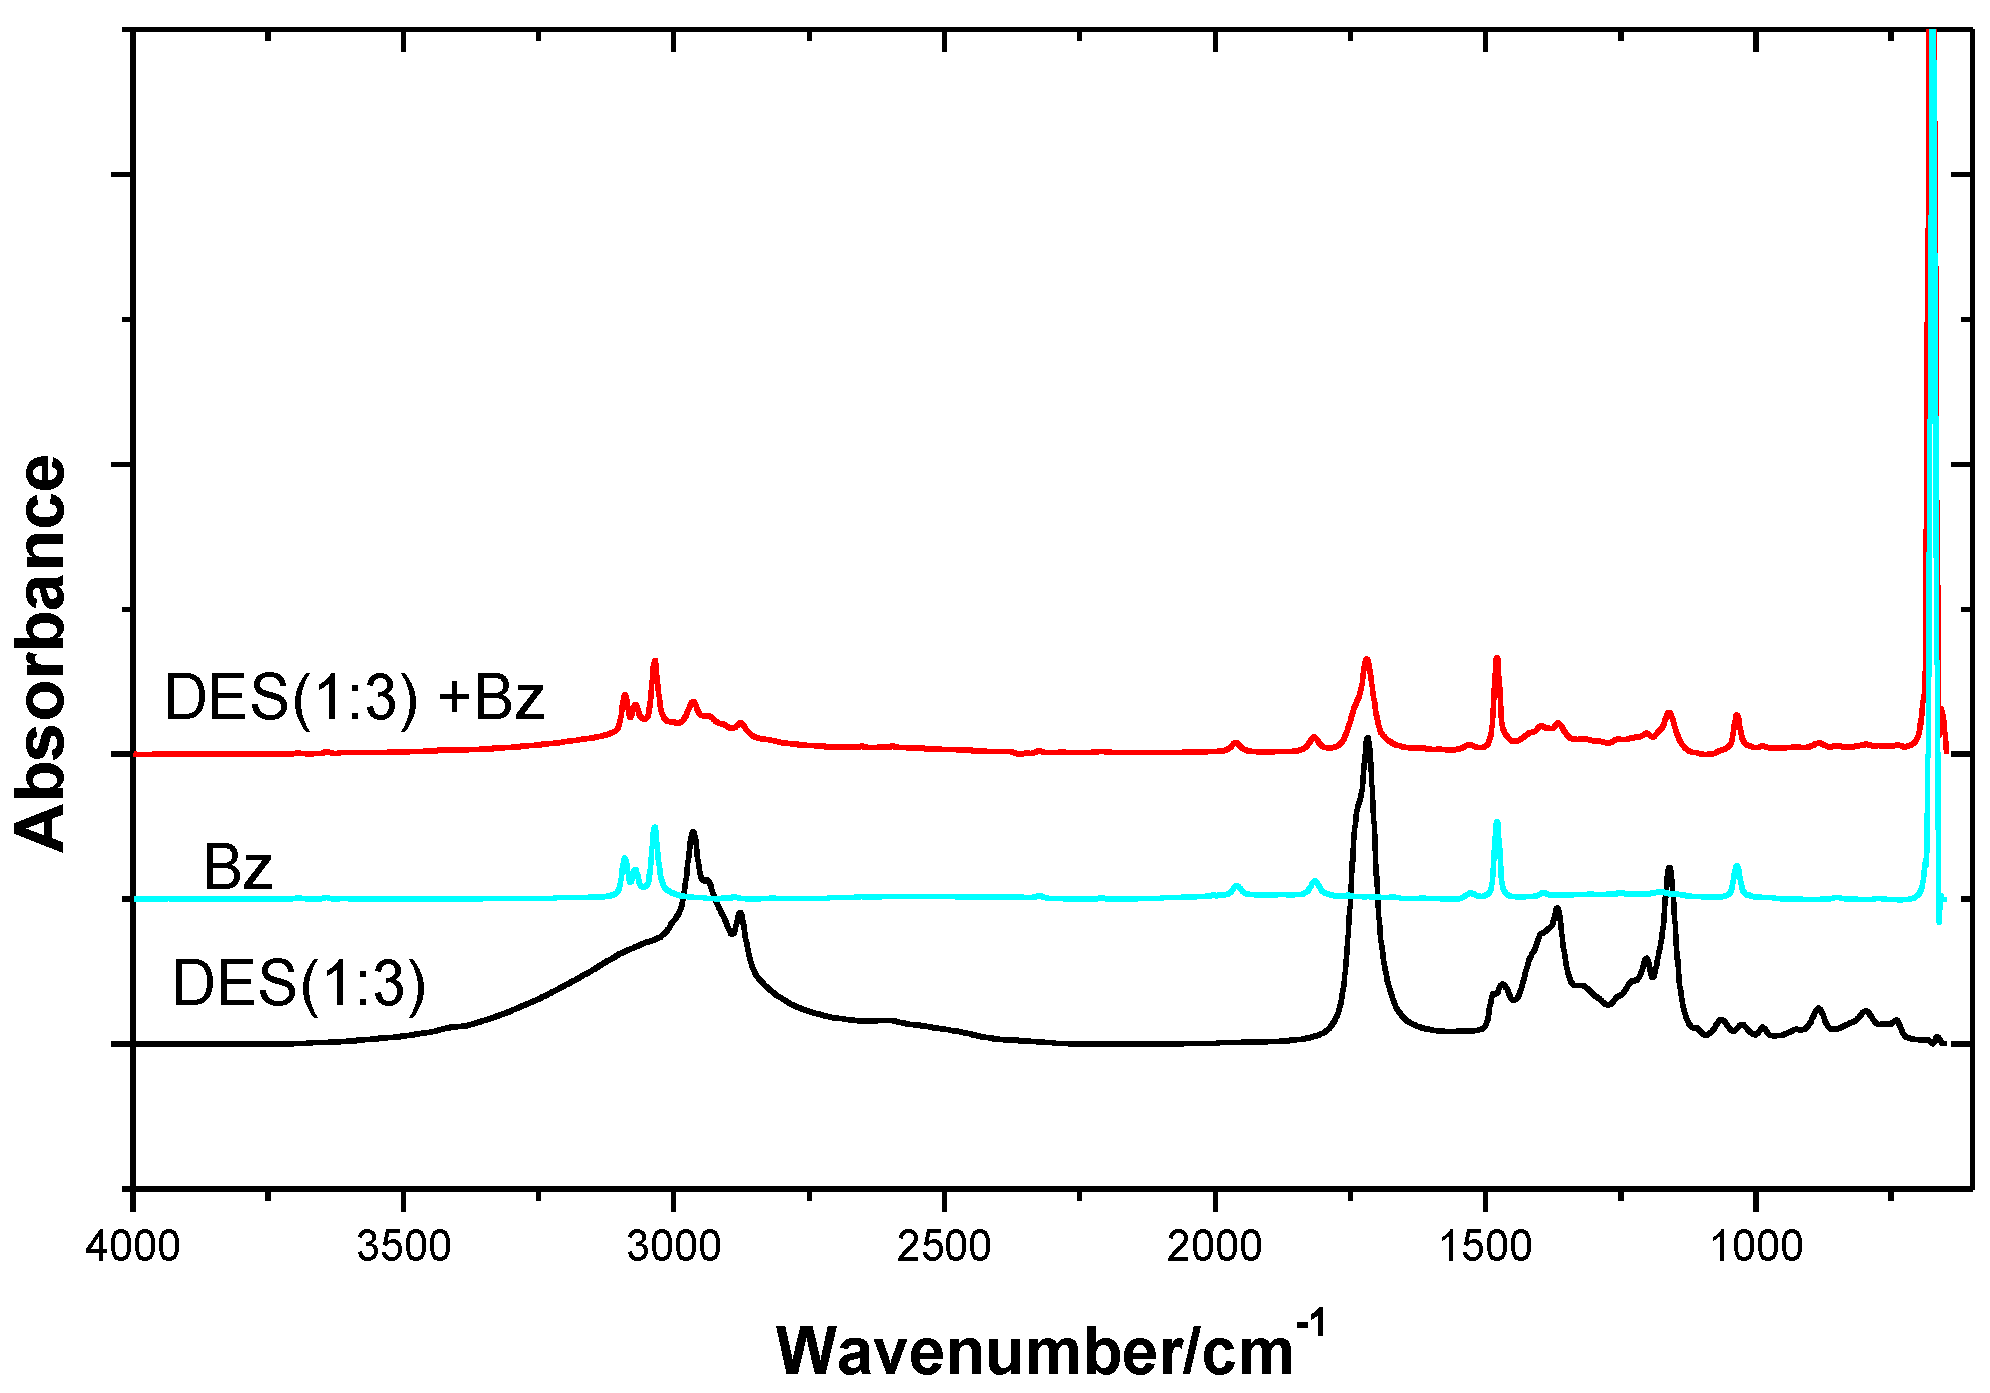
Figure 17.
FT-IR spectra of DES(1:3), benzene and DES(1:3) + benzene(DES 0.1 (molar concentration)).
Figure 17.
FT-IR spectra of DES(1:3), benzene and DES(1:3) + benzene(DES 0.1 (molar concentration)).
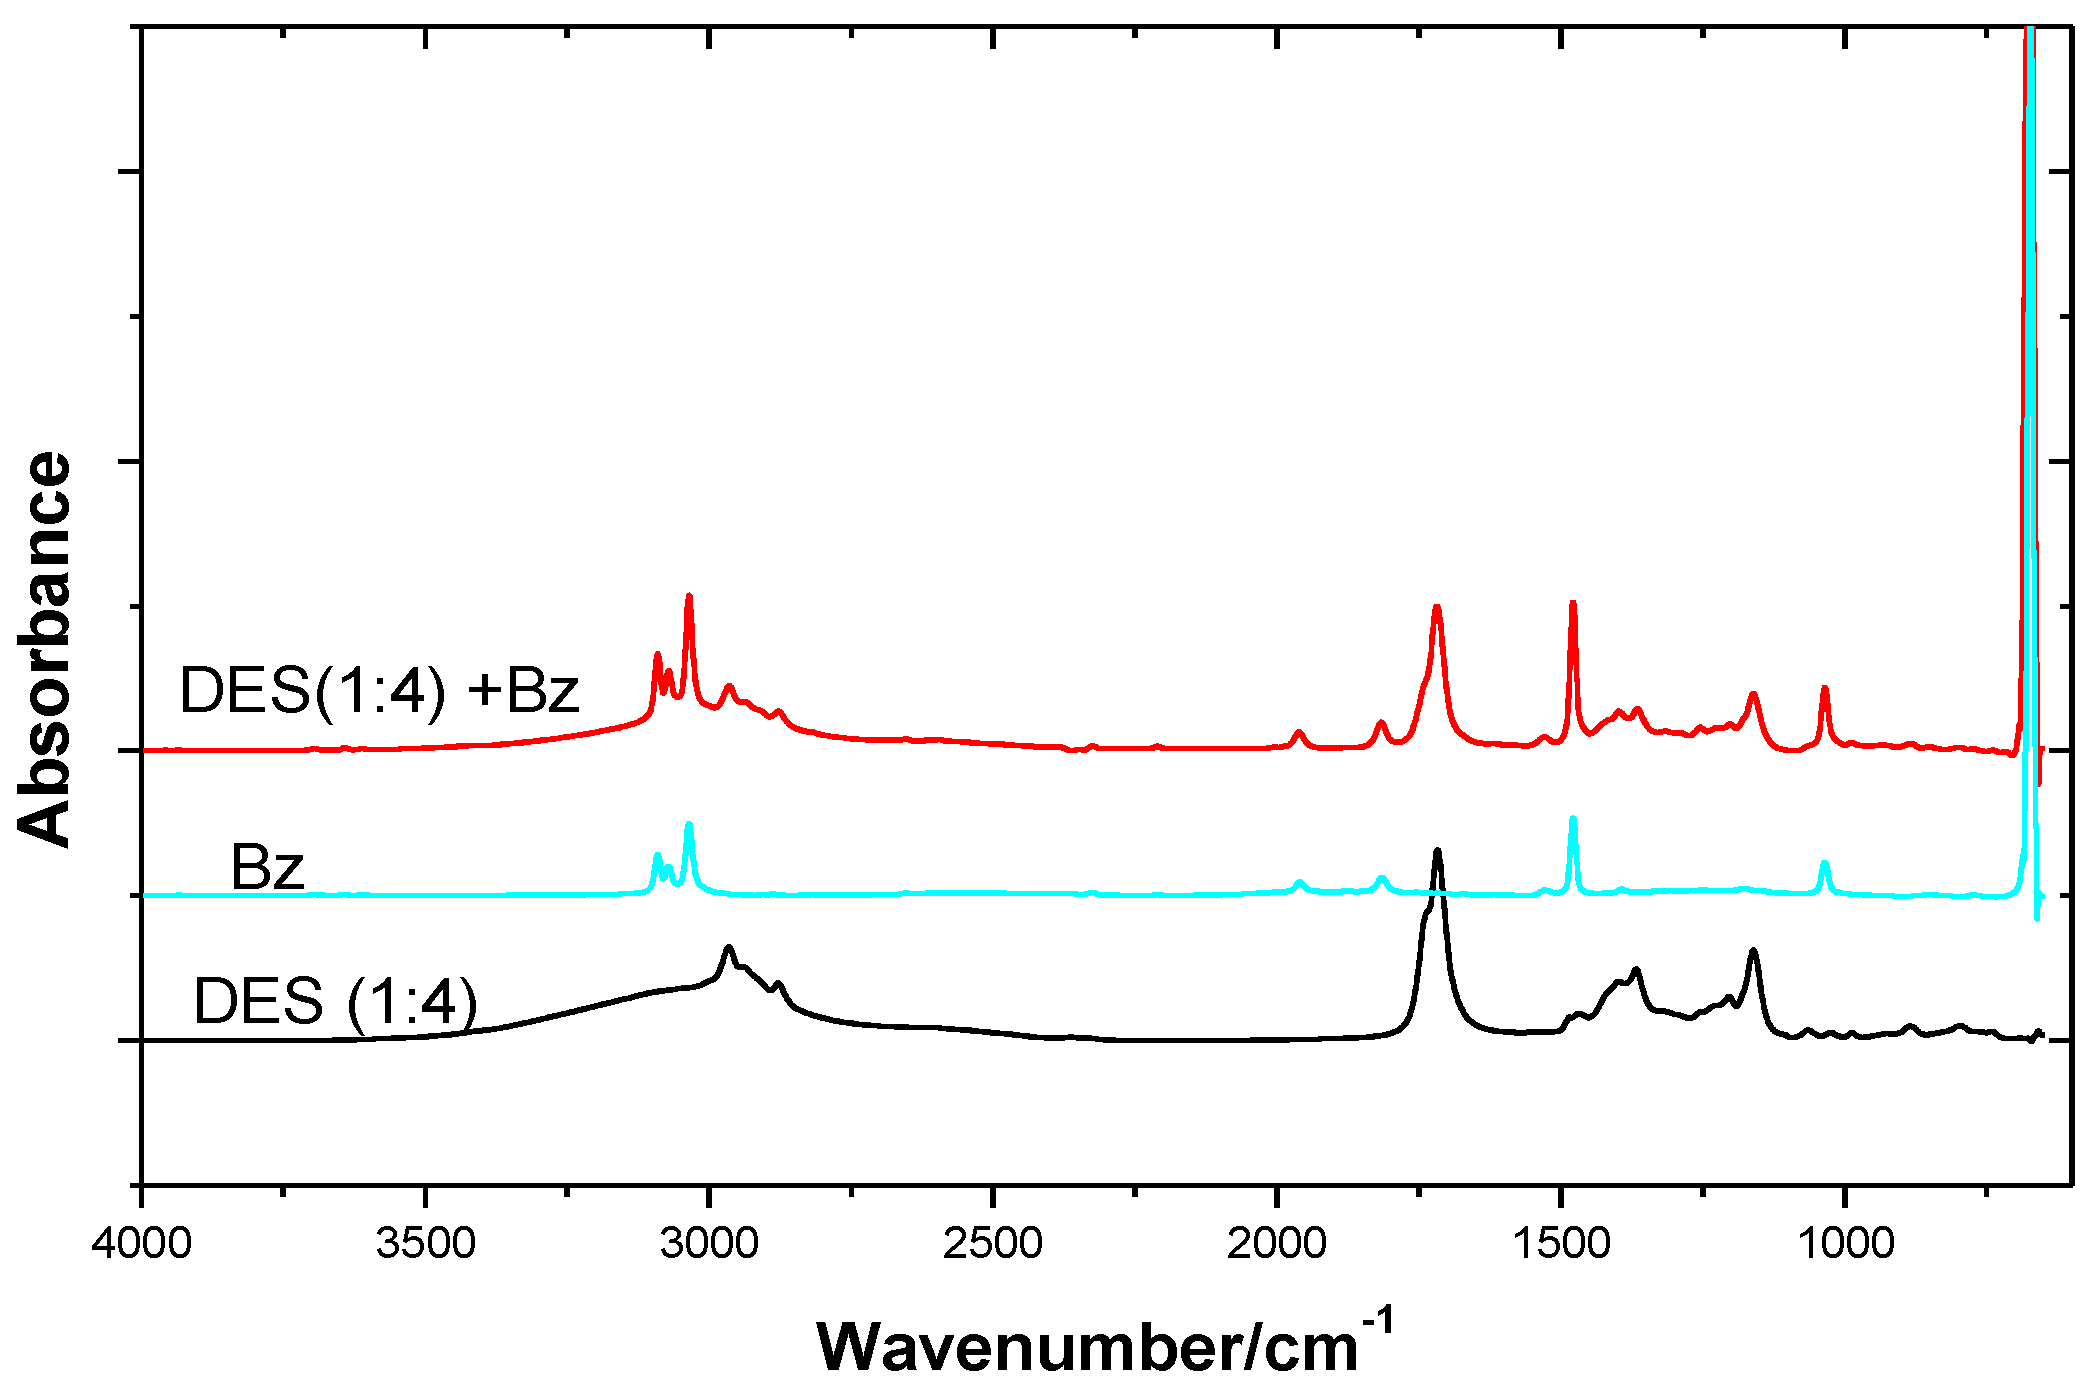
Figure 18.
FT−IR spectra of DES(1:4), benzene and DES(1:4) + benzene(DES 0.1 (molar concentration)).
Figure 18.
FT−IR spectra of DES(1:4), benzene and DES(1:4) + benzene(DES 0.1 (molar concentration)).
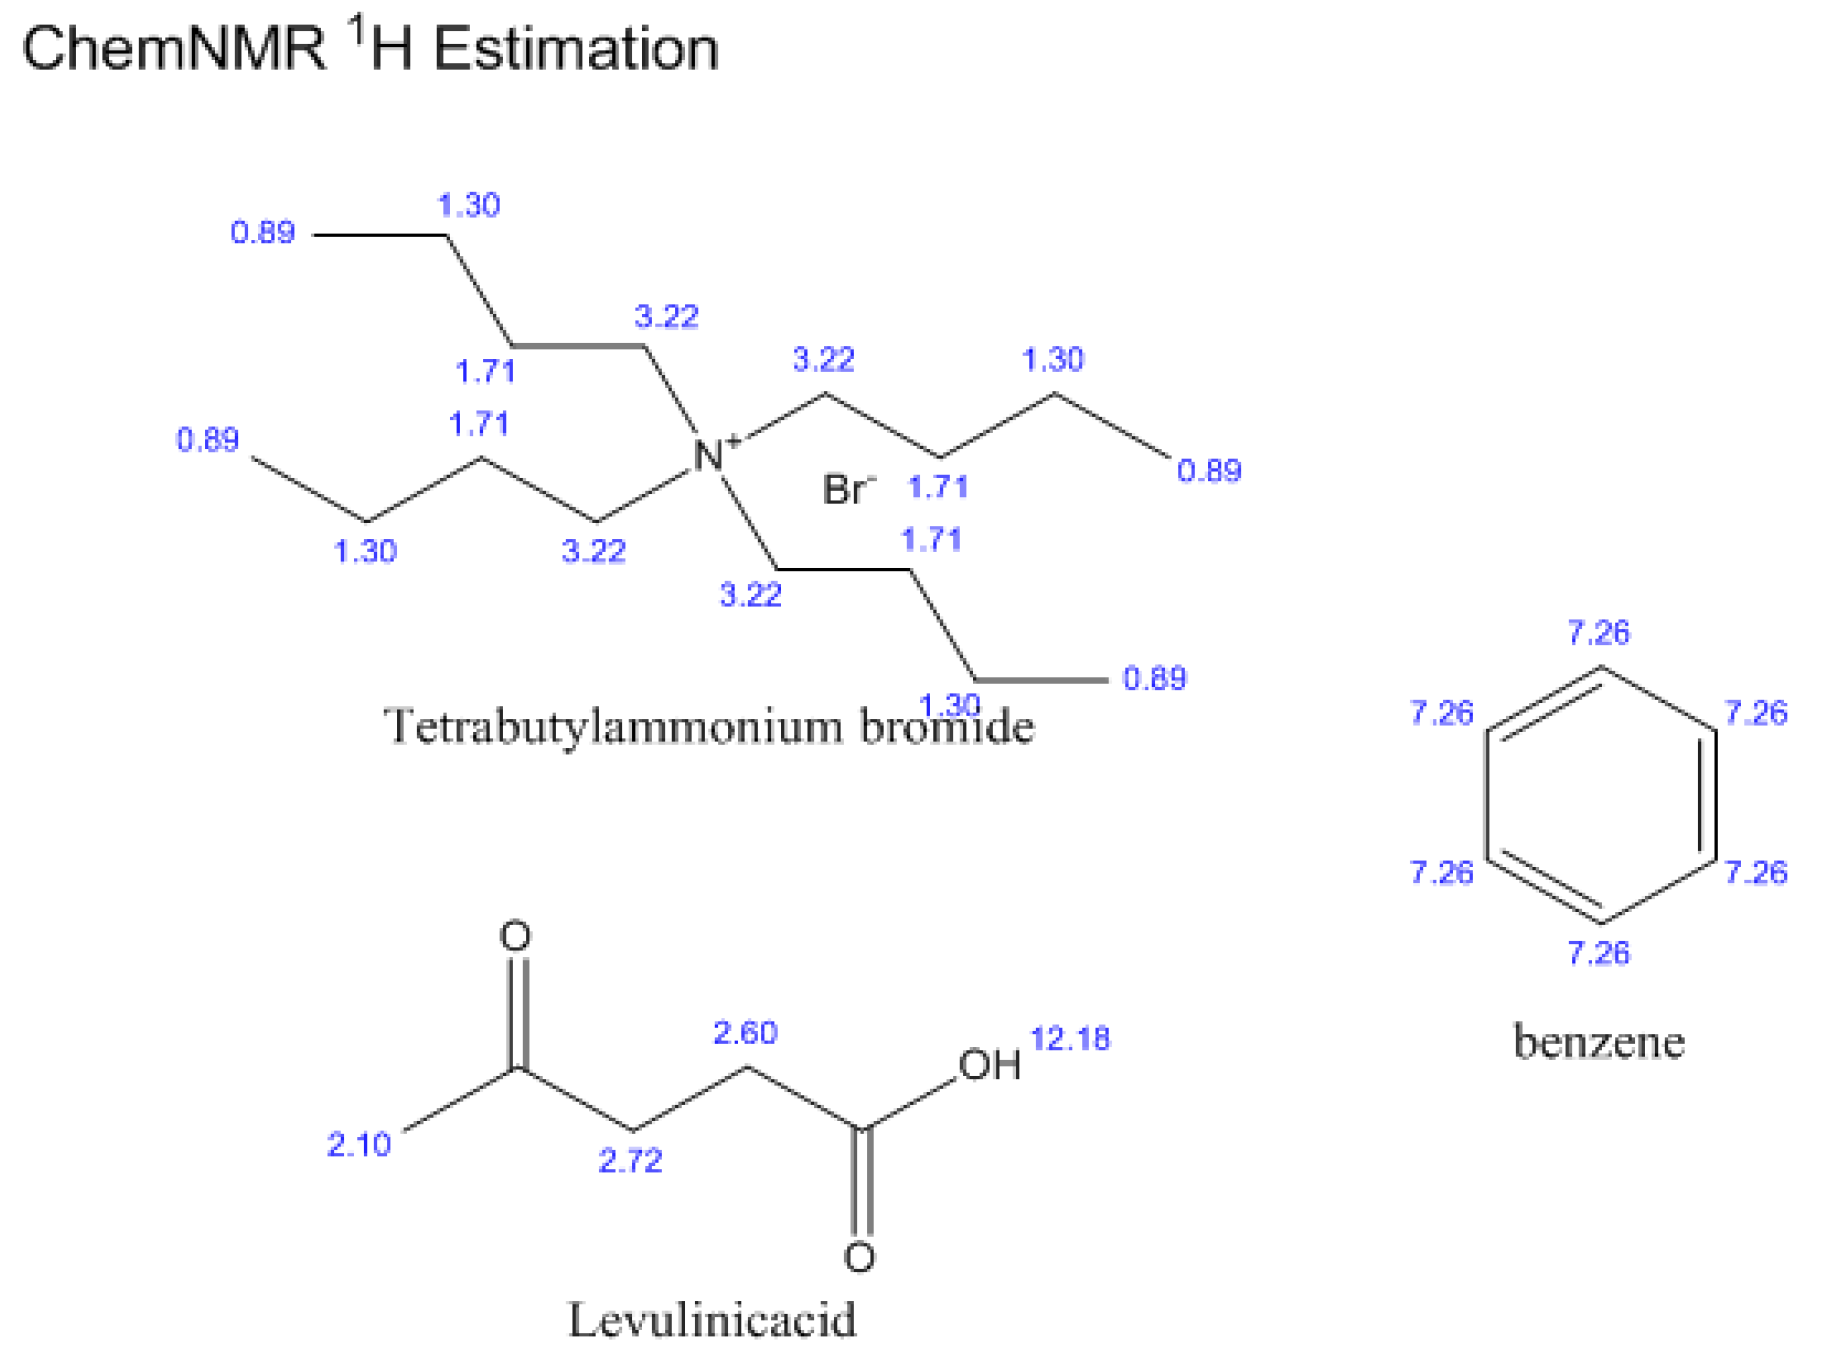
Figure 19.
Chemical shift values of intramolecular hydrogen atoms of TBAB, LA, and benzene estimated by ChemDraw.
Figure 19.
Chemical shift values of intramolecular hydrogen atoms of TBAB, LA, and benzene estimated by ChemDraw.
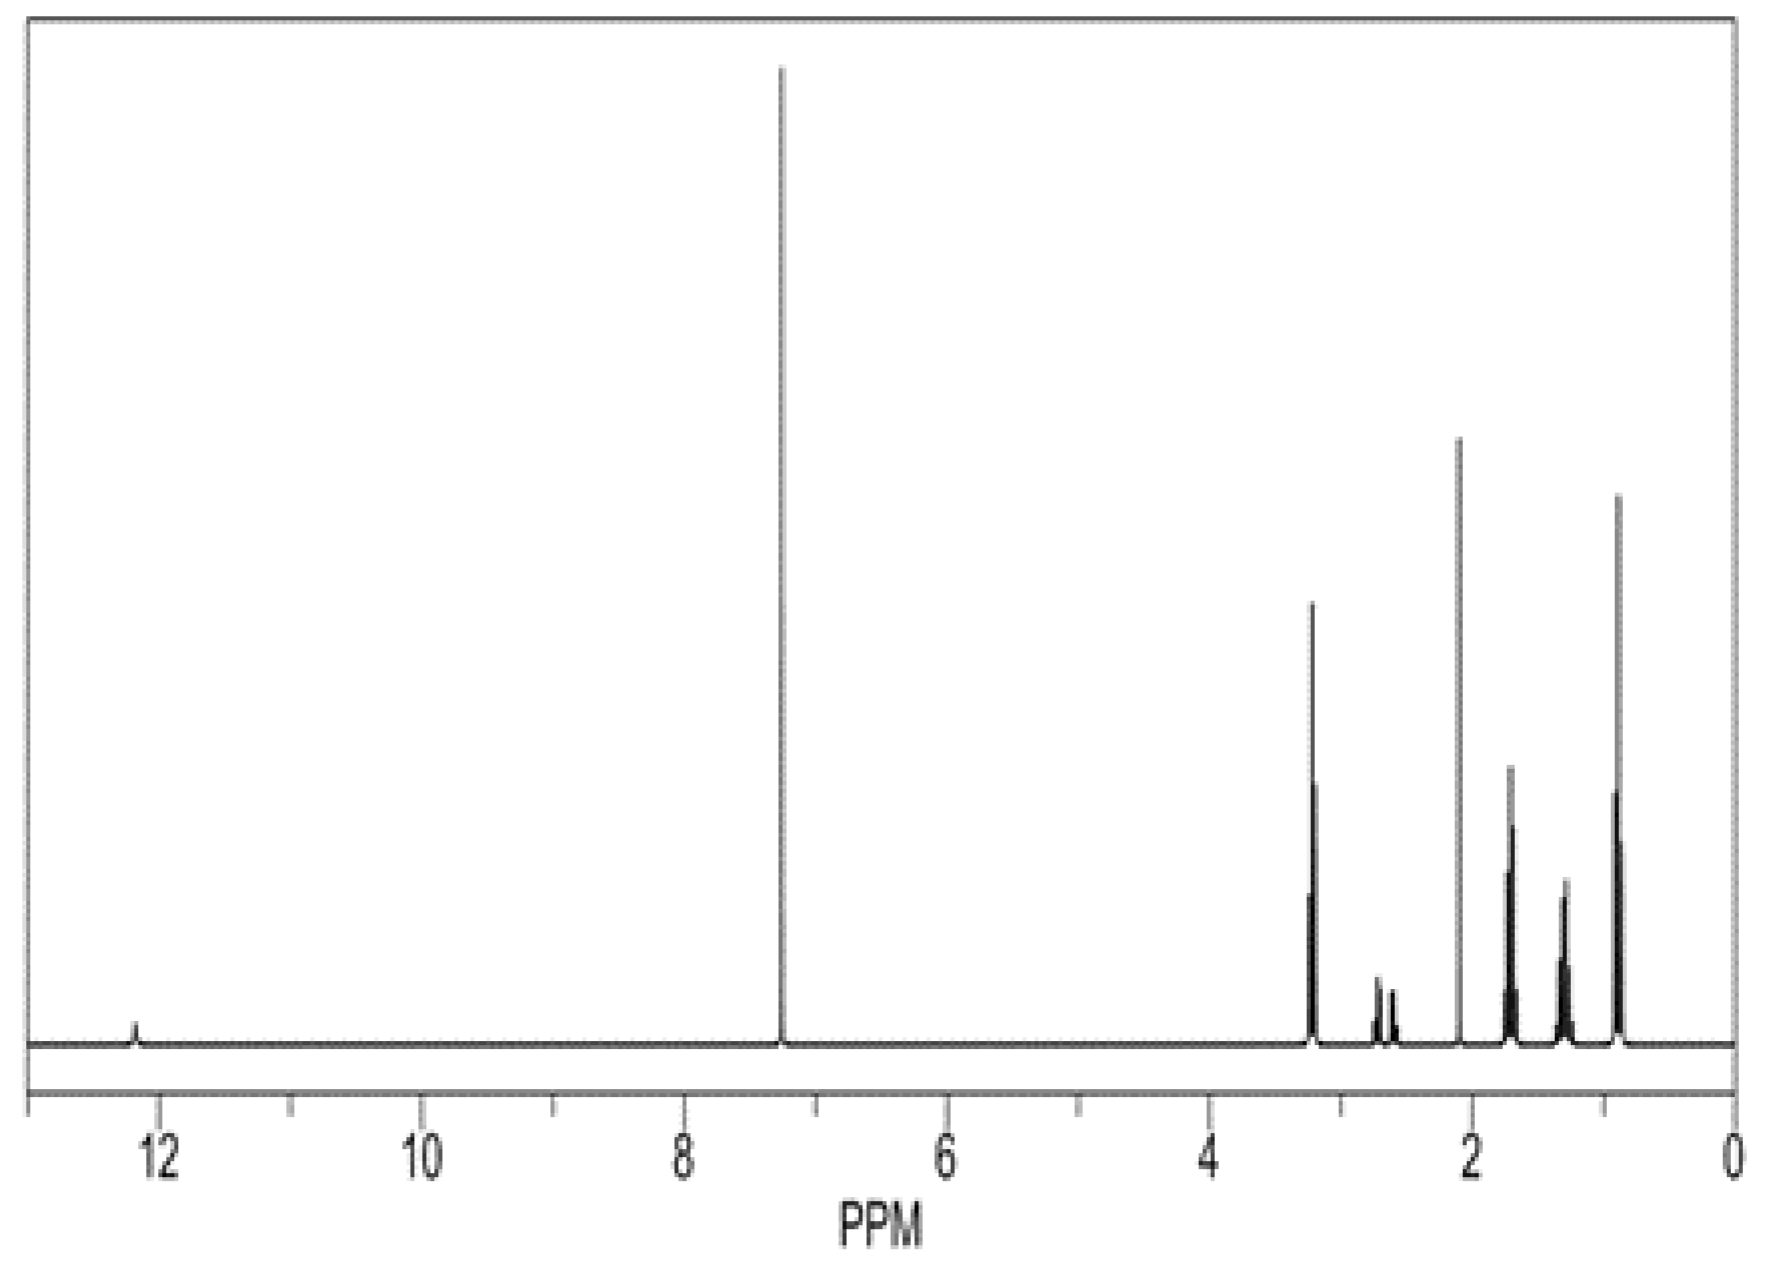
Figure 20.
1H NMR of TBAB, LA and benzene estimated by ChemDraw.
Figure 20.
1H NMR of TBAB, LA and benzene estimated by ChemDraw.
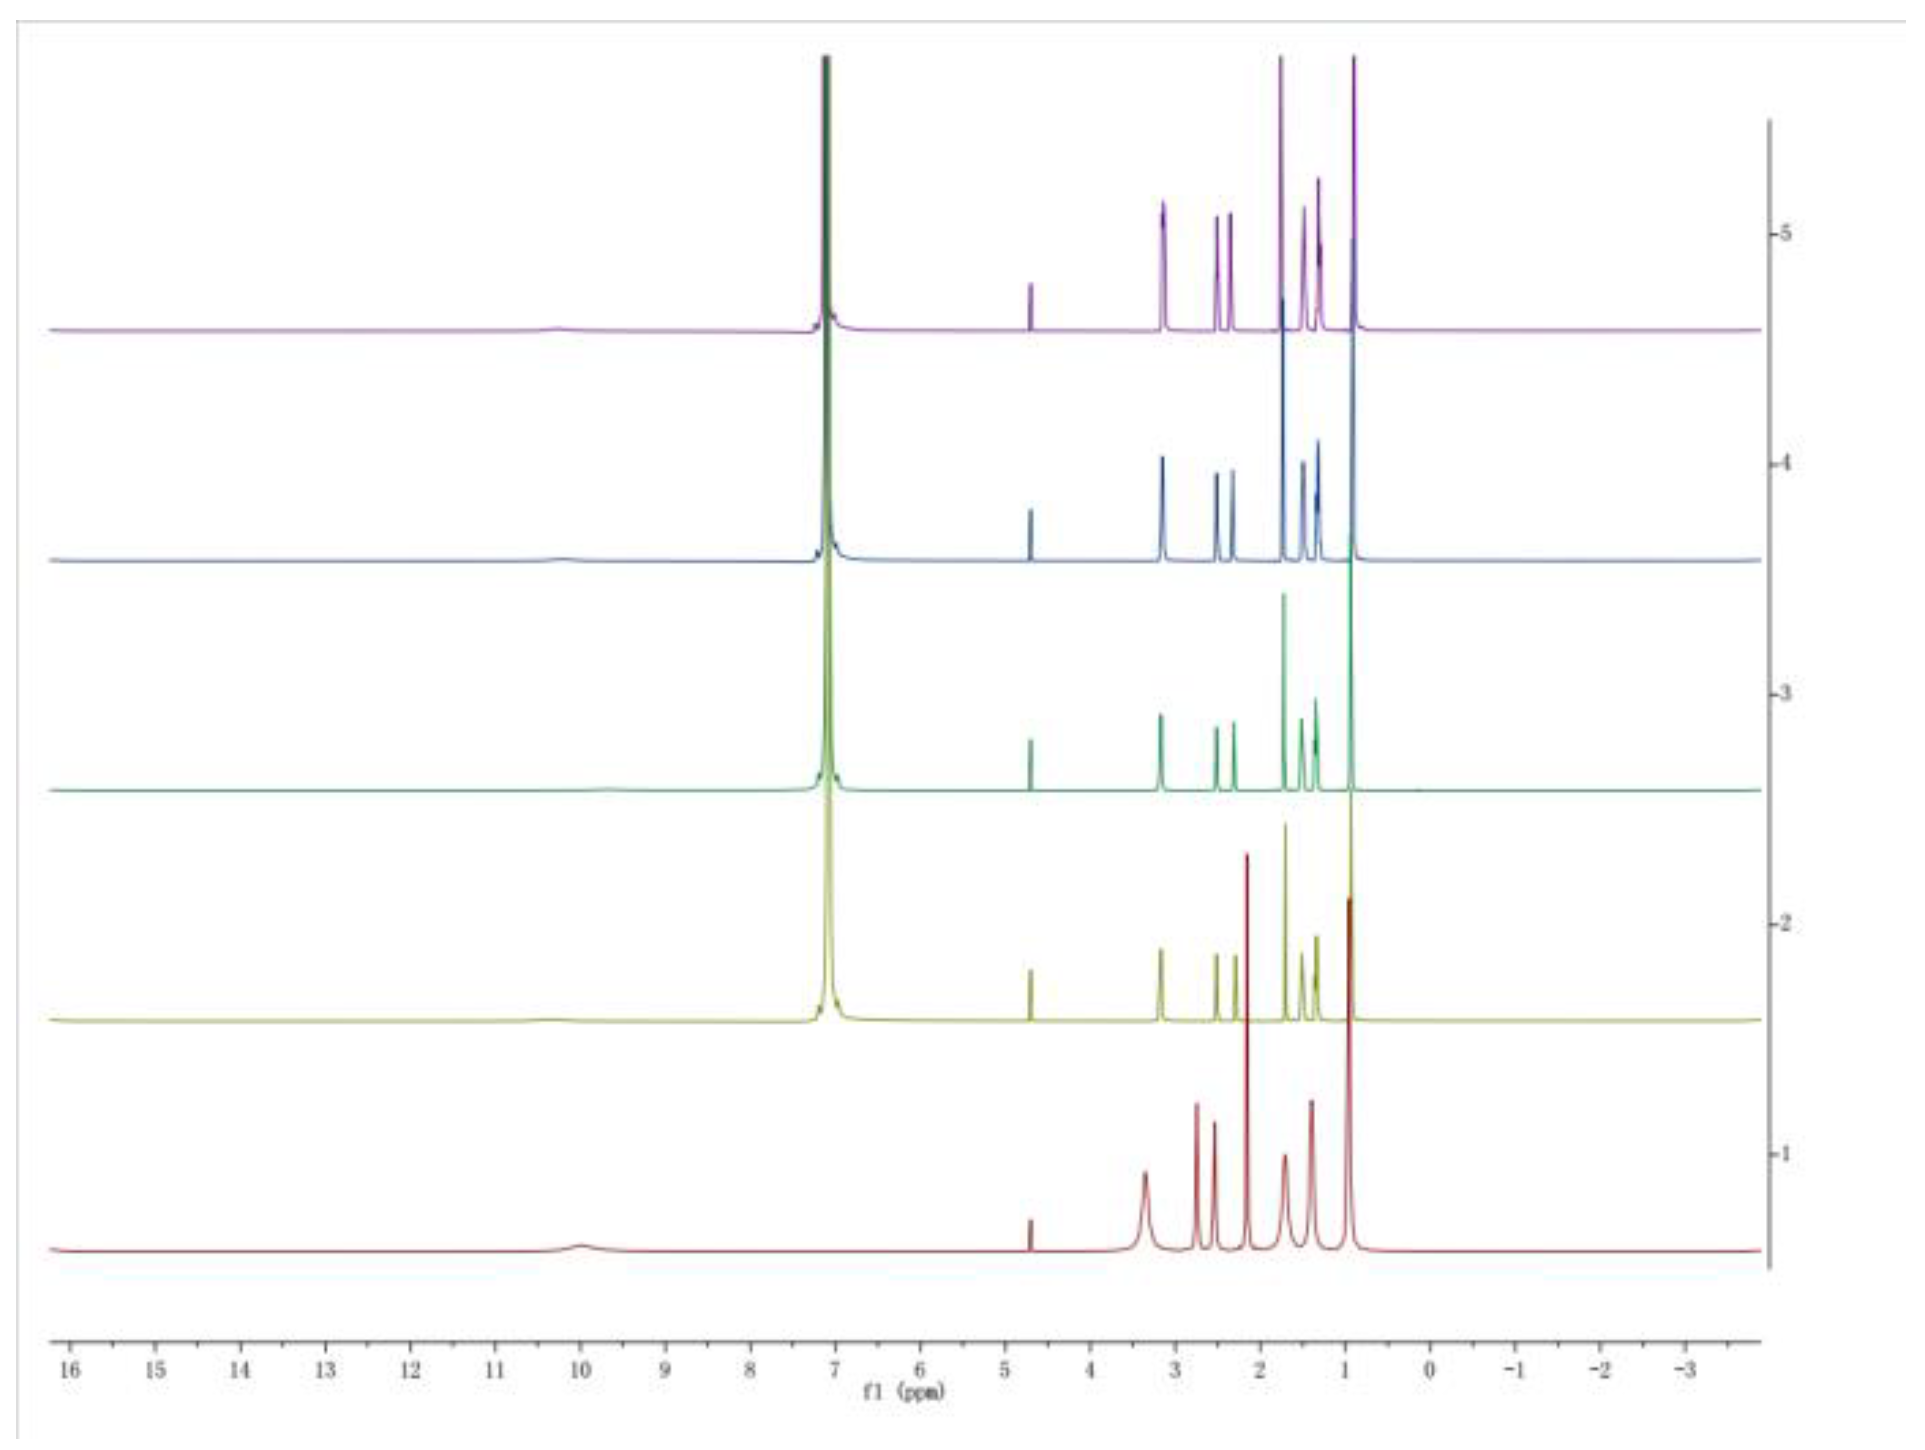
Figure 21.
1H NMR of different molar ratios DES(1:2) and benzene (the DES mole concentrations are 1, 0.05, 0.1, 0.15, and 0.2 from the bottom up, respectively).
Figure 21.
1H NMR of different molar ratios DES(1:2) and benzene (the DES mole concentrations are 1, 0.05, 0.1, 0.15, and 0.2 from the bottom up, respectively).
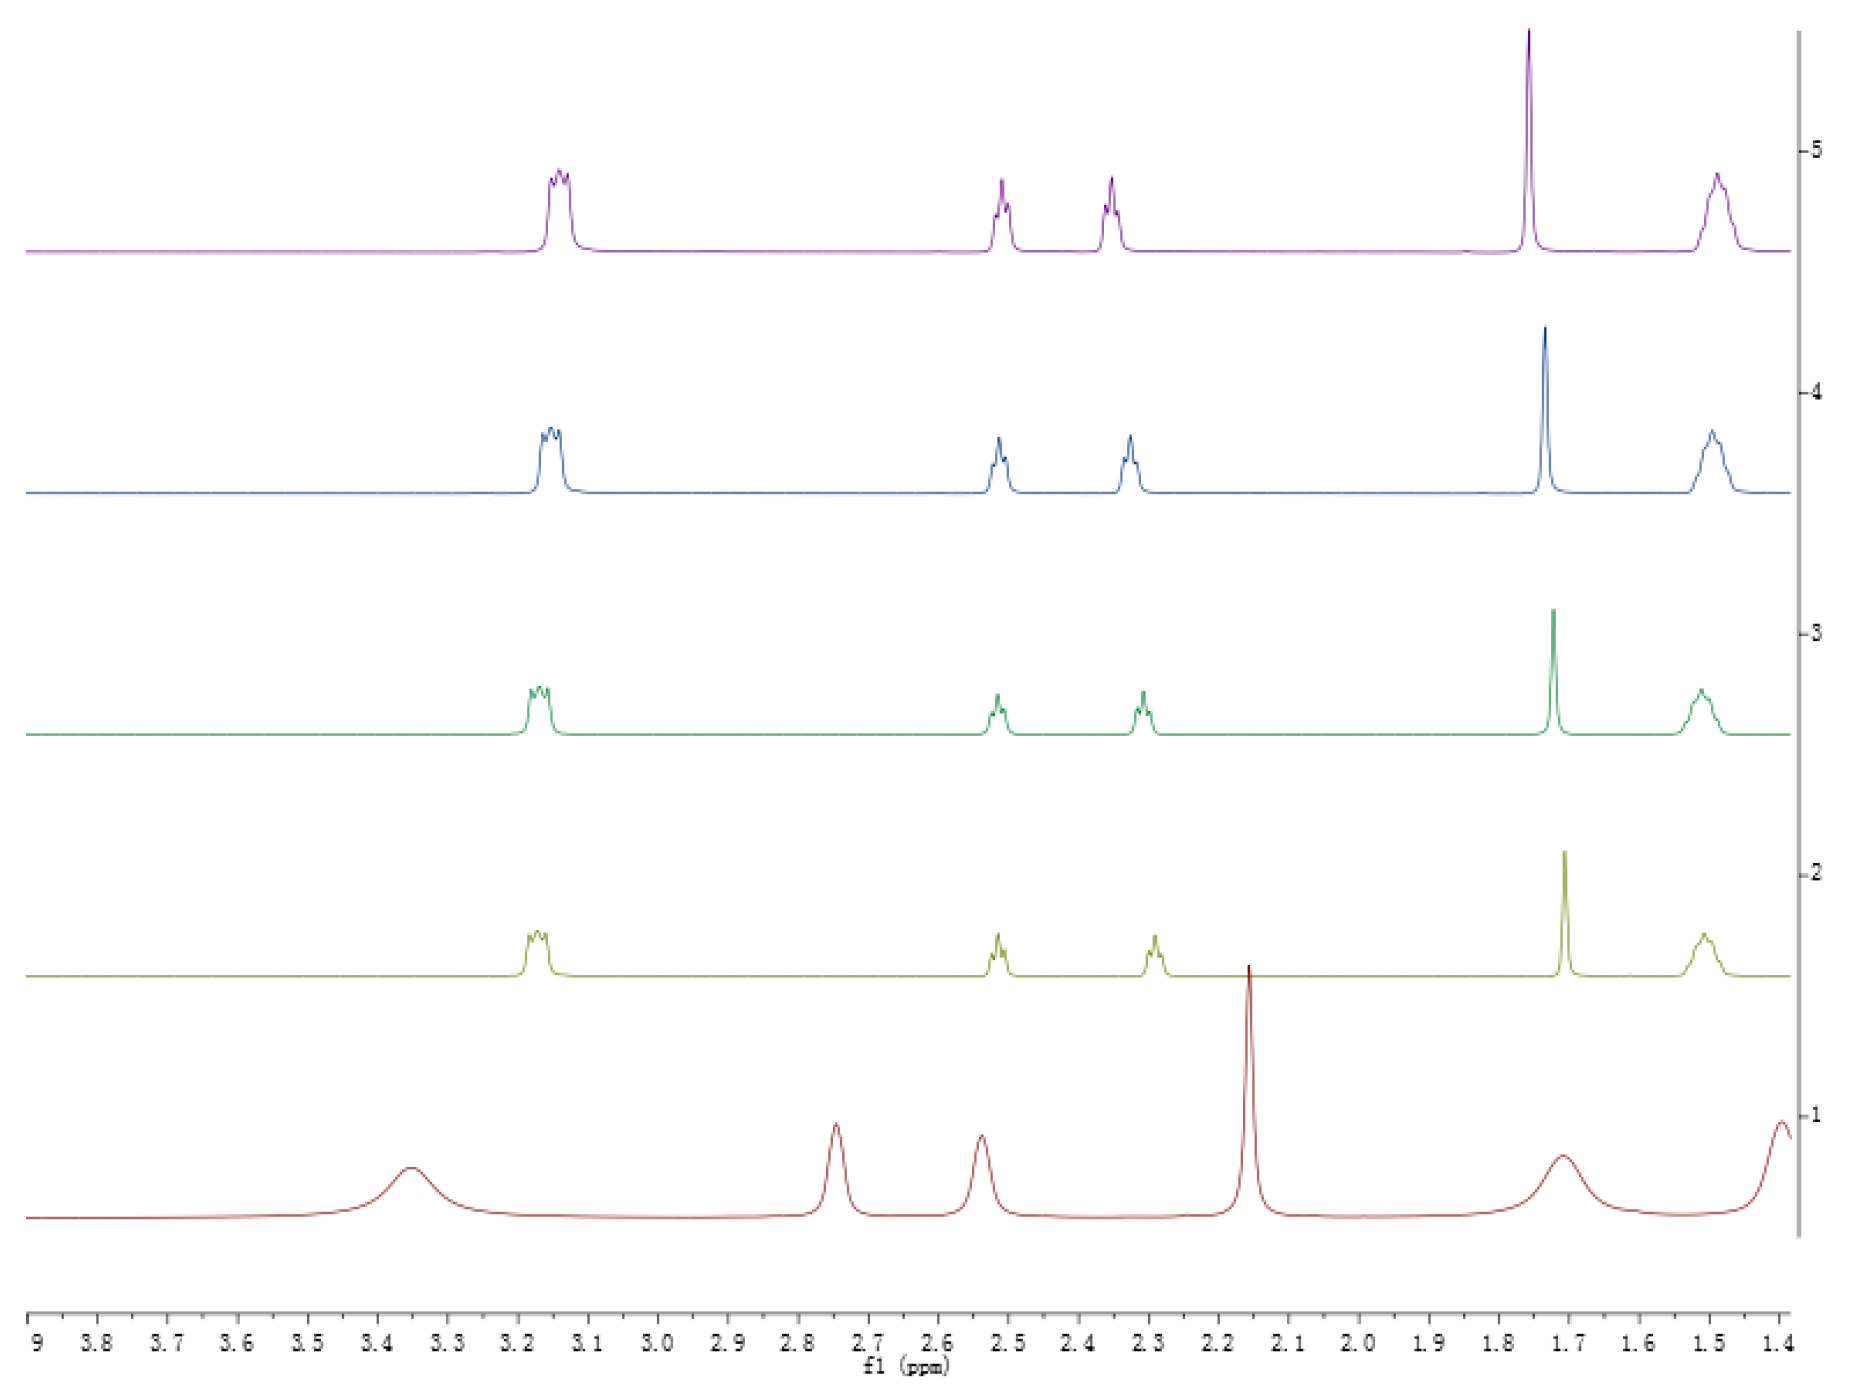
Figure 22.
A part of a larger view of
Figure 21.
Figure 22.
A part of a larger view of
Figure 21.
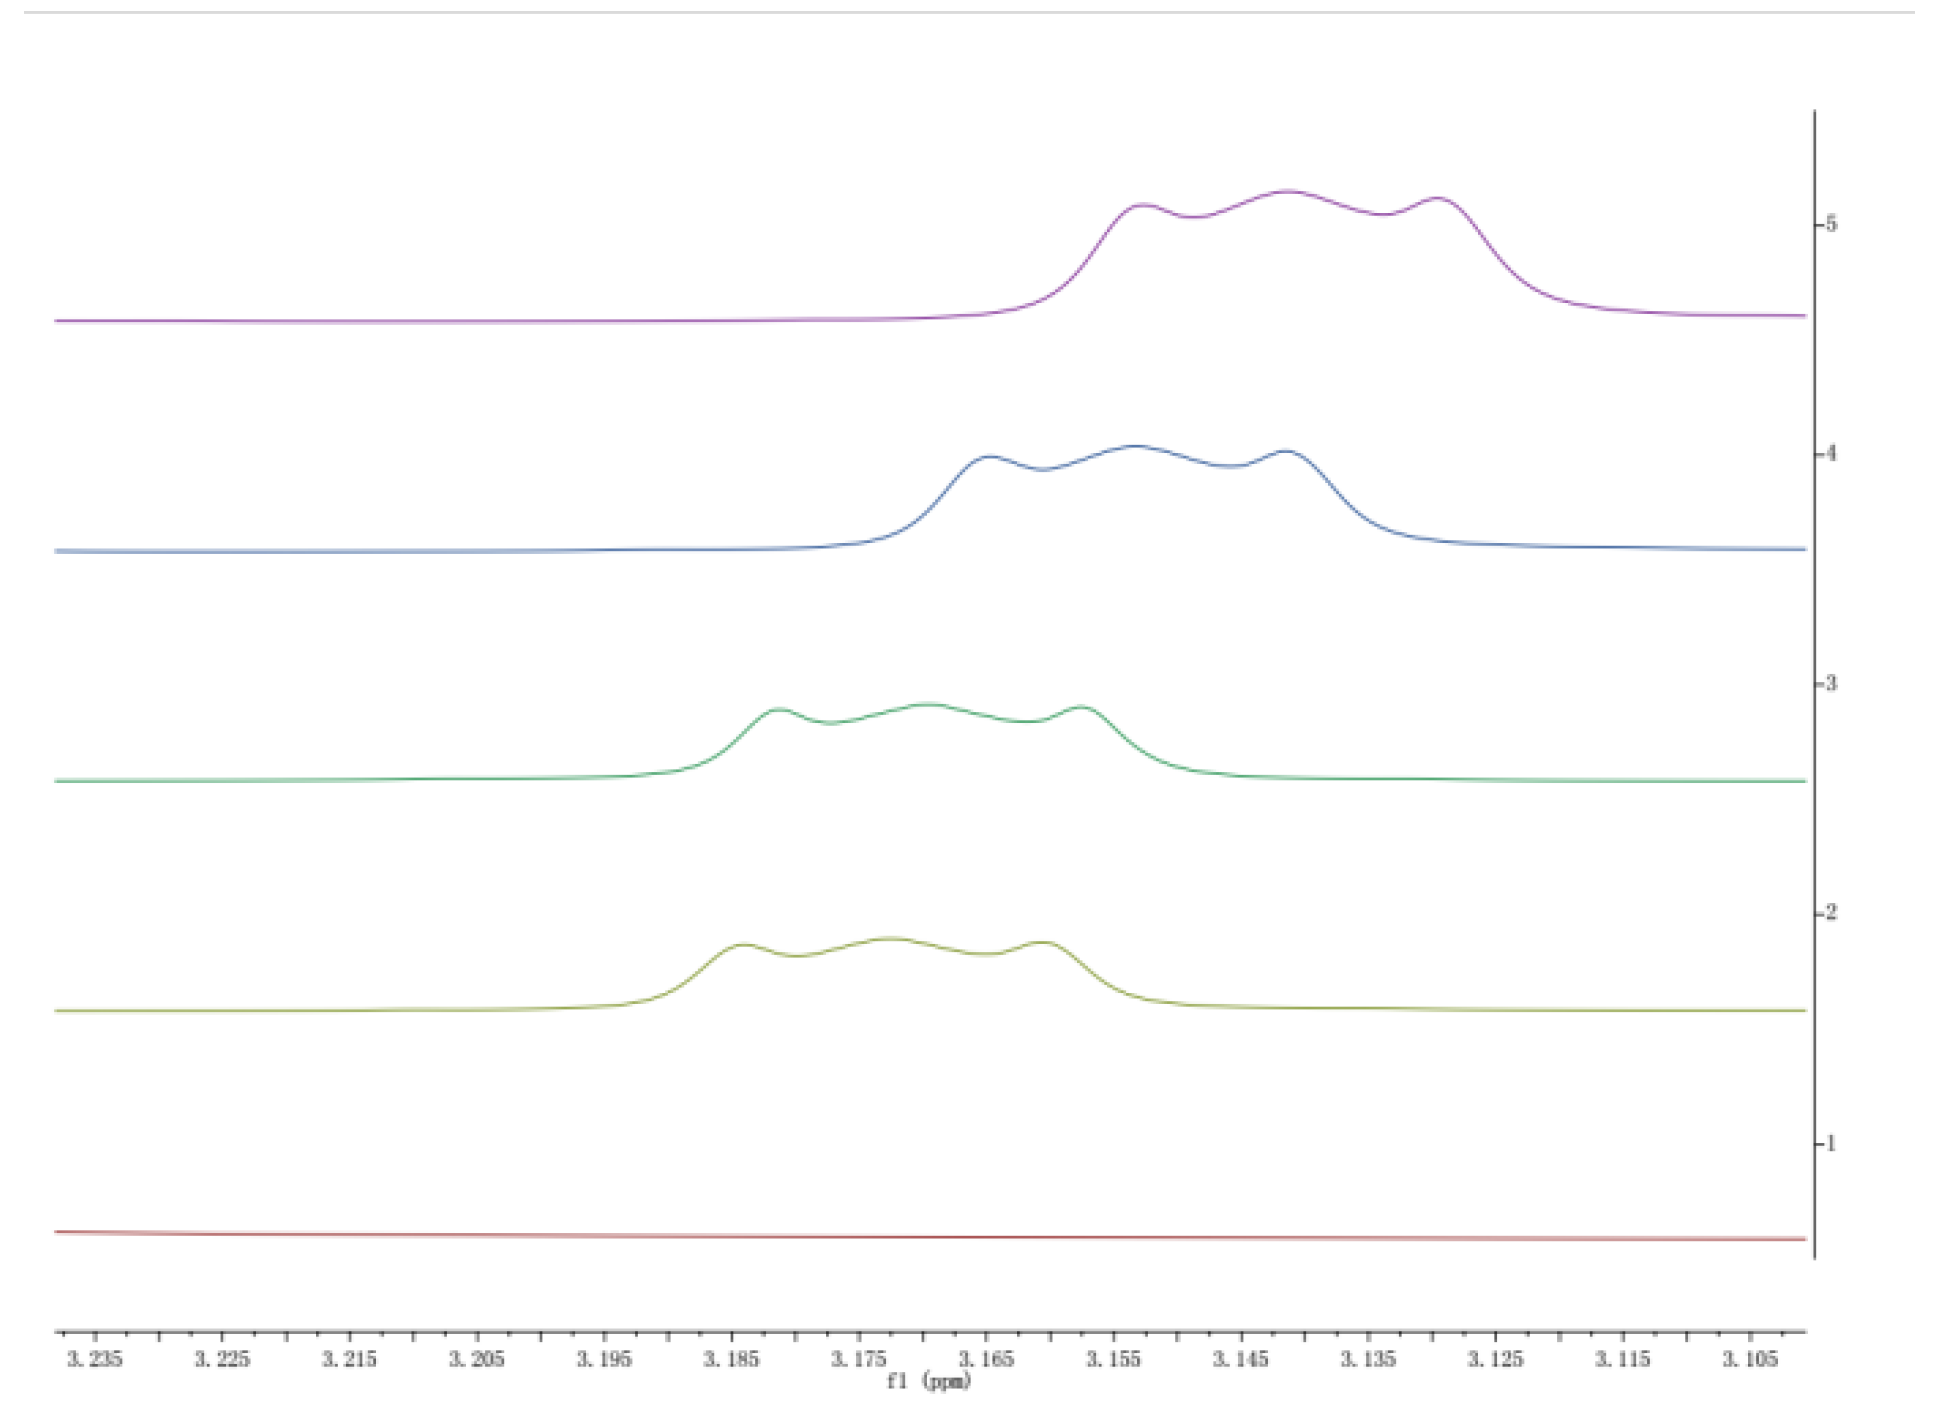
Figure 23.
A part of a larger view of
Figure 22.
Figure 23.
A part of a larger view of
Figure 22.
Table 1.
Chemicals Used in This Work and their Abbreviation.
Table 1.
Chemicals Used in This Work and their Abbreviation.
| Name | Source | M (g/mol) | Purity |
|---|
| Benzene | Chemical Factory | 78.11 | >99% |
| Cyclohexane | Engineering and Technology Research Center of Guangdong Fine Chemistry | 84.16 | >99.5% |
| Tetrabutylammonium bromide (TBAB) | Tianjin Fuchen Chemical Reagents Factory | 322.38 | >99% |
| Levulinic acid (LA) | Xilong Chemical Co., Ltd. | 116.12 | >99% |
Table 2.
DESs used in the present work.
Table 2.
DESs used in the present work.
| Name | HBA | HBD | Molar Ratio | |
|---|
| DES(1:1) | TBAB | LA | 1:1 | 219.25 |
| DES(1:2) | 1:2 | 184.87 |
| DES(1:3) | 1:3 | 167.685 |
| DES(1:4) | 1:4 | 157.44 |
Table 3.
GC conditions employed for analysis of the condensed vapor phase.
Table 3.
GC conditions employed for analysis of the condensed vapor phase.
| Condition | Parameter |
|---|
| Column type | KB-FFAP (30 m; 0.32 mm; 0.25 μm) |
| Detector type | FID |
| Detector temperature | 523 K |
| Injector temperature | 503 K |
| Injection volume | 0.4 uL |
| Carrier gas | N2 |
| Flow rate (constant) | 30 cm3·min−1 |
| Split ratio | 200 |
Table 4.
Glass transition temperature and melting point of the DESs.
Table 4.
Glass transition temperature and melting point of the DESs.
| Sample | The Glass Transition Temperature (°C) | Melting Point of HBA (°C) | Melting Point of HBD (°C) |
|---|
| DES(1:1) | ~30–~25 | 102–106 | 37.2 |
| DES(1:2) | ~70–~65 |
| DES(1:3) | ~60–~50 |
| DES(1:4) | ~80–~70 |
Table 5.
Experimental density and viscosity values at different temperatures and atmospheric pressures (p = 101.325 kPa).
Table 5.
Experimental density and viscosity values at different temperatures and atmospheric pressures (p = 101.325 kPa).
| Temperature (K) | Density (g/cm3) | Viscosity (mPa·s) |
|---|
| 1:1 | 1:2 | 1:3 | 1:4 | 1:1 | 1:2 | 1:3 | 1:4 |
|---|
| 293.15 | - | 1.0979 | 1.1050 | 1.1118 | - | 964.58 | 483.46 | 291.14 |
| 303.15 | - | 1.0909 | 1.0982 | 1.1045 | - | 426.89 | 223.73 | 142.22 |
| 313.15 | - | 1.0843 | 1.0912 | 1.0974 | - | 206.48 | 116.34 | 77.47 |
| 323.15 | 1.0639 | 1.0799 | 1.0840 | 1.0906 | 372.82 | 114.54 | 67.99 | 46.53 |
| 333.15 | 1.0589 | 1.0707 | 1.0770 | 1.0828 | 201.73 | 68.30 | 42.80 | 30.11 |
| 343.15 | 1.0523 | 1.0643 | 1.0703 | 1.0757 | 116.36 | 43.41 | 28.77 | 20.94 |
| 353.15 | 1.0466 | 1.0572 | 1.0631 | 1.0680 | 72.438 | 29.79 | 20.57 | 15.21 |
Table 6.
Vapor–liquid equilibrium data of the pseudo-ternary systems (cyclohexane (1) + benzene (2) + DES (3)).
Table 6.
Vapor–liquid equilibrium data of the pseudo-ternary systems (cyclohexane (1) + benzene (2) + DES (3)).
| Cyclohexane (1) + Benzene (2) + DES(1:1)(3), at 101.325 kPa |
|---|
| X3 | X1 | X′1 | Y1 | T/K | αij | S |
|---|
| 0.1 | 0.0000 | 0.0000 | 0.0000 | 353.25 | - | - |
| 0.1 | 0.0652 | 0.0724 | 0.0964 | 352.80 | 1.3670 | 1.0081 |
| 0.1 | 0.0952 | 0.1058 | 0.1448 | 352.27 | 1.4310 | 1.0950 |
| 0.1 | 0.1470 | 0.1633 | 0.2134 | 351.63 | 1.3895 | 1.1049 |
| 0.1 | 0.2525 | 0.2805 | 0.3206 | 351.05 | 1.2106 | 1.0446 |
| 0.1 | 0.3909 | 0.4343 | 0.4307 | 350.73 | 0.9852 | 0.8878 |
| 0.1 | 0.5058 | 0.5620 | 0.5348 | 350.69 | 0.8961 | 0.8075 |
| 0.1 | 0.5867 | 0.6519 | 0.6098 | 350.77 | 0.8346 | 0.9602 |
| 0.1 | 0.6807 | 0.7563 | 0.7265 | 351.33 | 0.8561 | 1.0402 |
| 0.1 | 0.7461 | 0.8290 | 0.8023 | 351.77 | 0.8371 | 1.0764 |
| 0.1 | 0.7778 | 0.8642 | 0.8452 | 352.20 | 0.8580 | 1.1699 |
| 0.1 | 0.9000 | 1.0000 | 1.0000 | 353.85 | - | - |
| Cyclohexane (1) + Benzene (2) + DES(1:2), at 101.325 kPa |
| X3 | X1 | X′1 | Y1 | T/K | αij | S |
| 0.1 | 0.0000 | 0.0000 | 0.0000 | 353.25 | - | - |
| 0.1 | 0.1668 | 0.1853 | 0.3191 | 351.20 | 2.0601 | 1.7051 |
| 0.1 | 0.2406 | 0.2673 | 0.4939 | 350.64 | 2.6752 | 2.4107 |
| 0.1 | 0.3015 | 0.3351 | 0.6053 | 351.28 | 3.0438 | 3.6984 |
| 0.1 | 0.3529 | 0.3921 | 0.7107 | 351.74 | 3.8089 | 4.8976 |
| 0.1 | 0.4507 | 0.5008 | 0.8091 | 352.34 | 4.2229 | 5.7580 |
| 0.1 | 0.5597 | 0.6219 | 0.8868 | 352.67 | 4.7632 | 6.4947 |
| 0.1 | 0.7232 | 0.8035 | 0.9420 | 353.17 | 3.9681 | 5.4106 |
| 0.1 | 0.9000 | 1.0000 | 1.0000 | 353.85 | - | - |
| Cyclohexane (1) + Benzene (2) + DES(1:3), at 101.325 kPa |
| X3 | X1 | X′1 | Y1 | T/K | αij | S |
| 0.1 | 0.0000 | 0.0000 | 0.0000 | 353.25 | - | - |
| 0.1 | 0.0395 | 0.0439 | 0.0543 | 352.47 | 1.2522 | 0.9581 |
| 0.1 | 0.0902 | 0.1002 | 0.1123 | 351.80 | 1.1360 | 0.9033 |
| 0.1 | 0.1430 | 0.1589 | 0.1725 | 351.28 | 1.1034 | 0.9133 |
| 0.1 | 0.2686 | 0.2984 | 0.3190 | 350.67 | 1.1015 | 0.9926 |
| 0.1 | 0.4313 | 0.4793 | 0.5013 | 350.36 | 1.0924 | 1.0794 |
| 0.1 | 0.5557 | 0.6174 | 0.6031 | 350.59 | 0.9414 | 1.0275 |
| 0.1 | 0.6402 | 0.7114 | 0.7001 | 351.35 | 0.9473 | 1.2181 |
| 0.1 | 0.7217 | 0.8019 | 0.7875 | 352.27 | 0.9157 | 1.2486 |
| 0.1 | 0.7629 | 0.8477 | 0.8256 | 352.71 | 0.8505 | 1.1597 |
| 0.1 | 0.8741 | 0.9712 | 0.9541 | 353.60 | 0.6164 | 0.8405 |
| 0.1 | 0.9000 | 1.0000 | 1.0000 | 353.85 | - | - |
| Cyclohexane (1) + Benzene (2) + DES(1:4), at 101.325 kPa |
| X3 | X1 | X′1 | Y1 | T/K | αij | S |
| 0.1 | 0.0000 | 0.0000 | 0.0000 | 353.25 | - | - |
| 0.1 | 0.0921 | 0.1024 | 0.1852 | 352.50 | 1.9930 | 1.5250 |
| 0.1 | 0.1325 | 0.1472 | 0.2577 | 352.10 | 2.0114 | 1.5391 |
| 0.1 | 0.2071 | 0.2302 | 0.4174 | 351.20 | 2.3966 | 1.9836 |
| 0.1 | 0.2550 | 0.2834 | 0.5197 | 350.77 | 2.7368 | 2.3615 |
| 0.1 | 0.3356 | 0.3729 | 0.5713 | 350.97 | 2.2410 | 2.7230 |
| 0.1 | 0.5201 | 0.5779 | 0.6318 | 351.08 | 1.2535 | 1.5231 |
| 0.1 | 0.5913 | 0.6570 | 0.6728 | 351.33 | 1.0737 | 1.3046 |
| 0.1 | 0.6516 | 0.7240 | 0.7086 | 351.60 | 0.9267 | 1.1916 |
| 0.1 | 0.7583 | 0.8425 | 0.8016 | 352.17 | 0.7554 | 1.0300 |
| 0.1 | 0.8252 | 0.9169 | 0.8779 | 352.85 | 0.6516 | 0.8885 |
| 0.1 | 0.9000 | 1.0000 | 1.0000 | 353.85 | - | - |
Table 7.
Coefficient of determination (R2) of the pseudo-ternary systems fitted using the three thermodynamic models.
Table 7.
Coefficient of determination (R2) of the pseudo-ternary systems fitted using the three thermodynamic models.
| System | R2 |
|---|
| NRTL | WILSON | UNIOUAC |
|---|
| cyclohexane-benzene-DES(1:1) | 0.999990073 | 0.999050672 | 0.999206835 |
| cyclohexane-benzene-DES(1:2) | 0.876057425 | 0.615250142 | 0.823243826 |
| cyclohexane-benzene-DES(1:3) | 0.999428449 | 0.99838839 | 0.999021115 |
| cyclohexane-benzene-DES(1:4) | 0.999999997 | 0.885377491 | 0.889570028 |
Table 8.
Estimated values for the binary parameters using the NRTL model for correlating the pseudo-binary VLE data at a constant DES molar fraction of 0.1 within a pressure of 101.325 kPa.
Table 8.
Estimated values for the binary parameters using the NRTL model for correlating the pseudo-binary VLE data at a constant DES molar fraction of 0.1 within a pressure of 101.325 kPa.
| Extractant | Comp. i | Comp. j | aij | aji | bij | bji | cij |
|---|
| DES(1:1) | Cyclohexane | Benzene | −4.2995 | −12.027 | 1605.6 | 4218.2 | −2.7 |
| DES(1:2) | −17.895 | 26.168 | 10,000 | −10,000 | 0.1717 |
| DES(1:3) | 23.870 | −11.683 | −7796.4 | 4218.2 | 2.1377 |
| DES(1:4) | 56.508 | −17.710 | 52504 | 6357.4 | 0.0306 |
Table 9.
Vapor–liquid equilibrium data of the pseudo-ternary systems cyclohexane (1) + benzene (2) + DES(1:2) (3) at a pressure of 101.335 kPa.
Table 9.
Vapor–liquid equilibrium data of the pseudo-ternary systems cyclohexane (1) + benzene (2) + DES(1:2) (3) at a pressure of 101.335 kPa.
| Cyclohexane (1) + Benzene (2) + DES(1:2) (3) |
|---|
| X3 | X1 | X′1 | Y1 | T/K | αij | S |
|---|
| 0.05 | 0.0000 | 0.0000 | 0.0000 | 353.25 | - | - |
| 0.05 | 0.0676 | 0.0712 | 0.1325 | 352.32 | 0.5019 | 0.3840 |
| 0.05 | 0.1335 | 0.1405 | 0.1976 | 351.96 | 0.6638 | 0.5079 |
| 0.05 | 0.1993 | 0.2098 | 0.2615 | 351.65 | 0.7498 | 0.5962 |
| 0.05 | 0.3190 | 0.3358 | 0.3649 | 351.13 | 0.8799 | 0.7283 |
| 0.05 | 0.4286 | 0.4512 | 0.4526 | 351.10 | 0.9944 | 1.2083 |
| 0.05 | 0.5045 | 0.5311 | 0.5102 | 351.15 | 1.0874 | 1.3213 |
| 0.05 | 0.6382 | 0.6718 | 0.6352 | 351.30 | 1.1756 | 1.4284 |
| 0.05 | 0.7273 | 0.7656 | 0.7192 | 351.77 | 1.2752 | 1.6397 |
| 0.05 | 0.7849 | 0.8262 | 0.7841 | 352.20 | 1.3089 | 1.7847 |
| 0.05 | 0.8450 | 0.8895 | 0.8513 | 352.73 | 1.4061 | 1.9172 |
| 0.05 | 0.9500 | 1.0000 | 1.0000 | 353.85 | - | - |
| X3 | X1 | X′1 | Y1 | T/K | αij | S |
| 0.1 | 0.0000 | 0.0000 | 0.0000 | 353.25 | - | - |
| 0.1 | 0.1668 | 0.1853 | 0.3191 | 351.20 | 2.0601 | 1.7051 |
| 0.1 | 0.2406 | 0.2673 | 0.4939 | 350.64 | 2.6752 | 2.4107 |
| 0.1 | 0.3015 | 0.3351 | 0.6053 | 351.28 | 3.0438 | 3.6984 |
| 0.1 | 0.3529 | 0.3921 | 0.7107 | 351.74 | 3.8089 | 4.8976 |
| 0.1 | 0.4507 | 0.5008 | 0.8091 | 352.34 | 4.2229 | 5.7580 |
| 0.1 | 0.5597 | 0.6219 | 0.8868 | 352.67 | 4.7632 | 6.4947 |
| 0.1 | 0.7232 | 0.8035 | 0.9420 | 353.17 | 3.9681 | 5.4106 |
| 0.1 | 0.9000 | 1.0000 | 1.0000 | 353.85 | - | - |
| X3 | X1 | X′1 | Y1 | T/K | αij | S |
| 0.15 | 0.0000 | 0.0000 | 0.0000 | 353.25 | - | - |
| 0.15 | 0.0780 | 0.0918 | 0.1920 | 351.20 | 2.3509 | 1.9458 |
| 0.15 | 0.1346 | 0.1583 | 0.3311 | 350.64 | 2.6319 | 2.3717 |
| 0.15 | 0.2360 | 0.2777 | 0.5393 | 351.28 | 3.0448 | 3.6996 |
| 0.15 | 0.2824 | 0.3322 | 0.6154 | 351.74 | 3.2166 | 4.1360 |
| 0.15 | 0.3827 | 0.4502 | 0.7380 | 352.34 | 3.4400 | 4.6905 |
| 0.15 | 0.4338 | 0.5103 | 0.7870 | 352.67 | 3.5457 | 4.8346 |
| 0.15 | 0.5195 | 0.6112 | 0.8413 | 352.96 | 3.3722 | 4.5980 |
| 0.15 | 0.6038 | 0.7104 | 0.9011 | 353.13 | 3.7143 | 5.0645 |
| 0.15 | 0.7020 | 0.8259 | 0.9589 | 353.40 | 4.9182 | 6.7060 |
| 0.15 | 0.8500 | 1.0000 | 1.0000 | 353.85 | - | - |
| X3 | X1 | X′1 | Y1 | T/K | αij | S |
| 0.2 | 0.0000 | 0.0000 | 0.0000 | 353.25 | - | - |
| 0.2 | 0.0862 | 0.1077 | 0.1845 | 352.35 | 1.8747 | 1.4345 |
| 0.2 | 0.1477 | 0.1846 | 0.3432 | 351.35 | 2.3081 | 2.1979 |
| 0.2 | 0.1776 | 0.2220 | 0.4209 | 351.04 | 2.5471 | 2.3257 |
| 0.2 | 0.2117 | 0.2647 | 0.4924 | 351.00 | 2.6953 | 4.1499 |
| 0.2 | 0.2844 | 0.3555 | 0.6403 | 351.67 | 3.2274 | 4.6699 |
| 0.2 | 0.3298 | 0.4123 | 0.7141 | 351.96 | 3.5603 | 4.8545 |
| 0.2 | 0.4302 | 0.5377 | 0.8061 | 352.33 | 3.5747 | 4.8741 |
| 0.2 | 0.4735 | 0.5919 | 0.8410 | 352.67 | 3.6459 | 4.9712 |
| 0.2 | 0.5254 | 0.6567 | 0.8672 | 353.00 | 3.4121 | 4.6524 |
| 0.2 | 0.6498 | 0.8123 | 0.9425 | 353.56 | 3.7876 | 4.4239 |
| 0.2 | 0.8000 | 1.0000 | 1.0000 | 353.85 | - | - |
Table 10.
Coefficient of determination (R2) of the pseudo-ternary systems fitting using the three thermodynamic models.
Table 10.
Coefficient of determination (R2) of the pseudo-ternary systems fitting using the three thermodynamic models.
| DES System | R2 |
|---|
| DES(1:2) mole concentration | UNIQUAC | WILSON | NRTL |
| 0.05 | 0.999274739 | 0.999161341 | 0.999263945 |
| 0.10 | 0.823243826 | 0.615250142 | 0.877053812 |
| 0.15 | 0.691208105 | 0.691251575 | 0.725252503 |
| 0.20 | 0.708145398 | 0.692945634 | 0.818531606 |
Table 11.
Estimated values for the binary parameters using the NRTL model for correlating the pseudo-binary VLE data.
Table 11.
Estimated values for the binary parameters using the NRTL model for correlating the pseudo-binary VLE data.
| DES(1:2) Mole Concentration | Comp. i | Comp. j | aij | aji | bij | bji | cij |
|---|
| 0.05 | Cyclohexane | Benzene | 5.7781 | 21.790 | −2897.1 | −6397.7 | −2.7 |
| 0.10 | −17.895 | 26.168 | 10,000 | −10,000 | 0.1717 |
| 0.15 | −16.288 | 27.070 | 10,000 | −10,000 | 2.1377 |
| 0.2 | −20.707 | −20.290 | 10,000 | 1000 | 0.0306 |


