Insights into Thermal Degradation Behaviors and Reaction Kinetics of Medical Waste Infusion Bag and Nasal Oxygen Cannula

Abstract
:1. Introduction
2. Materials and Methods
2.1. Sample Preparation
2.2. Thermogravimetric Experiments
2.3. Theoretical Method
2.3.1. Model-Free Method
2.3.2. Model-Fitting Method
3. Results and Discussion
3.1. Thermogravimetric and Differential Thermogravimetry Analysis
3.2. Model-Free Analysis
3.3. Model-Fitting Analysis
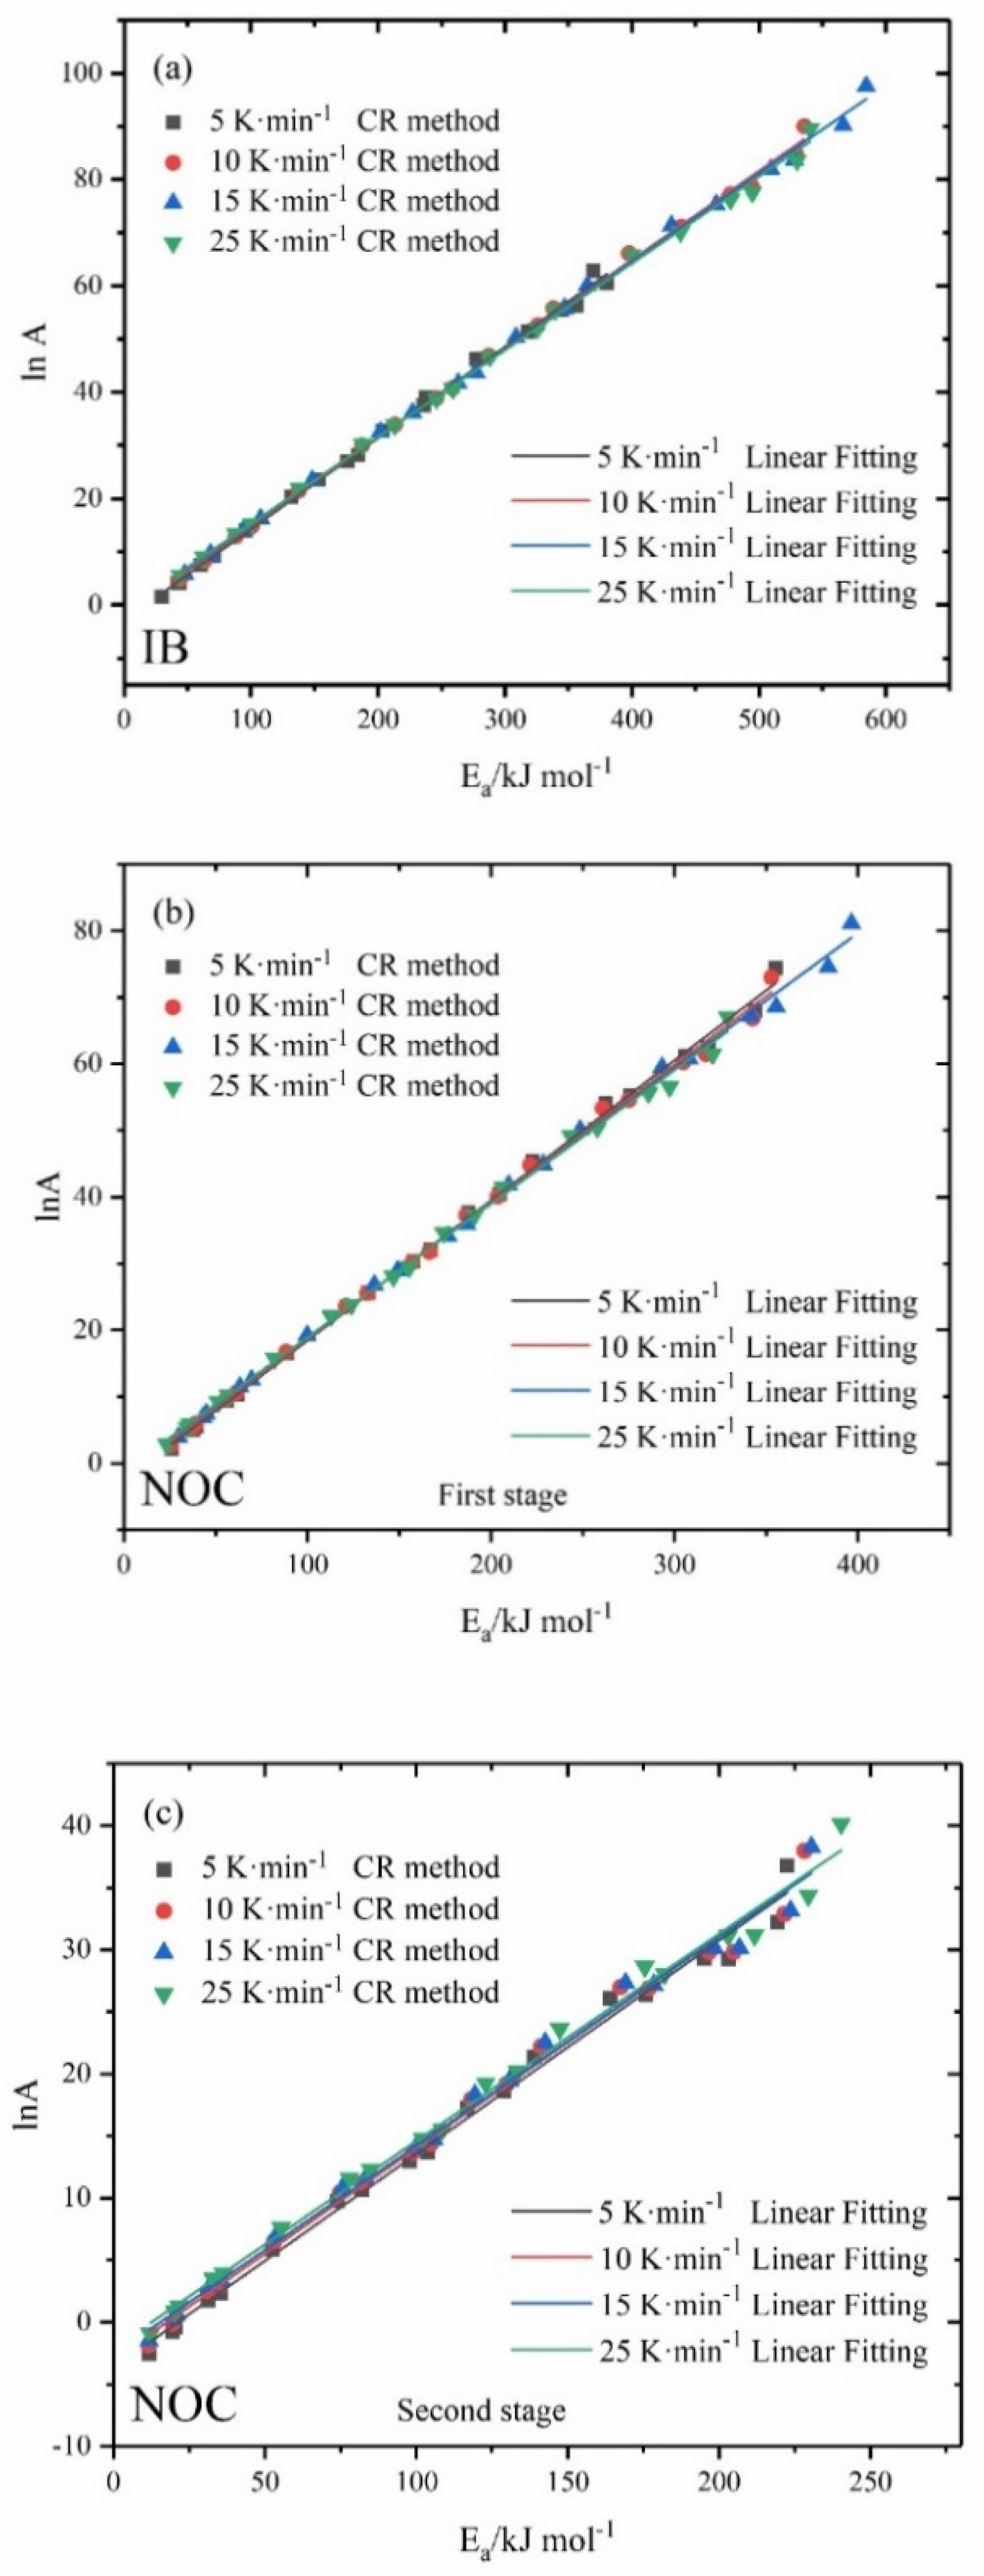
3.4. Kinetic Compensation Effect
3.5. Model Reconstruction
4. Conclusions
Author Contributions
Funding
Institutional Review Board Statement
Informed Consent Statement
Data Availability Statement
Conflicts of Interest
Appendix A

| Model | 5 K·min−1 | 10 K·min−1 | 15 K·min−1 | 25 K·min−1 | Average | ||||||||
|---|---|---|---|---|---|---|---|---|---|---|---|---|---|
| Ea/kJ·mol−1 | ln A/min−1 | R2 | Ea/kJ·mol−1 | ln A/min−1 | R2 | Ea/kJ·mol−1 | ln A/min−1 | R2 | Ea/kJ·mol−1 | ln A/min−1 | R2 | Ea/kJ·mol−1 | |
| F1 | 203.64 | 32.78 | 0.96627 | 287.25 | 46.83 | 0.98824 | 308.66 | 50.31 | 0.99768 | 287.84 | 46.70 | 0.99105 | 271.85 |
| F3/2 | 237.77 | 39.01 | 0.92395 | 338.06 | 55.71 | 0.96566 | 364.98 | 60.00 | 0.98527 | 339.45 | 55.51 | 0.97225 | 320.07 |
| F2 | 277.55 | 46.24 | 0.87021 | 397.60 | 66.07 | 0.92784 | 431.07 | 71.34 | 0.95559 | 399.95 | 65.80 | 0.93738 | 376.54 |
| F3 | 369.55 | 62.87 | 0.77075 | 535.64 | 89.99 | 0.84701 | 584.43 | 97.55 | 0.88459 | 540.25 | 89.57 | 0.86009 | 507.47 |
| D1 | 318.27 | 51.40 | 0.99353 | 438.77 | 71.09 | 0.97795 | 466.43 | 75.31 | 0.96676 | 438.10 | 70.17 | 0.97273 | 415.39 |
| D2 | 345.08 | 55.59 | 0.99252 | 477.67 | 77.20 | 0.98675 | 509.22 | 81.99 | 0.98142 | 477.53 | 76.21 | 0.98390 | 452.38 |
| D3 | 380.15 | 60.45 | 0.98436 | 529.27 | 84.67 | 0.99210 | 566.20 | 90.26 | 0.99419 | 529.88 | 83.60 | 0.99214 | 501.38 |
| D4 | 356.53 | 56.17 | 0.99074 | 494.50 | 78.62 | 0.98957 | 527.79 | 83.67 | 0.98678 | 494.60 | 77.61 | 0.98772 | 468.36 |
| A3/2 | 131.94 | 20.30 | 0.96458 | 187.54 | 30.00 | 0.98781 | 201.75 | 32.46 | 0.98760 | 187.84 | 30.20 | 0.98072 | 177.27 |
| A2 | 96.08 | 13.96 | 0.96275 | 137.68 | 21.49 | 0.98736 | 148.30 | 23.45 | 0.99751 | 137.84 | 21.85 | 0.99036 | 129.98 |
| A3 | 60.23 | 7.47 | 0.9586 | 87.83 | 12.83 | 0.98637 | 94.85 | 14.29 | 0.99733 | 87.83 | 13.37 | 0.98959 | 82.69 |
| A4 | 42.30 | 4.10 | 0.95365 | 62.90 | 8.40 | 0.98525 | 68.13 | 9.61 | 0.99713 | 62.83 | 9.01 | 0.98871 | 59.04 |
| R1 | 153.39 | 23.51 | 0.99308 | 213.44 | 33.84 | 0.97666 | 227.19 | 36.17 | 0.96492 | 212.97 | 33.81 | 0.97110 | 201.75 |
| R2 | 175.69 | 26.95 | 0.99878 | 245.98 | 38.90 | 0.99033 | 263.04 | 41.72 | 0.98885 | 245.96 | 38.82 | 0.98893 | 232.67 |
| R3 | 184.34 | 28.13 | 0.98356 | 258.70 | 40.73 | 0.99176 | 277.08 | 43.75 | 0.99391 | 258.86 | 40.63 | 0.99178 | 244.75 |
| P1 | 29.73 | 1.50 | 0.98890 | 44.45 | 4.88 | 0.96614 | 47.76 | 5.80 | 0.95012 | 44.12 | 5.51 | 0.95767 | 41.52 |
| P2 | 43.47 | 4.15 | 0.99066 | 63.23 | 8.27 | 0.97030 | 67.70 | 9.35 | 0.95591 | 62.88 | 8.84 | 0.96300 | 59.32 |
| P3 | 70.95 | 9.16 | 0.99202 | 100.78 | 14.83 | 0.97376 | 107.57 | 16.22 | 0.96078 | 100.40 | 15.24 | 0.96741 | 94.93 |
| P4 | 235.83 | 37.52 | 0.99339 | 326.11 | 52.53 | 0.97753 | 346.81 | 55.81 | 0.96616 | 325.53 | 52.06 | 0.97220 | 308.57 |
| Model | 5 K·min−1 | 10 K·min−1 | 15 K·min−1 | 25 K·min−1 | Average | ||||||||
|---|---|---|---|---|---|---|---|---|---|---|---|---|---|
| Ea/kJ·mol−1 | ln A/min−1 | R2 | Ea/kJ·mol−1 | ln A/min−1 | R2 | Ea/kJ·mol−1 | ln A/min−1 | R2 | Ea/kJ·mol−1 | ln A/min−1 | R2 | Ea/kJ·mol−1 | |
| F1 | 204.75 | 29.99 | 0.96627 | 258.19 | 39.98 | 0.98177 | 310.22 | 47.18 | 0.99768 | 289.49 | 43.66 | 0.99106 | 265.66 |
| F3/2 | 238.88 | 36.07 | 0.92420 | 309.01 | 48.70 | 0.95425 | 366.54 | 56.71 | 0.98531 | 341.10 | 52.31 | 0.97236 | 313.88 |
| F2 | 278.66 | 43.15 | 0.87072 | 368.55 | 58.89 | 0.91187 | 432.63 | 67.88 | 0.95578 | 401.60 | 62.43 | 0.93769 | 370.36 |
| F3 | 370.66 | 59.49 | 0.77150 | 506.59 | 82.52 | 0.82769 | 586.00 | 93.79 | 0.88501 | 541.91 | 85.90 | 0.86067 | 501.29 |
| D1 | 319.37 | 48.17 | 0.99354 | 409.71 | 63.82 | 0.97571 | 467.99 | 71.78 | 0.96706 | 439.76 | 66.71 | 0.97299 | 409.21 |
| D2 | 346.18 | 52.28 | 0.99248 | 448.62 | 69.84 | 0.98505 | 510.78 | 78.37 | 0.98158 | 479.18 | 72.66 | 0.98404 | 446.19 |
| D3 | 381.26 | 57.05 | 0.98432 | 500.21 | 77.20 | 0.99028 | 567.76 | 86.53 | 0.99424 | 531.53 | 79.96 | 0.99217 | 495.19 |
| D4 | 357.64 | 52.83 | 0.99069 | 465.44 | 71.23 | 0.98794 | 529.35 | 80.01 | 0.98690 | 496.25 | 74.03 | 0.98781 | 462.17 |
| A3/2 | 133.04 | 17.95 | 0.96459 | 158.49 | 23.57 | 0.97632 | 203.32 | 29.77 | 0.98760 | 189.49 | 27.59 | 0.98074 | 171.09 |
| A2 | 97.19 | 11.93 | 0.96278 | 108.63 | 15.37 | 0.96898 | 149.87 | 21.06 | 0.99752 | 139.49 | 19.55 | 0.99041 | 123.80 |
| A3 | 61.33 | 5.90 | 0.95873 | 58.78 | 7.17 | 0.94488 | 96.42 | 12.35 | 0.99734 | 89.49 | 11.52 | 0.98968 | 76.51 |
| A4 | 43.41 | 2.89 | 0.95398 | 33.85 | 3.06 | 0.89514 | 69.69 | 8.00 | 0.99715 | 64.49 | 7.50 | 0.98886 | 52.86 |
| R1 | 154.50 | 21.01 | 0.99311 | 184.39 | 27.29 | 0.97102 | 228.75 | 33.36 | 0.96556 | 214.62 | 31.08 | 0.97167 | 195.57 |
| R2 | 176.80 | 24.31 | 0.99868 | 216.93 | 32.20 | 0.99631 | 264.60 | 38.76 | 0.99005 | 247.61 | 35.94 | 0.99052 | 226.49 |
| R3 | 185.44 | 25.45 | 0.98347 | 229.64 | 33.98 | 0.98736 | 278.64 | 40.73 | 0.99401 | 260.51 | 37.70 | 0.99186 | 238.56 |
| P1 | 30.84 | 0.64 | 0.98928 | 15.40 | −0.11 | 0.79284 | 49.33 | 4.54 | 0.95403 | 45.77 | 4.35 | 0.96129 | 35.34 |
| P2 | 44.58 | 2.91 | 0.99085 | 34.18 | 2.94 | 0.91564 | 69.26 | 7.74 | 0.95843 | 64.53 | 7.32 | 0.96529 | 53.14 |
| P3 | 72.06 | 7.43 | 0.99210 | 71.73 | 9.02 | 0.95469 | 109.13 | 14.15 | 0.96224 | 102.05 | 13.26 | 0.96872 | 88.74 |
| P4 | 236.94 | 34.59 | 0.99340 | 297.05 | 45.55 | 0.97431 | 348.37 | 52.57 | 0.96657 | 327.19 | 48.89 | 0.97256 | 302.39 |
| Model | 5 K·min−1 | 10 K·min−1 | 15 K·min−1 | 25 K·min−1 | Average | ||||||||
|---|---|---|---|---|---|---|---|---|---|---|---|---|---|
| Ea/kJ·mol−1 | ln A/min−1 | R2 | Ea/kJ·mol−1 | ln A/min−1 | R2 | Ea/kJ·mol−1 | ln A/min−1 | R2 | Ea/kJ·mol−1 | ln A/min−1 | R2 | Ea/kJ·mol−1 | |
| F1 | 187.61 | 37.64 | 0.99052 | 186.65 | 37.28 | 0.98944 | 209.65 | 41.83 | 0.98989 | 174.28 | 34.60 | 0.98600 | 189.55 |
| F3/2 | 222.60 | 45.35 | 0.97856 | 221.37 | 44.78 | 0.97607 | 248.64 | 50.08 | 0.97818 | 206.57 | 41.42 | 0.96969 | 224.80 |
| F2 | 262.64 | 54.12 | 0.95969 | 261.07 | 53.31 | 0.95603 | 293.26 | 59.48 | 0.95959 | 243.49 | 49.19 | 0.94719 | 265.12 |
| F3 | 355.30 | 74.34 | 0.91678 | 352.95 | 72.96 | 0.91148 | 396.53 | 81.15 | 0.91710 | 328.86 | 67.04 | 0.89930 | 358.41 |
| D1 | 275.97 | 55.25 | 0.98456 | 275.05 | 54.51 | 0.98644 | 308.03 | 60.80 | 0.98383 | 257.96 | 50.42 | 0.98932 | 279.25 |
| D2 | 306.05 | 61.17 | 0.99056 | 304.93 | 60.26 | 0.99156 | 341.52 | 67.18 | 0.98977 | 285.82 | 55.60 | 0.99259 | 309.58 |
| D3 | 343.95 | 67.96 | 0.99334 | 342.55 | 66.83 | 0.99328 | 383.74 | 74.57 | 0.99261 | 320.86 | 61.45 | 0.99207 | 347.78 |
| D4 | 318.52 | 62.40 | 0.99218 | 317.31 | 61.42 | 0.99281 | 355.42 | 68.61 | 0.99141 | 297.36 | 56.52 | 0.99306 | 322.15 |
| A3/2 | 121.90 | 23.64 | 0.99008 | 121.20 | 23.61 | 0.98893 | 136.48 | 26.81 | 0.98944 | 112.87 | 22.09 | 0.98526 | 123.11 |
| A2 | 89.05 | 16.54 | 0.98960 | 88.47 | 16.68 | 0.98839 | 99.89 | 19.21 | 0.98896 | 82.16 | 15.74 | 0.98446 | 89.89 |
| A3 | 56.19 | 9.30 | 0.98852 | 55.74 | 9.60 | 0.98715 | 63.30 | 11.46 | 0.98790 | 51.45 | 9.23 | 0.98263 | 56.67 |
| A4 | 39.77 | 5.56 | 0.98725 | 39.38 | 5.95 | 0.98570 | 45.01 | 7.47 | 0.98666 | 36.10 | 5.86 | 0.98043 | 40.07 |
| R1 | 133.23 | 25.56 | 0.98340 | 132.67 | 25.51 | 0.98539 | 149.08 | 28.90 | 0.98270 | 124.00 | 23.86 | 0.98141 | 134.75 |
| R2 | 157.89 | 30.37 | 0.98237 | 157.16 | 30.18 | 0.98282 | 176.55 | 34.09 | 0.98160 | 146.83 | 28.06 | 0.98261 | 159.61 |
| R3 | 167.22 | 32.03 | 0.99298 | 166.42 | 31.79 | 0.99292 | 186.93 | 35.90 | 0.99224 | 155.45 | 29.50 | 0.99161 | 169.01 |
| P1 | 26.17 | 2.21 | 0.97276 | 25.88 | 2.67 | 0.97566 | 29.87 | 3.92 | 0.97280 | 23.53 | 2.83 | 0.97956 | 26.36 |
| P2 | 38.07 | 4.99 | 0.97719 | 37.75 | 5.41 | 0.97974 | 43.11 | 6.88 | 0.97685 | 34.69 | 5.37 | 0.98336 | 38.41 |
| P3 | 61.86 | 10.31 | 0.98065 | 61.48 | 10.61 | 0.98290 | 69.61 | 12.55 | 0.98009 | 57.02 | 10.17 | 0.98621 | 62.49 |
| P4 | 204.60 | 40.47 | 0.98419 | 203.86 | 40.08 | 0.98610 | 228.56 | 44.92 | 0.98347 | 190.98 | 37.20 | 0.98903 | 207.00 |
| Model | 5 K·min−1 | 10 K·min−1 | 15 K·min−1 | 25 K·min−1 | Average | ||||||||
|---|---|---|---|---|---|---|---|---|---|---|---|---|---|
| Ea/kJ·mol−1 | ln A/min−1 | R2 | Ea/kJ·mol−1 | ln A/min−1 | R2 | Ea/kJ·mol−1 | ln A/min−1 | R2 | Ea/kJ·mol−1 | ln A/min−1 | R2 | Ea/kJ·mol−1 | |
| F1 | 116.72 | 17.23 | 0.97878 | 118.29 | 17.95 | 0.99479 | 119.36 | 18.30 | 0.99568 | 122.92 | 19.24 | 0.99989 | 119.32 |
| F3/2 | 138.88 | 21.37 | 0.95639 | 141.26 | 22.18 | 0.97983 | 142.57 | 22.52 | 0.98114 | 147.40 | 23.65 | 0.99464 | 142.53 |
| F2 | 164.17 | 26.05 | 0.92872 | 167.52 | 26.97 | 0.95792 | 169.10 | 27.32 | 0.95952 | 175.42 | 28.65 | 0.98058 | 169.05 |
| F3 | 222.61 | 36.77 | 0.87407 | 228.25 | 37.96 | 0.91068 | 230.47 | 38.30 | 0.91263 | 240.31 | 40.13 | 0.94386 | 230.41 |
| D1 | 175.89 | 26.39 | 0.99355 | 176.86 | 26.88 | 0.99098 | 178.38 | 27.19 | 0.99065 | 182.04 | 28.06 | 0.97541 | 178.29 |
| D2 | 195.13 | 29.27 | 0.99393 | 196.70 | 29.82 | 0.99694 | 198.43 | 30.14 | 0.99702 | 203.02 | 31.13 | 0.98767 | 198.32 |
| D3 | 219.24 | 32.21 | 0.98953 | 221.64 | 32.86 | 0.99881 | 223.63 | 33.17 | 0.99930 | 229.49 | 34.34 | 0.99697 | 223.50 |
| D4 | 203.07 | 29.23 | 0.99306 | 204.91 | 29.82 | 0.99831 | 206.73 | 30.13 | 0.99853 | 211.73 | 31.18 | 0.99165 | 206.61 |
| A3/2 | 73.92 | 9.71 | 0.97687 | 74.90 | 10.42 | 0.99439 | 75.57 | 10.78 | 0.99536 | 77.90 | 11.58 | 0.99987 | 75.57 |
| A2 | 52.52 | 5.84 | 0.97467 | 53.21 | 6.54 | 0.99393 | 53.67 | 6.91 | 0.99499 | 55.38 | 7.64 | 0.99984 | 53.70 |
| A3 | 31.12 | 1.79 | 0.96907 | 31.52 | 2.47 | 0.99277 | 31.78 | 2.85 | 0.99406 | 32.87 | 3.51 | 0.99976 | 31.82 |
| A4 | 20.42 | −0.40 | 0.96112 | 20.67 | 0.28 | 0.99112 | 20.83 | 0.66 | 0.99274 | 21.62 | 1.29 | 0.99962 | 20.89 |
| R1 | 82.10 | 10.66 | 0.99258 | 82.50 | 11.24 | 0.98938 | 83.19 | 11.59 | 0.98898 | 84.94 | 12.28 | 0.97138 | 83.18 |
| R2 | 97.84 | 12.98 | 0.99157 | 98.75 | 13.61 | 0.99857 | 99.61 | 13.96 | 0.99889 | 102.16 | 14.76 | 0.99249 | 99.59 |
| R3 | 103.78 | 13.70 | 0.98857 | 104.88 | 14.36 | 0.99872 | 105.81 | 14.71 | 0.99925 | 108.67 | 15.55 | 0.99650 | 105.79 |
| P1 | 11.76 | −2.51 | 0.97700 | 11.72 | −1.87 | 0.96276 | 11.79 | −1.49 | 0.96108 | 12.12 | −0.93 | 0.90878 | 11.85 |
| P2 | 19.58 | −0.75 | 0.98532 | 19.59 | −0.12 | 0.97711 | 19.72 | 0.26 | 0.97613 | 20.21 | 0.83 | 0.94166 | 19.78 |
| P3 | 35.21 | 2.33 | 0.98986 | 35.31 | 2.95 | 0.98482 | 35.59 | 3.32 | 0.98421 | 36.40 | 3.92 | 0.96013 | 35.63 |
| P4 | 129.00 | 18.59 | 0.99325 | 129.68 | 19.13 | 0.99049 | 130.78 | 19.46 | 0.99013 | 133.49 | 20.24 | 0.97416 | 130.74 |
| Model | 5 K·min−1 | 10 K·min−1 | 15 K·min−1 | 25 K·min−1 | Average | ||||||||
|---|---|---|---|---|---|---|---|---|---|---|---|---|---|
| Ea/kJ·mol−1 | ln A/min−1 | R2 | Ea/kJ·mol−1 | ln A/min−1 | R2 | Ea/kJ·mol−1 | ln A/min−1 | R2 | Ea/kJ·mol−1 | ln A/min−1 | R2 | Ea/kJ·mol−1 | |
| F1 | 186.81 | 34.57 | 0.99033 | 186.08 | 34.26 | 0.98925 | 209.25 | 38.73 | 0.98976 | 173.99 | 31.71 | 0.98577 | 189.03 |
| F3/2 | 221.80 | 42.11 | 0.97823 | 220.79 | 41.59 | 0.97576 | 248.24 | 46.81 | 0.97797 | 206.28 | 38.36 | 0.96937 | 224.28 |
| F2 | 261.84 | 50.72 | 0.95925 | 260.50 | 49.96 | 0.95563 | 292.86 | 56.05 | 0.95933 | 243.19 | 45.96 | 0.94681 | 264.60 |
| F3 | 354.50 | 70.63 | 0.91623 | 352.38 | 69.31 | 0.91101 | 396.13 | 77.41 | 0.91679 | 328.57 | 63.52 | 0.89889 | 357.90 |
| D1 | 275.17 | 51.79 | 0.98454 | 274.48 | 51.11 | 0.98644 | 307.63 | 57.32 | 0.98384 | 257.66 | 47.13 | 0.98933 | 278.74 |
| D2 | 305.25 | 57.61 | 0.99053 | 304.35 | 56.75 | 0.99154 | 341.13 | 63.60 | 0.98977 | 285.53 | 52.21 | 0.99257 | 309.07 |
| D3 | 343.15 | 64.29 | 0.99329 | 341.97 | 63.21 | 0.99323 | 383.34 | 70.86 | 0.99258 | 320.56 | 57.95 | 0.99201 | 347.26 |
| D4 | 317.72 | 58.80 | 0.99214 | 316.74 | 57.87 | 0.99278 | 355.02 | 64.98 | 0.99139 | 297.06 | 53.09 | 0.99302 | 321.64 |
| A3/2 | 121.10 | 21.00 | 0.98976 | 120.63 | 21.03 | 0.98862 | 136.08 | 24.15 | 0.98924 | 112.57 | 19.63 | 0.98990 | 122.60 |
| A2 | 88.25 | 14.22 | 0.98915 | 87.90 | 14.41 | 0.98795 | 99.49 | 16.85 | 0.98868 | 81.86 | 13.60 | 0.98395 | 89.38 |
| A3 | 55.39 | 7.43 | 0.98776 | 55.17 | 7.80 | 0.98640 | 62.91 | 9.56 | 0.98741 | 51.15 | 7.56 | 0.98175 | 56.16 |
| A4 | 38.97 | 4.04 | 0.98608 | 38.81 | 4.49 | 0.98455 | 44.61 | 5.91 | 0.98593 | 35.80 | 4.54 | 0.97908 | 39.55 |
| R1 | 132.43 | 22.83 | 0.98334 | 132.10 | 22.83 | 0.98539 | 148.68 | 26.15 | 0.98273 | 123.70 | 21.31 | 0.98844 | 134.23 |
| R2 | 157.09 | 27.47 | 0.98228 | 156.59 | 27.33 | 0.98275 | 176.15 | 31.17 | 0.98156 | 146.53 | 25.34 | 0.98251 | 159.09 |
| R3 | 166.42 | 29.08 | 0.99286 | 165.85 | 28.89 | 0.99280 | 186.54 | 32.92 | 0.99216 | 155.15 | 26.72 | 0.99147 | 168.49 |
| P1 | 25.37 | 1.11 | 0.97204 | 25.31 | 1.63 | 0.97542 | 29.47 | 2.77 | 0.97282 | 23.23 | 1.94 | 0.97969 | 25.845 |
| P2 | 37.27 | 3.52 | 0.97683 | 37.18 | 3.99 | 0.97964 | 42.72 | 5.36 | 0.97690 | 34.39 | 4.09 | 0.98347 | 37.89 |
| P3 | 61.06 | 8.35 | 0.98049 | 60.91 | 8.70 | 0.98287 | 69.21 | 10.56 | 0.98013 | 56.72 | 8.40 | 0.98629 | 61.98 |
| P4 | 203.80 | 37.31 | 0.98416 | 203.29 | 36.97 | 0.98610 | 228.16 | 41.73 | 0.98348 | 190.68 | 34.22 | 0.98905 | 206.48 |
| Model | 5 K·min−1 | 10 K·min−1 | 15 K·min−1 | 25 K·min−1 | Average | ||||||||
|---|---|---|---|---|---|---|---|---|---|---|---|---|---|
| Ea/kJ·mol−1 | ln A/min−1 | R2 | Ea/kJ·mol−1 | ln A/min−1 | R2 | Ea/kJ·mol−1 | ln A/min−1 | R2 | Ea/kJ·mol−1 | ln A/min−1 | R2 | Ea/kJ·mol−1 | |
| F1 | 117.99 | 15.03 | 0.97873 | 119.71 | 15.76 | 0.99468 | 120.88 | 16.12 | 0.99558 | 124.56 | 17.05 | 0.99990 | 120.79 |
| F3/2 | 140.15 | 19.00 | 0.95655 | 142.68 | 19.82 | 0.97984 | 144.10 | 20.17 | 0.98117 | 149.04 | 21.28 | 0.99458 | 143.99 |
| F2 | 165.44 | 23.51 | 0.92913 | 168.94 | 24.44 | 0.95815 | 170.63 | 24.79 | 0.95979 | 177.06 | 26.10 | 0.98065 | 170.52 |
| F3 | 223.88 | 33.92 | 0.87480 | 229.67 | 35.12 | 0.91125 | 232.00 | 35.46 | 0.91326 | 241.96 | 37.27 | 0.94425 | 231.88 |
| D1 | 177.16 | 23.78 | 0.99365 | 178.28 | 24.29 | 0.99130 | 179.91 | 24.61 | 0.99099 | 183.68 | 25.48 | 0.97614 | 179.76 |
| D2 | 196.40 | 26.56 | 0.99392 | 198.12 | 27.13 | 0.99706 | 199.96 | 27.45 | 0.99715 | 204.66 | 28.44 | 0.98807 | 199.79 |
| D3 | 220.51 | 29.38 | 0.98948 | 223.06 | 30.04 | 0.99880 | 225.16 | 30.36 | 0.99929 | 231.13 | 31.53 | 0.99710 | 224.97 |
| D4 | 204.34 | 26.48 | 0.99303 | 206.33 | 27.08 | 0.99836 | 208.25 | 27.40 | 0.99860 | 213.37 | 28.45 | 0.99194 | 208.07 |
| A3/2 | 75.19 | 7.97 | 0.97683 | 76.32 | 8.69 | 0.99422 | 77.10 | 9.06 | 0.99521 | 79.54 | 9.85 | 0.99989 | 77.04 |
| A2 | 53.79 | 4.44 | 0.97465 | 54.63 | 5.15 | 0.99369 | 55.20 | 5.53 | 0.99478 | 57.03 | 6.25 | 0.99988 | 55.16 |
| A3 | 32.39 | 0.91 | 0.96927 | 32.94 | 1.61 | 0.99239 | 33.31 | 2.00 | 0.99372 | 34.51 | 2.64 | 0.99985 | 33.29 |
| A4 | 21.69 | −0.85 | 0.96193 | 22.09 | −0.16 | 0.99061 | 22.36 | 0.23 | 0.99228 | 23.26 | 0.84 | 0.99981 | 22.35 |
| R1 | 83.38 | 8.81 | 0.99283 | 83.92 | 9.41 | 0.99014 | 84.71 | 9.77 | 0.98979 | 86.58 | 10.46 | 0.97313 | 84.65 |
| R2 | 99.12 | 10.96 | 0.99149 | 100.17 | 11.61 | 0.99863 | 101.14 | 11.97 | 0.99897 | 103.80 | 12.76 | 0.99303 | 101.06 |
| R3 | 105.05 | 11.61 | 0.98846 | 106.30 | 12.29 | 0.99868 | 107.34 | 12.65 | 0.99923 | 110.31 | 13.48 | 0.99679 | 107.25 |
| P1 | 13.03 | −2.41 | 0.98175 | 13.14 | −1.75 | 0.97440 | 13.32 | −1.35 | 0.97365 | 13.76 | −0.80 | 0.93443 | 13.31 |
| P2 | 20.85 | −1.16 | 0.98728 | 21.01 | −0.51 | 0.98225 | 21.25 | −0.12 | 0.98168 | 21.85 | 0.45 | 0.95328 | 21.24 |
| P3 | 36.48 | 1.33 | 0.99064 | 36.73 | 1.97 | 0.98703 | 37.12 | 2.35 | 0.98658 | 38.04 | 2.95 | 0.96518 | 37.09 |
| P4 | 130.27 | 16.30 | 0.99339 | 131.10 | 16.85 | 0.99094 | 132.31 | 17.19 | 0.99061 | 135.13 | 17.97 | 0.97520 | 132.20 |
References
- He, Z.G.; Li, Q.; Fang, J. The Solutions and Recommendations for Logistics Problems in the Collection of Medical Waste in China. Procedia Environ. Sci. 2016, 31, 447–456. [Google Scholar] [CrossRef] [Green Version]
- Wilson, A.J.; Nayak, S. Disinfection, sterilization and disposables. Anaesth. Intensive Care 2016, 17, 475–479. [Google Scholar] [CrossRef]
- Deng, N.; Zhang, Y.F.; Wang, Y. Thermogravimetric analysis and kinetic study on pyrolysis of representative medical waste composition. Waste Manag. 2007, 28, 1572–1580. [Google Scholar] [CrossRef] [PubMed]
- Sharuddin, S.D.A.; Abnisa, F.; Daud, W.M.A.W.; Aroud, M.K. A review on pyrolysis of plastic wastes. J. Environ. Manag. 2016, 115, 308–326. [Google Scholar] [CrossRef]
- Bridgwater, A.V. Review of fast pyrolysis of biomass and product upgrading. Biomass Bioenergy 2012, 38, 68–94. [Google Scholar] [CrossRef]
- Abnisa, F.; Daud, W.M.A.W. A review on co-pyrolysis of biomass: An optional technique to obtain a high-grade pyrolysis oil. Energy Convers. Manag. 2014, 87, 71–85. [Google Scholar] [CrossRef]
- Wang, Z.; Xie, T.; Ning, X.Y.; Liu, Y.C.; Wang, J. Thermal degradation kinetics study of polyvinyl chloride (PVC) sheath for new and aged cables. Waste Manag. 2019, 99, 146–153. [Google Scholar] [CrossRef]
- Aboulkas, A.; El harfi, K.; El Bouadili, A. Thermal degradation behaviors of polyethylene and polypropylene. Part I: Pyrolysis kinetics and mechanisms. Energy Convers. Manag. 2010, 51, 1363–1369. [Google Scholar] [CrossRef]
- Xu, F.F.; Wang, B.; Yang, D.; Hao, J.H.; Qiao, Y.Y.; Tian, Y.Y. Thermal degradation of typical plastics under high heating rate conditions by TG-FTIR: Pyrolysis behaviors and kinetic analysis. Energy Convers. Manag. 2018, 171, 1106–1115. [Google Scholar] [CrossRef]
- Han, B.; Wu, Y.L.; Feng, W.; Chen, Z.; Yang, M.D. Kinetic Study of PVC Pyrolysis in Air by Thermogravimetric Analysis Using the Friedman Method. Adv. Mater. Res. 2012, 427, 64–69. [Google Scholar] [CrossRef]
- Nisar, J.; Khan, M.A.; Ali, G.; Iqbal, M.; Shah, A.; Shah, M.R.; Sherazi, S.T.H. Pyrolysis of polypropylene over zeolite mordenite ammonium: Kinetics and products distribution. J. Polym. Eng. 2019, 39, 785–793. [Google Scholar] [CrossRef]
- Tewarson, A.; Macaione, D.P. Polymer and composites-An examination of ire spread and generation of heat and fire products. J. Fire Sci. 1993, 11, 421–441. [Google Scholar] [CrossRef]
- Ushkov, V.A.; Abramov, V.V.; Grigor’eva, L.S.; Kir’yanova, L.V. Thermal stability and fire hazard of epoxy polymer pastes. Stroit. Mater. 2011, 12, 68–71. [Google Scholar]
- Hassel, R.L.; Baker, K.F. Evaluation of potential polymer safety hazards by thermal analysis. Soc. Plast. Eng. Tech. Pap. 1978, 24, 384–386. [Google Scholar]
- Huang, Y.J.; Tu, C.H.; Chao, H.R.; Chen, H.T. Pyrolysis and Oxidation Kinetics of Medical Wastes. Environ. Technol. 2006, 27, 153–158. [Google Scholar] [CrossRef] [PubMed]
- Yan, J.H.; Zhu, H.M.; Jiang, X.G.; Chi, Y.; Cen, K.F. Analysis of volatile species kinetics during typical medical waste materials pyrolysis using a distributed activation energy model. J. Hazard. Mater. 2009, 162, 646–651. [Google Scholar] [CrossRef] [PubMed]
- Deng, N.; Wang, W.W.; Cui, W.Q.; Zhang, Y.F.; Ma, H.T. Thermogravimetric characteristics and different kinetic models for medical waste composition containing polyvinyl chloride-transfusion tube. J. Cent. South Univ. 2014, 21, 1034–1043. [Google Scholar] [CrossRef]
- Qin, L.B.; Han, J.; Zhao, B.; Chen, W.S.; Xing, F.T. The kinetics of typical medical waste pyrolysis based on gaseous evolution behaviour in a micro-fluidised bed reactor. Waste Manag. Res. 2018, 36, 1073–1082. [Google Scholar] [CrossRef]
- Jiang, L.; Zhang, D.; Li, M.; He, J.J.; Gao, Z.H.; Zhou, Y.; Sun, J.H. Pyrolytic behavior of waste extruded polystyrene and rigid polyurethane by multi kinetics methods and Py-GC/MS. Fuel 2018, 222, 11–20. [Google Scholar] [CrossRef]
- Jiang, L.; Xiao, H.H.; He, J.J.; Sun, Q.; Gong, L.; Sun, J.H. Application of genetic algorithm to pyrolysis of typical polymers. Fuel. Process. Technol. 2015, 138, 48–55. [Google Scholar] [CrossRef]
- Akerblom, I.E.; Ojwang, D.O.; Grins, J.; Svensson, G. A thermogravimetric study of thermal dehydration of copper hexacyanoferrate by means of model-free kinetic analysis. J. Therm. Anal. Calorim. 2017, 129, 721–731. [Google Scholar] [CrossRef] [Green Version]
- Grigiante, M.; Brighenti, M.; Antolini, D. Analysis of the impact of TG data sets on activation energy (Ea). J. Therm. Anal. Calorim. 2017, 129, 553–565. [Google Scholar] [CrossRef]
- Ankita, S.; Namrata, C.; Neeraj, M. Calorimetric studies of crystallization for multi-component glasses of Se–Te–Sn–Ag (STSA) system using model-free and model-fitting non-isothermal methods. J. Therm. Anal. Calorim. 2017, 128, 907–914. [Google Scholar]
- Janković, B.; Mentus, S. Model-fitting and model-free analysis of thermal decomposition of palladium acetylacetonate [Pd(acac) 2]. J. Therm. Anal. Calorim. 2008, 94, 395–403. [Google Scholar] [CrossRef]
- Flynn, J.H.; Wall, L.A. A quick, direct method for the determination of activation energy from thermogravimetric data. Polym. Lett. 1966, 4, 323–328. [Google Scholar] [CrossRef]
- Ozawa, T. A new method of analyzing thermogravimetric data. Bull. Chem. Soc. Jpn. 1965, 38, 1881–1886. [Google Scholar] [CrossRef] [Green Version]
- He, K. Reaction kinetics in differential thermal analysis. Anal. Chem. 1957, 29, 1702–1706. [Google Scholar]
- Akahira, T.; Sunose, T. Method of determining activation deterioration constant of electrical insulating materials. Res. Rep. Chiba Inst. Technol. 1971, 16, 22–31. [Google Scholar]
- Friedman, H.L. Kinetics of thermal degradation of char-forming plastics from thermogravimetry. Application to a phenolic plastic. J. Polym. Sci. Part C 1964, 6, 183–195. [Google Scholar] [CrossRef]
- Coats, A.W.; Redfern, J.P. Kinetic parameters from thermogravimetric data. Nature 1964, 201, 68–69. [Google Scholar] [CrossRef]
- Kennedy, J.A.; Clark, S.M. A New Method for the Analysis of Non-Isothermal DSC and Diffraction Data. Thermochim. Acta 1997, 307, 27–35. [Google Scholar] [CrossRef]
- Doyle, C.D. Estimating isothermal life from thermogravimetric data. J. Appl. Polym. Sci. 1962, 6, 639–642. [Google Scholar] [CrossRef]
- Sogancioglu, M.; Yel, E.; Ahmetli, G. Behaviour of waste polypropylene pyrolysis char-based epoxy composite materials. Environ. Sci. Pollut. Res. 2019, 27, 3871–3884. [Google Scholar] [CrossRef] [PubMed]
- Zhou, R.; Huang, B.; Ding, Y.; Li, W.; Mu, J. Thermal Decomposition Mechanism and Kinetics Study of Plastic Waste Chlorinated Polyvinyl Chloride. Polymers 2019, 11, 2080. [Google Scholar] [CrossRef] [PubMed] [Green Version]
- Al-Salem, S.M.; Antelava, A.; Constantinou, A.; Manos, G.; Dutta, A. A review on thermal and catalytic pyrolysis of plastic solid waste (PSW). J. Environ. Manag. 2017, 197, 177–198. [Google Scholar] [CrossRef]
- Kunwar, B.; Cheng, H.N.; Chandrashekaran, S.R.; Sharma, B.K. Plastics to fuel: A review. Renew. Sustain. Energy Rev. 2016, 54, 421–428. [Google Scholar] [CrossRef]
- Yang, K.K.; Wang, X.L.; Wang, Y.Z.; Wu, B.; Jin, Y.D.; Yang, B. Kinetics of thermal degradation and thermal oxidative degradation of poly(p-dioxanone). Eur. Polym. J. 2003, 39, 1567–1574. [Google Scholar] [CrossRef]
- Lesnikovich, A.; Levchik, S. A method of finding invariant values of kinetic parameters. J. Therm. Anal. Calorim. 1983, 27, 89–93. [Google Scholar] [CrossRef]
- Vyazovkin, S. A unified approach to kinetic processing of nonisothermal data. Int. J. Chem. Kinet. 1996, 28, 95–101. [Google Scholar] [CrossRef]
- Koga, N.; Tanaka, H. Accommodation of the actual solid-state process in the kinetic model function. Part 2. Applicability of the empirical kinetic model function to diffusion-controlled reactions. Thermochim. Acta 1996, 282, 69–80. [Google Scholar] [CrossRef]
- Cao, H.Q.; Lin, J.; Duan, Q.L.; Zhang, D.; Chen, H.D.; Sun, J.H. An experimental and theoretical study of optimized selection and model reconstruction for ammonium nitrate pyrolysis. J. Hazard. Mater. 2019, 364, 539–547. [Google Scholar] [CrossRef] [PubMed]


| Sample | IB | NOC |
|---|---|---|
| Proximate analysis/% | ||
| Ash | 0.05 | 0.10 |
| Volatile matter | 98.67 | 92.26 |
| Fixed carbon a | 1.28 | 7.64 |
| Ultimate analysis% | ||
| Carbon | 85.59 | 51.94 |
| Hydrogen | 13.78 | 7.05 |
| Sulfur | 0.22 | 0.37 |
| Oxygen | 0.35 | 0.44 |
| Nitrogen | − | − |
| Chlorine | − | 32.76 |
| No | Reaction Model | Symbol | f(α) | G(α) |
|---|---|---|---|---|
| 1 | First-order | F1 | ||
| 2 | Three-halves order | F3/2 | ||
| 3 | Second-order | F2 | ||
| 4 | Third-order | F3 | ||
| 5 | One-dimensional diffusion | D1 | ||
| 6 | Two-dimensional diffusion Valensi equation | D2 | ||
| 7 | Three-dimensional diffusion Jander equation | D3 | ||
| 8 | Three-dimension diffusion G-B equation | D4 | ||
| 9 | Avrami–Erofeev (n = 1.5) | A3/2 | ||
| 10 | Avrami–Erofeev (n = 2) | A2 | ||
| 11 | Avrami–Erofeev (n = 3) | A3 | ||
| 12 | Avrami–Erofeev (n = 4) | A4 | ||
| 13 | Zero-order (Polany–Winger equation) | R1 | ||
| 14 | Phase-boundary controlled reaction | R2 | ||
| 15 | Phase-boundary controlled reaction | R3 | ||
| 16 | Power law | P1 | ||
| 17 | Power law | P2 | ||
| 18 | Power law | P3 | ||
| 19 | Power law | P4 |
| Sample | Heating Rate/K min−1 | Pyrolysis Interval/K | Peak Temperature/K | Mass Loss/% | |
|---|---|---|---|---|---|
| IB | 5 | 638–745 | 722 | 98.48 | |
| 10 | 649–761 | 727 | 99.18 | ||
| 15 | 656–772 | 734 | 99.24 | ||
| 25 | 665–783 | 747 | 99.96 | ||
| NOC | 5 | First Stage | 494–619 | 580 | 69.37 |
| Second Stage | 619–772 | 726 | 91.11 | ||
| 10 | First Stage | 507–630 | 592 | 69.14 | |
| Second Stage | 630–786 | 738 | 91.18 | ||
| 15 | First Stage | 532–638 | 599 | 69.04 | |
| Second Stage | 638–802 | 749 | 91.11 | ||
| 25 | First Stage | 548–650 | 609 | 68.94 | |
| Second Stage | 650–810 | 758 | 91.09 | ||
| Sample | Method | Model | 5 K·min−1 | 10 K·min−1 | 15 K·min−1 | 25 K·min−1 | Average Ea | |||||||||
|---|---|---|---|---|---|---|---|---|---|---|---|---|---|---|---|---|
| Ea | ln A | R2 | Ea | ln A | R2 | Ea | ln A | R2 | Ea | ln A | R2 | |||||
| IB | CR method | R1 | 153.39 | 23.51 | 0.99308 | 213.44 | 33.84 | 0.97666 | 227.19 | 36.17 | 0.96492 | 212.97 | 33.81 | 0.97110 | 201.75 | |
| KC method | R1 | 154.50 | 21.01 | 0.99311 | 184.39 | 27.29 | 0.97102 | 228.75 | 33.36 | 0.96556 | 214.62 | 31.08 | 0.97167 | 195.57 | ||
| NOC | First stage | CR method | R1 | 133.23 | 25.56 | 0.98340 | 132.67 | 25.51 | 0.98539 | 149.08 | 28.90 | 0.98270 | 124.00 | 23.86 | 0.98141 | 134.75 |
| KC method | R1 | 132.43 | 22.83 | 0.98334 | 132.10 | 22.83 | 0.98539 | 148.68 | 26.15 | 0.98273 | 123.70 | 21.31 | 0.98844 | 134.23 | ||
| Second Stage | CR method | D3 | 219.24 | 32.21 | 0.98953 | 221.64 | 32.86 | 0.99881 | 223.63 | 33.17 | 0.99930 | 229.49 | 34.34 | 0.99697 | 223.50 | |
| KC method | D3 | 220.51 | 29.38 | 0.98948 | 223.06 | 30.04 | 0.99880 | 225.16 | 30.36 | 0.99929 | 231.13 | 31.53 | 0.99710 | 224.97 | ||
| Sample | β/K·min−1 | CR Method | KC Method | |||||||||
|---|---|---|---|---|---|---|---|---|---|---|---|---|
| a/min−1 | b/mol kJ−1 | kiso/min−1 | Tiso/K | R2 | a/min−1 | b/mol kJ−1 | kiso/min−1 | Tiso/K | R2 | |||
| IB | 5 | −2.874 | 0.1713 | 0.05647 | 702.15 | 0.99728 | −4.282 | 0.16483 | 0.01382 | 729.72 | 0.99734 | |
| 10 | −1.899 | 0.1670 | 0.14972 | 720.23 | 0.99852 | −2.496 | 0.16248 | 0.08241 | 740.27 | 0.99854 | ||
| 15 | −1.468 | 0.1653 | 0.23038 | 727.64 | 0.99868 | −3.309 | 0.16106 | 0.03655 | 746.80 | 0.99869 | ||
| 25 | −1.042 | 0.1632 | 0.35275 | 737.00 | 0.99845 | −2.805 | 0.15869 | 0.06051 | 757.95 | 0.99847 | ||
| NOC | First Stage | 5 | −2.622 | 0.2105 | 0.07266 | 571.40 | 0.99802 | −3.957 | 0.20339 | 0.01912 | 591.37 | 0.99804 |
| 10 | −1.976 | 0.2062 | 0.13862 | 583.31 | 0.99792 | −3.305 | 0.19902 | 0.03670 | 604.36 | 0.99794 | ||
| 15 | −1.474 | 0.2029 | 0.22901 | 592.80 | 0.99828 | −2.929 | 0.19655 | 0.05345 | 611.95 | 0.99830 | ||
| 25 | −1.189 | 0.2009 | 0.30453 | 598.70 | 0.99750 | −2.441 | 0.1932 | 0.08707 | 622.56 | 0.99752 | ||
| Second Stage | 5 | −3.657 | 0.1720 | 0.02581 | 699.30 | 0.99279 | −4.381 | 0.16003 | 0.01251 | 751.60 | 0.99265 | |
| 10 | −2.995 | 0.1701 | 0.05004 | 707.11 | 0.99282 | −3.725 | 0.15832 | 0.02411 | 759.72 | 0.99262 | ||
| 15 | −2.605 | 0.1683 | 0.07390 | 714.67 | 0.99279 | −3.340 | 0.15655 | 0.03544 | 768.31 | 0.99258 | ||
| 25 | −2.098 | 0.1669 | 0.12270 | 720.67 | 0.99308 | −2.861 | 0.15557 | 0.05721 | 773.15 | 0.99282 | ||
| Sample | Reaction Model | RSS | Modified Model | RSS | |
|---|---|---|---|---|---|
| IB | R1 (Zero-order) | 58.63671 | 2.10598 | ||
| NOC | First Stage | R1 (Zero- order) | 31.29233 | 0.25205 | |
| Second Stage | D3 (Three-dimensional diffusion Jander equation) | 10.87707 | 0.00207 | ||
Publisher’s Note: MDPI stays neutral with regard to jurisdictional claims in published maps and institutional affiliations. |
© 2020 by the authors. Licensee MDPI, Basel, Switzerland. This article is an open access article distributed under the terms and conditions of the Creative Commons Attribution (CC BY) license (http://creativecommons.org/licenses/by/4.0/).
Share and Cite
Zhang, L.; Jiang, J.; Ma, T.; Pan, Y.; Wang, Y.; Jiang, J. Insights into Thermal Degradation Behaviors and Reaction Kinetics of Medical Waste Infusion Bag and Nasal Oxygen Cannula. Processes 2021, 9, 27. https://doi.org/10.3390/pr9010027
Zhang L, Jiang J, Ma T, Pan Y, Wang Y, Jiang J. Insights into Thermal Degradation Behaviors and Reaction Kinetics of Medical Waste Infusion Bag and Nasal Oxygen Cannula. Processes. 2021; 9(1):27. https://doi.org/10.3390/pr9010027
Chicago/Turabian StyleZhang, Lifan, Jiajia Jiang, Tengkun Ma, Yong Pan, Yanjun Wang, and Juncheng Jiang. 2021. "Insights into Thermal Degradation Behaviors and Reaction Kinetics of Medical Waste Infusion Bag and Nasal Oxygen Cannula" Processes 9, no. 1: 27. https://doi.org/10.3390/pr9010027