Article

Design and Characterization of a Fluidic Device for the Evaluation of SIS-Based Vascular Grafts

by
Alejandra Riveros
1,2,*,
Monica Cuellar
1,
Paolo F. Sánchez
1,
Carolina Muñoz-Camargo
1,
Juan C. Cruz
1,3,
Néstor Sandoval
4,
Omar D. Lopez Mejia
2 and
Juan C. Briceño
1,4,*
1
Department of Biomedical Engineering, Universidad de los Andes, Bogotá 11711, Colombia
2
Department of Mechanical Engineering, Universidad de los Andes, Bogotá 11711, Colombia
3
School of Chemical Engineering and Advanced Materials, The University of Adelaide, South Australia, Adelaide 5005, SA, Australia
4
Fundación Cardioinfantil Instituto de Cardiología, Bogotá 110131, Colombia
*
Authors to whom correspondence should be addressed.
Processes 2020, 8(9), 1198; https://doi.org/10.3390/pr8091198
Submission received: 11 August 2020 / Revised: 31 August 2020 / Accepted: 1 September 2020 / Published: 22 September 2020
(This article belongs to the Section Biological Processes and Systems)

Abstract

:
Currently available small diameter vascular conduits present several long-term limitations, which has prevented their full clinical implementation. Commercially available vascular grafts show no regenerative capabilities and eventually require surgical replacement; therefore, it is of great interest to develop alternative regenerative vascular grafts (RVG). Decellularized Small Intestinal Submucosa (SIS) is an attractive material for RVG, however, the evaluation of the performance of these grafts is challenging due to the absence of devices that mimic the conditions found in vivo. Thereby, the objective of this study is to design, manufacture and validate in silico and in vitro, a novel fluidic system for the evaluation of human umbilical vein endothelial cells (HUVECs) proliferation on SIS-based RVG under dynamical conditions. Our perfusion and rotational fluidic system was designed in Autodesk Inventor 2018. In silico Computational Fluid Dynamics (CFD) validation of the system was carried out using Ansys Fluent software from ANSYS, Inc for dynamical conditions of a pulsatile pressure function measured experimentally over a rigid wall model. Mechanical and biological parameters such as flow regime, pressure gradient, wall shear stress (WSS), sterility and indirect cell viability (MTT assay) were also evaluated. Cell adhesion was confirmed by SEM imaging. The fluid flow regime within the system remains laminar. The system maintained sterility and showed low cytotoxicity levels. HUVECs were successfully cultured on SIS-based RVG under both perfusion and rotation conditions. In silico analysis agreed well with our experimental and theoretical results, and with recent in vitro and in vivo reports for WSS. The system presented is a tool for evaluating RVG and represents an alternative to develop new methods and protocols for a more comprehensive study of regenerative cardiovascular devices.

1. Introduction

Cardiovascular diseases (CVDs) are the main cause of death in the world. Incidence worldwide is expected to rise annually to as high as 23.3 million by 2030 [1]. Treatment of these pathologies primarily relies on surgical interventions such as by-pass grafting with the main purpose of restoring vascular blood-flow along the diseased conduit. The gold standard for surgical by-pass grafting of small diameter (<6 mm) blood vessels continues to be autologous vessels, such as the saphenous vein or the internal thoracic artery [2,3,4]. Despite the important benefits, these vessels require invasive harvesting and present failure rates of around 50% after 10 years [2,4,5]. Alternatively, synthetic conduits made of polymers such as PTFE, Dacron and Gore-Tex generally fail as replacement of small diameter vessels due to their marked tendency to promote thrombotic occlusions [6,7,8]. Given the complications presented by the currently available treatments, the development of novel vascular grafts is an area of major concern and of growing interest in the field of biomaterials and tissue engineering.
The manufacture of conduits from biodegradable materials such as extracellular matrices (ECM) has become an appealing alternative to synthetic-polymer vascular grafts. This is mainly due to their superior remodeling properties and regenerative abilities [9]. One example of such ECMs is the porcine Small Intestinal Submucosa (SIS), which exhibits regenerative properties that are useful for the manufacture of vascular grafts. As a result, SIS has been successfully used to produce acellular vascular grafts with demonstrated ability of withstanding physiological loading conditions both in vitro and in vivo without bursting or losing mechanical integrity [10,11,12]. Moreover, in most cases, they have showed tissue regeneration and relatively high patency [11,13,14,15]. In spite of the progress made over the past few years, small-diameter vessels made from SIS still exhibit lower patency rates compared with the current gold standard, i.e., the autologous ones [12]. This strongly suggests that it is necessary to engineer the material to comply with this attribute. After introducing a change to a design parameter of a graft prototype, it is essential to assess the mechanical and biological responses in a rapid but insightful manner. This is critical to assure that a properly functioning graft prototype can be found in a relatively short time span.
A major limitation for testing vascular grafts in vitro is to properly mimic the physiological dynamic conditions of the native vessels [16,17,18,19,20]. Most tests are conducted under static conditions, which are imprecise mainly due to mass transfer processes occurring only by molecular diffusion, negligible biomechanical forces for tissue development modulation, impaired morphological characteristics, random orientation of cells in the vessel walls, and reduced mechanical properties of vascular grafts compared to native vessels [16,19,20]. Recent reports have suggested that more accurate dynamic conditions can be achieved by testing the grafts with the aid of fluidic systems where, to a certain extent, the blood flow and cell proliferation are recreated [16,18,20,21,22,23,24]. Some of the designed systems are the rotating wall vessel bioreactor and the perfused chamber bioreactors [16]. Some of these devices include a mechanical valve, a reservoir, a pump, a chamber for tissue and cell interaction, a compliance resistance, and a filter [16,19,20,25]. Despite the potential of these devices, there are still some issues regarding efficient gas exchange, achieving optimal biomechanical conditions such as strain amplitude and frequency. Moreover, they usually fail at approaching shear stress ranges to obtain physiologically comparable vascular grafts with superior performance in burst strength, compliance and suture retention tests [16,19]. Over the past few years, these issues have been addressed by the incorporation of filters and reservoir bags and by culture medium recirculation through pulsatile perfusion and rotation systems [16,18,26,27].
Zeng L, et al. [28] concluded the effect of the flow regimes on the promotion of endothelial cells proliferation or apoptosis. Since the bioreactor system aims to promote the endothelialization process of the vascular graft under in vitro conditions, the wall shear stress profile obtained in the simulation shows low values and scattered distributions of the maximum values in the vascular graft. Disturbed flows such as those generated by orbital oscillations demonstrated to increase by 29% the EC proliferation due to the generation of an orbital shear stress [28]. In contrast, the parallel plates of the EC due to laminar flows were associated with a decrease of 16% in cell proliferation; for that reason, the authors concluded that temporal gradients of shear stress, but not spatial gradients, increase the proliferation of EC [28]. HUVECS exposed to oscillatory flow at 12 dynes/cm2 increased their DNA synthesis [28]. This demonstrated the importance of mechanical signaling for the proliferation of EC with sudden onset of flows.
Prototyping of devices for testing vascular grafts is generally a tedious and costly process [3,17,29,30]. This is mainly due to the requirements of the systems in terms of the biomechanical and biochemical controls to mimic appropriately the physiological environment while providing optimal conditions for cell and tissue growth [5,16,17,18,19,20,21,25]. Alternatively, in silico design and testing can be conducted previous to assembly with the aid of Computational Fluid Dynamics (CFD) approaches to evaluate important performance parameters such as pressure distribution, shear stress, and fluid velocity [20,24,25,31,32,33]. CFD has been widely used for modeling several fluidic devices including heart valves bioreactors; bone-tissue bioreactors; minimally invasive counterpulsation devices; and patient-specific coronary artery, fistulas and by-pass grafts [5,16,18,20,21,25,32,33,34,35,36,37,38,39,40,41].
Here we aimed at designing and manufacturing a cost-effective fluidic device to mimic the dynamic physiological conditions of native vessels. This system was built with the main purpose of evaluating some biological properties and the hydrodynamics of SIS-based vascular grafts prior to their implantation in vivo. The design was aided by an experimentally-calibrated CFD model that incorporated pulsatile flow and the hydrodynamics parameters.

2. Materials and Methods

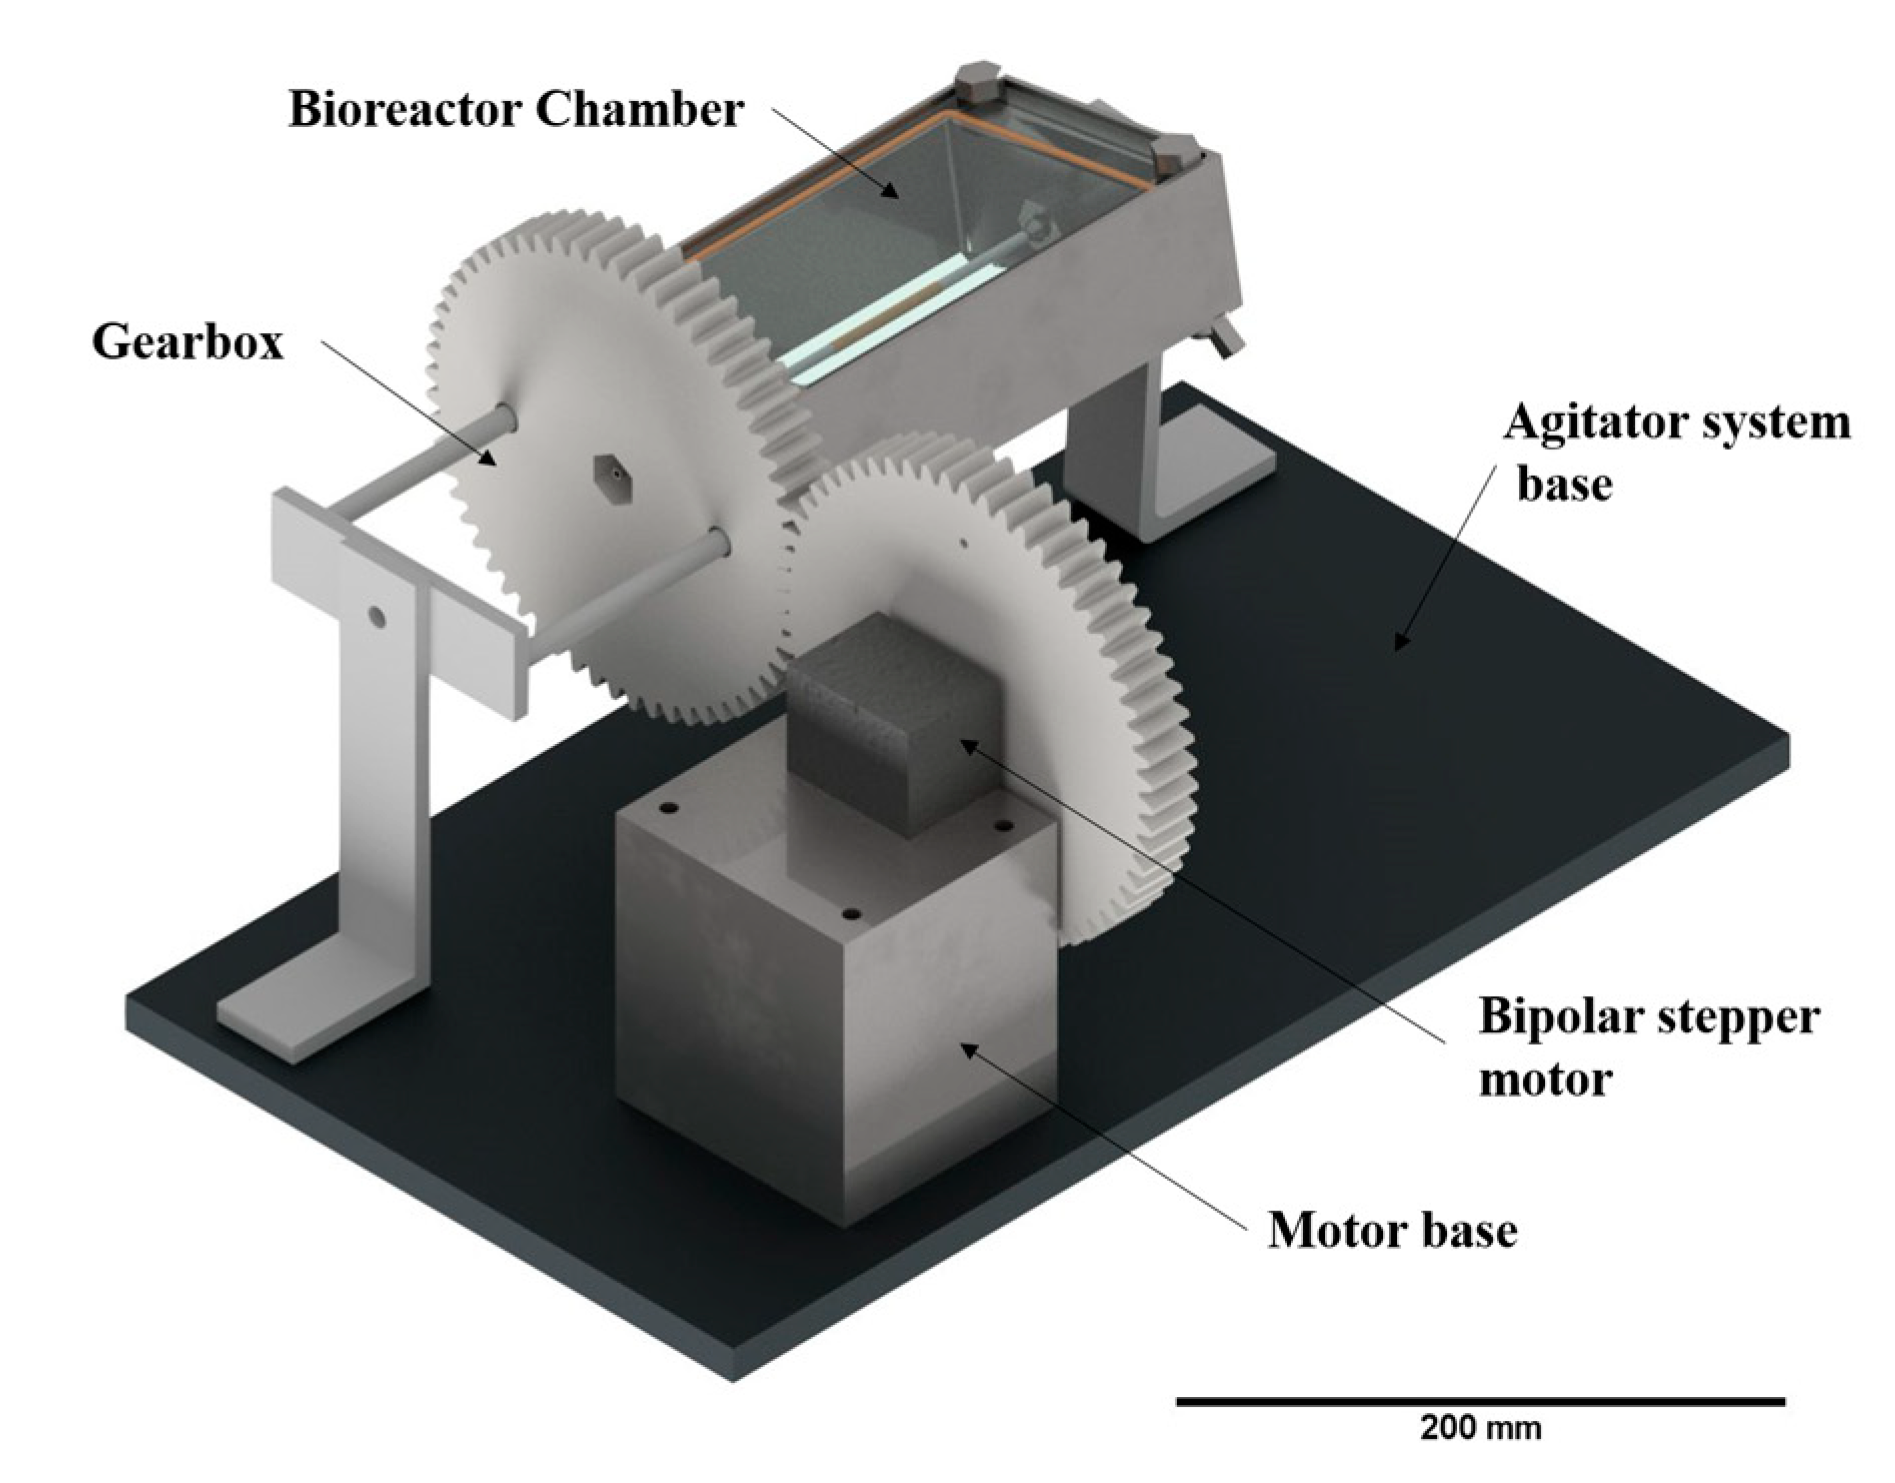
2.1. Device Design and Manufacture

The novel fluidic system is shown in Figure 1. The system is composed of a vascular graft chamber, an infusion pump, a medium reservoir, and an agitator assembly. The system was designed according to three major requirements:
  • Homogeneous cell culture throughout the vascular graft and the ability to promote in vivo hemodynamic conditions.
  • Cost-effectiveness and ease to assemble and operate.
  • Sterilizable.
The design of the vascular graft chamber was performed in the software Autodesk Inventor 2018 (Figure 1). The vascular graft chamber consisted of a main frame-shaped structure, two coupling pieces, four inserts, two polycarbonate translucent lids, four bolts, and butterfly-shaped nuts to assure complete isolation of the graft from the surroundings. The components in direct contact with culture medium were machined from SAE 304 stainless steel. To avoid leakage, silicon O-rings were placed along the joints between the inserts and coupling pieces, and between the main structure and the lids. To comply with the cell seeding protocol, all the components of the vascular graft chamber were biocompatible, highly resistant to corrosion, and sterilizable. The manufacture was performed via CNC and with a H7N6 tolerance. All parts were assembled and subsequently connected to a Baxter infusion pump and the medium reservoir.
An agitation system was designed and manufactured to maintain the culture medium well-mixed. This is critical to assure maximal proliferation of HUVEC within the vascular graft. The system allowed rotation of the fluidic device in both the clockwise and counterclockwise directions. For culture, the device was placed inside the cell incubator while allowing culture medium perfusion, continuously. The agitator implemented a 180 6-wire STP-57D210 6-wire bipolar stepper motor of 1.8 per step, 2.4 V and 1.5 A per phase. An Arduino Uno open-source microcontroller board and L298N driver were used to control the stepper motor [6]. The motor was mounted on a base and connected to a gearbox to allow rotation of the device (Figure 2). The final cost of materials and manufacturing of the whole device was under 150 USD.
Figure 3a shows a schematic of the experimental implementation of the fluidic device and the needed accessories for cell seeding on the vascular graft. The accessories are a 150 mL culture medium tank reservoir (1), an infusion pump and compatible medical tubing (2), the agitator and the fluidic device assembled with a SIS-based vascular graft, (3) and the CO2 incubator (4). Figure 3b shows an actual picture of the system setup where the culture medium reservoir tank (1) was filled up with at least 40 mL of culture medium EBM-2 supplemented with FBS (2% v/v), VEGF (0.1% v/v), Hydrocortisone (0.04% v/v), hFGF-B (0.4% v/v), R3-IGF-1 (0.1% v/v), Ascorbic Acid (0.1% v/v), hEGF (0.1% v/v), GA-1000 (0.1% v/v), and Heparin (0.1% v/v) to maintain a constant fluid volume during the cell seeding on the vascular graft. The infusion pump (2) was assembled with Baxter medical tubing to transport the cell culture medium throughout the system and to produce similar hemodynamic conditions of pulsatile pressure in the vascular graft and endothelial cells to those found physiologically. The fluidic and the agitator system (3) where assembled together and located inside the CO2 cell incubator (4) with the purpose of providing sterile and optimal conditions (37 °C, atmosphere of 5% of CO2 and 95% humidity) for cell attachment. This is critical to assure that the SIS-based vascular graft provides the appropriate mechano-stimulation by the induced pulsatile pressure.

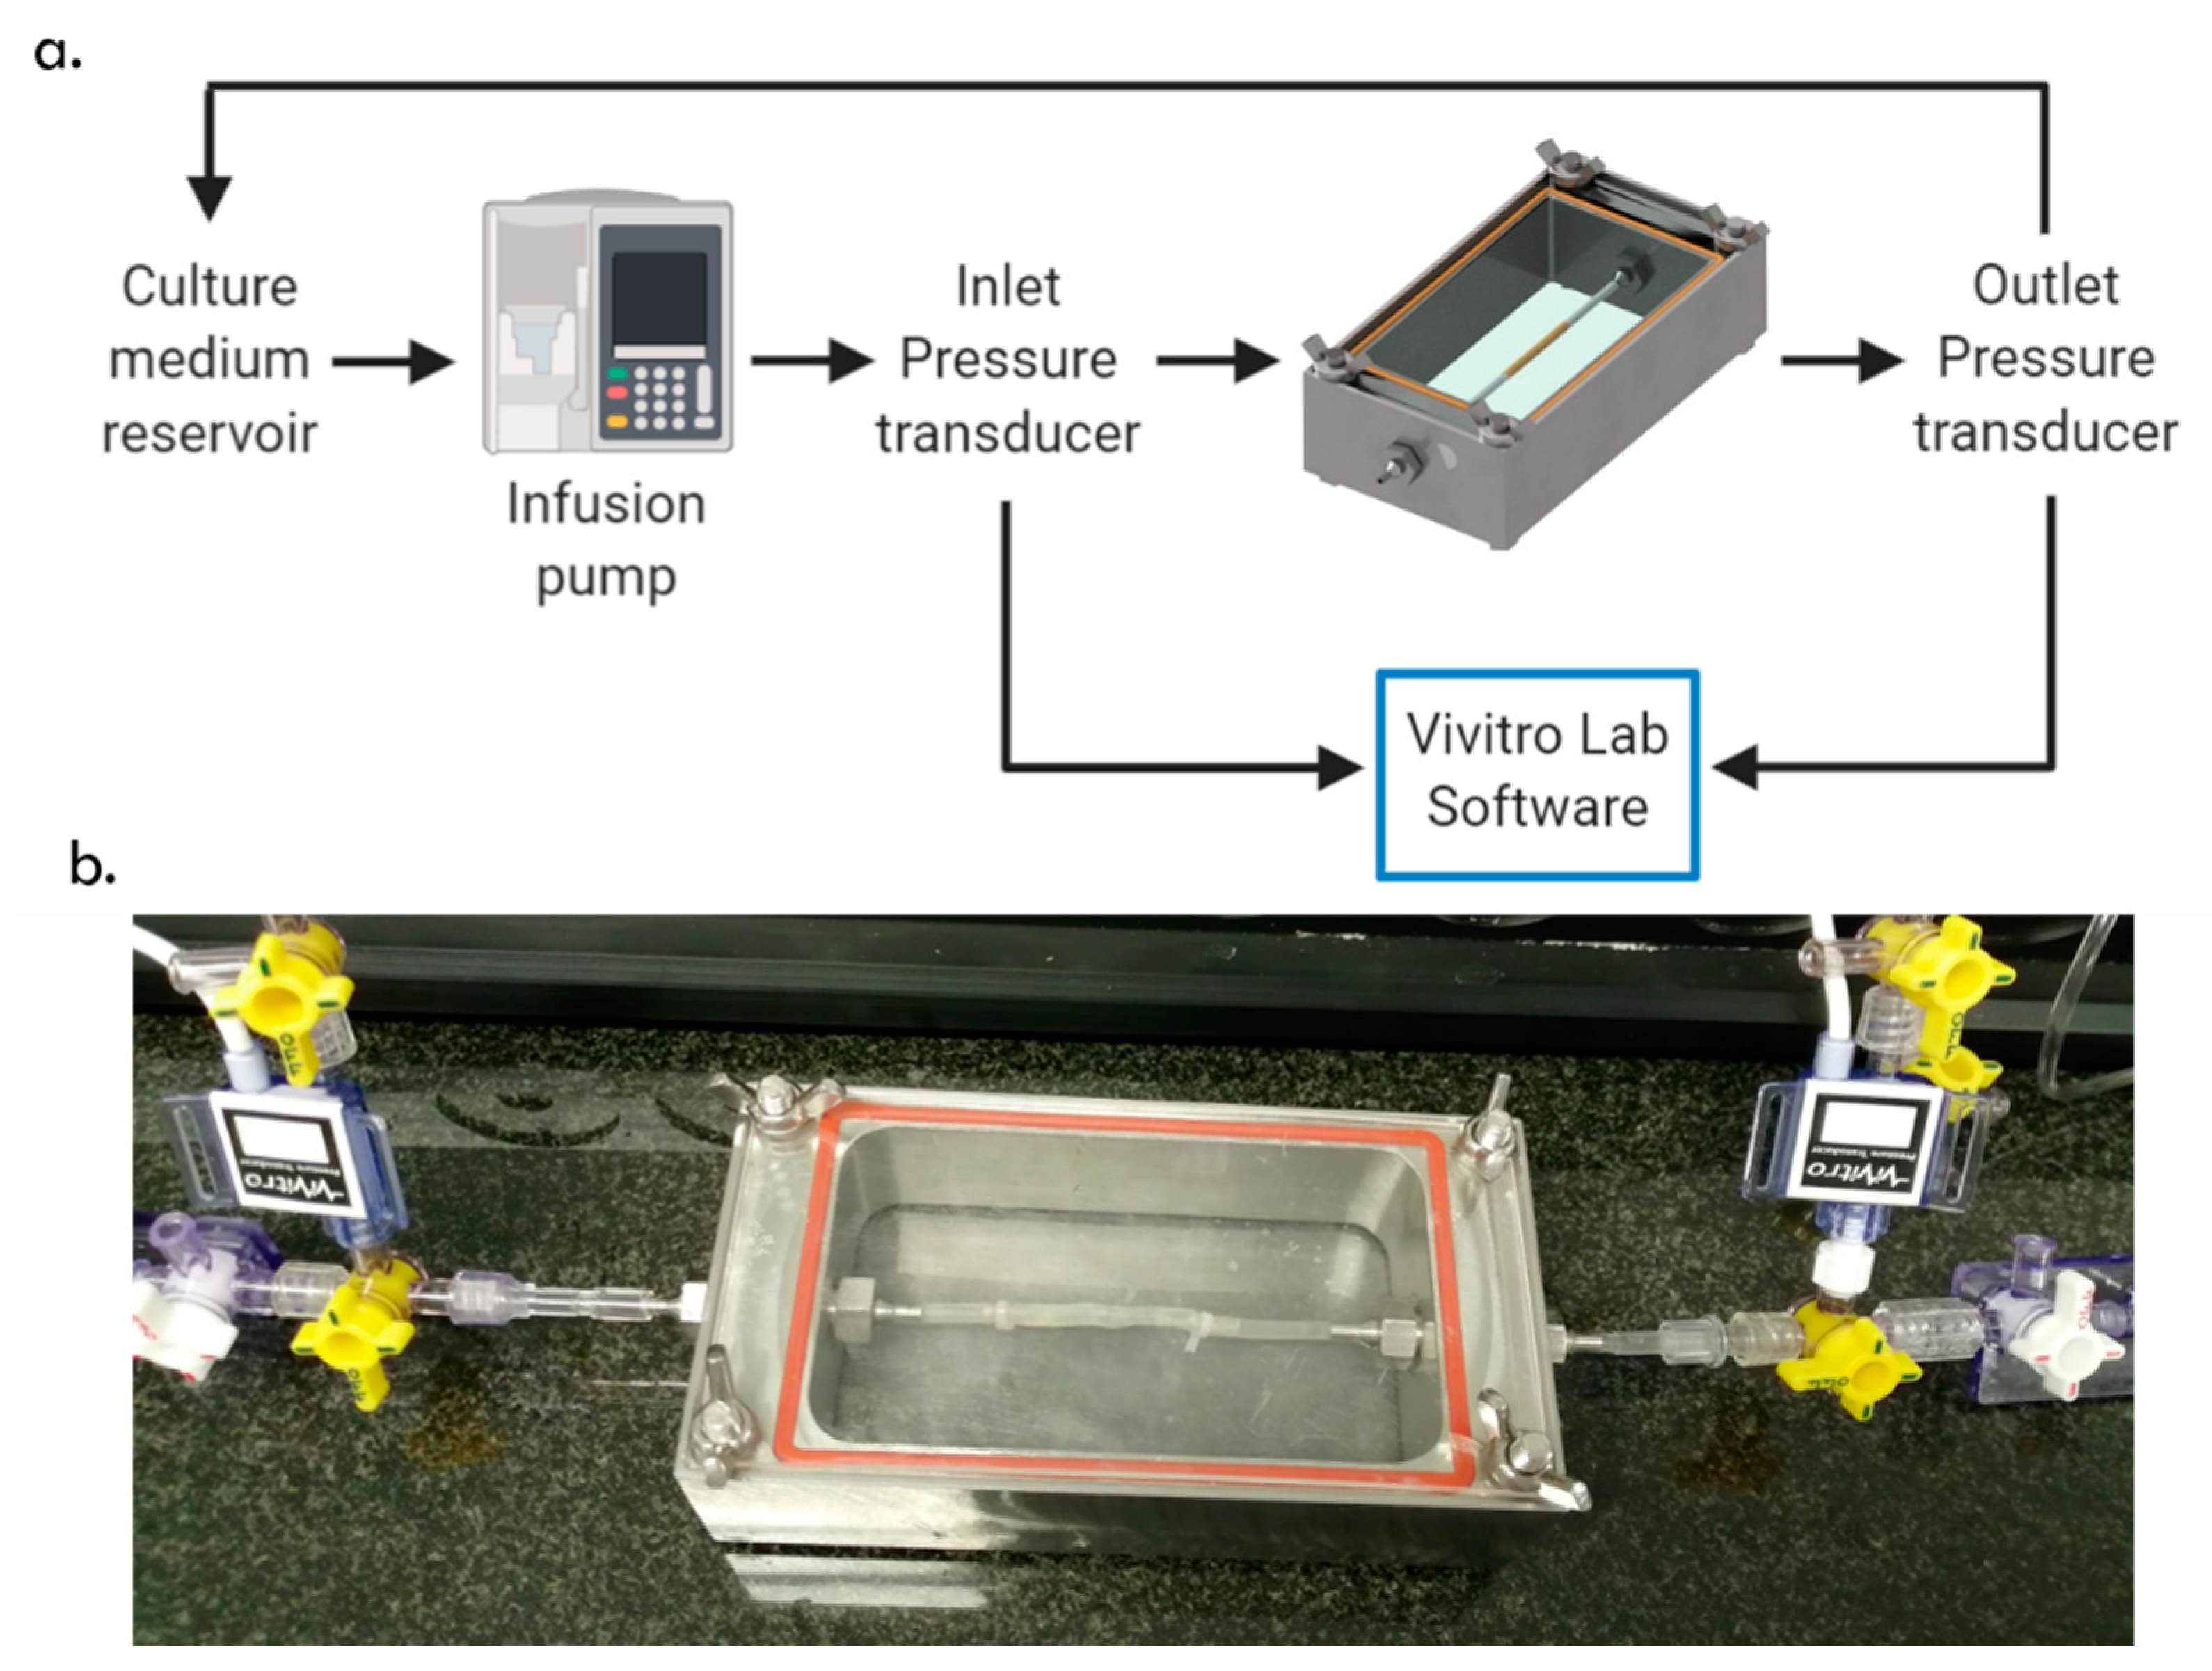
2.2. Experimental Pressure Gradient Measurement

A real-time pressure and waveform analyses were performed in order to measure the pressure gradient along the system at a flow rate of 1200 mL/hr. Two previously calibrated ViVitro pressure transducers (Utah Medical 6069 Pressure Transducers, Midvale, UT, USA) were set upstream and downstream from the main chamber with the aid of Luer Lock connections. Data acquisition was performed with ViVitro Software (ViVitro QCtest from the ViVitro Data Acquisition System (DAS)) at a sample rate of 256 samples/cycle. Figure 4a shows a diagram of the data acquisition set up. A total of eight pulsatile cycles were measured and recorded. The internal diameter of the medical tubing, the four inserts, the internal O-rings, and the vascular graft were measured with a digital caliper (Mitutoyo 500-196-30 Digital Caliper, Kawasaki, Japan) with a resolution of 0.01 mm and a 0–150 mm measurement range. The total distance between the Luer Lock connection of the pressure transducers to the system was recorded as 0.274 m. Both sensors were located at the same height. The experimental pressure gradient was calculated as the average of the difference of two pulsatile cycles. Figure 4b shows the actual configuration for the experimenta, pressure gradient measurement.

2.3. Macroscopic Approach

The flow regime was estimated with the aid of the Reynolds number (Re), which involves the viscosity of a fluid μ, the density of the fluid ρ, the diameter of the pipe D, and the average velocity of the fluid V (see Equation (1)). Depending on the value obtained for Re, the flow regime was classified into laminar, transitional or turbulent. When Re is less than 2 × 10³, the fluid exhibits a laminar behavior [42].
R e = V   D ρ     μ   ,
The pressure drop along the system was estimated according to the Hagen–Poiseuille Equation (2).
Δ P = 8   μ   L   Q     π   R 4   ,
The pressure drop can also be obtained via the Darcy friction factor (f), in which case, laminar flow in a circular pipe is given by Equation (3) [42].
f   = 64 R e     ,
The head loss Equation (4) involves the Darcy friction factor and the length and diameter of the conduit as well as the average velocity of the fluid and gravity. Equation (2) must be equivalent to Equation (4) times the density of the fluid and the gravity.
h f   = f ×   ( L D ) × ( V 2 2 g )     ,
h f × g × ρ   = Δ P   ,
For simplicity, 11 major pressure losses, corresponding to the four medical tubing sections, four insert sections, two O-rings sections, and the SIS-bases vascular graft section were identified along the fluidic device. For the local or minor pressure losses, five sudden contractions and five sudden expansions were included. Figure 5 shows a schematic of a cross-sectional view of the device and the corresponding experimental setup for pressure measurements.
Equation (6) was used to calculate the minor local pressure losses while Equations (7) and (8) helped estimate resistance coefficients K1 and K2, for sudden contractions and expansions, respectively. The parameter β (Equation (9)) is the ratio between the contraction and expansion diameters [4,42].
Δ P m i n o r =   h k × g × ρ = K 1 , 2 × V 2 2 g
K 1 = 2.6 s i n   ( θ 2 )   ( 1 β 2 ) 2 β 4
K 2 = ( 1 β 2 ) 2 β 4
β = d 1 d 2
this approach allowed us to calculate the total pressure gradient that assumes rigid walls, ignores inertial factors, and considers that the vascular graft is tubular with uniform diameter. In addition, it assumes that the diameter in Sections 1 and 5 remains constant despite the presence of internal O-rings between the inserts. Table 1 summarizes the values of the parameters for both the macroscopic and computational approaches (see below for details).

2.4. Computational Fluid Dynamics Approach

A transient CFD model of the fluidic system was implemented in AnsysFluent 2019 (R3 Academic Research) from ANSY, Inc to obtain the wall shear stresses along the system, since these cannot be directly measured experimentally. Additionally, this approach allowed to calculate pressure distribution and the fluid velocity profile. Estimating these variables was crucial to evaluate whether the hemodynamic conditions within the system approach those of native vessels.

2.4.1. Computational Domain

A 2D computational domain was obtained from a cross-sectional cut of the fluidic system between the inlet and the outlet pressure transducers. The geometry was further simplified by assuming axisymmetry. Figure 6 presents the main sections that were included in the geometry of the model. Table 1 summarizes the parameters used for the simulation.

2.4.2. Governing Equations and Boundary Conditions

The model assumes an incompressible and Newtonian fluid with the density and viscosity reported in the Table 1. Additionally, the wall of the vascular graft was considered completely rigid and with a uniform diameter along the different sections.
Pulsatile pressure measurements at the inlet and outlet of the system were processed in MATLAB R2016a to obtain their Discrete Fourier Transform functions. The original Inlet Pressure Signal was reconstructed with the aid of 150 harmonics while the Outlet one required 100. The reconstructed Discrete Fourier Transform (DFT) functions for the Inlet and Outlet Pressure are given by the set of Equations in (10).
Pin, out (t)) = Ao in, out + (Cn in, out × cos((ω × t × n)+(Өin, out)))
where Ao corresponded to 7926.2 Pa for the Inlet signal and 7616.9 Pa for the Outlet signal. Cn is a vector with 150 and 100 harmonics, for Inlet and Outlet pressure signals, respectively. ω was calculated as 0.8091 rad/s (average value from the eight measured cycles), and Ө is a vector of one 150 and 100 angles for the harmonic equations of Inlet and Outlet pressure signals, respectively [43]. The MATLAB script and values of the Cn vectors and Ө for the inlet and outlet pressure functions are available in Supplementary material (Table S1). A C script was written to incorporate this set of equations into ANSYS Fluent as User Defined Functions (UDFs) for the definition of the pressure distribution at the inlet and outlet boundaries. The system was initialized with the Hybrid method, which solves Laplace’s equation to establish the velocity and pressure fields through interpolation. The simulation was auto-saved each five iterations. A time step of 0.003 s was implemented for a total simulation time of 1.5 s.
The conservation of mass (Equation (11)) and linear momentum (Equation (12)) were used to model the fluid flow in ANSYS. In cylindrical coordinates, Equations (11) and (12) became those shown in (13). A Non-slip condition was imposed on the walls of the system.
· V = 0   ( C o n t i n u i t y   E q u a t i o n )
ρ ( V t + ( V · ) V ) = p + μ 2 V   ( C o n s e r v a t i o n   o f   M o m e n t u m )
1 r ( r u r ) r + u z z = 0 ρ ( u r t + v r u r r + v z u r z ) = P z + μ ( 1 r r ( r u r r ) u r r 2 + 2 u r z 2 ) ρ ( u z t + u r u z r + u z u z z ) = P z + μ ( 1 r r ( r u z r ) + 2 u z z 2 )

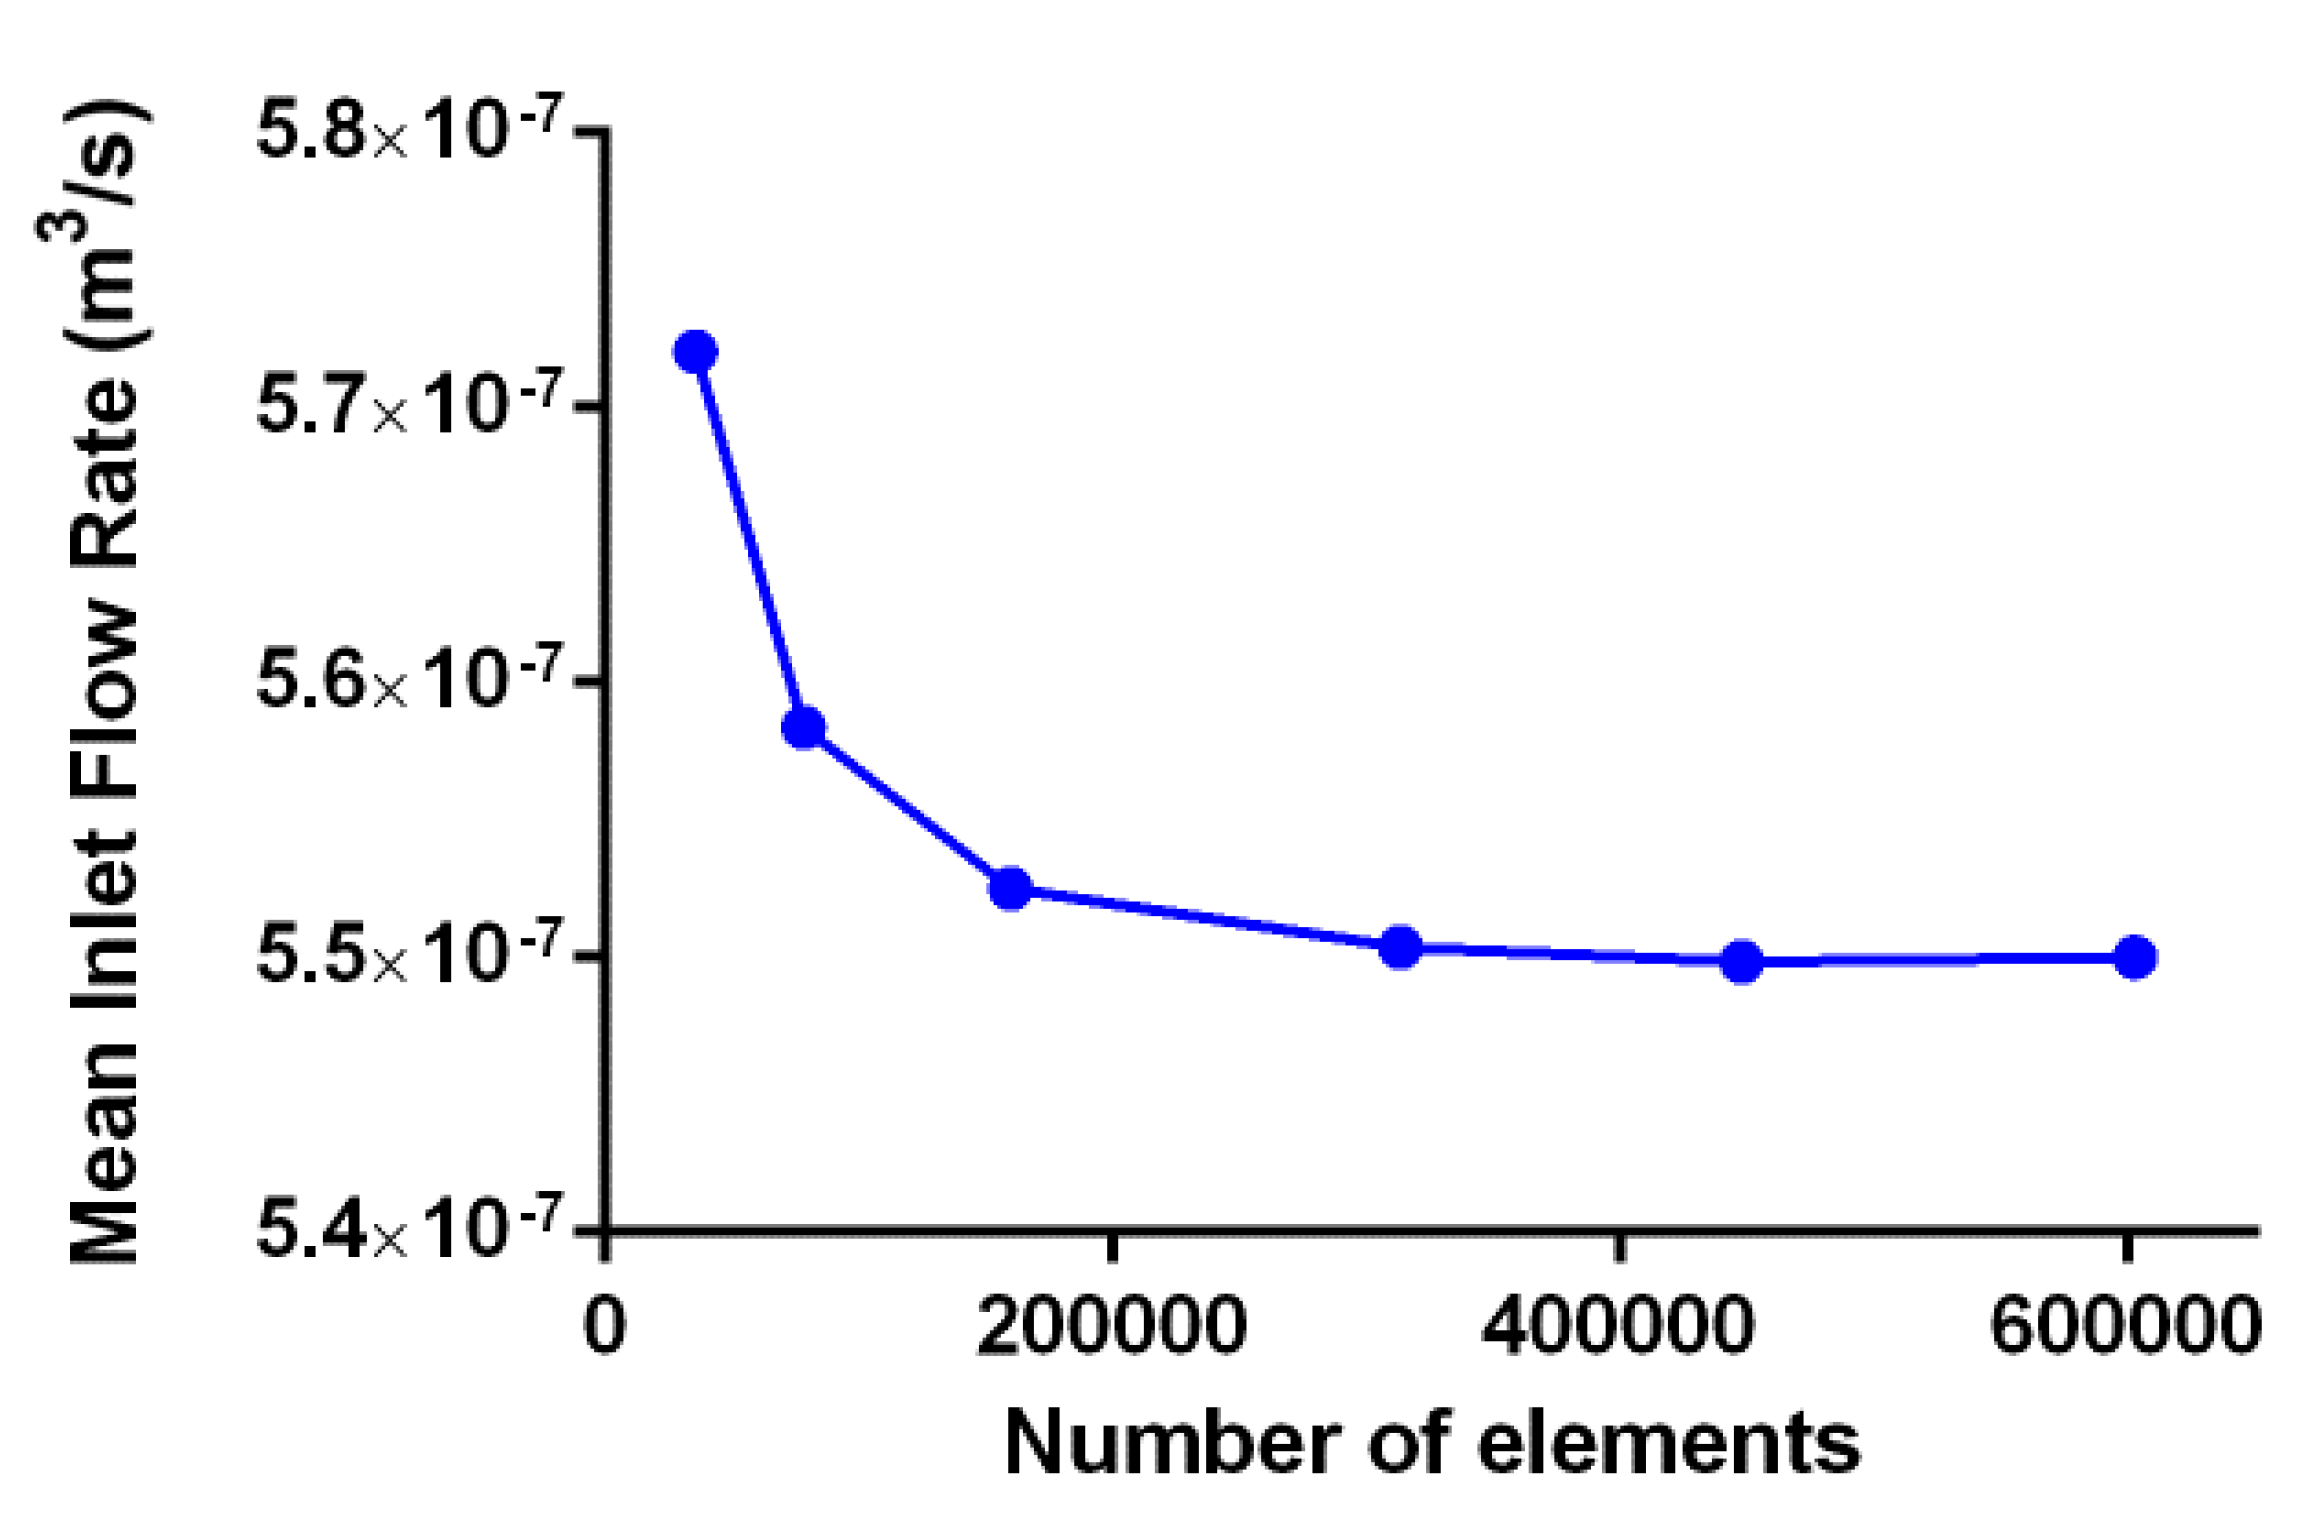
2.4.3. Mesh Convergence

The computational domain was discretized with the aid of the Mapped Face Meshing option available in the ANSYS meshing software. The edges of obtained elements were refined with the option Sizing, and the number of divisions was proportional to an element size of 5 × 10⁻⁵ m. Regarding the mesh quality, the skewness for most of the elements (at least 80%) was close to zero, which is an indication of adequate quality. Meshing led to a total of 602,802 elements and 309,092 nodes for the computational domain.
Mesh convergence analyses were conducted for six different mesh configurations. From the total simulation time, intervals between 0.57 s and 0.705 s and between 0.72 s and 1.005 s were chosen to study the upward stage (phase 1) and the downward stage (phase 2), respectively. The upward stage refers to incremental pressure, while the downward stage refers to the decrease in pressure, when compared to the initial and final time step for each phase. Figure 7 shows the selected time intervals for phase 1 and phase 2. From the total pressure distribution, the downward stage can be related to a quasi-static behavior, because it is almost two times longer than the upward stage. This quasi-static phase was compared with the theoretical analysis due to its static assumption. The evaluated variable was the mean inlet flow rate for each phase and the total upward and downward cycle. The DFT rebuilt signals at this time reproduced accurately two cycles of the original experimental pressure signals. Table 2 summarizes the number and size of the elements for mesh convergence analysis. The convergence criterion was that upon increasing the number of elements, the mean flow rate remained within 0.05% of the previous value as estimated by the relative error.

2.4.4. Model Validation

A verification of the flow rate displayed by the pump was performed. Flow rates of 1200 mL/h, 500 mL/h, 200 mL/h, and 100 mL/h were set in the electronically controlled infusion pump. These flow rates were verified by measuring volumes collected with a graduated cylinder during a defined period (precision of 0.5 mL and one second).
The computational model was validated by the comparison between the experimental flow rate value displayed by the pump and the one estimated computationally. The analysis was performed for each phase according to the upward and downward pressure signal division for a chosen total time interval between 0.57 s and 1.005 s. The average flow rate in the time interval between pulses was analyzed due to the rigid wall assumption of the computational model. The computational average flow rate for each time interval was calculated from the instantaneous mass flow rate values given by the computational model divided by the density of the fluid (1000 kg/m3). A time step of 0.015 s was used on each time interval, for a total of 30 instantaneous mass flow rate values for the first-time interval. In the case of the time interval between pulses, a total of 21 instantaneous mass flow rate values were collected. The mesh 6 of Table 2 was used for all model validation calculations.

2.5. Cell Culture Conditions

Human Umbilical vein endothelial cells (HUVEC cells CC 2519 Lonza, Basel, Switzerland) between passages 2–6 were cultured in T75 flasks until 70–80% confluence was reached, and the medium was changed every 3 days. These cell cultures were maintained with Endothelial cell culture medium with supplements (EBMTM-2 Basal Medium (CC-3156) and EGMTM-2 SingleQuotsTM Supplement Pack (CC-4176); Lonza) that contain 2% FBS and 0.1% VEGF (vascular endothelial growth factor) for rapid proliferation supplemented. The cultures were maintained at 37 °C in a humidified 5% CO2 atmosphere.

2.6. Cytotoxicity Evaluation

Endothelial cell culture medium with supplements (EBMTM-2 Basal Medium (CC-3156) and EGMTM-2 SingleQuotsTM Supplement Pack (CC-4176); Lonza) was circulated through the system for 3 days at 37 °C inside the CO2 incubator. Circulated medium (CM) samples were taken and stored at −80 °C until further use. CM samples obtained were the equivalent to extracts preparation and were used to determine the biocompatibility of the assembly via an indirect cytotoxicity MTT colorimetric assay (3-(4,5-dimethylthiazol-2-yl)-2,5-diphe-nyltetrazolium bromide) in accordance to the ISO10993 standard. HUVEC cells were seeded onto a 96-well plate (10,000 cells/well) with EGM-2 medium. After 24 h, cells were treated with 100 µL of circulated medium, uncirculated medium (negative control) and 10% DMSO (positive control) and incubated for 24 h at 37 °C, 5%CO2 and 95% humidity. Briefly, the supernatants were removed from the wells, and 10 μL of MTT (Sigma) (5 mg/mL in PBS) was added to each well. The plates were incubated for 2 h at 37 °C, and 70 μL of DMSO was added to the wells to dissolve de MTT crystals. Absorbance data was measured in a spectrophotometer (Thermo ScientificTM, MultiskanTM FC, Waltham, MA, USA) at 595 nm. All samples were assayed in triplicate. The assay results are presented as mean ± standard deviation. To evaluate the significance of differences (p < 0.05), a one-way ANOVA was performed followed by a Tukey test on GraphPad Prism.

2.7. Proof of Concept: Human Umbilical Vein Endothelial Cells Culture

HUVEC cells were cultured on the lumen of a SIS-based vascular graft under the dynamical conditions provided by the fluidic system. Prior to culture, a sterilization protocol for the system components was followed, which complied with the ISO 11737-1: 2018 standard.
Cell densities of 300,000 cells per milliliter were seeded on the lumen of a SIS-based vascular graft with internal diameter of 3 mm and 3 cm in length. Conduits were fabricated as reported previously [10]. The fluidic system was attached to the agitator and placed in a CO2 cell incubator at 37 °C, 5%CO2 and 95% humidity. The system was allowed to rotate overnight at an alternating (clockwise and counterclockwise) angular velocity of 11.8 RPM to promote homogeneous cell deposition and proliferation along the SIS-based vascular graft, without affecting cell viability [44,45,46,47]. Subsequently, medium was infused to the system at a pulsatile flow rate of 1200 mL/h with the aid of Baxter Colleague Volumetric Infusion Pump (catalogue number 2M8151K, Baxter Healthcare Corporation, Deerfield, IL, USA). This flow rate corresponds to Infusion pump maximum flow rate and it provided physiological-like wall shear stresses for small diameter arteries, as stated later. In addition, such flow rate level agrees to the range reported for previous perfusion bioreactors [48,49]. Cell seeding proceeded for at least 3 days of operation. Cell adhesion was determined via SEM (JEOL, model JSM 6490-LV, voltage of 10 kV).

3. Results

3.1. Experimental Pressure Gradient Measurements

Figure 8 shows the experimental inlet and outlet pressure measurements for a total time of 1.5 s at a flow rate of 1200 mL/h (3.33 × 10⁻⁷ m3/s). The total measured pressure gradient between the inlet and outlet of the system was 320.43 Pa.

3.2. Macroscopic Approach

Table 3 summarizes the major pressure losses for each of the sections of the device, while the minor pressure losses are shown in Table 4 for a flow rate of 3.333 × 10⁻⁷ m3/s.
The relative error between the pressure gradient calculated via the macroscopic approach (301.90Pa) and that obtained experimentally (320.43Pa) was of 5.79%.

3.3. Computational Fluid Dynamics Approach

3.3.1. Mesh Convergence Analysis

Figure 9 shows the mesh convergence analysis for the Mean Inlet Flow Rate for six different mesh configurations. Table 5 presents the absolute relative error for the mean inlet flow rate as a function of the number elements for the evaluated mesh configurations. According to Figure 9 and Table 5, the convergence criteria was accomplished with mesh 6.

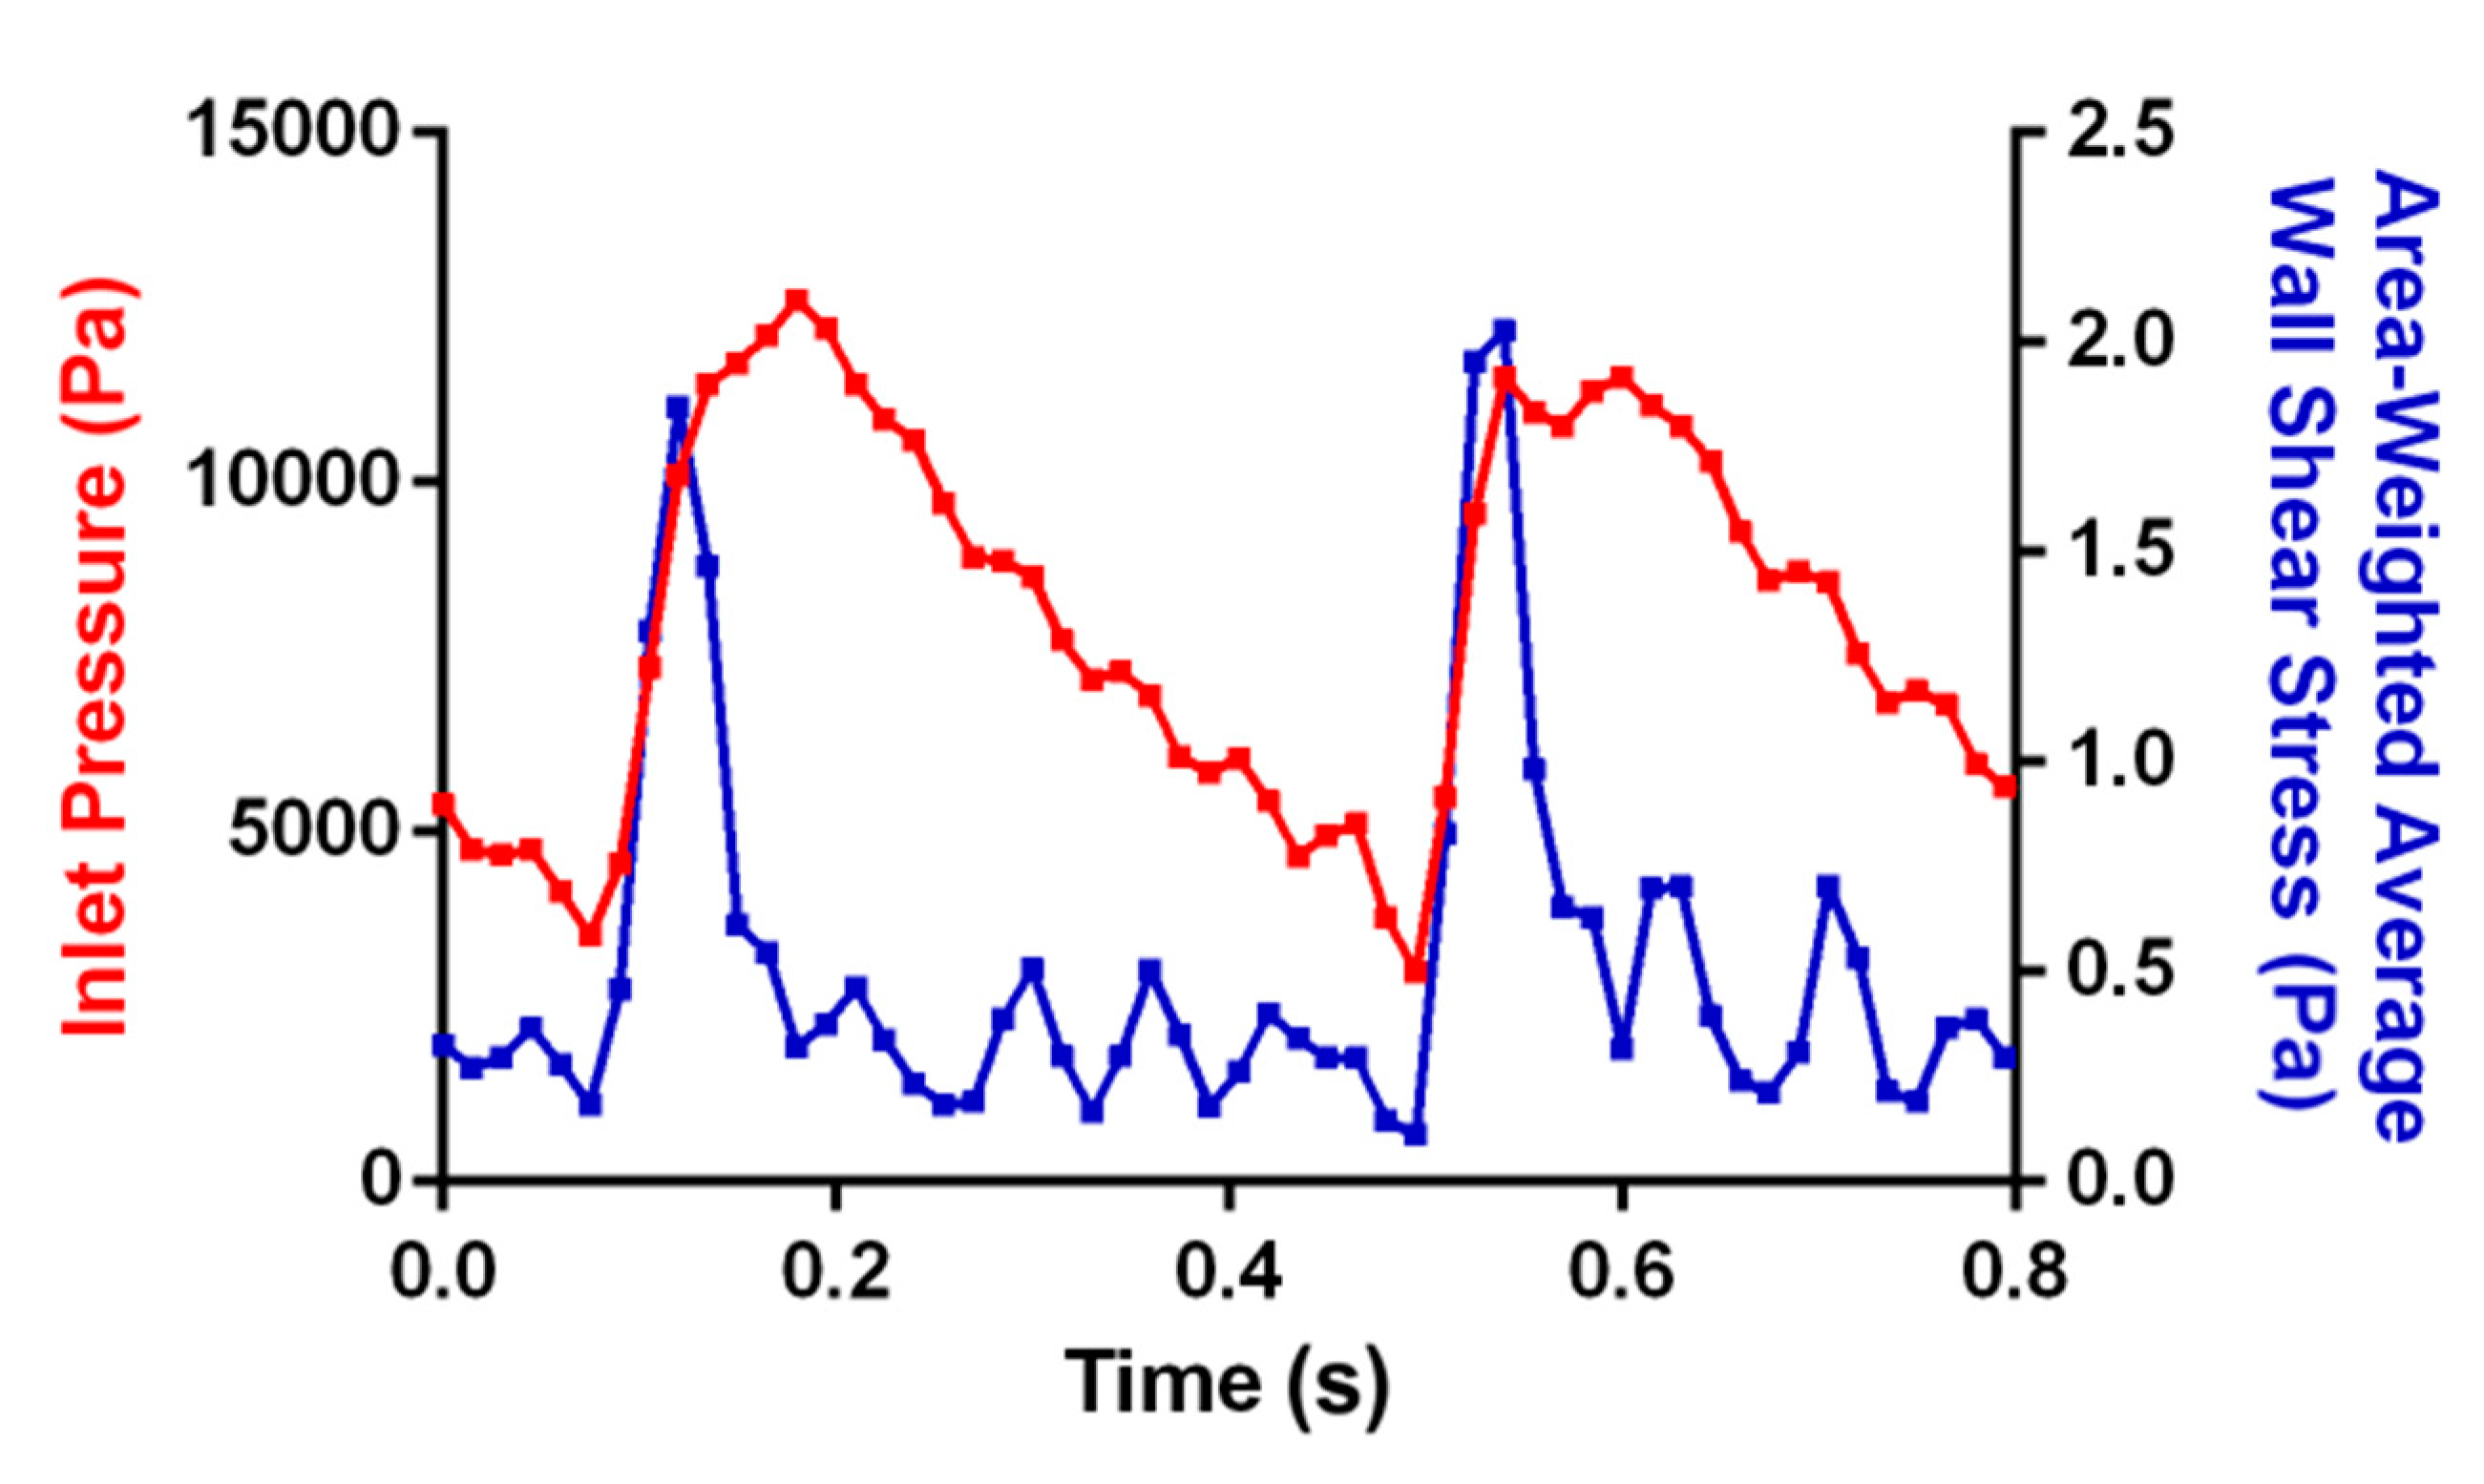
3.3.2. Reconstructed Discrete Fourier Transform Signals for Inlet and Outlet Pressures

Figure 10 and Figure 11 show the reconstructed DFT signals for the Inlet and Outlet pressure measurements. Four representative harmonics are shown to qualitatively illustrate the goodness of fit for both signals as the number of harmonics was increased.

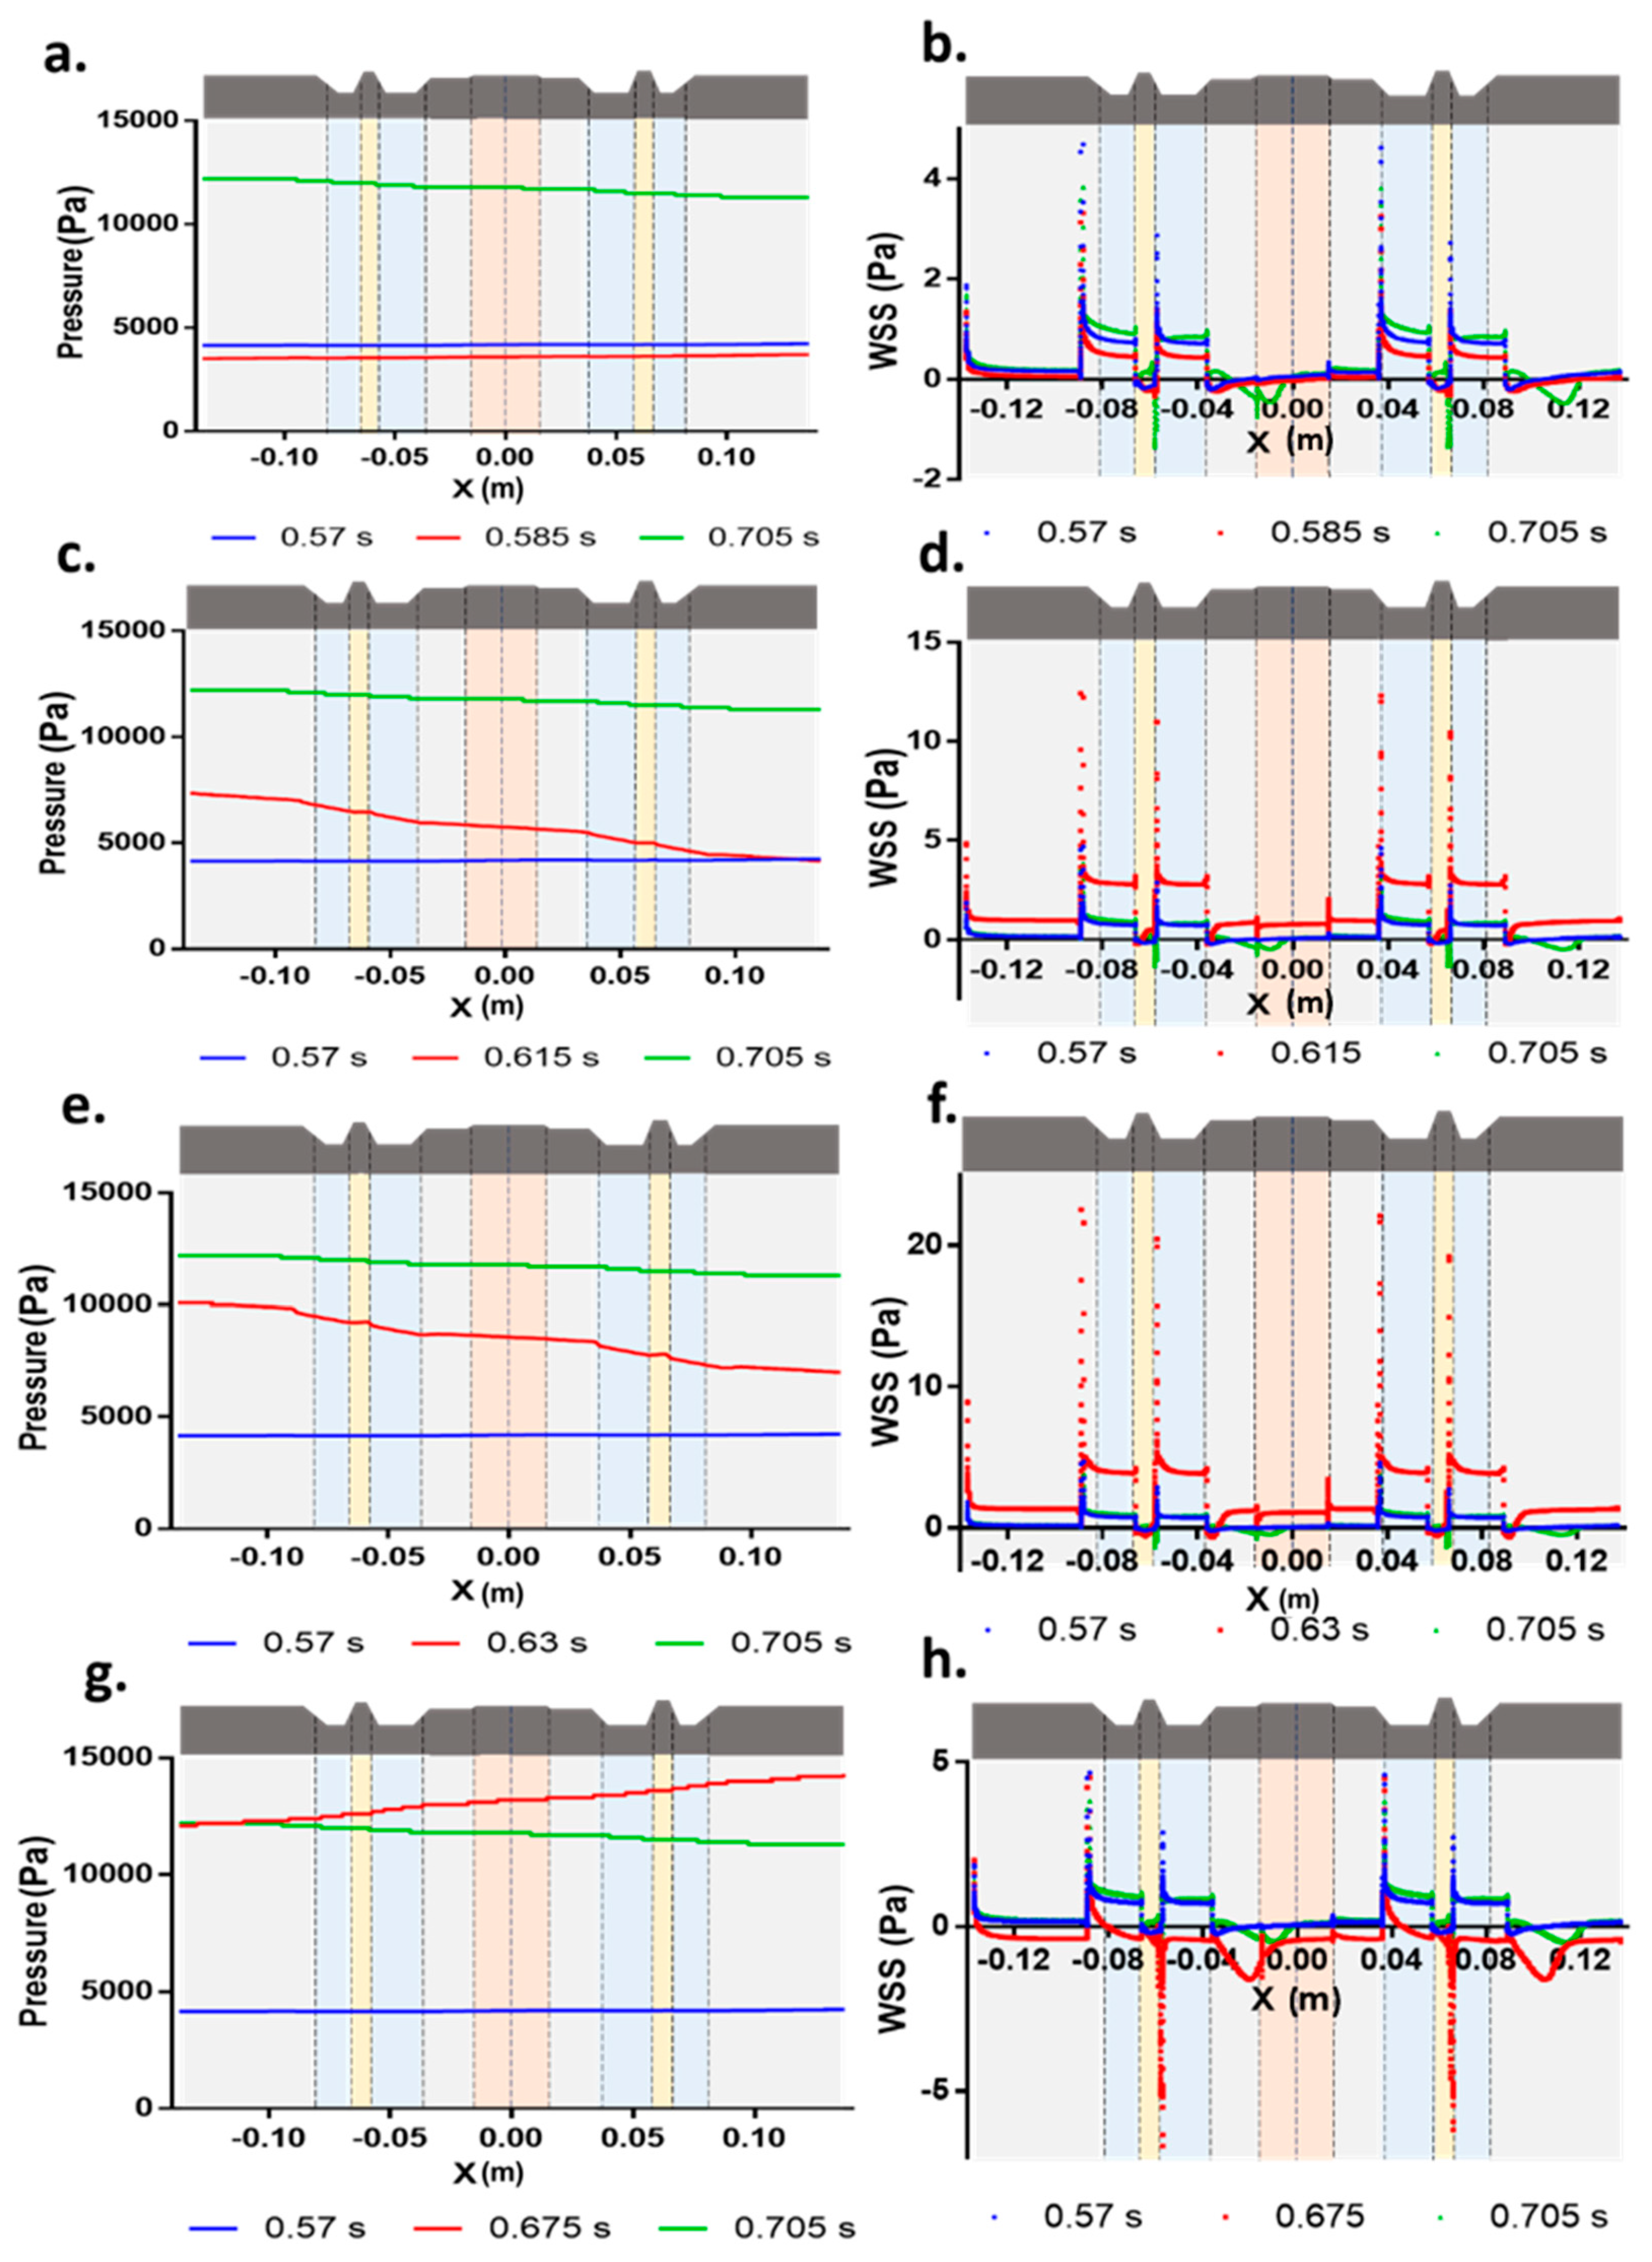
3.3.3. Pressure, Velocity and Wall Shear Stress Distribution

Figure 12 and Figure 13 show pressure and wall shear stress distributions along the computational domain for four instantaneous times on phases 1 and 2, respectively. Figure 14 shows the Area-Weighted Average Wall shear stress. Figure 15 presents the Inlet Flow Rate, and the Computational Inlet Pressure as a function of the time.

3.3.4. Local Velocity Profiles at Tissue-Engineered Vascular Graft Region

Figure 16 and Figure 17 show the local behavior of velocity profiles along the SIS-based vascular graft region for three selected time steps at phase I (upward stage) and two selected time steps at phase II (downward stage).

3.3.5. Model Validation

Table 6 summarizes the experimental validation of the flow rate reported by the infusion pump display.
In addition, Table 7 presents the average computational inlet flow rate and the relative errors for the two phases of analysis (upward and downward stages). Relative errors were calculated for the difference between the average computational flow rates for each phase and the experimental flow rate given by the pump (3.33 × 10⁻⁷ m3/s).

3.4. Cytotoxicity Evaluation

The MTT cytotoxicity results after exposure of HUVEC cells to CM (circulated medium) showed non-detrimental effect on cells as evidenced by a cell viability above 90%, as shown in Figure 18. There was no statistically significant difference between CM and UM (uncirculated medium) as a negative control.

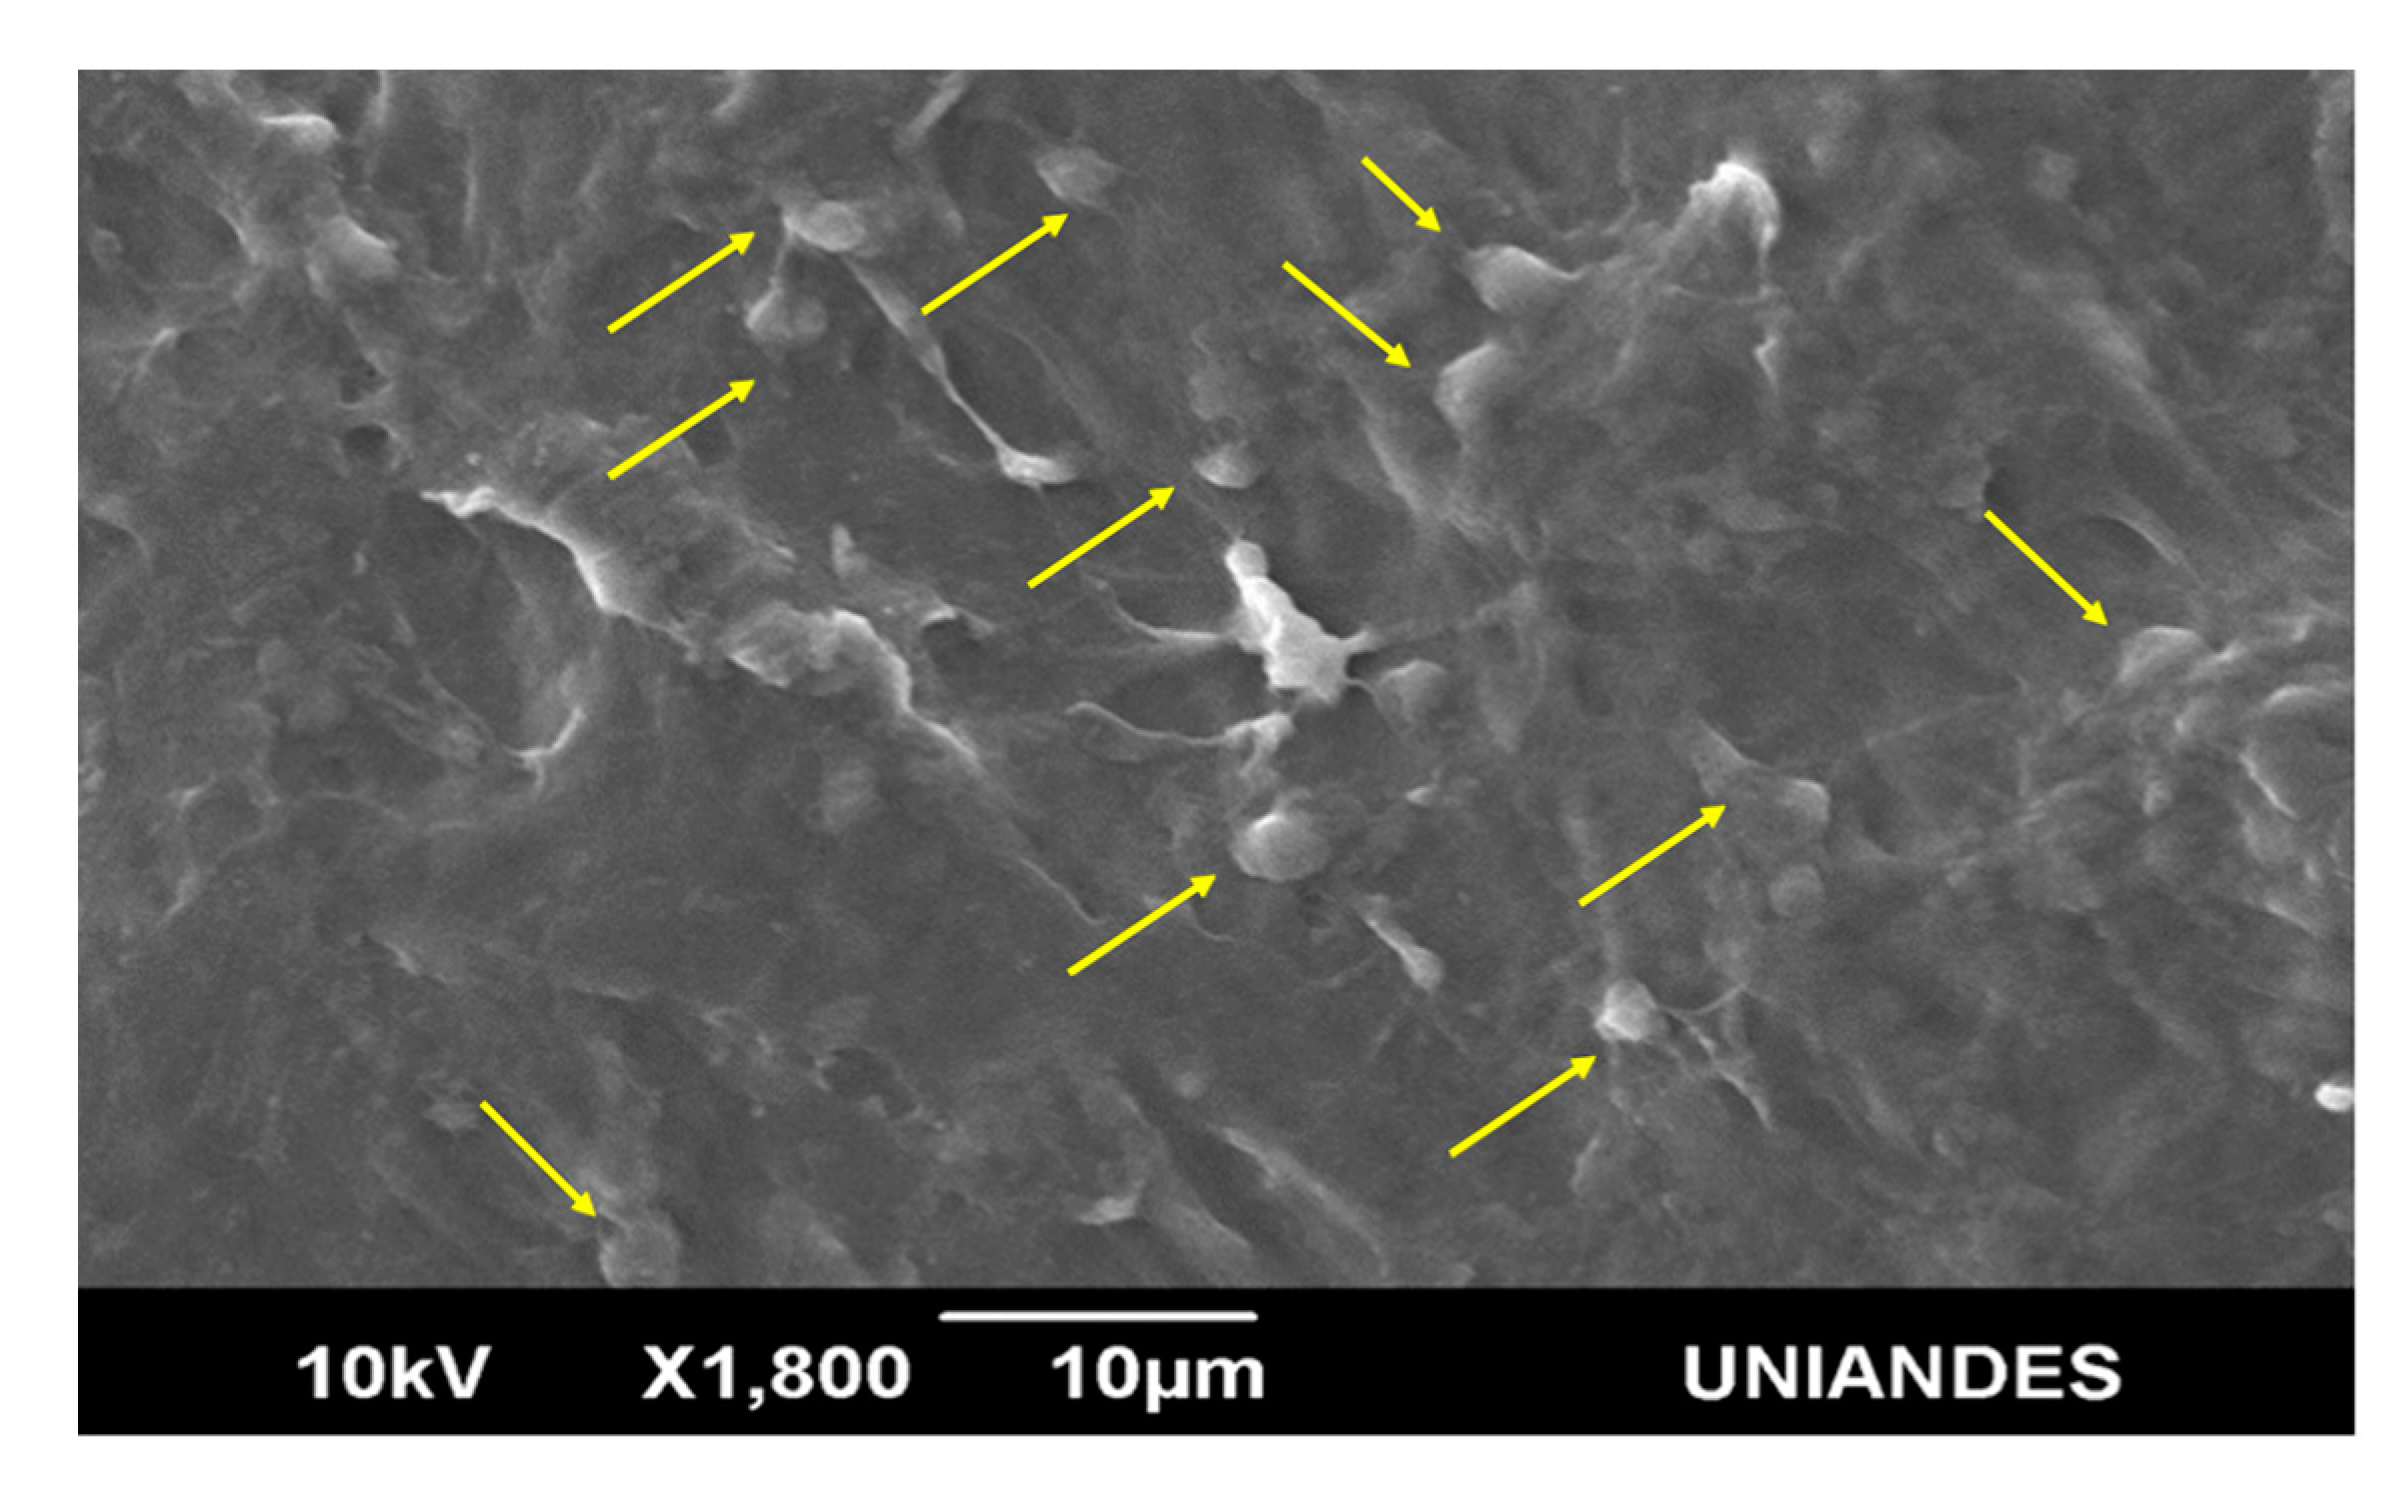
3.5. Proof of Concept: Human Umbilical Vein Endothelial Cell Culture

After seeding and culturing HUVECs cells on tubular SIS-based vascular grafts, cell attachment on the lumen tubular surface was traced via Scanning Electron Microscopy (SEM). Figure 19 shows the cell attachment to the tubular lumen surface and filopodia formation after exposure to the dynamical conditions of the fluidic system. An average cell attachment per area of 4.06 × 10⁵ (±1.65 × 10⁵) cells/cm2 (n = 3) was obtained. The initial cell density provided an average of 7.7 × 10⁴ cells/graft, thus we obtained an average cell proliferation of 573% (±233%).

4. Discussion

The designed fluidic system allowed us to effectively seed HUVEC cells on the lumen of SIS-based vascular grafts. This indicates that the flow regimes, shear stress conditions and cytotoxicity levels achieved by the system might approach those observed in vivo. Uniform cell deposition on the lumen of the graft suggests that the agitator system provided the optimal mixing conditions for unimpeded interfacial transfer of nutrients. With the purpose of providing a more robust mechanistic understanding of the fluid dynamics within the system, we conducted macroscopic and microscopic analyses. For the former, we made use of analytical and empirical expressions to estimate mechanical energy losses, while for the latter we conducted CFD simulations in ANSYS®. The macroscopic analysis allowed us to calculate laminar Reynolds numbers (Table 3) similar to those previously reported for vein grafts (650 and 200 for 429 mL/min and 132 mL/min, respectively [7]) and canine models (Re = 260) [50]. Also, with this approach, we calculated a pressure gradient of 301.90 Pa (Table 3 and Table 4), which agrees well with that estimated experimentally as evidenced by an error of 5.8%. Pulsatile pressure changes were successfully rebuilt via harmonics (Figure 10 and Figure 11) to match experimental values. While the inlet pressure function was fully recreated, the outlet one exhibited a time offset and lower maximum pressure values (systolic values) with respect to the experimental data. The subsequent CFD analysis (on an optimized mesh) allowed us to calculate instantaneous pressure and wall shear stress distribution along the computational domain (Figure 12 and Figure 13). The pressure distribution along the whole geometry in the upward stage (Figure 12) gradually displaced to higher values with punctual slope variations. For the numerical results, with a time step of 0.015 s, half the pressure signals along the entire geometry had positive slopes, which were associated with negative lags on the related wall shear stress distributions. The negative slope pressure signals along the global geometry were associated with higher wall shear stress values for the same time. Even for large positive slopes, the wall shear stress distribution showed negative values. This suggests a possible flow separation and instantaneous regions of recirculation. The pressure distribution along the whole geometry in the downward stage (Figure 13) gradually displaced to lower values with punctual slope variations. For measurements with a time step of 0.015 s, eight of the pressure distributions had positive slopes, which were associated for most of the cases with negative values on the wall shear stress distribution. Ten negative slope pressure distributions along the global geometry were associated in most of the cases with higher wall shear stress values for the same time. Pulsatile flow is thought to be responsible for such differences and might even induce backpressure due to inversed gradients (i.e., larger instantaneous outlet pressure than instantaneous inlet pressure).
Accordingly, an appropriate choice of diameter is a critical design variable as it directly impacts the interplay of biomechanics parameters. The difference between the estimates obtained in silico and experimentally can be mainly attributed to the model assumptions where micro-architecture, roughness, mismatches in the graft-tubing connections, and compliance of the wall of the graft were disregarded. In vivo, however, these features play a significant role as has been demonstrated by the altered expression of cytokines of M1 and M2 upon changes in the micro-topography and the anisotropy of the fibers in the lumen of the vascular graft [33].
The fluidic system provides the conditions for a laminar flow regime and wall shear stress values that approached a maximum of about 24 Pa (Figure 14). The largest walls shear stresses values were obtained at the contraction or expansion regions as it was expected from the theoretical approach (Table 3 and Table 4). In the vascular graft region, wall shear stress values remained below 1 Pa. Such conditions have been thought to be responsible for promoting oxidative homeostasis of EC [35]. As a result, a signal cascade is triggered where reactive oxygen species decrease, and anti-inflammatory molecules are secreted. This leads to a regeneration pathway after implantation that is mediated by the presence of the phenotype 2 of the macrophages [36]. For comparison, we have included a summary of wall shear stress values for arteries and veins under physiological and in vitro conditions as well as those obtained with the aid of CFD models (Table 8). In general, under normal flow conditions, arteries undergo mean wall shear stress values between 1–50 dynes/cm2 (0.1 Pa to 5 Pa) [8,23,27]. Our results, therefore, seem to indicate that hemodynamic conditions provided by our fluidic system are sufficient to study the response of grafts under mechanotransduction conditions close to those found in vivo. Moreover, the system can be potentially used to precondition EC-seeded TEVGs before their implantation.
Under in vitro conditions, endothelial cells such as HUVEC cannot tolerate shear stress values higher than 60 Pa at a flow rate of 150 mL/min [27]. Maximum wall shear stress value at the interface between Sections 1 and 2 (medical tubing and insert) of approximately 27 Pa. Additionally, high shear stress values were also observed at the intersection of O-rings and insert sections (2–3 and 3–4) and the medical tubing and the insert (4–5). These results indicate that special care must be taken at the intersections when designing and assembling fluidic devices. Although the vascular graft section itself showed low shear stresses, the adjacent sections or accessories led to an increase in the wall shear stress profile of the whole fluidic system [8,15,23,27]. Figure 14 shows that the area-weighted average wall shear stress ranges from 0.111 Pa to 2.027 Pa. The obtained area-weighted wall shear stress values and the wall shear stress time average values along the vascular graft and the accessories regions agree well with those reported for HUVEC cells on small diameter blood vessel at the clinical, in vitro and CFD levels [27,51]. The dynamic behavior of the fluid is considered in the pulsatile pressure functions that are imposed as boundary conditions of the geometry. As indicated in Figure 14, the variability of the wall shear stress in the time is correlated with the pulsatile behavior of the pressure, with highest values at the larger pressure gradients of the function.
Even though the obtained wall shear stress values over the SIS-based vascular graft are low, the laminar flow conditions of the system are optimal for promoting cell viability and differentiation [28]. This is in line with previous reports that demonstrated that a low shear stress environment is advantageous during the initial phase of cell seeding as it favors cell anchorage [16]. Moreover, laminar shear stress values have been associated with a higher expression level of EC marker proteins such as CD31, CD144, eNOS, and vWF. These proteins promote the endothelialization processes needed to repair blood vessels as has been demonstrated in mice models [28]. However, at a later phase, exposure to a higher range of shear stress values is adequate to provide the biomechanical stimuli necessary to study cardiovascular diseases with the aid of our device [16]. In this regard, Figure 14 confirms a fluctuating temporal gradient of wall shear stress values within the vascular grafts section of the fluidic system.
Table 6 shows that the flow displayed by the infusion system agrees well with that obtained experimentally, which confirmed that the instrument was properly calibrated. The computationally estimated mean inlet flow rate for both phases (upward and downward stages) presents an error of 36.52% compared to the experimental flow rate value (Figure 15). For the first phase, the obtained error was of 54.32% while for the second phase (quasi-static) the difference was reduced to 21.17% (Table 7). These error values can be mainly attributed to the assumption of rigid wall. In this regard, models that have included compliant walls reported a decrease in flow rates of up to 30% [37], compared with those under the assumption of rigid walls. However, it is important to note that the model agrees well with previously reported non-compliant CFD models of blood vessels [37]. Figure 15 shows that, in time, the flow rate oscillates with maxima for each pulse cycle (i.e., where the inlet pressure values reach maxima).
In Figure 16a, there is evidently a decrease on the maximum velocity from x = −15 mm (inlet of the vascular graft zone) to x = 15 mm (outlet of the vascular graft zone) due to flow expansion along the vascular graft. An inflection point is presented at the inlet of the local region of analysis as evidenced by the negative velocity values found. These negative velocity values are correlated with negative wall shear stress values at the inlet of the vascular graft as shown in Figure 12b. At t = 0.585 s, the velocity profiles tend to a parabolic behavior when moving away from the vascular graft inlet. At t = 0.63 s (Figure 16b), the velocity profiles show a transition behavior with positive velocity values between the parabolic tendency of t = 0.585 s and the “S-shaped” velocity profiles showed along the vascular graft at t = 0.675 s. In addition, maximum velocities about doubled those found at t = 0.585s due to higher-pressure gradients during this period compared to the previous one, i.e., positive slope on the upward stage in the inlet pressure vs. the time signal. A slower transition to smaller maximum velocity values is observed at the outlet of the vascular graft region compared with the inlet (x = −15 mm) to the middle portion (x = 0 mm). The S-shaped behavior found in Figure 16c decreases along the vascular graft region with the lower maximum velocity values found at the outlet of the local region of analysis, as it is expected from phase I or upward stage. There are zones of high boundary layer separation and negative shear stress values (Figure 12h) as evidenced by the negative velocity values all along the vascular graft wall. An inflection point was identified at a location of maximum shear stress values in the fluid. The S-shaped behavior of velocity profiles can be attributed to a relevant influence of inertial terms at this time step compared to the dominance of pressure gradient and viscous forces for the more parabolic-shaped velocity profiles at t = 0.585 s.
At t = 0.855 s, parabolic-shaped velocity profiles behavior with positive values are dominant (Figure 16d), which suggests that pressure gradient and viscous forces are prevalent during this time step. The maximum velocity values initially decrease from the inlet to the middle portion of the vascular graft zone and then increase at the second middle portion of the vascular graft, contrary to the tendency observed for the first phase. Figure 16e shows a small boundary layer separation at t = 0.99 s, and the velocity profiles are similar to those found at t = 0.585 s (Figure 16a). This can be explained by the lower inlet pressure values observed at this time step as the pressure cycle restarts.
Figure 17 shows the velocity profiles for the times of analysis at phases I and II at the middle portion of the vascular graft region (x = 0 mm). At this location, the flow appeared significantly developed. S-shaped velocity profiles were identified at 0.675 s where the inertial forces are predominant. At t = 0.63 s, we observed a transitional shape between the parabolic and the S-shaped for the velocity profile. In contrast, at t = 0.585 s and t = 0.99 s, the velocity profiles have a parabolic shape, thereby demonstrating a cyclical behavior. Additionally, due to a steeper slope at phase I (upward stage), greater maximum velocity differences between time steps were found at this phase when compared to those at phase II (downward stage) for the same time interval.
From the previous analysis, it is clear that determining the velocity profile at the anastomoses is critical to evaluate the performance of the vascular grafts because shear stress values show significant changes therein. In this regard, in the clinical practice it is desirable to avoid the strong flow perturbations derived from diameter mismatches between the native adjacent vessels and the vascular graft. This might also be promoted by the suture quality at these critical junctures. Recent reports have demonstrated that geometrical aspects such as the diameter differences and the pulsatile pressure might have a significant impact on the velocity profiles and shear stresses distribution along the geometry. Consequently, these parameters might alter the endothelialization processes on the TEVGs [36,57,58,59].
The calculated shear stress values and velocity profiles suggest that our fluidic system provides the conditions to potentially guarantee cell proliferation, particularly of EC cells. However, additional assays must be performed to correlate the direct effect of the range of wall shear stress values produced on the lumen of the SIS-based vascular graft over the EC viability, adhesion, division, and monolayer formation [10]. We hypothesize that an increase in the angular velocities and the flow rate will increase the shear stress experienced by the vascular graft, which will potentially promote the endothelialization of the TEVG during the pre-implantation phase.
In addition, as our CFD results suggested, the vascular graft diameter is a critical parameter over flow behavior and their mechano-signaling on ECs. It is expected that under the same conditions provided by the fluidic device, an increase on vascular graft diameter would reduce wall shear stress, pressure gradient and velocity in a dependent manner to radius variations. However, to produce physiological-like mechanical stimuli over ECs cultured on vascular grafts from different diameters in the system, further studies must be performed. Nevertheless, we provide a reproducible protocol to design fluidic devices for custom vascular grafts testing.
Finally, the high biocompatibility of the fluidic system as determined via indirect cytotoxicity on EC (HUVEC) confirmed the absence of harmful leachable products during operation (Figure 18). The CM cell viability result was comparable with that of the negative control, which indicates that both the fluidic system and SIS-based vascular graft are capable to sustain viable and healthy cells and, therefore, it could be potentially used as a model to study the endothelization processes on vascular grafts. Despite some authors suggestong that inert materials such as glass and stainless steel 316 might reduce cell viability [60], our results demonstrated the opposite. This non-cytotoxic response can be attributed to the presence of 2% FBS on the recirculated medium, which contains proteins such as albumin that deposit on the surface and can potentially reduce the inherent toxicity effects of inert materials [61,62]. In addition, our results agree well with the reduced cytotoxicity of silicone, which was the material of O’rings in the fluidic system [60].
Another important feature to evaluate during endothelization is the cellular adhesion to the designed tubular vascular graft [63]. As a proof-of-concept, we seeded endothelial cells and demonstrated attachment on the graft (Figure 19). HUVEC cells attached to small diameter tubular SIS-based vascular graft under dynamic conditions as evidenced by a few cell cytoplasmatic projections (filopodia). The presence of these filopodia is key to form focal points of adhesion where cells can anchor and stabilize to promote migration and proliferation. This endothelial cell motility is a critical aspect of angiogenesis [64]. Finally, we found out a comparable average cell proliferation to previous studies for EC culture over biodegradable scaffolds [63,65]. Despite our progress, a deeper understanding of cell attachment under hemodynamic conditions could provide further clues of changes in cell orientation and morphology.

5. Conclusions

One of the main challenges when designing new vascular grafts is the ability to rapidly test whether they provide the right conditions for endothelization while avoiding undesired platelet deposition events. Prior to in vivo testing, a large set of biological and mechanical testing is conducted under static conditions that are generally far from those observed in vivo. As a result, many grafts fail to pass in vivo testing, which is undesirable from ethical and economic viewpoints. Here, we proposed to address this issue by designing and manufacturing a fluidic system capable of closely mimicking in vivo conditions. The system was composed of a main stainless steel chamber covered by polycarbonate lids, where the SIS-based vascular graft was enclosed, an agitator system, and internal and external nuts to connect the main chamber to medical tubing to circulate medium through the vascular graft. Also, we included silicone O’rings between the nuts and the chamber and underneath the polycarbonate lids. Finally, the system was equipped with an infusion pump and a culture medium reservoir. The components were designed and manufactured to guarantee a suitable environment for HUVEC cell growth on the SIS-based RVGs while they are subjected to dynamical conditions that mimic those observed physiologically. The main chamber and adjacent components were assembled together to the agitator system to provide the culture medium with a uniform rotation during its perfusion after cell seeding. The flow rate over the system was modulated with the infusion pump.
The designed system was initially analyzed in silico by calculating velocity profiles, pressure gradients and shear stresses. We established the mechanical and biological features required for cell growth on a SIS-based RVG. From the macroscopic approach, a relative error of 5.79% on pressure gradient was found when compared to the experimental data. The laminar flow behavior and the in silico approach showed that the wall shear stress generated by the system is comparable to that obtained by similar systems to simulate the hemodynamic conditions of native vessels. The relative error of 21.17% between the in silico inlet flow rate during the quasi-static phase and the experimental value was comparable with previously reported rigid wall models. Our model was therefore suitable to mimic the physiological conditions and to study the impact of changing relevant parameters such as differences in diameters throughout the geometry, pulsatile pressure ranges and interaction between endothelial cells and biomaterials. The velocity profiles and wall shear stress distributions obtained along the geometry showed high sensitivity to changes in flow diameters, thereby suggesting the importance of maintaining smooth anastomosis to favor the endothelialization process. In this regard, wall shear stress values at sudden expansions and contractions were above 20 Pa. In contrast, at the vascular graft region, where HUVECs were cultured, wall shear stress values were around −1 Pa to 1 Pa. Inertial forces were relevant for “S-shaped” velocity profiles at the vascular graft, which suggested maximum shear stress values in the fluid.
A cell viability reduction of only 5% demonstrated the low cytotoxicity induced by the fluidic device. The designed system allowed to carry out a protocol for a rather homogeneous cell seeding on SIS-based vascular grafts. SEM imaging showed HUVEC cytoplasmatic projections (filopodia) on the SIS-based vascular graft, thereby suggesting suitable cell attachment under dynamical culture conditions. In conclusion, the designed and manufactured fluidic system contributes to the development of methods, systems and protocols for the in vitro evaluation of small diameter RVG, which hold tremendous potential for the treatment of numerous cardiovascular diseases. The contribution is provided since the bioreactor system accomplishes mechanical and biological parameters to function as a tool for cell culture and in vitro evaluation of small diameter RVG, under a low cost compared with commercial options.

Supplementary Materials

The following are available online at https://www.mdpi.com/2227-9717/8/9/1198/s1, Table S1: The DFT rebuilt equations used for the boundary conditions of pressure inlet or outlet correspond to the Equation (A1) and Equation (A2), respectively.

Author Contributions

Conceptualization, O.D.L.M., J.C.B., J.C.C. and P.F.S.; methodology, O.D.L.M., P.F.S., A.R., C.M.-C., J.C.C., and M.C.; software, A.R., O.D.L.M. and J.C.C.; validation, A.R., C.M.-C., J.C.C., O.D.M.L. and M.C.; formal analysis, A.R., M.C.; investigation, A.R. and M.C.; resources, N.S., J.C.B.; data curation, A.R. and O.D.L.M.; writing—Original draft preparation, A.R. and M.C.; writing—Review and editing, M.C., J.C.C., O.D.L.M., P.F.S., C.M.-C., N.S. and J.C.B.; visualization, A.R. and M.C.; supervision, P.F.S., C.M.-C., J.C.C., O.D.L.M., J.C.B.; project administration, M.C., C.M-C., J.C.C., and J.C.B.; funding acquisition, J.C.B. and N.S. All authors have read and agreed to the published version of the manuscript.

Funding

This research was funded by Colombian Administrative Department of Science, Technology and Innovation COLCIENCIAS, project 277871552208 with contract 255-2016: “Desarrollo de injertos vasculares de Submucosa Intestinal porcina (SIS) con células endoteliales humanas de la vena umbilical (HUVECS) implantadas bajo condiciones dinámicas de perfusión, para mejorar su biocompatibilidad”.

Acknowledgments

Authors would like the Manufacture Laboratory of Mechanical Engineering Department at Universidad de los Andes for the fabrication of fluidic device components. Also, we thank the Microscopy Center μ-core at Universidad de los Andes for SEM visualization. Finally, special thanks to Andrés J. Garcia-Brand for his support on laboratory activities and his help in figures design, and to Vivian Talero for her support and guidance on the SIS preparation protocol.

Conflicts of Interest

The authors declare no conflict of interest.

References

  1. Criqui, M.H.; Aboyans, V. Epidemiology of peripheral artery disease. Circ. Res. 2015, 116, 1509–1526. [Google Scholar] [CrossRef] [PubMed] [Green Version]
  2. Tara, S.; Dean, E.W.; Rocco, K.A.; Udelsman, B.V.; Kurobe, H.; Shinoka, T.; Breuer, C.K. Vessel regeneration and bioengineering. In Regenerative Medicine Applications in Organ Transplantation; Elsevier: Amsterdam, The Netherlands, 2014; pp. 811–827. [Google Scholar]
  3. Ravi, S.; Chaikof, E.L. Biomaterials for vascular tissue engineering. Regen. Med. 2010, 5, 107–120. [Google Scholar] [CrossRef] [PubMed] [Green Version]
  4. Goldman, S.; Zadina, K.; Moritz, T.; Ovitt, T.; Sethi, G.; Copeland, J.G.; Thottapurathu, L.; Krasnicka, B.; Ellis, N.; Anderson, R.J.; et al. Long-term patency of saphenous vein and left internal mammary artery grafts after coronary artery bypass surgery. J. Am. Coll. Cardiol. 2004, 44, 2149–2156. [Google Scholar] [CrossRef] [PubMed]
  5. van Dijk, D.; Spoor, M.; Hijman, R.; Nathoe, H.M.; Borst, C.; Jansen, E.W.L.; Grobbee, D.E.; de Jaegere, P.P.T.; Kalkman, C.J.; Octopus Study Group. Cognitive and cardiac outcomes 5 years after off-pump vs on-pump coronary artery bypass graft surgery. JAMA 2007, 297, 701. [Google Scholar] [CrossRef] [PubMed]
  6. Jackson, M.R.; Belott, T.P.; Dickason, T.; Kaiser, W.J.; Modrall, J.G.; Valentine, R.J.; Clagett, G.P. The consequences of a failed femoropopliteal bypass grafting: Comparison of saphenous vein and PTFE grafts. J. Vasc. Surg. 2000, 32, 498–505. [Google Scholar] [CrossRef] [Green Version]
  7. Van Det, R.J.; Vriens, B.H.R.; der Palen, J.; Geelkerken, R.H. Dacron or ePTFE for femoro-popliteal above-knee bypass grafting: Short-and long-term results of a multicentre randomised trial. Eur. J. Vasc. Endovasc. Surg. 2009, 37, 457–463. [Google Scholar] [CrossRef] [Green Version]
  8. Zilla, P.; Bezuidenhout, D.; Human, P. Prosthetic vascular grafts: Wrong models, wrong questions and no healing. Biomaterials 2007, 28, 5009–5027. [Google Scholar] [CrossRef]
  9. Badylak, S.F. Decellularized allogeneic and xenogeneic tissue as a bioscaffold for regenerative medicine: Factors that influence the host response. Ann. Biomed. Eng. 2014, 42, 1517–1527. [Google Scholar] [CrossRef]
  10. Sánchez-Palencia, D.M.; González-Mancera, A.; Wagner, W.R.; Briceño, J.C.; D’Amore, A. Effects of fabrication on the mechanics, microstructure and micromechanical environment of small intestinal submucosa scaffolds for vascular tissue engineering. J. Biomech. 2014, 47, 2766–2773. [Google Scholar] [CrossRef]
  11. Sánchez-Palencia, D.M.; Navarro, J.; Araque, J.C.; Umaña, J.B.; Guerrero, A.F.; Quijano, L.M.; López, R.D.P.; Sandoval, N.F.; Briceno, J.C. Effects of fabrication on early patency and regeneration of small intestinal submucosa vascular grafts. Asaio J. 2015, 61, 596–604. [Google Scholar] [CrossRef]
  12. Valencia Rivero, K.T.; Jaramillo Escobar, J.; Galvis Forero, S.D.; Miranda Saldaña, M.C.; López Panqueva, R.d.P.; Sandoval Reyes, N.F.; Briceño Triana, J.C. New regenerative vascular grafts for hemodialysis access: Evaluation of a preclinical animal model. J. Investig. Surg. 2018, 31, 192–200. [Google Scholar] [CrossRef] [PubMed]
  13. Badylak, S.; Liang, A.; Record, R.; Tullius, R.; Hodde, J. Endothelial cell adherence to small intestinal submucosa: An acellular bioscaffold. Biomaterials 1999, 20, 2257–2263. [Google Scholar] [CrossRef]
  14. Badylak, S.F.; Lantz, G.C.; Coffey, A.; Geddes, L.A. Small intestinal submucosa as a large diameter vascular graft in the dog. J. Surg. Res. 1989, 47, 74–80. [Google Scholar] [CrossRef]
  15. Koobatian, M.T.; Row, S.; Smith, R.J., Jr.; Koenigsknecht, C.; Andreadis, S.T.; Swartz, D.D. Successful endothelialization and remodeling of a cell-free small-diameter arterial graft in a large animal model. Biomaterials 2016, 76, 344–358. [Google Scholar] [CrossRef] [Green Version]
  16. Barron, V.; Lyons, E.; Stenson-Cox, C.; McHugh, P.E.; Pandit, A. Bioreactors for cardiovascular cell and tissue growth: A review. Ann. Biomed. Eng. 2003, 31, 1017–1030. [Google Scholar] [CrossRef]
  17. Holt, G.E.; Halpern, J.L.; Dovan, T.T.; Hamming, D.; Schwartz, H.S. Evolution of an in vivo bioreactor. J. Orthop. Res. 2005, 23, 916–923. [Google Scholar] [CrossRef]
  18. Bancroft, G.N.; Sikavitsas, V.I.; Mikos, A.G. Technical Note: Design of a Flow Perfusion Bioreactor System for Bone Tissue-Engineering Applications. Tissue Eng. 2003, 9, 549–554. [Google Scholar] [CrossRef] [Green Version]
  19. Mironov, V.; Kasyanov, V.; McAllister, K.; Oliver, S.; Sistino, J.; Markwald, R. Perfusion bioreactor for vascular tissue engineering with capacities for longitudinal stretch. J. Craniofac. Surg. 2003, 14, 340–347. [Google Scholar] [CrossRef]
  20. Salehi-Nik, N.; Amoabediny, G.; Pouran, B.; Tabesh, H.; Shokrgozar, M.A.; Haghighipour, N.; Khatibi, N.; Anisi, F.; Mottaghy, K.; Zandieh-Doulabi, B. Engineering parameters in bioreactor’s design: A critical aspect in tissue engineering. Biomed. Res. Int. 2013, 2013. [Google Scholar] [CrossRef]
  21. Stegemann, J.P.; Nerem, R.M. Phenotype modulation in vascular tissue engineering using biochemical and mechanical stimulation. Ann. Biomed. Eng. 2003, 31, 391–402. [Google Scholar] [CrossRef]
  22. White, S.S.; Zarins, C.K.; Giddens, D.P.; Bassiouny, H.; Loth, F.; Jones, S.A.; Glagov, S. Hemodynamic patterns in two models of end-to-side vascular graft anastomoses: Effects of pulsatility, flow division, Reynolds number, and hood length. J. Biomech. Eng. 1993, 115, 104–111. [Google Scholar] [CrossRef] [PubMed]
  23. Park, J.Y.; White, J.B.; Walker, N.; Kuo, C.-H.; Cha, W.; Meyerhoff, M.E.; Takayama, S. Responses of endothelial cells to extremely slow flows. Biomicrofluidics 2011, 5, 22211. [Google Scholar] [CrossRef] [PubMed] [Green Version]
  24. Davies, P.F. Flow-mediated endothelial mechanotransduction. Physiol. Rev. 1995, 75, 519–560. [Google Scholar] [CrossRef] [PubMed]
  25. Bilodeau, K.; Couet, F.; Boccafoschi, F.; Mantovani, D. Design of a perfusion bioreactor specific to the regeneration of vascular tissues under mechanical stresses. Artif. Organs 2005, 29, 906–912. [Google Scholar] [CrossRef]
  26. Wang, C.; Lu, H.; Schwartz, M.A. A novel in vitro flow system for changing flow direction on endothelial cells. J. Biomech. 2012, 45, 1212–1218. [Google Scholar] [CrossRef] [Green Version]
  27. Anisi, F.; Salehi-Nik, N.; Amoabediny, G.; Pouran, B.; Haghighipour, N.; Zandieh-Doulabi, B. Applying shear stress to endothelial cells in a new perfusion chamber: Hydrodynamic analysis. J. Artif. Organs 2014, 17, 329–336. [Google Scholar] [CrossRef]
  28. Zeng, L.; Xiao, Q.; Margariti, A.; Zhang, Z.; Zampetaki, A.; Patel, S.; Capogrossi, M.C.; Hu, Y.; Xu, Q. HDAC3 is crucial in shear-and VEGF-induced stem cell differentiation toward endothelial cells. J. Cell Biol. 2006, 174, 1059–1069. [Google Scholar] [CrossRef] [Green Version]
  29. Lyons, E.; Pandit, A. Design of bioreactors for cardiovascular applications. Top. Tissue Eng. 2005, 2, 3. [Google Scholar]
  30. Williams, C.; Wick, T.M. Perfusion bioreactor for small diameter tissue-engineered arteries. Tissue Eng. 2004, 10, 930–941. [Google Scholar] [CrossRef]
  31. Xu, X.Y.; Collins, M.W. Haemodynamics of Arterial Organs: Comparison of Computational Predictions with In Vitro and In Vivo Data; Computational Mechanics: Southampton, UK, 1999; Volume 1. [Google Scholar]
  32. Giridharan, G.A.; Lederer, C.; Berthe, A.; Goubergrits, L.; Hutzenlaub, J.; Slaughter, M.S.; Dowling, R.D.; Spence, P.A.; Koenig, S.C. Flow dynamics of a novel counterpulsation device characterized by CFD and PIV modeling. Med. Eng. Phys. 2011, 33, 1193–1202. [Google Scholar] [CrossRef]
  33. Wissing, T.B.; Bonito, V.; Van Haaften, E.E.; Van Doeselaar, M.; Brugmans, M.M.C.P.; Janssen, H.M.; Bouten, C.V.C.; Smits, A.I.P.M. Macrophage-driven biomaterial degradation depends on scaffold microarchitecture. Front. Bioeng. Biotechnol. 2019, 7, 87. [Google Scholar] [CrossRef] [PubMed]
  34. Pozrikidis, C. Computational Hydrodynamics of Capsules and Biological Cells; CRC Press: Boca Raton, FL, USA, 2010. [Google Scholar]
  35. Hsiai, T.K.; Blackman, B.; Jo, H. Hemodynamics and Mechanobiology of Endothelium; World Scientific: Singapore, 2010. [Google Scholar]
  36. Wissing, T.B.; van Haaften, E.E.; Koch, S.E.; Ippel, B.D.; Kurniawan, N.A.; Bouten, C.V.C.; Smits, A.I.P.M. Hemodynamic loads distinctively impact the secretory profile of biomaterial-activated macrophages--implications for in situ vascular tissue engineering. Biomater. Sci. 2020, 8, 132–147. [Google Scholar] [CrossRef] [PubMed] [Green Version]
  37. He, F.; Hua, L.; Gao, L. Effects of wall condition on flow distributions in arterial modeling: Comparison of rigid, dynamic, and compliant walls. J. Mech. Sci. Technol. 2016, 30, 1471–1475. [Google Scholar] [CrossRef]
  38. Pouran, B.; Amoabediny, G.; Saghafinia, M.S.; Abbas, M.P.H. Characterization of interfacial hydrodynamics in a single cell of shaken microtiter plate bioreactors applying computational fluid dynamics technique. Procedia Eng. 2012, 42, 924–930. [Google Scholar] [CrossRef] [Green Version]
  39. Dur, O.; Coskun, S.T.; Coskun, K.O.; Frakes, D.; Kara, L.B.; Pekkan, K. Computer-aided patient-specific coronary artery graft design improvements using CFD coupled shape optimizer. Cardiovasc. Eng. Technol. 2011, 2, 35–47. [Google Scholar] [CrossRef] [Green Version]
  40. Ruiz-Soler, A.; Kabinejadian, F.; Slevin, M.A.; Bartolo, P.J.; Keshmiri, A. Optimisation of a novel spiral-inducing bypass graft using computational fluid dynamics. Sci. Rep. 2017, 7, 1–14. [Google Scholar] [CrossRef] [Green Version]
  41. Sigovan, M.; Rayz, V.; Gasper, W.; Alley, H.F.; Owens, C.D.; Saloner, D. Vascular remodeling in autogenous arterio-venous fistulas by MRI and CFD. Ann. Biomed. Eng. 2013, 41, 657–668. [Google Scholar] [CrossRef] [Green Version]
  42. White, F.M. Fluid Mechanics, 5th ed.; McGraw-Hill Book Company: Boston, MA, USA, 2003. [Google Scholar]
  43. Beckwith, T.G.; Marangoni, R.D.; Lienhard, J.H.V. Mechanical Measurements; Pearson: New York City, NY, USA, 2009. [Google Scholar]
  44. Varley, M.C.; Markaki, A.E.; Brooks, R.A. Effect of Rotation on Scaffold Motion and Cell Growth in Rotating Bioreactors. Tissue Eng. Part A 2017, 23, 522–534. [Google Scholar] [CrossRef] [Green Version]
  45. Yang, J.; Guertin, P.; Jia, G.; Lv, Z.; Yang, H.; Ju, D. Large-scale microcarrier culture of HEK293T cells and Vero cells in single-use bioreactors. AMB Express 2019, 9, 70. [Google Scholar] [CrossRef] [Green Version]
  46. Inamori, M.; Mizumoto, H.; Kajiwara, T. An approach for formation of vascularized liver tissue by endothelial cell–covered hepatocyte spheroid integration. Tissue Eng. Part A 2009, 15, 2029–2037. [Google Scholar] [CrossRef]
  47. Rochier, A.; Nixon, A.; Yamashita, N.; Abe, R.; Abe, R.; Madri, J.A.; Sumpio, B.E. Laminar shear, but not orbital shear, has a synergistic effect with thrombin stimulation on tissue factor expression in human umbilical vein endothelial cells. J. Vasc. Surg. 2011, 54, 480–488. [Google Scholar] [CrossRef] [PubMed] [Green Version]
  48. König, F.; Hollweck, T.; Pfeifer, S.; Reichart, B.; Wintermantel, E.; Hagl, C.; Akra, B. A pulsatile bioreactor for conditioning of tissue-engineered cardiovascular constructs under endoscopic visualization. J. Funct. Biomater. 2012, 3, 480–496. [Google Scholar] [CrossRef] [PubMed] [Green Version]
  49. Sierad, L.N.; Simionescu, A.; Albers, C.; Chen, J.; Maivelett, J.; Tedder, M.E.; Liao, J.; Simionescu, D.T. Design and testing of a pulsatile conditioning system for dynamic endothelialization of polyphenol-stabilized tissue engineered heart valves. Cardiovasc. Eng. Technol. 2010, 1, 138–153. [Google Scholar] [CrossRef] [PubMed] [Green Version]
  50. Goldstein, A.S.; Juarez, T.M.; Helmke, C.D.; Gustin, M.C.; Mikos, A.G. Effect of convection on osteoblastic cell growth and function in biodegradable polymer foam scaffolds. Biomaterials 2001, 22, 1279–1288. [Google Scholar] [CrossRef]
  51. Papaioannou, T.G.; Stefanadis, C. Vascular wall shear stress: Basic principles and methods. Hell. J Cardiol. 2005, 46, 9–15. [Google Scholar]
  52. Ortale, J.R.; Meciano Filho, J.; Paccola, A.M.; Leal, J.G.; Scaranari, C. Anatomy of the lateral, diagonal and anterosuperior arterial branches of the left ventricle of the human heart. Braz. J. Cardiovasc. Surg. 2005, 20, 149–158. [Google Scholar] [CrossRef]
  53. Sánchez, P.F.; Brey, E.M.; Briceño, J.C. Endothelialization mechanisms in vascular grafts. J. Tissue Eng. Regen. Med. 2018, 12, 2164–2178. [Google Scholar] [CrossRef]
  54. Lipowsky, H.H.; Usami, S.; Chien, S. In vivo measurements of “apparent viscosity” and microvessel hematocrit in the mesentery of the cat. Microvasc. Res. 1980, 19, 297–319. [Google Scholar] [CrossRef]
  55. Dinnar, U. Cardiovascular Fluid Dynamics; CRC Press: Boca Raton, FL, USA, 2019. [Google Scholar]
  56. Armstrong, M.L.; Heistad, D.D.; Marcus, M.L.; Megan, M.B.; Piegors, D.J. Structural and hemodynamic response of peripheral arteries of macaque monkeys to atherogenic diet. Arterioscler. An Off. J. Am. Heart Assoc. Inc. 1985, 5, 336–346. [Google Scholar] [CrossRef] [Green Version]
  57. Lyman, D.J.; Stewart, S.F.C.; Murray-Wijelath, J.; Wijelath, E. Role of fluid dynamics on the healing of an in vivo tissue engineered vascular graft. J. Biomed. Mater. Res. Part B Appl. Biomater. 2006, 77, 389–400. [Google Scholar] [CrossRef]
  58. Cikirikcioglu, M.; Pektok, E.; Cikirikcioglu, Y.B.; Osorio-da Cruz, S.; Tille, J.-C.; Kalangos, A.; Walpoth, B.H. Matching the diameter of ePTFE bypass prosthesis with a native artery improves neoendothelialization. Eur. Surg. Res. 2008, 40, 333–340. [Google Scholar] [CrossRef] [PubMed]
  59. Thompson, C.A.; Colon-Hernandez, P.; Pomerantseva, I.; MacNeil, B.D.; Nasseri, B.; Vacanti, J.P.; Oesterle, S.N. A novel pulsatile, laminar flow bioreactor for the development of tissue-engineered vascular structures. Tissue Eng. 2002, 8, 1083–1088. [Google Scholar] [CrossRef] [PubMed]
  60. Aizawa, P.; Karlsson, G.; Benemar, C.; Segl, V.; Martinelle, K.; Lindner, E. Effect of different materials used in bioreactor equipments on cell growth of human embryonic kidney (HEK293) Cells cultivated in a protein-free medium. In Cell Technology for Cell Products; Springer: New York, NY, USA, 2007; pp. 459–462. [Google Scholar]
  61. Ertel, S.I.; Ratner, B.D.; Kaul, A.; Schway, M.B.; Horbett, T.A. In vitro study of the intrinsic toxicity of synthetic surfaces to cells. J. Biomed. Mater. Res. 1994, 28, 667–675. [Google Scholar] [CrossRef] [PubMed]
  62. Latour, R.A. Biomaterials: Protein-surface interactions. Encycl. Biomater. Biomed. Eng. 2005, 1, 270–284. [Google Scholar]
  63. Melchiorri, A.J.; Bracaglia, L.G.; Kimerer, L.K.; Hibino, N.; Fisher, J.P. In vitro endothelialization of biodegradable vascular grafts via endothelial progenitor cell seeding and maturation in a tubular perfusion system bioreactor. Tissue Eng. Part C Methods 2016, 22, 663–670. [Google Scholar] [CrossRef] [Green Version]
  64. DeLisser, H.M. Modulators of endothelial cell filopodia: PECAM-1 joins the club. Cell Adhes. Migr. 2011, 5, 37–41. [Google Scholar] [CrossRef] [Green Version]
  65. Coakley, D.N.; Shaikh, F.M.; O’Sullivan, K.; Kavanagh, E.G.; Grace, P.A.; Walsh, S.R.; McGloughlin, T.M. Comparing the endothelialisation of extracellular matrix bioscaffolds with coated synthetic vascular graft materials. Int. J. Surg. 2016, 25, 31–37. [Google Scholar] [CrossRef]
Figure 1. Fluidic device for the testing of SIS-based regenerative vascular grafts. The assembly consists of a vascular graft chamber, an infusion pump, a medium reservoir, and an agitator system.
Processes 08 01198 g001
Figure 2. Assembly of the agitator system where the fluidic device was mounted to allow rotation in both the clockwise and counterclockwise directions.
Processes 08 01198 g002
Figure 3. Fluidic system setup. (a) Schematic of the fluidic device and the required accessories for cell seeding on the SIS-based vascular graft. (b) Picture of the actual implementation components where (1) is the culture medium reservoir tank, (2) is the infusion pump, (3) is the setup of the fluidic device and a SIS-based VG, and (4) is the agitator system.
Processes 08 01198 g003
Figure 4. Experimental setup. (a) Schematic of the fluidic device and the required accessories for pressure measurement. (b) Picture of the actual implementation.
Processes 08 01198 g004
Figure 5. Schematic of a cross-sectional view of the fluidic device. The blue dotted line represents the symmetry on sections and dimensions (subscript s in the Table 1). Section 1 corresponds to the medical tubing of length L1,1s from the inlet and the outlet pressure transducers, respectively. Sections 2 and 4 represent the four inserts to connect the required medical tubing sections (L2,4,2s,4s). Section 3 represents the internal O-rings distance (L3,3s). Section 5 corresponds to the medical tubing used to connect the vascular graft to the fluidic device (L5,5s). Section 6 represents a half-length SIS-based vascular graft of length L6,6s (i.e., Total length of the SIS-based vascular graft is two-times L6).
Processes 08 01198 g005
Figure 6. Computational domain for the model with the asymmetrical assumption (red line). The heights of the sections correspond to the radius of the components in the experimental setup. (a) Schematic of the six main sections on the left half of the geometry. The right half (from the blue dotted line) is symmetrical to the left one. (b) Section 1 represents the first medical tubing with a height of 1.4 mm. (c) Section 2 corresponds to the first insert with a height of 0.9 mm. (d) Section 3 corresponds the O-rings with a height of 1.6 mm. (e) Section 4 corresponds to the second insert. (f) Section 5 is the second medical tubing. (g) Section 6 represents one half of the SIS-based vascular graft with a height of 1.5 mm. The section interfaces were smoothed out with the aid of 45° chamfers along the computational domain to approximate the transition between components of the experimental setup. The final meshes of each section are shown in panels (bg).
Processes 08 01198 g006
Figure 7. In silico division for computational model analysis of phases 1 and 2 according to the upward and downward stages.
Processes 08 01198 g007
Figure 8. Experimental pressure measurements at the inlet and outlet of the fluidic system under a pulsatile flow of 1200 mL/h (3.33 × 10⁻⁷ m3/s) using the Baxter Colleague Infusion Pump.
Processes 08 01198 g008
Figure 9. Mesh convergence analysis for the Mean Inlet Flow Rate for the six mesh configurations.
Processes 08 01198 g009
Figure 10. Comparison between the experimental Inlet pressure signal and the reconstructed DFT signal for (a) 10 harmonics, (b) 50 harmonics, (c) 150 harmonics, and (d) 200 harmonics.
Processes 08 01198 g010
Figure 11. Comparison between the experimental Outlet pressure signal and the reconstructed DFT signal: (a) 10 harmonics, (b) 50 harmonics, (c) 100 harmonics, and (d) 150 harmonics.
Processes 08 01198 g011
Figure 12. Pressure and Wall Shear Stress distributions along the global geometry of the computational domain for Phase 1. Initial and final time steps for each phase are included as a comparison reference for the chosen time steps on both stages. (a) Pressure and (b) Wall Shear Stress for t = 0.585. (c) Pressure and (d) Wall Shear Stress for t = 0.615. (e) Pressure and (f) Wall Shear Stress for t = 0.63. (g) Pressure and (h) Wall Shear Stress for t = 0.675.
Processes 08 01198 g012
Figure 13. Pressure and Wall Shear Stress distributions along the global geometry of the computational domain for Phase 2. Initial and final time steps for each phase are included as a comparison reference for the chosen time steps on both stages. (a) Pressure and (b) Wall Shear Stress for t = 0.81. (c) Pressure and (d) Wall Shear Stress for t = 0.855. (e) Pressure and (f) Wall Shear Stress for t = 0.9. (g) Pressure and (h) Wall Shear Stress for t = 0.99.
Processes 08 01198 g013
Figure 14. Time evolution of the computational Inlet pressure (left y-axis) and Area-Weighted Average Wall Shear Stress (right y-axis).
Processes 08 01198 g014
Figure 15. Time evolution of the computational Inlet pressure (left y-axis) and Inlet Flow Rate (right y-axis).
Processes 08 01198 g015
Figure 16. Local velocity profiles for selected time steps on phases I and II at the inlet (x = −15 mm), the middle (x = 0 mm) and the outlet (x = 15 mm) of the vascular graft region for (a) t = 0.585s, (b) t = 0.63s, (c) t = 0.675 s, (d) t = 0.855 s, and (e) t = 0.99 s.
Processes 08 01198 g016
Figure 17. Local velocity profiles for selected time steps on phases I and II at the middle (x = 0 mm) of the vascular graft region.
Processes 08 01198 g017
Figure 18. Cytotoxicity effect of circulating medium (CM) from the fluidic system on HUVEC cells. The cytotoxicity was determined via MTT colorimetric assay relative to the negative control, which was uncirculated EGM-2 medium (UM). Cells treated with circulated EGM-2 medium (for 72 h) evidenced a 93.4 ± 2.2% cell viability, while cells treated with the positive control (DMSO 10%) in EGM-2 exhibited a 5.3 ± 0.96% viability. There is no statistically significant difference between the circulated medium and the negative control according to statistical analysis determined by one-way ANOVA followed by a Tukey test (n = 3 for each experiment).
Processes 08 01198 g018
Figure 19. Scanning Electron Microscopy (SEM) imaging of HUVEC cells attachment on the surface of a tubular SIS-based vascular graft subjected to the initial static growing conditions during 2 h and subsequently to dynamic growing conditions of the fluidic device at a flow rate of 1200 mL/h for 3 days. Yellow arrows show endothelial cells and their cytoplasmatic projections (filopodia) on the SIS-based vascular graft lumen.
Processes 08 01198 g019
Table 1. Parameters for calculations according to the macroscopic and computational approaches. Subscript s refers to the symmetrical section of the geometry.
ParameterDefinitionValueUnits
ρ Culture Medium Density1 × 103kg/m3
D1, D11, D5, D7Internal diameter of sections 1, 1s, 5 and 5s (Medical tubing)2.8mm
D2, D4, D8, D10Internal diameter of sections 2, 2s, 4 and 4s (Inserts)1.8mm
D3Internal diameter of sections 6 and 6s (SIS-based Vascular Graft)3mm
D3, D9Internal diameter of sections 3 and 3s (O’rings)3.2
QPump Experimental Flow Rate3.33 × 10−7m3/s
L1, L1s, L5, L5sLength of sections 1, 1s, 5 and 5s (Medical tubing)48 (1, 1s)
22 (5, 5s)
mm
L2, L2s, L4, L4sLength of sections 2, 2s, 4 and 4s (Inserts)24 (2, 2s)
22 (4, 4s)
mm
L6, 6sgLength of sections 6 and 6s (SIS-based Vascular Graft)30mm
L3, L9Length of sections 3 and 3s (O’rings)7mm
MCulture Medium Viscosity1 × 10−3Pa∗s
Table 2. Number and size of elements for the six different mesh configurations used for mesh convergence analyses. The element size edge was modified to obtain such configurations.
Mesh 1Mesh 2Mesh 3Mesh 4Mesh 5Mesh 6
Element size1.50 × 10−41.00 × 10−47.00 × 10−55.00 × 10−54.20 × 10−53.60 × 10⁻⁵
Number of elements35,39878,312159,900313,420448,076602,802
Table 3. Major pressure losses along the fluidic system as calculated with the macroscopic approach.
SectionDiameter [m]Area [m2]Length [m]ReP [Pa]fP [Pa]
S1Medical tubing2.80 × 10−36.17 × 10−64.80 × 10−2151.5610.610.4210.60
S2Insert 11.80 × 10−32.54 × 10−62.40 × 10−2235.7631.050.2731.05
S3Internal O’rings3.20 × 10−38.04 × 10−67.00 × 10−3132.620.910.480.91
S4Insert 21.80 × 10−32.54 × 10−62.20 × 10−2235.7628.460.2728.46
S5Medical tubing2.80 × 10−36.17 x10−62.10 x10−2151.564.640.424.64
S6Vascular graft3.00 × 10−37.07 × 10−63.00 × 10−2141.465.030.455.03
S7Medical tubing2.80 × 10−36.17 × 10−62.10 × 10−2151.564.640.424.64
S8Insert 31.80 × 10−32.54 × 10−62.20 × 10−2235.7628.460.2728.46
S9Internal O’rings3.20 × 10−38.04 × 10−67.00 × 10−2132.620.910.480.91
S10Insert 41.80 × 10−32.54 × 10−62.40 × 10−2235.7631.050.2731.05
S11Medical tubing2.80 × 10−36.17 × 10−64.80 × 10−2151.5610.610.4210.61
Total Length0.27Total Major Δ Pressure156.34Total Major Δ Pressure156.34
Table 4. Minor pressure losses along the fluidic system as calculated with the macroscopic approach.
SectionsMinor LossΒKP [Pa]
S1–S2Gradual contraction0.644.466.53
S2–S3Gradual expansion0.564.6740.04
S3–S4Gradual contraction0.5610.328.87
S4–S5Gradual expansion0.642.0217.29
S5–S6Gradual expansion0.930.020.03
S6–S7Gradual contraction0.930.050.05
S7–S8Gradual contraction0.644.466.53
S8–S9Gradual expansion0.564.6740.04
S9–S10Gradual contraction0.5610.338.87
S10–S11Gradual expansion0.642.0217.29
Total minor Δ Pressure145.54
Total theoretical Δ P 301.90 Pa.
Table 5. Relative error for the evaluated mesh configurations. The studied parameter for convergence was the Mean Inlet Flow Rate.
MeshNumber of ElementsAbsolute Relative Error (%)
135,398-
278,3122.44
3159,9001.05
4313,4200.39
5448,0760.098
6602,8020.033
Table 6. Experimental values of flow rate compared with the reported values by the infusion pump display.
Reported Flow Rate (mL/h)Experimentally Measured Flow Rate (mL/h) *Relative Error (%)
12001190 ± 17.320.83
500484 ± 6.933.20
10096.2 ± 1.440.83
* Results are presented as means and the corresponding standard deviations for n = 3.
Table 7. Relative error between the computational model and the experimental inlet flow rate for two different time intervals.
PhaseAverage Computational Inlet Flow Rate (m3/s) *Number of Instantaneous Flow Rate ValuesRelative Error (%)
1 and 25.25 × 10⁻⁷ ± 2.88 × 10−73036.52
17.30 × 10⁻⁷ ± 4.28 × 10−71054.32
24.23 × 10⁻⁷ ± 8.10 × 10−82021.17
* Results are presented as means and the corresponding standard deviations
Table 8. Comparison of wall shear stress reported values.
Wall Shear Stress [Pa]Vessel Type or ScaffoldEndothelial Cell LineDiameter [mm]Type of AnalysisRef.
6 (Average)
8 (Max.)
Silicon scaffolds coated by collagen type I.HUVECsN/ACFD[27]
60 (Max.)Silicon scaffolds coated by collagen type I.HUVECsN/AIn vitro[27]
3–10Near arterial branchesN/A1–30Clinical[27,51,52,53]
1–7
0.1–0.6
Arteries
Veins
N/A3–25
5–30
Clinical[51,54,55]
1 (Max.)Near to arterial branches.
Human carotid bifurcation.
Mammalian cells5.9In vitro and clinical[22,38,55,56]
1–2Arteries under normal flow conditionsN/A4–25Clinical[22,47]
1.5Femoral arteries of cynomolgus monkeys and dog carotid arteriesN/A4
3–4.5
In vivo[22,51,53,55]
0.1–5Majority of blood vessels.N/A0.006–30Clinical[8]
2–4Large arteries of uniform geometry and away from branchesN/A4–25Clinical[53,55]
0–10
1.2
Unidirectional laminar flowBovine aorticN/AIn vitro[24]
0.01MicrocirculationN/A0.006–0.02Clinical[23,55]
10−5–10−3PDMS microchannels chip HUVECs200 µm heightIn vitro and CFD[23]

