Degradation of Direct Blue 1 through Heterogeneous Photocatalysis with TiO2 Irradiated with E-Beam

 , , , and
Abstract
:
1. Introduction
2. Materials and Methods
2.1. Reagents and Equipment
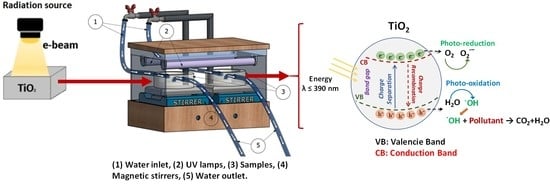
2.2. TiO2 Irradiation
2.3. TiO2 Characterization
2.4. DB1 Degradation Tests with Irradiated TiO2
2.5. Adsorption Kinetics
2.6. Adsorption Isotherms
2.7. Contact Angles
2.8. Mineralization Levels through TOC
3. Results
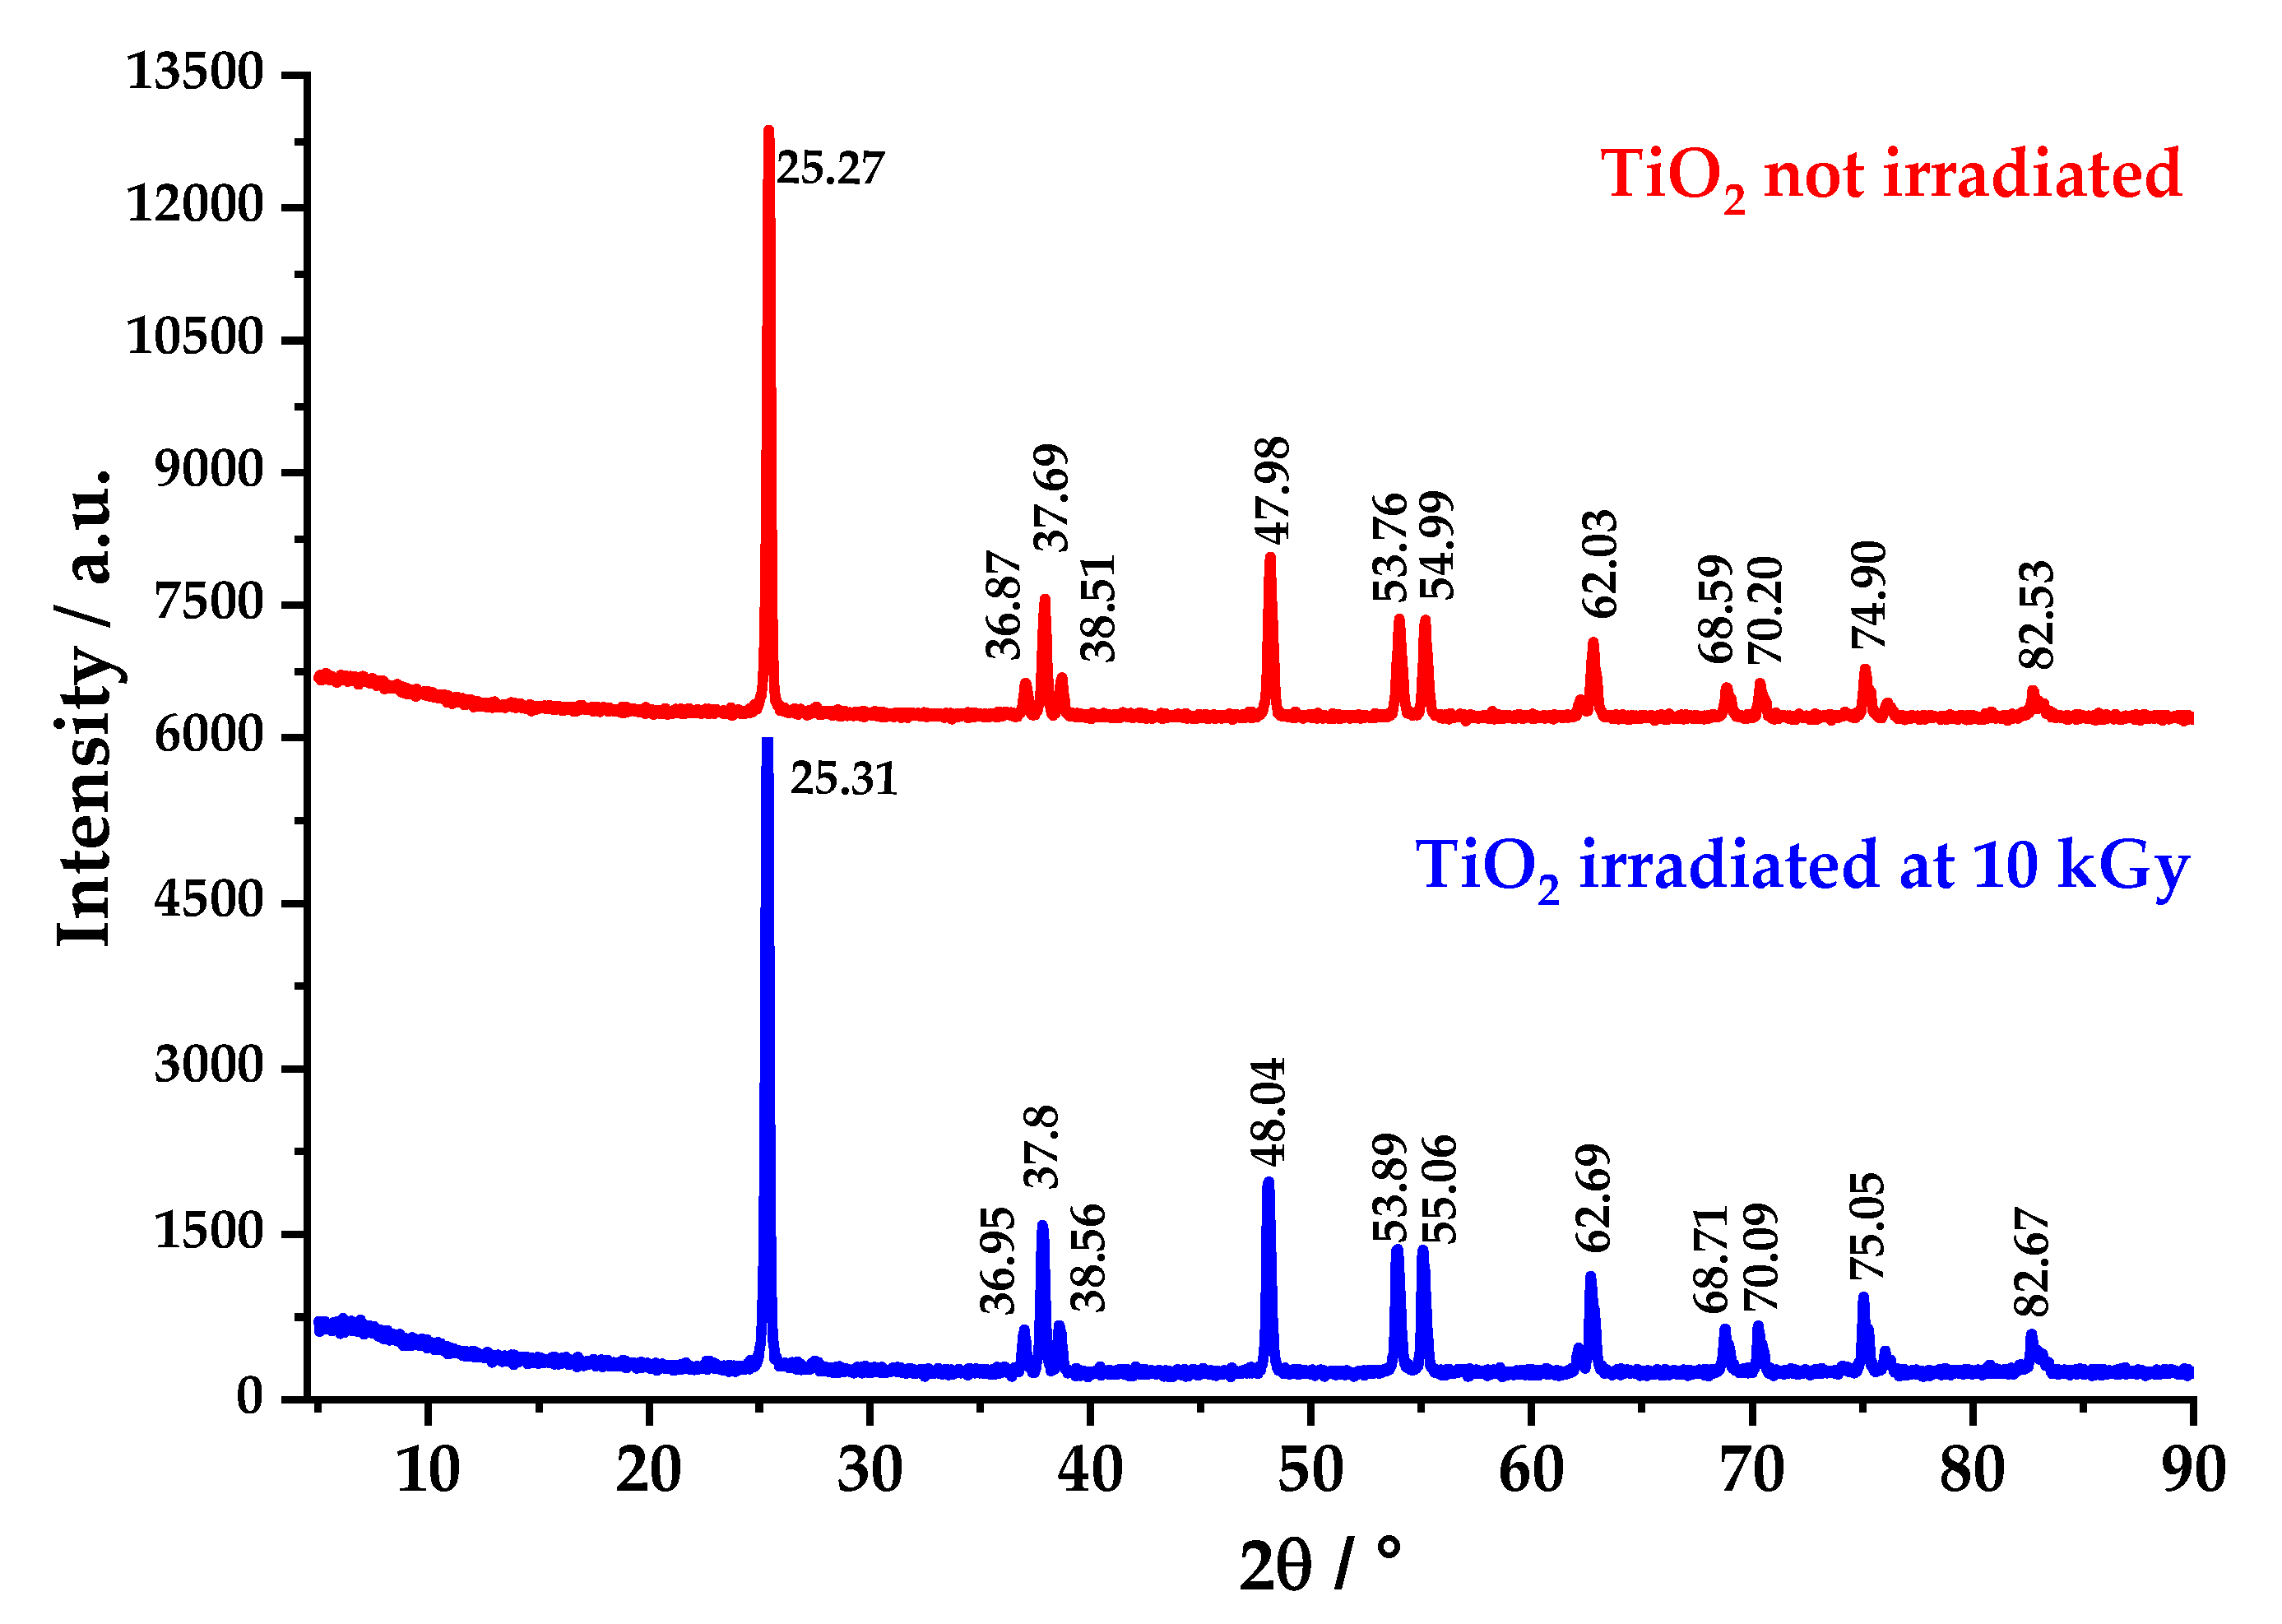
3.1. X-ray Diffraction, Band Gap by DRS and FTIR Spectroscopy
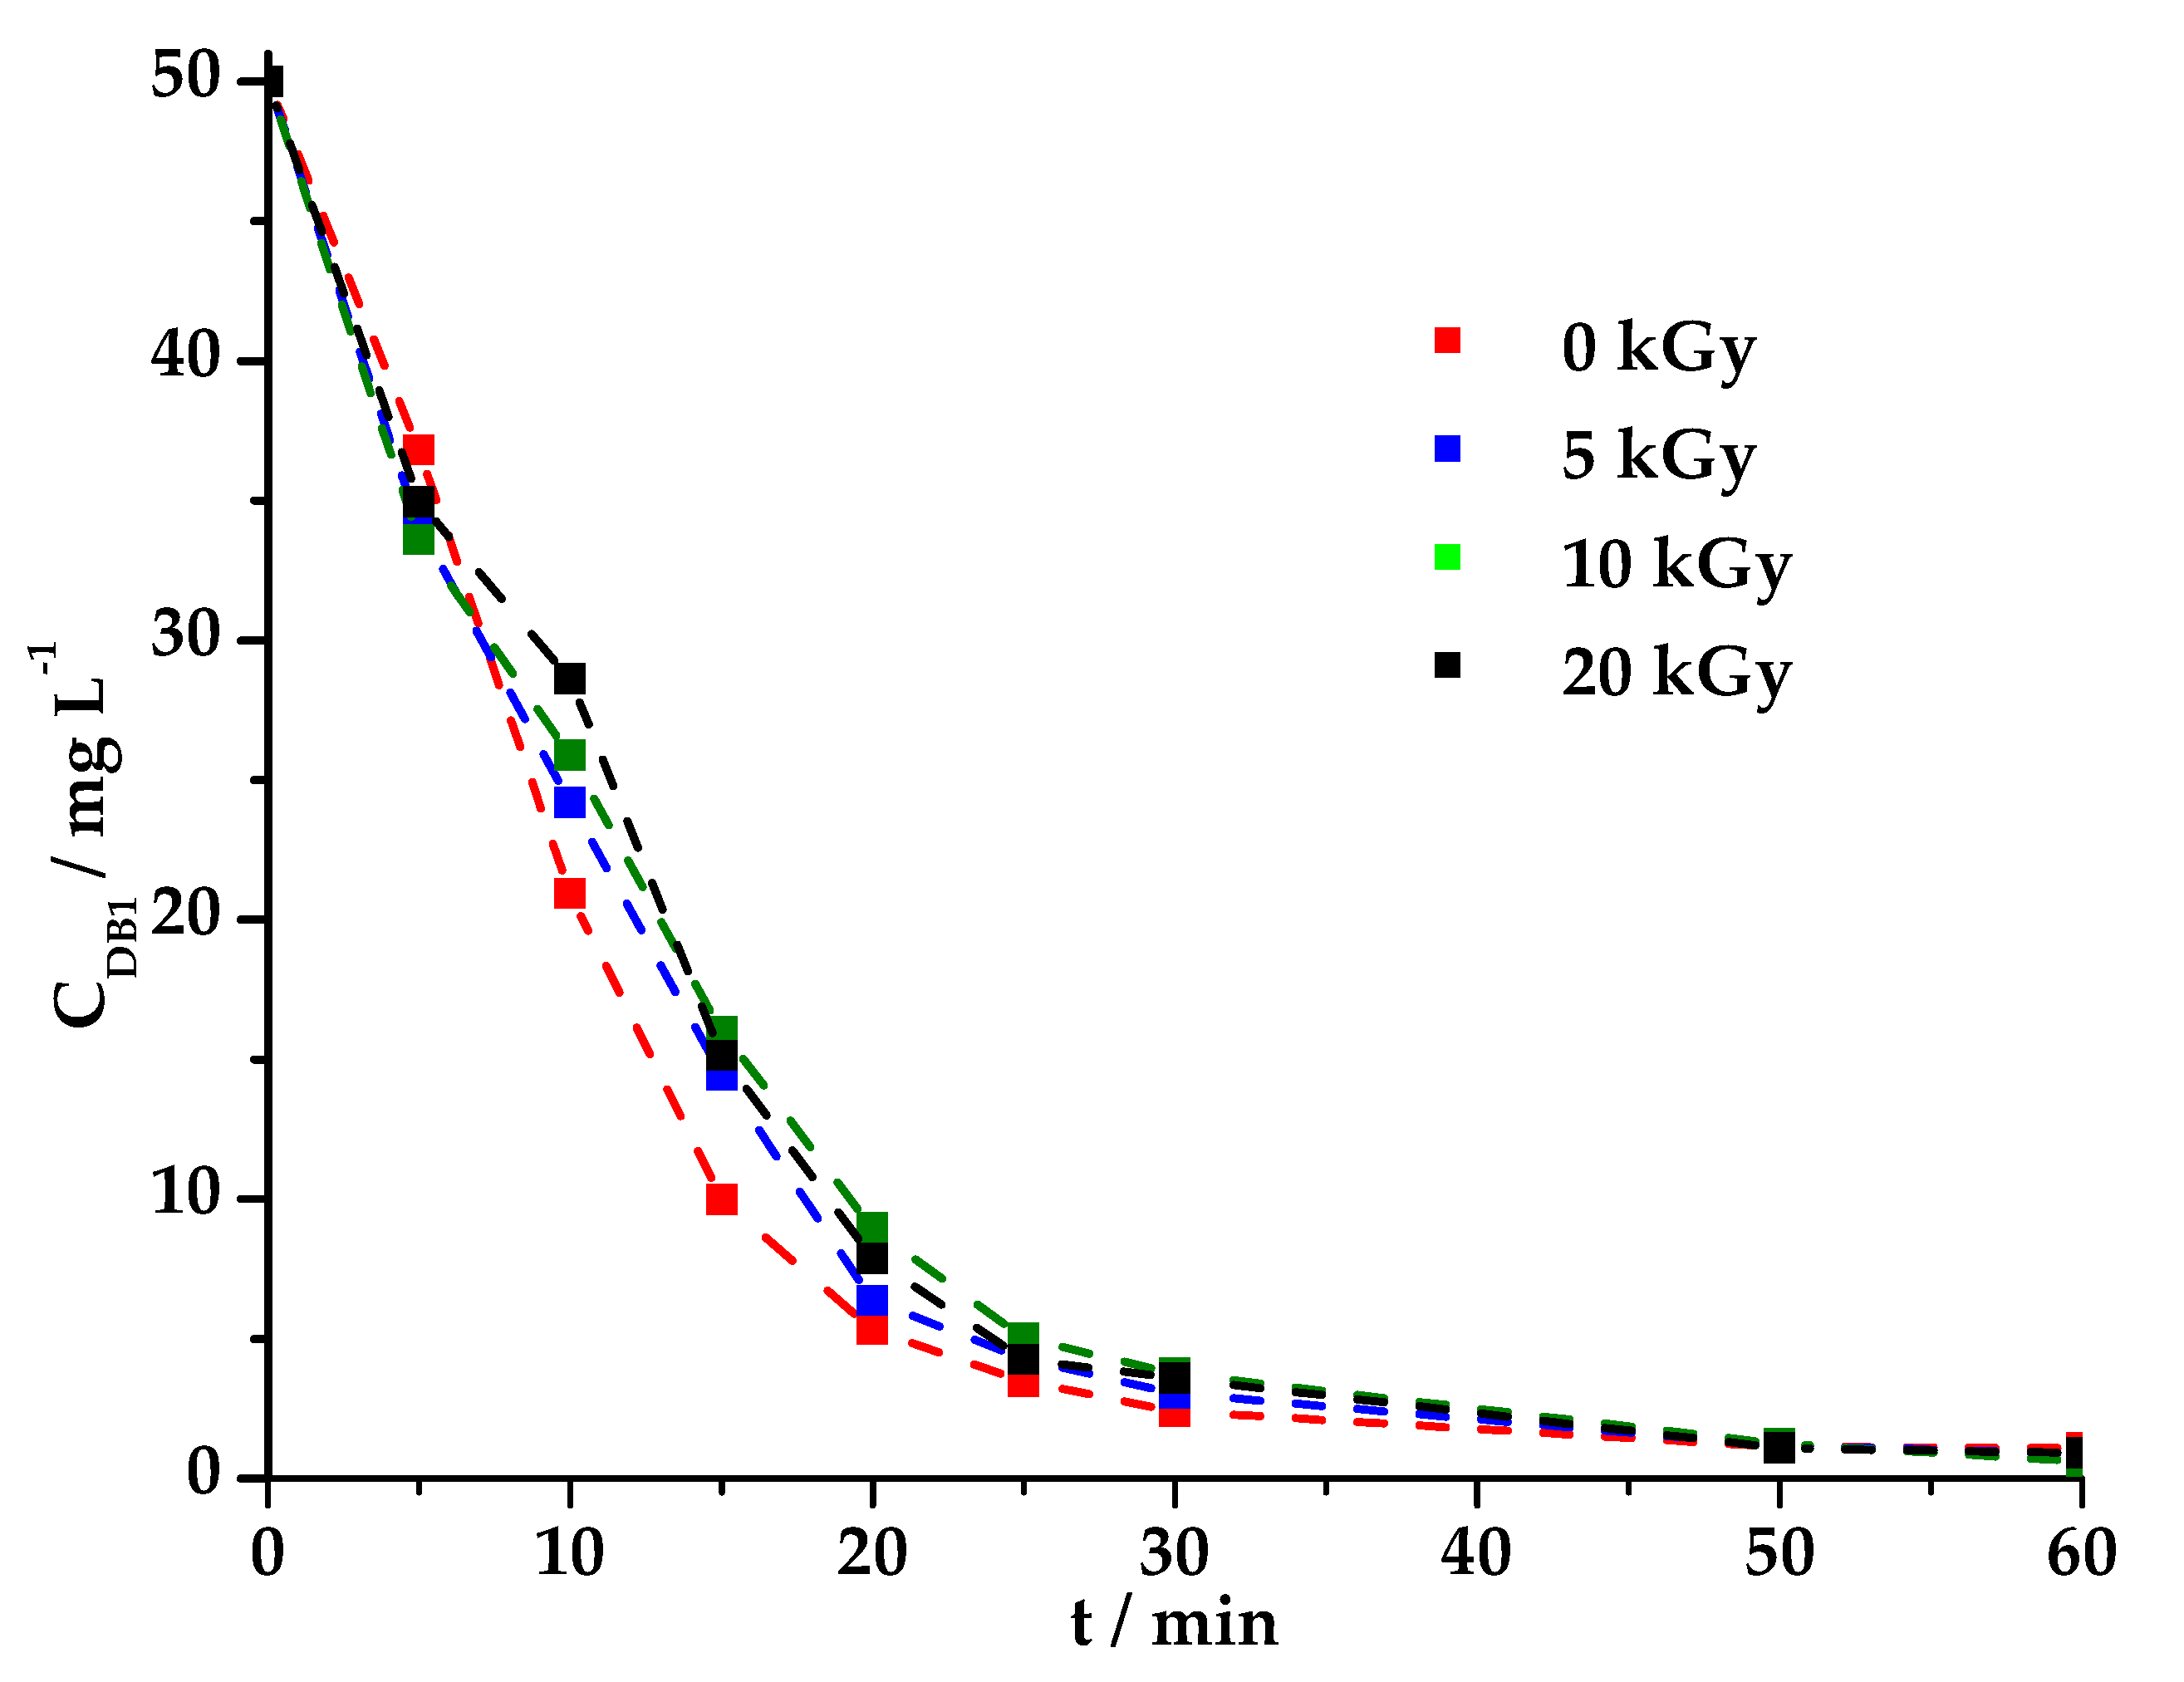
3.2. Heterogeneous Photocatalysis
3.3. Isotherms of Adsorption
3.4. Mineralization
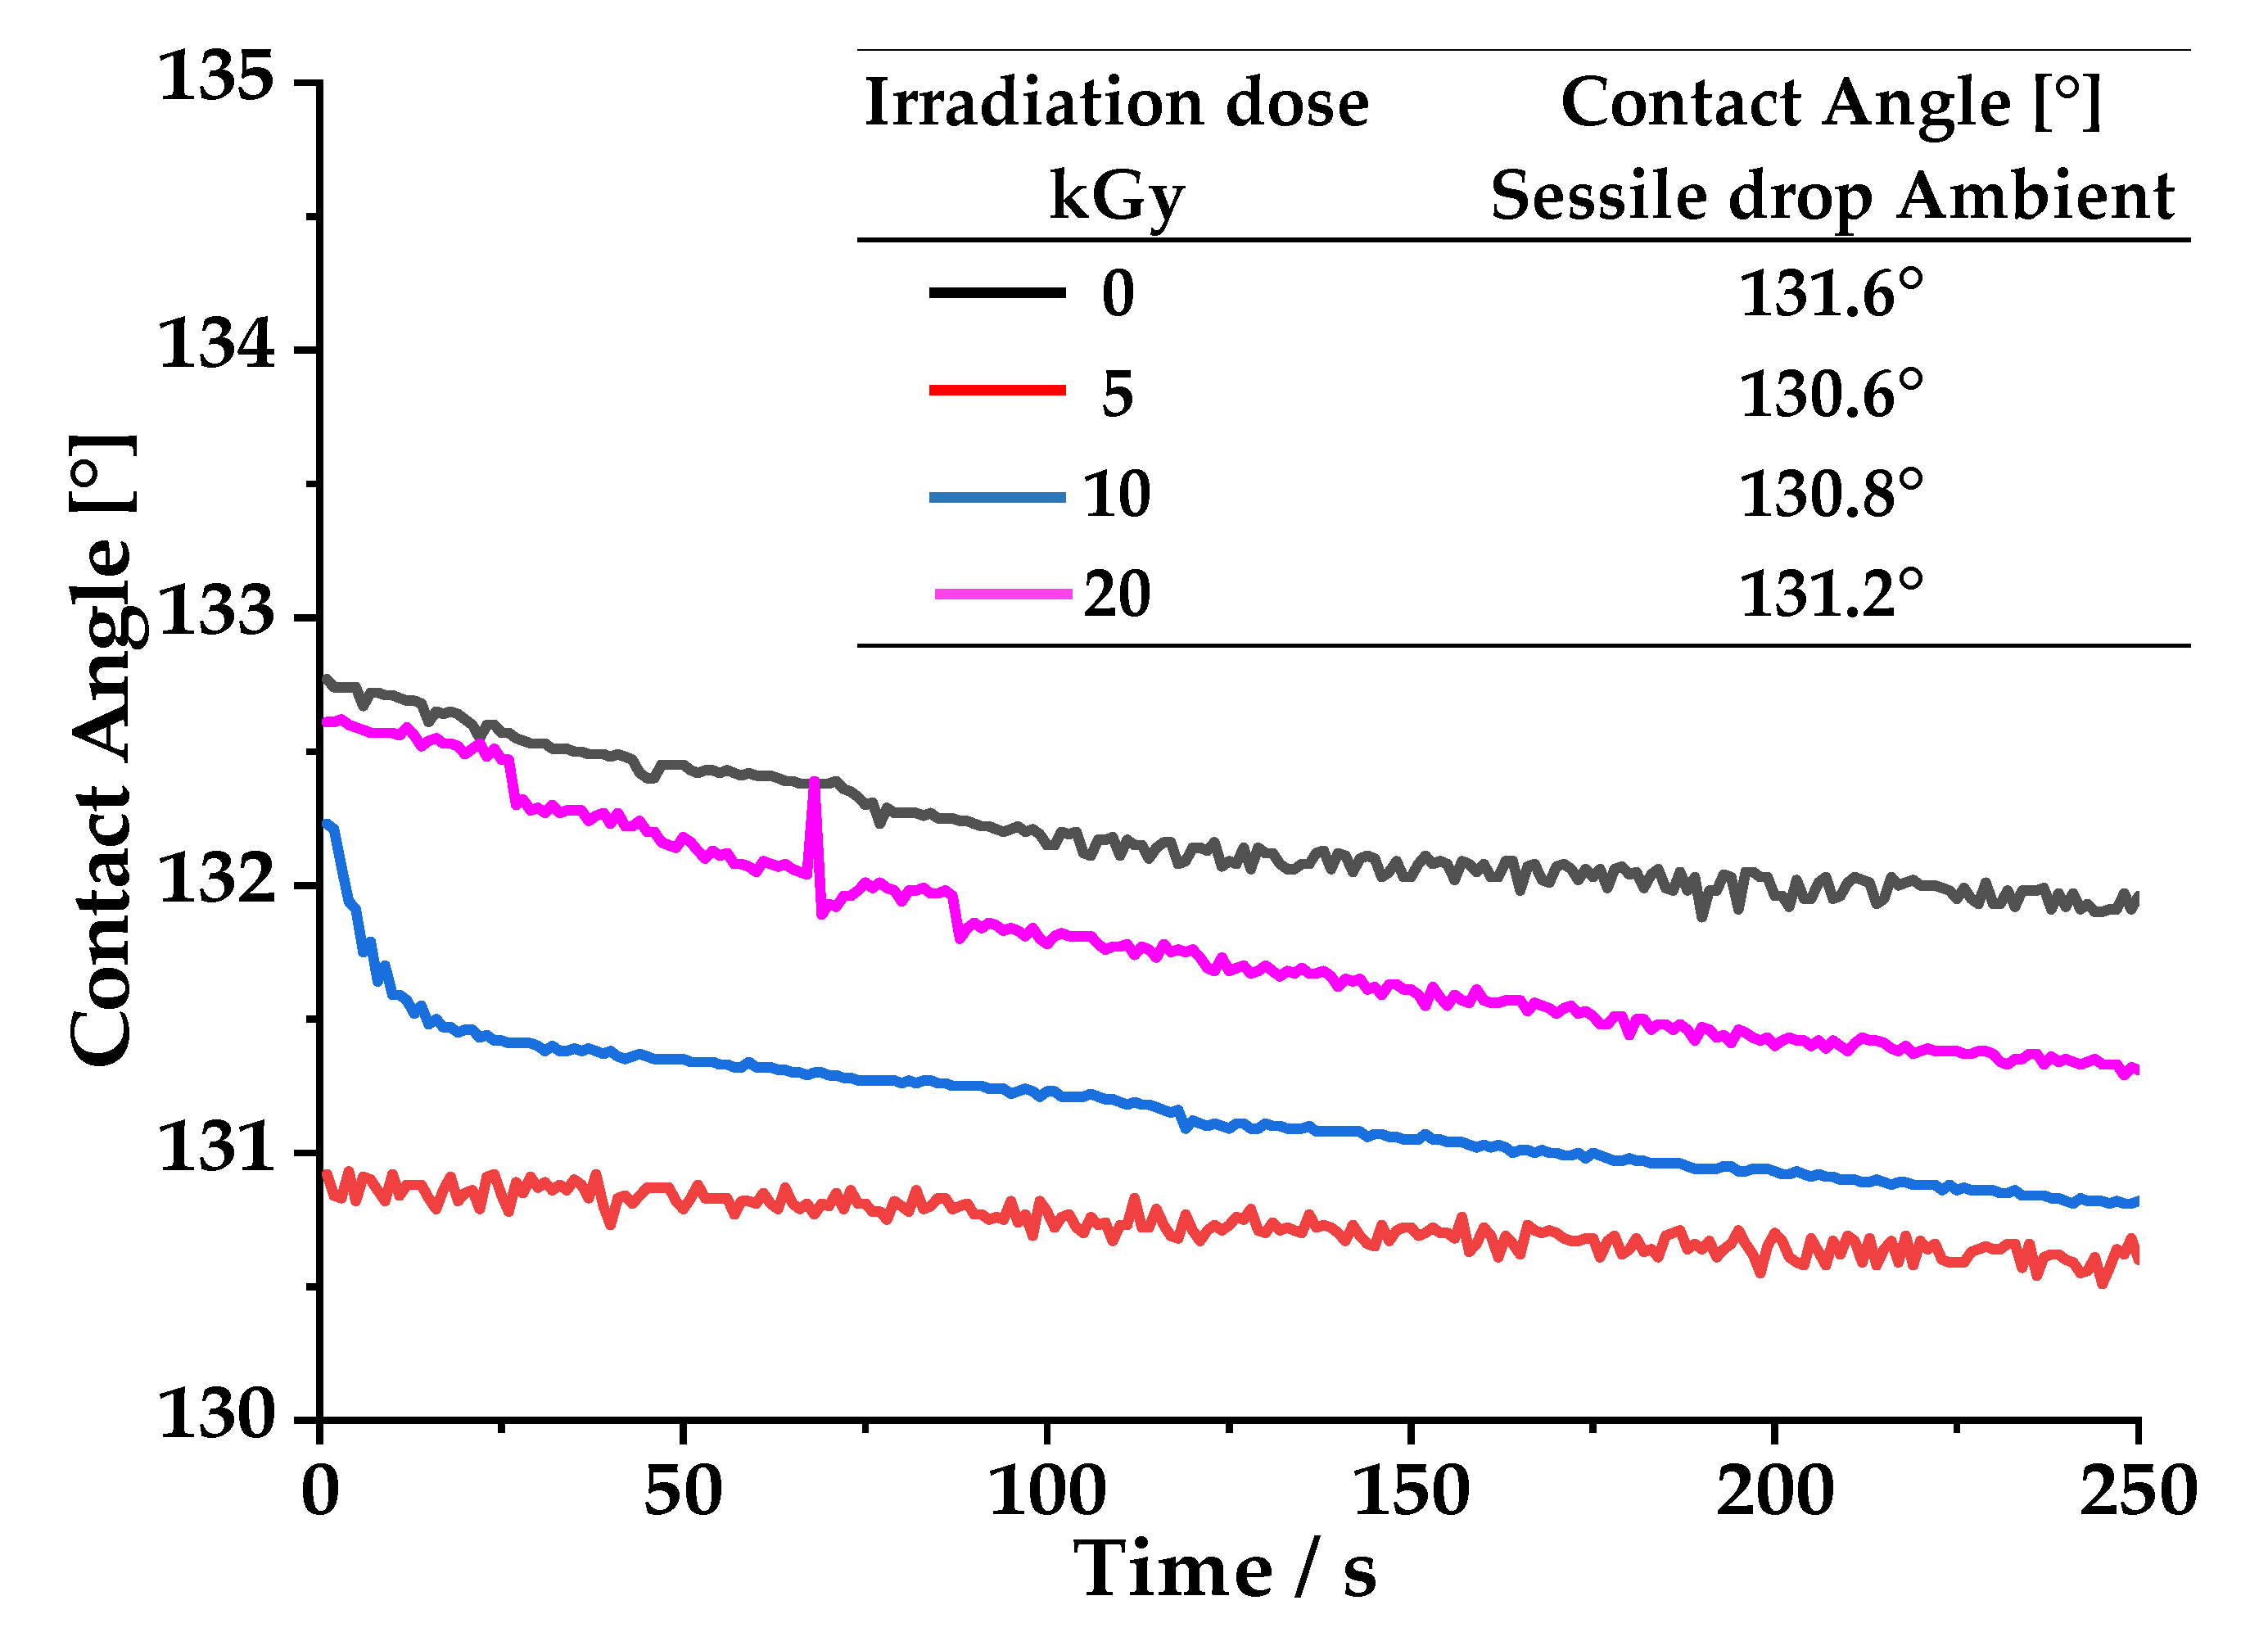
3.5. Contact Angles
4. Discussion
4.1. X-ray Diffraction, Band Gap by DRS and FTIR Spectroscopy
4.2. Effect of Irradiation on Heterogeneous Photocatalysis
4.3. Effect of Irradiation Dose on Adsorption
4.4. Contac Angle
4.5. Mineralization
5. Conclusions
Author Contributions
Funding
Acknowledgments
Conflicts of Interest
References
- Reza, K.M.; Kurny, A.; Gulshan, F. Parameters affecting the photocatalytic degradation of dyes using TiO2: A review. Appl. Water Sci. 2017, 7, 1569–1578. [Google Scholar] [CrossRef] [Green Version]
- Kordouli, E.; Bourikas, K.; Lycourghiotis, A.; Kordulis, C. The mechanism of azo-dyes adsorption on the titanium dioxide surface and their photocatalytic degradation over samples with various anatase/rutile ratios. Catal. Today 2015, 252, 128–135. [Google Scholar] [CrossRef]
- Bafana, A.; Devi, S.S.; Chakrabarti, T. Azo dyes: Past, present and the future. Environ. Rev. 2011, 19, 350–371. [Google Scholar] [CrossRef]
- Denisov, E.T.; Denisova, T.G.; Pokidova, T.S. Handbook of Free Radical Initiators; John Wiley & Sons: Hoboken, NJ, USA, 2005; ISBN 0471281832. [Google Scholar]
- Nigam, P.; Banat, I.M.; Singh, D.; Marchant, R. Microbial process for the decolorization of textile effluent containing azo, diazo and reactive dyes. Process Biochem. 1996, 31, 435–442. [Google Scholar] [CrossRef]
- Poyatos, J.M.; Muñio, M.M.; Almecija, M.C.; Torres, J.C.; Hontoria, E.; Osorio, F. Advanced Oxidation Processes for Wastewater Treatment: State of the Art. Water Air Soil Pollut. 2010, 205, 187. [Google Scholar] [CrossRef]
- Topaç, F.O.; Dindar, E.; Uçaroğlu, S.; Başkaya, H.S. Effect of a sulfonated azo dye and sulfanilic acid on nitrogen transformation processes in soil. J. Hazard. Mater. 2009, 170, 1006–1013. [Google Scholar] [CrossRef]
- Bayramoğlu, G.; Arıca, M.Y. Biosorption of benzidine based textile dyes “Direct Blue 1 and Direct Red 128” using native and heat-treated biomass of Trametes versicolor. J. Hazard. Mater. 2007, 143, 135–143. [Google Scholar] [CrossRef]
- Oturan, M.A.; Aaron, J.-J. Advanced oxidation processes in water/wastewater treatment: Principles and applications. A review. Crit. Rev. Environ. Sci. Technol. 2014, 44, 2577–2641. [Google Scholar] [CrossRef]
- Nevárez-Martínez, M.C.; Espinoza-Montero, P.; Quiroz-Chávez, F.; Ohtani, B. Fotocatálisis: Inicio, actualidad y perspectivas a través del TiO2. Av. Química 2017, 12, 45–59. [Google Scholar]
- Daghrir, R.; Drogui, P.; Robert, D. Modified TiO2 for environmental photocatalytic applications: A review. Ind. Eng. Chem. Res. 2013, 52, 3581–3599. [Google Scholar] [CrossRef]
- Picho-Chillán, G.; Dante, R.C.; Muñoz-Bisesti, F.; Martín-Ramos, P.; Chamorro-Posada, P.; Vargas-Jentzsch, P.; Sánchez-Arévalo, F.M.; Sandoval-Pauker, C.; Rutto, D. Photodegradation of Direct Blue 1 azo dye by polymeric carbon nitride irradiated with accelerated electrons. Mater. Chem. Phys. 2019, 237, 121878. [Google Scholar] [CrossRef]
- Lambert, J.; Vega, M.M.; Isarain-Chavez, E.; Peralta-Hernandez, J.M. Ozone and electrocoagulation processes for treatment of dye in leather industry wastewater: A comparative study. IJ Emerg. Technol. Adv. Eng. 2011, 3, 1–9. [Google Scholar]
- Sugiarto, A.T.; Ohshima, T.; Sato, M. Advanced oxidation processes using pulsed streamer corona discharge in water. Thin Solid Films 2002, 407, 174–178. [Google Scholar] [CrossRef]
- Mohammed, A.K.; Mckenzie, K.T. Photocatalityc degradation of Chicago Sky Blue 6B and Benzopurpurin 4B using titanium dioxide thin film. J. Environ. Sci. 2005, 17, 869–872. [Google Scholar]
- Sandoval, C.; Molina, G.; Jentzsch, P.V.; Pérez, J.; Munoz, F. Photocatalytic degradation of azo dyes over semiconductors supported on polyethylene terephthalate and polystyrene substrates. J. Adv. Oxid. Technol. 2017, 20. [Google Scholar] [CrossRef] [Green Version]
- Yazhini, K.B.; Savitha, K.U.; Prabu, H.G. Photocatalytic Degradation of Dyes using Rutile TiO2-Pani Composite Prepared by One Pot Method. Environ. Pollut. Control Res. 2014, 1, 1–6. [Google Scholar]
- Dante, R.C.; Sánchez-Arévalo, F.M.; Huerta, L.; Muñoz-Bisesti, F.; Marquez, D.; Martín-Ramos, P.; Lartundo-Rojas, L.; Chamorro-Posada, P.; Solorza-Feria, O. Photocatalytic activity of a new composite material of Fe (III) oxide nanoparticles wrapped by a matrix of polymeric carbon nitride and amorphous carbon. Fuller. Nanotub. Carbon Nanostruct. 2017, 25, 630–636. [Google Scholar] [CrossRef]
- ten Brink, H.B.; Dekker, H.L.; Schoemaker, H.E.; Wever, R. Oxidation reactions catalyzed by vanadium chloroperoxidase from Curvularia inaequalis. J. Inorg. Biochem. 2000, 80, 91–98. [Google Scholar] [CrossRef]
- Noman, M.; Shahid, M.; Ahmed, T.; Niazi, M.B.K.; Hussain, S.; Song, F.; Manzoor, I. Use of biogenic copper nanoparticles synthesized from a native Escherichia sp. as photocatalysts for azo dye degradation and treatment of textile effluents. Environ. Pollut. 2020, 257, 113514. [Google Scholar] [CrossRef]
- Prasad, A.S.A.; Satyanarayana, V.S.V.; Rao, K.V.B. Biotransformation of Direct Blue 1 by a moderately halophilic bacterium Marinobacter sp. strain HBRA and toxicity assessment of degraded metabolites. J. Hazard. Mater. 2013, 262, 674–684. [Google Scholar] [CrossRef] [PubMed]
- Kaushik, C.P.; Tuteja, R.; Kaushik, N.; Sharma, J.K. Minimization of organic chemical load in direct dyes effluent using low cost adsorbents. Chem. Eng. J. 2009, 155, 234–240. [Google Scholar] [CrossRef]
- Mahmood, F.; Shahid, M.; Hussain, S.; Shahzad, T.; Tahir, M.; Ijaz, M.; Hussain, A.; Mahmood, K.; Imran, M.; Babar, S.A.K. Potential plant growth-promoting strain Bacillus sp. SR-2-1/1 decolorized azo dyes through NADH-ubiquinone: Oxidoreductase activity. Bioresour. Technol. 2017, 235, 176–184. [Google Scholar] [CrossRef] [PubMed]
- Karagoz, B.; Bayramoglu, G.; Altintas, B.; Bicak, N.; Arica, M.Y. Amine functional monodisperse microbeads via precipitation polymerization of N-vinyl formamide: Immobilized laccase for benzidine based dyes degradation. Bioresour. Technol. 2011, 102, 6783–6790. [Google Scholar] [CrossRef]
- Schliephake, K.; Mainwaring, D.E.; Lonergan, G.T.; Jones, I.K.; Baker, W.L. Transformation and degradation of the disazo dye Chicago Sky Blue by a purified laccase from Pycnoporus cinnabarinus. Enzym. Microb. Technol. 2000, 27, 100–107. [Google Scholar] [CrossRef]
- Mendes, S.; Farinha, A.; Ramos, C.G.; Leitão, J.H.; Viegas, C.A.; Martins, L.O. Synergistic action of azoreductase and laccase leads to maximal decolourization and detoxification of model dye-containing wastewaters. Bioresour. Technol. 2011, 102, 9852–9859. [Google Scholar] [CrossRef]
- Saraya, M.E.-S.I.; Aboul-Fetouh, M.E.-S.; Nassar, H.S.; Abd-El-Rahman, A.M. Removal of direct dyes with cement kiln dust. J. Mater. Sci. Eng. B 2011, 1, 97. [Google Scholar]
- Zaleska, A. Doped-TiO2: A review. Recent Pat. Eng. 2008, 2, 157–164. [Google Scholar] [CrossRef]
- Kim, M.J.; Kim, K.-D.; Tai, W.S.; Seo, H.O.; Luo, Y.; Kim, Y.D.; Lee, B.C.; Park, O.K. Enhancement of Photocatalytic Activity of TiO2 by High-Energy Electron-Beam Treatment Under Atmospheric Pressure. Catal. Lett. 2010, 135, 57–61. [Google Scholar] [CrossRef]
- Latthe, S.S.; An, S.; Jin, S.; Yoon, S.S. High energy electron beam irradiated TiO2 photoanodes for improved water splitting. J. Mater. Chem. A 2013, 1, 13567–13575. [Google Scholar] [CrossRef]
- Köferstein, R.; Jäger, L.; Ebbinghaus, S.G. Magnetic and optical investigations on LaFeO3 powders with different particle sizes and corresponding ceramics. Solid State Ion. 2013, 249, 1–5. [Google Scholar] [CrossRef] [Green Version]
- Nowak, E.; Combes, G.; Stitt, E.H.; Pacek, A.W. A comparison of contact angle measurement techniques applied to highly porous catalyst supports. Powder Technol. 2013, 233, 52–64. [Google Scholar] [CrossRef]
- Braginsky, L.; Shklover, V. Light absorption in TiO2 nanoparticles. In The European Physical Journal D; Springer: Berlin, Germany, 1999; pp. 627–630. [Google Scholar]
- Reddy, S.S.; Kotaiah, B. Decolorization of simulated spent reactive dye bath using solar/TiO2/H2O2. Int. J. Environ. Sci. Technol. 2005, 2, 245–251. [Google Scholar] [CrossRef] [Green Version]
- Rodríguez Mora, J.A. Estudio del Efecto del Uso de Dióxido de Titanio Asistido con Carbón Activado, Obtenido a Partir de un Residuo Industrial, en la Foto-Degradación del Colorante Azul BRL; EPN: Quito, Ecuador, 2016. [Google Scholar]
- Konstantinou, I.K.; Albanis, T.A. TiO2-assisted photocatalytic degradation of azo dyes in aqueous solution: Kinetic and mechanistic investigations. Appl. Catal. B Environ. 2004, 49, 1–14. [Google Scholar] [CrossRef]
- Thamaphat, K.; Limsuwan, P.; Ngotawornchai, B. Phase characterization of TiO2 powder by XRD and TEM. Kasetsart J. (Nat. Sci.) 2008, 42, 357–361. [Google Scholar]
- Lamo, M.P.B.; Williams, P.; Reece, P.; Lumpkin, G.R.; Sheppard, L.R. Study of gamma irradiation effect on commercial TiO2 photocatalyst. Appl. Radiat. Isot. 2014, 89, 25–29. [Google Scholar] [CrossRef]
- Hou, X.G.; Gu, X.N.; Hu, Y.; Zhang, J.F.; Liu, A.D. Enhanced Pt/TiO2 thin films prepared by electron beam irradiation. Nucl. Instrum. Methods Phys. Res. Sect. B Beam Interact. Mater. At. 2006, 251, 429–434. [Google Scholar] [CrossRef]
- Hou, X.G.; Liu, A.D. Modification of photocatalytic TiO2 thin films by electron beam irradiation. Radiat. Phys. Chem. 2008, 77, 345–351. [Google Scholar] [CrossRef]
- Jun, J.; Dhayal, M.; Shin, J.H.; Kim, J.C.; Getoff, N. Surface properties and photoactivity of TiO2 treated with electron beam. Radiat. Phys. Chem. 2006, 75, 583–589. [Google Scholar] [CrossRef]
- Du, P.; Bueno-López, A.; Verbaas, M.; Almeida, A.R.; Makkee, M.; Moulijn, J.A.; Mul, G. The effect of surface OH-population on the photocatalytic activity of rare earth-doped P25-TiO2 in methylene blue degradation. J. Catal. 2008, 260, 75–80. [Google Scholar] [CrossRef]
- Warren, D.S.; McQuillan, A.J. Influence of adsorbed water on phonon and UV-induced IR absorptions of TiO2 photocatalytic particle films. J. Phys. Chem. B 2004, 108, 19373–19379. [Google Scholar] [CrossRef]
- Martra, G.; Coluccia, S.; Marchese, L.; Augugliaro, V.; Loddo, V.; Palmisano, L.; Schiavello, M. The role of H2O in the photocatalytic oxidation of toluene in vapour phase on anatase TiO2 catalyst: A FTIR study. Catal. Today 1999, 53, 695–702. [Google Scholar] [CrossRef]
- Sakthivel, S.; Kisch, H. Daylight Photocatalysis by Carbon-Modified Titanium Dioxide. Angew. Chem. Int. Ed. 2003, 42, 4908–4911. [Google Scholar] [CrossRef] [PubMed]
- Moulder, J.F.; Stickle, W.F.; Sobol, P.E.; Bomben, K.D.; Chastain, J. Handbook of X-ray Photoelectron Spectroscopy AReference Book of Standard Spectra for Identification and Interpretation of XPS Data; Physical Electronics: Chanhassen, MN, USA, 1995. [Google Scholar]
- Giles, C.H.; Smith, D.; Huitson, A. A general treatment and classification of the solute adsorption isotherm. I. Theoretical. J. Colloid Interface Sci. 1974, 47, 755–765. [Google Scholar] [CrossRef]
- Asenjo, V.N.G. Una Nueva Generación de Carbones Activados de Altas Prestaciones Para Aplicaciones Medioambientales. Ph.D. Thesis, Universidad de Oviedo, Oviedo, Spain, 2014. [Google Scholar]
- Voudrias, E.; Fytianos, K.; Bozani, E. Sorption–desorption isotherms of dyes from aqueous solutions and wastewaters with different sorbent materials. Glob. NEST Int. J. 2002, 4, 75–83. [Google Scholar]
- Zhang, Z.; Wang, C.-C.; Zakaria, R.; Ying, J.Y. Role of particle size in nanocrystalline TiO2-based photocatalysts. J. Phys. Chem. B 1998, 102, 10871–10878. [Google Scholar] [CrossRef]
- Lamour, G.; Hamraoui, A.; Buvailo, A.; Xing, Y.; Keuleyan, S.; Prakash, V.; Eftekhari-Bafrooei, A.; Borguet, E. Contact angle measurements using a simplified experimental setup. J. Chem. Educ. 2010, 87, 1403–1407. [Google Scholar] [CrossRef]
- Kim, M.S.; Jo, W.J.; Lee, D.; Baeck, S.; Shin, J.H.; Lee, B.C. Enhanced Photocatalytic Activity of TiO2 Modified by e-Beam Irradiation. Bull. Korean Chem. Soc. 2013, 34, 1397–1400. [Google Scholar] [CrossRef] [Green Version]
- Guan, K. Relationship between photocatalytic activity, hydrophilicity and self-cleaning effect of TiO2/SiO2 films. Surf. Coat. Technol. 2005, 191, 155–160. [Google Scholar] [CrossRef]
- Fujishima, A.; Rao, T.N.; Tryk, D.A. Titanium dioxide photocatalysis. J. Photochem. Photobiol. C Photochem. Rev. 2000, 1, 1–21. [Google Scholar] [CrossRef]
- Lee, Y.C.; Hong, Y.P.; Lee, H.Y.; Kim, H.; Jung, Y.J.; Ko, K.H.; Jung, H.S.; Hong, K.S. Photocatalysis and hydrophilicity of doped TiO2 thin films. J. Colloid Interface Sci. 2003, 267, 127–131. [Google Scholar] [CrossRef]
- Jimmy, C.Y.; Yu, J.; Ho, W.; Zhao, J. Light-induced super-hydrophilicity and photocatalytic activity of mesoporous TiO2 thin films. J. Photochem. Photobiol. A Chem. 2002, 148, 331–339. [Google Scholar]
- Karkmaz, M.; Puzenat, E.; Guillard, C.; Herrmann, J.M. Photocatalytic degradation of the alimentary azo dye amaranth: Mineralization of the azo group to nitrogen. Appl. Catal. B Environ. 2004, 51, 183–194. [Google Scholar] [CrossRef]
- Koch, M.; Yediler, A.; Lienert, D.; Insel, G.; Kettrup, A. Ozonation of hydrolyzed azo dye reactive yellow 84 (CI). Chemosphere 2002, 46, 109–113. [Google Scholar] [CrossRef]
- Neamţu, M.; Zaharia, C.; Catrinescu, C.; Yediler, A.; Macoveanu, M.; Kettrup, A. Fe-exchanged Y zeolite as catalyst for wet peroxide oxidation of reactive azo dye Procion Marine H-EXL. Appl. Catal. B Environ. 2004, 48, 287–294. [Google Scholar] [CrossRef]


| Treatment | Operating Conditions | DB1 Concentration | Removal | Other Results | Ref. |
|---|---|---|---|---|---|
| Photocatalysis with C5N4 irradiated | V = 20 mL; pH = 7; catalyst concentration = 100 mg L−1; reactor batch. | 50 mg L−1 | Complete discoloration after 60 min of treatment | Low percentages of mineralization (10%) | [12] |
| Ozonation and electrocoagulation | V = 200 L, Q = 10 L min−1; ozone injection = 5.21 mg min−1; 1100 L tank capacity; ¾ in hydraulic line pipe. V = 1 L; electrode area = 160 cm2; i = 5 mA cm−2; aluminum anodes; iron cathodes. | 50 mg L−1 | 50% color removal after 210 min 99% color removal after 20 min | Electrocoagulation is more economically viable than ozonation, since it promotes greater dye removal and requires less energy consumption | [13] |
| AOPs using pulsed corona discharge from water. | V = 300 mL; Q = 100 mL min−1, peroxide rate = 8.8 × 10⁻⁴ mol L−1, pH = 3.5–10.3; conductivity = 100 µS cm−1 | 10 mg L−1 | 75–80% color removal after 60 min. | The addition of hydrogen peroxide improves the discoloration rate. | [14] |
| Photocatalysis with TiO2 films | V = 250 mL; pH = 2–10; 200 W mercury lamp | 4–10 mg L−1 | 98% degradation after 1800 min at pH = 2 | Decrease 12 to 46% removal of COD at a pH of 2 by varying dye concentration | [15] |
| Photocatalysis with TiO2 and ZnO supported on polystyrene and polyethylene terephthalate | pH = 2.5 y 6 (TiO2) y 7–11 (ZnO), 8 W UV lamps | 50 mg L−1 | 100% degradation after 50 min with the two catalysts | The immobilized catalyst mass reached 0.399 mg cm−3 for TiO2 and 0.689 mg cm−2 for ZnO in PET. The highest photocatalytic degradation was at pH = 2.5 using TiO2. | [16] |
| Photocatalytic degradation using rutile TiO2 | - | - | Discoloration and removal of COD 60% | The rutile activity improves making a composite of it with polyaniline. | [17] |
| Photocatalysis with Fe2O3 compounds, surrounded by C3N4 and amorphous carbon. | V = 20 mL, T = 20 °C; pH = 7; catalyst mass = 50 mg; H2O2 30% solution; 35 W Xe lamp | 500 mg L−1 | Degradation greater than 99% after 50 min with C3N4 and the same value after 35 min with the CN-Fe compound | TOC removal does not exceed 15%. Three cycle catalyst reuses with 99% removal results. | [18] |
| Peroxidase-mediated discoloration | H2O2 concentration = 2.4 mM; nano enzyme concentration = 150 nM | 10 µM L−1 | Complete discoloration of DB1 after three days. | - | [19] |
| Photocatalytic degradation with biogenic copper synthesized from native Escherichia sp | V = 100 mL; catalyst mass = 100 mg; use of solar radiation | 25–100 mg L−1 | Discoloration of 88.42% after 5 h of exposure. | The concentrations of total dissolved solids, COD, hardness, chlorides, sulfates, electrical conductivity, total suspended solids, turbidity, and pH decreased. | [20] |
| Biosorptions using biomass of Trametes versicolor | V = 50 mL; biomass = 250 mg; pH = 2–9; T = 25 °C; batch system | 25–800 mg L−1 | Maximum biosorptions of 101.1 mg g−1 for the native fungus and 152.3 mg g−1 for the treated fungus. | Technology projection on a large scale. | [8] |
| Biotransformation by Marinonacter sp | V = 100 mL; T = 37 °C; pH = 8; concentration NaCl = 70 g L−1 | 100 mg L−1 | Complete discoloration after 6 h | Less toxicity of the metabolites with respect to the dye. | [21] |
| Adsorption, using low-cost adsorbents | V = 50 mL; T = 28 ± 2 °C; batch mode; | 21% | Appreciable decrease in COD (70–90%) in samples treated for 1 h. | Cane bagasse is better absorbent than sawdust by 10% and brick dust by 25% | [22] |
| Discoloration by Bacillus sp | NaCl concentration = 0–9%, pH = 5–9; T = 20–35 °C | 150 mg L−1 | 47% discoloration after 24 h, 57% after 48 h and 73% after 72 h, all at pH = 7 | The discoloration for the treatment in which the initial concentration was 25 mg L–l, was 25.10% and 29.51% higher, for 1 h and 5 h, respectively. | [23] |
| Degradation by laccase | V = 10 mL; laccase mass = 0.5 g; T = 30 °C | 50 mg L−1 | 54 and 68% degradation for 18 h for the free and immobilized enzyme, respectively. | - | [24] |
| Discoloration by laccase from Pycnoporus cinnabarinus | V = 3.1 mL; pH = 4.9; laccase mass = 0.82–25 µg | 25 mg L−1 | The disappearance of the dye is confirmed after contact with oxygen. | - | [25] |
| Degradation by azoreductase and laccase | - | 0.6 mol L−1 | 80% discoloration after 24 h. | Production of toxic by-products in some cases, for example 3,3 dimethoxybenzidine in the case of DB1. | [26] |
| Adsorption using cement kiln powder | V = 250 mL, cement mass = g; Stirring speed = rpm | 800 mg L−1 | The removal is greater than the one carried out with activated carbon. | When washing the cement with colorant, it does not return to the water. | [27] |
| Radiation Dose (kGy) | Constant Rate | r2 |
|---|---|---|
| Not irradiated | 0.0661 | 0.8826 |
| 5 | 0.0677 | 0.9273 |
| 10 | 0.0742 | 0.9818 |
| 20 | 0.0715 | 0.9644 |
| Doses (kGy) | Parameters | ||
|---|---|---|---|
| r2 | Kf (mg g−1) | N | |
| 0 | 0.947 | 1.897 | 0.959 |
| 5 | 0.970 | 2.913 | 1.047 |
| 10 | 0.968 | 1.810 | 0.981 |
| 20 | 0.945 | 2.962 | 1.084 |
| Doses kGy | %TOC |
|---|---|
| 0 | 2.48 |
| 10 | 1.61 |
© 2020 by the authors. Licensee MDPI, Basel, Switzerland. This article is an open access article distributed under the terms and conditions of the Creative Commons Attribution (CC BY) license (http://creativecommons.org/licenses/by/4.0/).
Share and Cite
Gallegos, E.; Muñoz Bisesti, F.; Vaca-Escobar, K.; Santacruz, C.; Fernández, L.; Debut, A.; Espinoza-Montero, P.J. Degradation of Direct Blue 1 through Heterogeneous Photocatalysis with TiO2 Irradiated with E-Beam. Processes 2020, 8, 1181. https://doi.org/10.3390/pr8091181
Gallegos E, Muñoz Bisesti F, Vaca-Escobar K, Santacruz C, Fernández L, Debut A, Espinoza-Montero PJ. Degradation of Direct Blue 1 through Heterogeneous Photocatalysis with TiO2 Irradiated with E-Beam. Processes. 2020; 8(9):1181. https://doi.org/10.3390/pr8091181
Chicago/Turabian StyleGallegos, Elvia, Florinella Muñoz Bisesti, Katherine Vaca-Escobar, Cristian Santacruz, Lenys Fernández, Alexis Debut, and Patricio J. Espinoza-Montero. 2020. "Degradation of Direct Blue 1 through Heterogeneous Photocatalysis with TiO2 Irradiated with E-Beam" Processes 8, no. 9: 1181. https://doi.org/10.3390/pr8091181