Article

Characteristics of Gliding Arc Plasma and Its Application in Swirl Flame Static Instability Control

1
Science and Technology on Plasma Dynamics Laboratory, Air Force Engineering University, Xi’an 710038, China
2
Department of Energy and Power Engineering, Tsinghua University, Beijing 100084, China
3
Institute of Aero-Engine, School of Mechanical Engineering, Xi’an Jiaotong University, Xi’an 710049, China
*
Author to whom correspondence should be addressed.
Processes 2020, 8(6), 684; https://doi.org/10.3390/pr8060684
Submission received: 3 May 2020 / Revised: 3 June 2020 / Accepted: 5 June 2020 / Published: 11 June 2020
(This article belongs to the Special Issue Advances in Plasma Diagnostics and Applications)

Abstract

:
Based on an experimental system involving a pulsating airflow burner and gliding arc generator, the characteristics of gliding arc plasma at different flow rates and its control effect on the static instability of the swirl flame have been studied. The current, voltage, and power wave forms, as well as the simultaneous evolution of plasma topology, were measured to reveal the discharge characteristics of the gliding arc. A bandpass filter was used to capture the chemiluminescence of CH in the flame, and pressure at the burner outlet was acquired to investigate the static instability. Experimental results showed that there were two different discharge types in gliding arc plasma. With the low flow rate, the glow type discharge was sustained and the current was nearly a sine wave with hundreds of milliamperes of amplitude. With the high flow rate, the spark type discharge appeared and spikes which approached almost 1 ampere in 1 μs were found in the current waveform. The lean blowout limits increased when the flame mode changed from stable to pulsating, and decreased significantly after applying the gliding arc plasma. In pulsating flow mode, the measured pressure indicated that static instability was generated at the frequency of 10 Hz, and the images of flame with plasma showed that the plasma may have acted as the ignition source which injected the heat into the flame.

1. Introduction

With the development of the aviation industry and the improvement of environmental awareness, exhaust emission standards for NOx, CO, and other contaminants are becoming stricter. Thus, lean premixed combustion technology has been widely adopted in aircraft engine combustion chambers to reduce NOx [1]. However, the instability of premixed flame is severer than that of non-premixed flame. When the aircraft is maneuvering in flight, the air inflow of the combustor may suddenly fluctuate, and the transient equivalence ratio may sharply fall below the lean blowout limit, resulting in flame extinguishment and a threat to flight safety. Consequently, it is crucial to control the instability of the lean premixed flame to improve the reliability of aero-engine combustion chambers.
Adopting swirl flow is the general method for improving flame stability [2]. The swirl flow can generate a recirculation zone which makes the hot burned gas flow back to the bottom of the flame and ignite the fresh air. According to previous research, flame instability can be classified into dynamic instability and static instability [3]. Dynamic instability usually refers to combustion-driven oscillations which involve thermoacoustic coupling and fuel/air wave coupling, while static instability is considered to be related to flame blowout [4]. For example, when the aircraft takes off or lands, the air flowing through the engine will probably be fluctuant, and the flame in the combustor may be extinguished transiently. Then, the thermal energy generated by the combustor will be reduced, causing a decline in the rotational speeds of the turbine and compressor, and the air absorbed by compressor will be reduced accordingly. The reduced air inflow will increase the equivalence ratio and the flame will be reignited. Thus, the flame will go into a cycle of extinguishment and re-ignition, and static instability will be generated. In 1878, Rayleigh proposed a theoretical model of oscillation combustion relating to the interaction of acoustic instability and thermodynamics, which was later summarized as the Rayleigh Criterion. According to the criterion, combustion oscillation usually occurs when the phase difference between the pressure wave and heat release is less than 90° [5]. Based on this research result, more researchers focused on predicting combustion oscillation and developed flame transfer function methods to calculate the resonant frequencies of flame oscillation [6]. Controlling flame instability and then reducing the lean blowout limits was another issue that researchers focused on. The geometry of combustor was the primary parameter that was optimized to achieve the best extinction performance [7]. Then, other passive methods to control the thermoacoustic instability of flame were summarized [8]. Recently, the plasma control method has attracted the attention of many researchers. As a kind of high-temperature and reactive material, plasma has played an important role in assisting combustion [9]. Some researchers applied plasma to supersonic combustion [10,11], turbulent premixed flames [12], and counterflow diffusion flames [13,14,15], and found that plasma had a good effect in ignition and controlling instability. Moreover, many types of discharge methods, such as gliding arc discharges [16,17], nanosecond pulsed discharges [18], microwave discharges [19], and radio frequency discharges [20], proved helpful to combustion.
As non-equilibrium plasma, the gliding arc can produce reactive species in atmospheric pressure easily [21,22] and can be widely used in assisting combustion. The main species generated by the gliding arc contain NO*, N2*, and OH*, and their spatial distributions are quite different [23]. The characteristics of gliding arc plasma and its applications have been investigated by many researchers, but there are few reports applying it in flame instability control.
In this paper, an experimental system was designed whereby the swirl flame was excited by pulsating airflow, and the gliding arc plasma was arranged at the burner outlet so the gas could blow gliding arc out from the electrodes and the swirl flame could interact directly with the gliding arc plasma. The characteristics of the gliding arc, as well as its control effect on the static instability of premixed swirl flame, were investigated experimentally in the research, and an extension of lean blowout limits for the methane–air flame was observed. Specifically, the evolution process of plasma topology in one discharge period was captured firstly, and the voltage, current, and power waveforms were recorded simultaneously, which provided a theoretical basis for controlling the flame static instability by plasma. Then, the lean blowout limits of swirl flame in stable flow mode, pulsating flow mode, and pulsating flow mode with gliding arc plasma were measured, leading to the conclusion that the extinction performance of pulsating flame coupled with plasma was better than that of the pulsating flame or stable flame. Finally, the relationships between pressure and heat release rate of the pulsating flame were measured to explore the mechanism of the static instability.

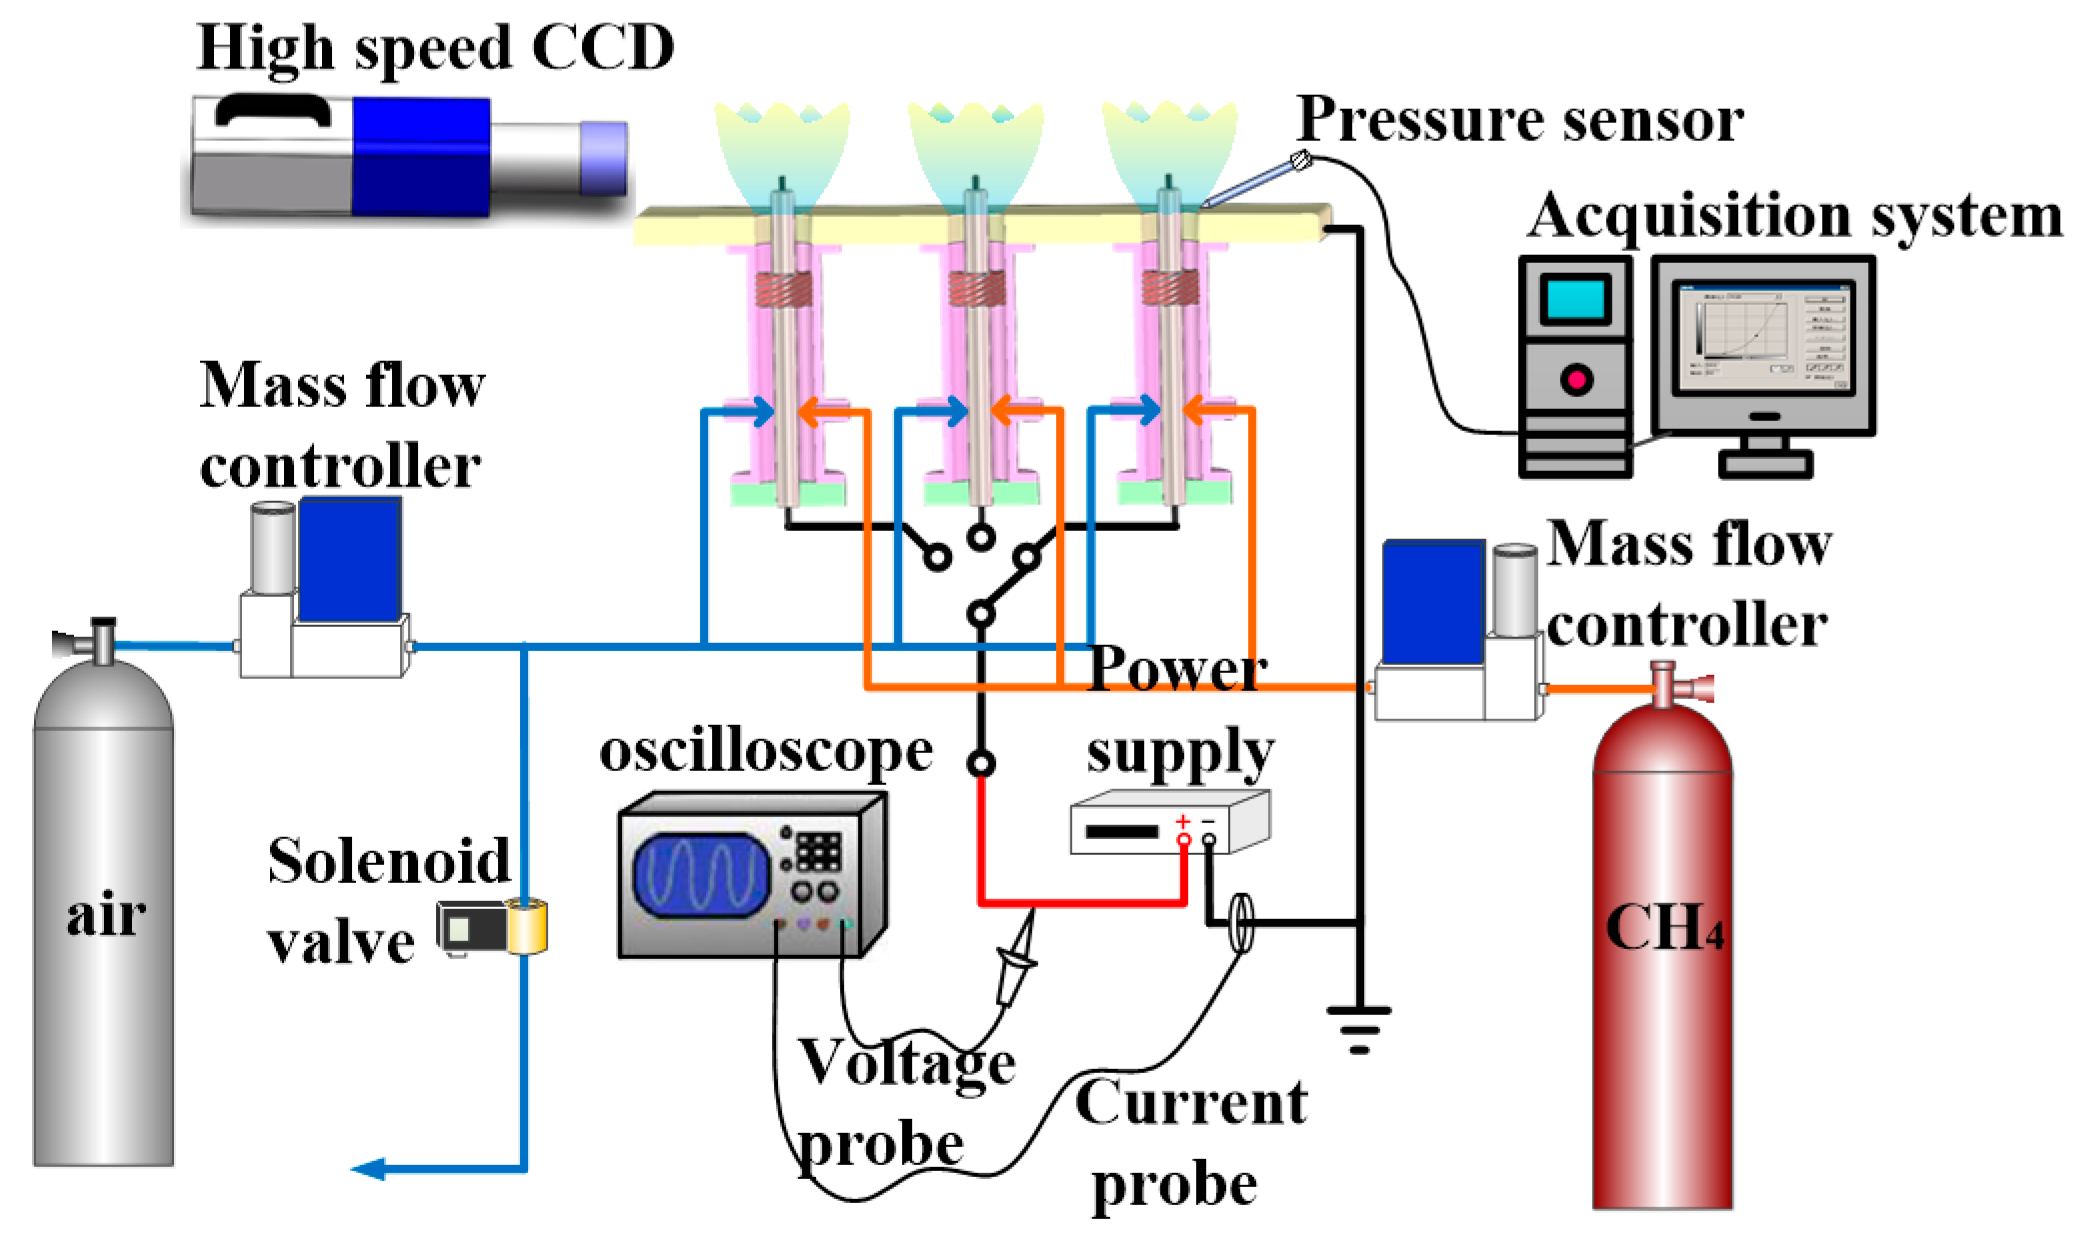
2. Experimental Facility

Figure 1 shows a schematic of experimental system, including the pulsating air flow generator, multi-swirl burner, gliding arc plasma power supply, and other measuring devices.

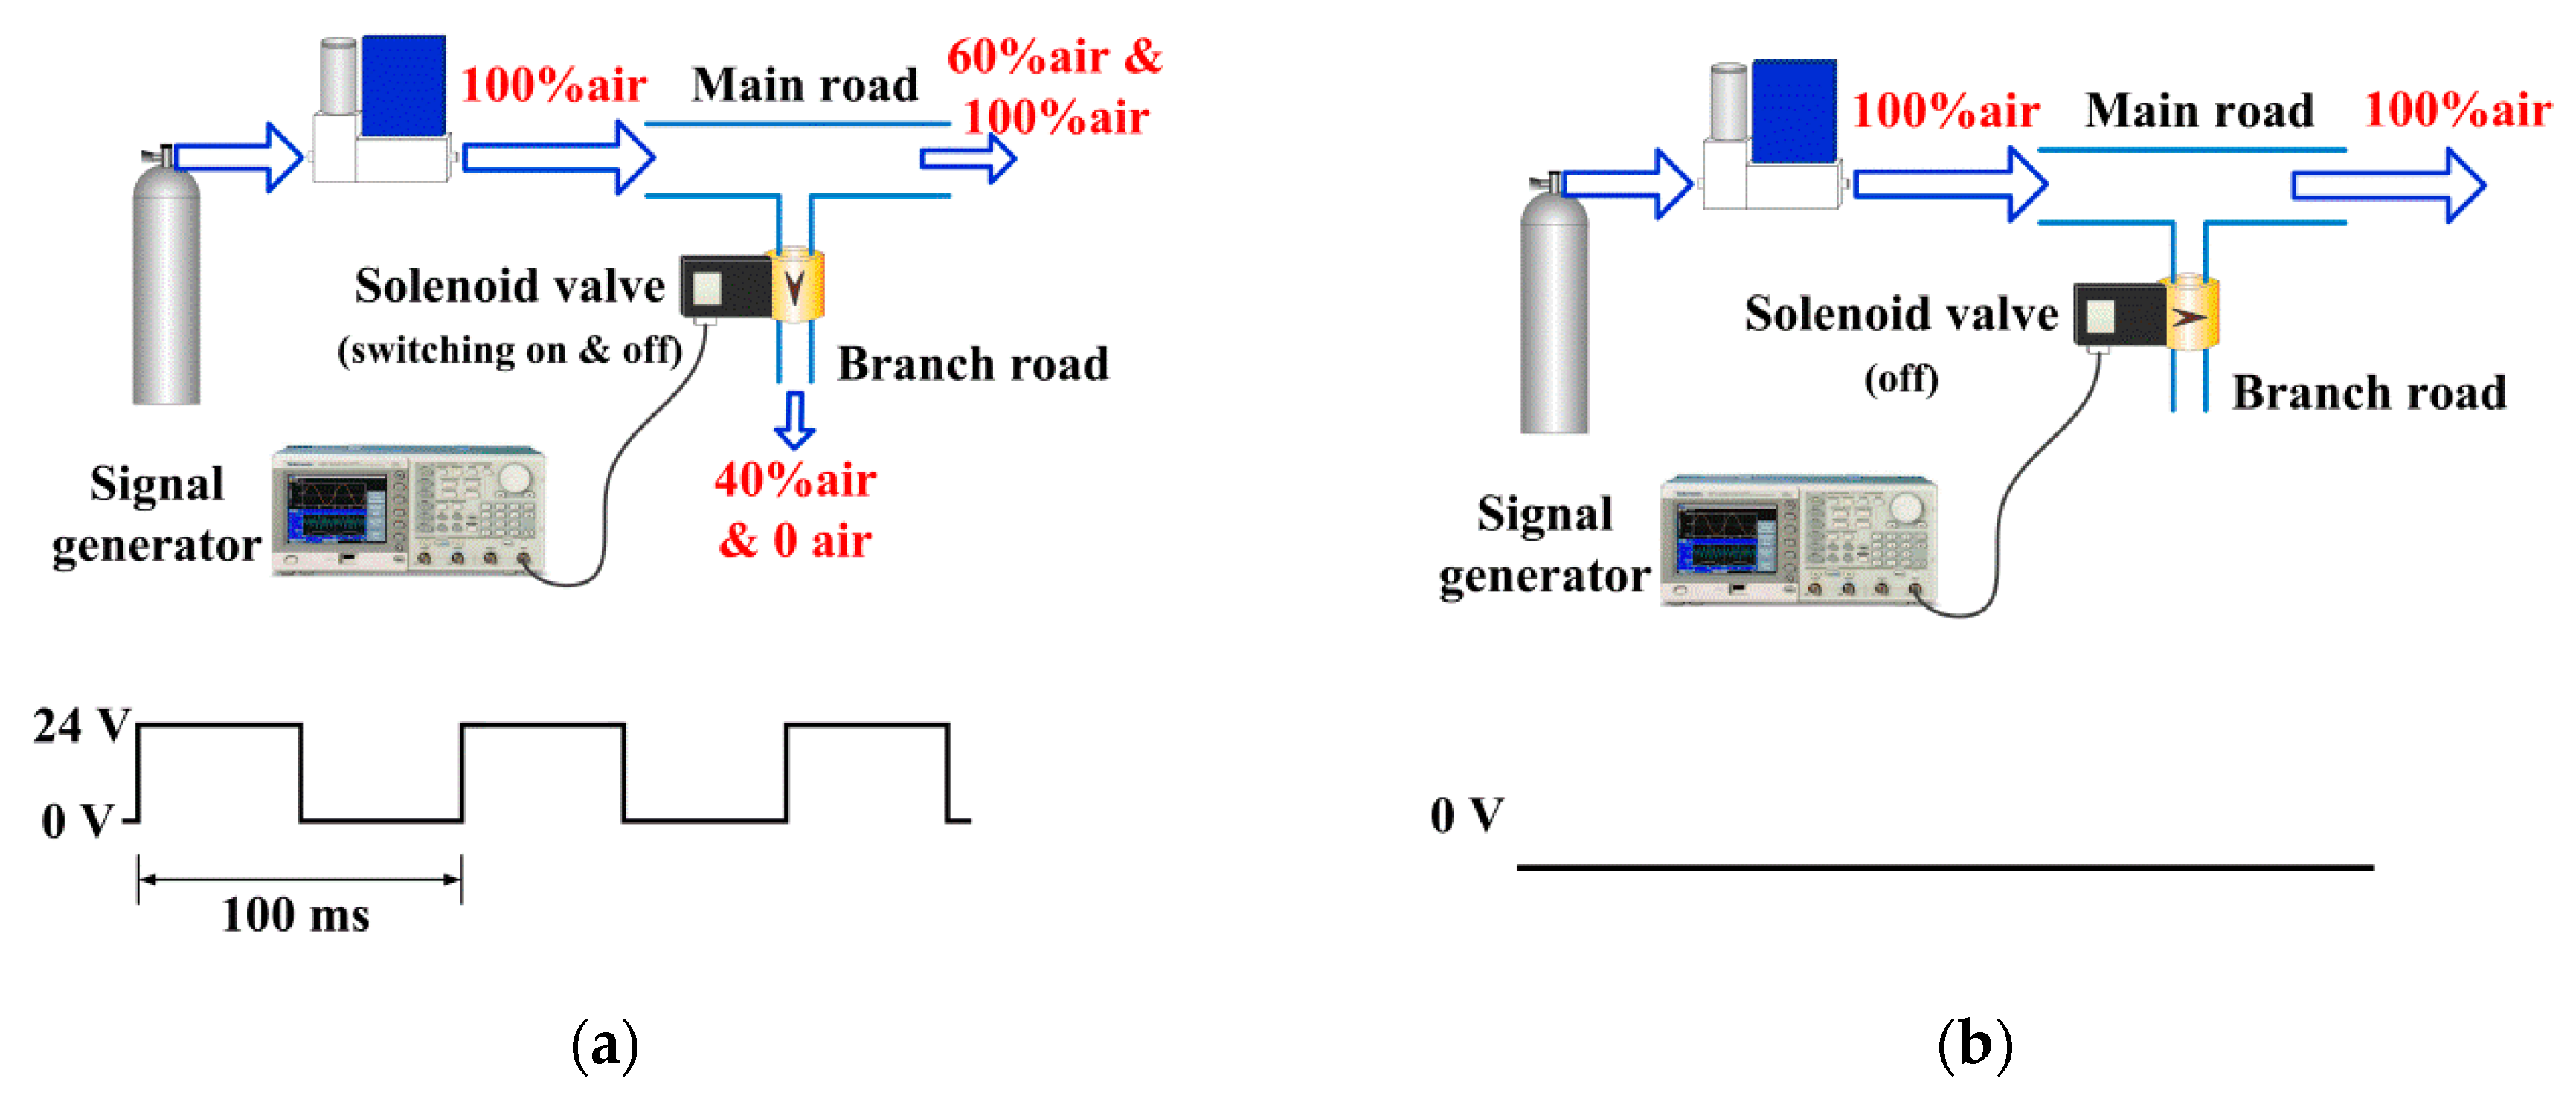
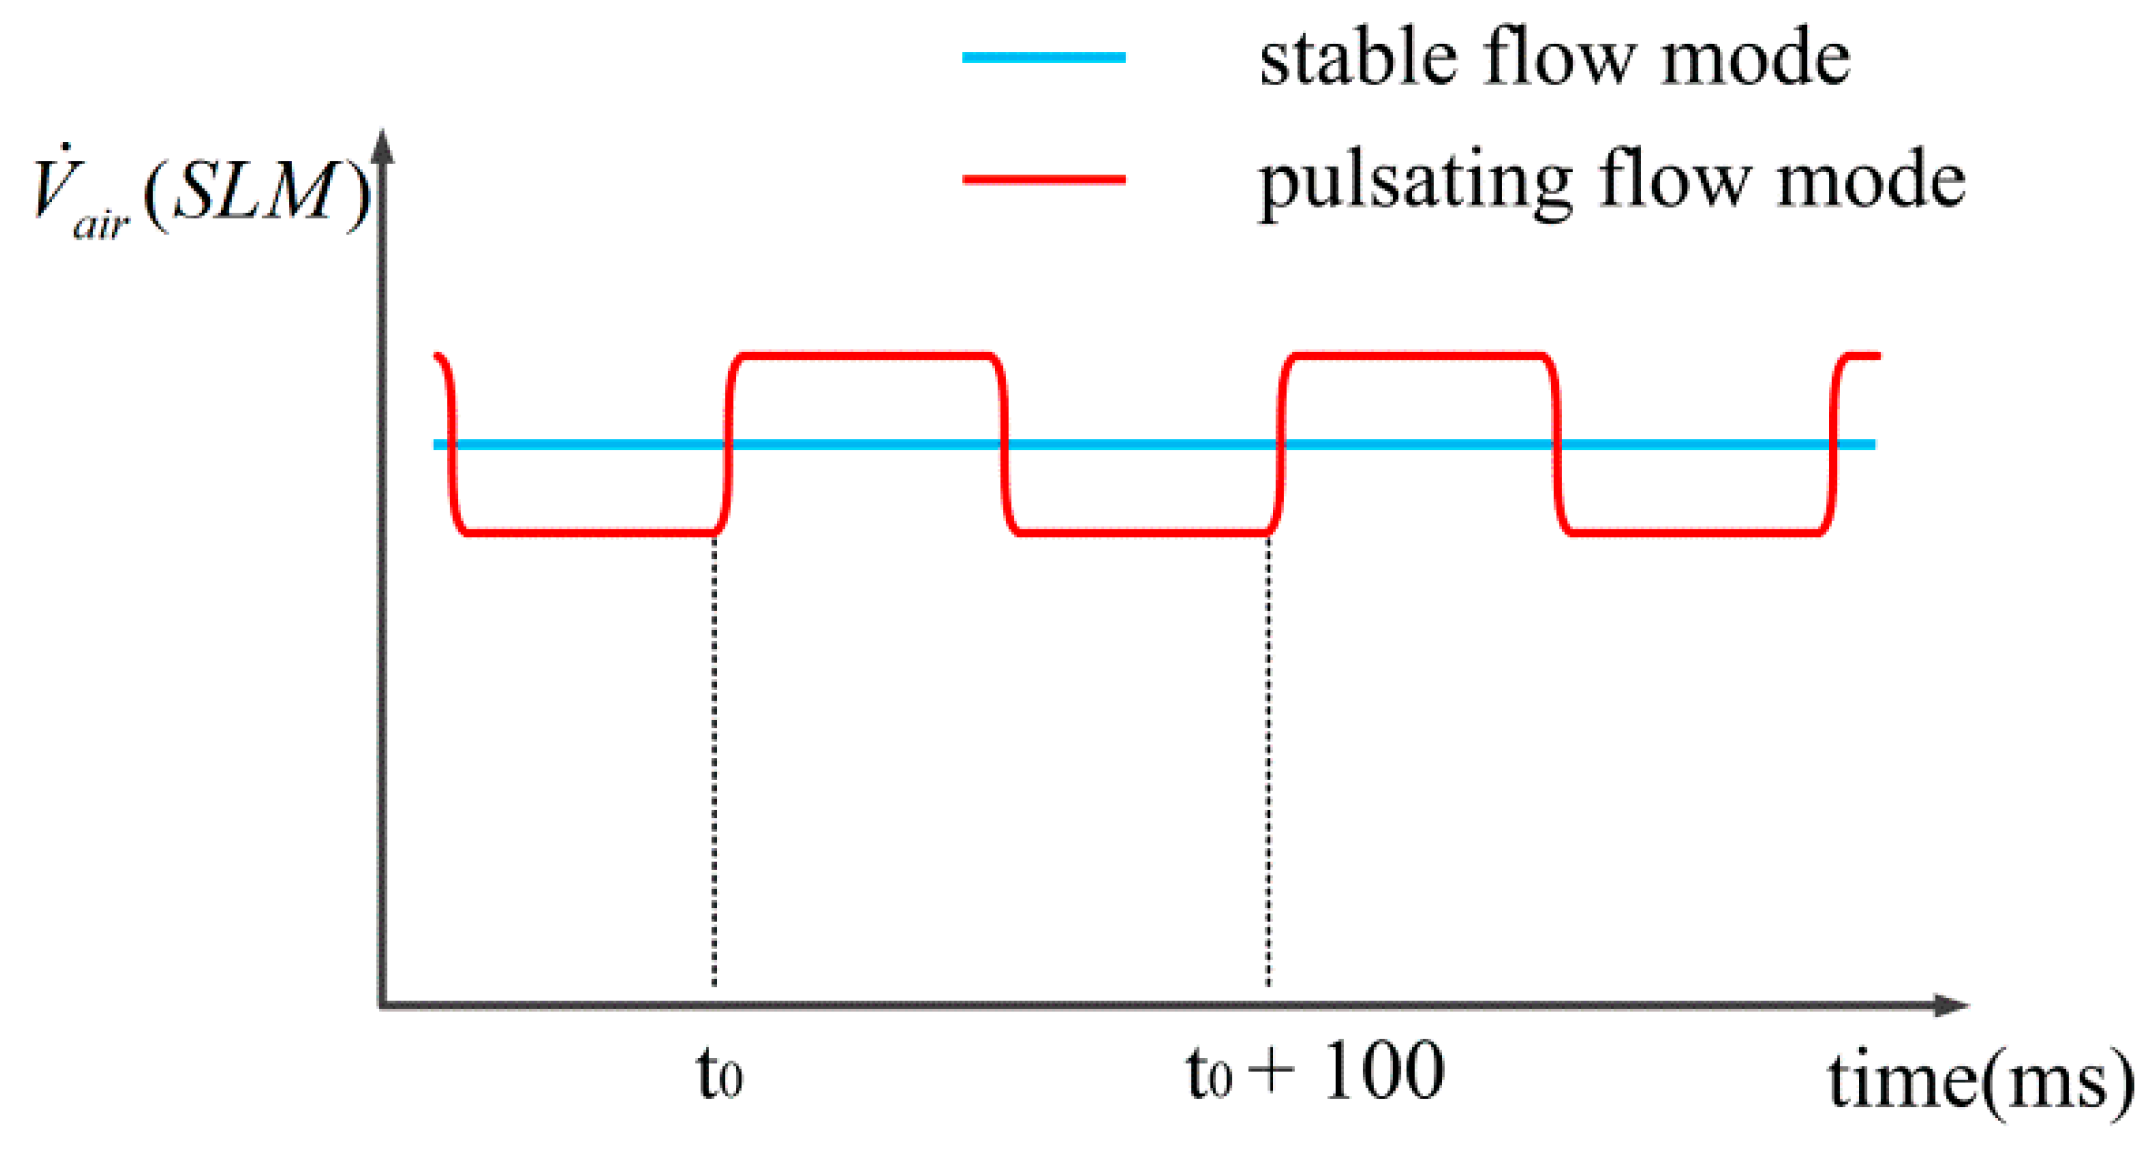
2.1. Pulsating Air Flow Generator

A schematic diagram of the pulsating air flow generator is shown in Figure 2.
The air from high pressure tank firstly went into the mass flow controller (MFC), in which the air flow rate could be exactly controlled. Then it was divided into the main flow and the bypass flow. The main flow entered the multi-burner and was mixed with CH4 to form the swirl flame. The bypass air was injected to the atmosphere without combustion. The flux of the bypass flow was controlled by a solenoid valve. When the solenoid valve was opened completely, the flux of the bypass flow was up to 40% of the total air, which meant only 60% of the air went into the burner as oxidant. When the valve was closed, 100% air could pass through the main route and the equivalence ratio (represented by variable φ), calculated as Formula (1), was lower than with the opened solenoid valve:
φ = ( m ˙ C H 4 / m ˙ a i r ) ( m ˙ C H 4 / m ˙ a i r ) s t o i c = ( m ˙ C H 4 / m ˙ a i r ) 0.058 = ( V ˙ C H 4 ρ C H 4 ) / ( V ˙ a i r ρ C H 4 ) 0.058 = ( V ˙ C H 4 / V ˙ a i r ) S L M 0.104
In Formula (1), m ˙ C H 4 represents the CH4 mass flow rate, and V ˙ C H 4 represents the CH4 volume flow rate. Similarly, the m ˙ a i r represents the air mass flow rate and the V ˙ a i r represents the air volume flow rate. The value of V ˙ C H 4 and V ˙ a i r was recorded by MFCs. The subscript stoic refers to the ratio of CH4: air in the stoichiometric condition, and the subscript SLM (standard liters per minute) is the unit of V ˙ C H 4 or V ˙ a i r . It should be noted that the φ here was calculated from the air and CH4 bottles without consideration of the entrained air from surroundings.
The variation of φ was determined by the solenoid valve. The φ increased when the solenoid valve was closed, while it decreased when the valve was opened. The solenoid valve was controlled by a UNI-TREND UTG2025A signal generator, which output a square wave with the period of 100 ms and amplitude of 0~24 V. When the voltage reached 24 V, the solenoid valve was opened, and the bypass flow (40% of the total air) went into the atmosphere; the remaining flow (60% of the total air) was provided to the burner. When the voltage reached 0 V, the solenoid valve was closed, and 100% of the air flow went through the main route. Thus, the pulsating flow was generated to create an unstable combustion, which was defined as the pulsating flow mode (Figure 2a).
In stable flow mode the signal generator was shut down, meaning that the solenoid valve was closed permanently and the flame was kept steady with 100% of the total air, as shown in Figure 2b.
The φ constantly changed in pulsating flow mode, but in stable flow mode the φ kept steady, so it was difficult to compare the flame extinction between the two modes. In this experiment, the operating condition of pulsating air flow was regarded as being the same as that of stable air flow when the integral of the mass flow rate in pulsating flow mode with one period was equal to the integral of the flow rate in stable flow mode (Formula (2)). Then, the average air flow rate which was provided into the burner in the pulsating flow mode (represented by ( V ˙ ¯ a i r ) p u l s a t i n g ) equaled that in the stable flow mode (represented by ( V ˙ ¯ a i r ) s t a b l e ), even if the instantaneous flow rates in pulsating ( ( V ˙ a i r ) p u l s a t i n g ) and stable ( ( V ˙ a i r ) s t a b l e ) modes were not comparable, as shown in Figure 3. Similarly, the average of φ (represented by φ ¯ ) was calculated as per Formula (3). The response time of the solenoid valve was 2 ms, which could be ignored compared with the 100-ms pulsating period.
( V ˙ ¯ a i r ) s t a b l e = t 0 t 0 + 100 ( V ˙ a i r ) s t a b l e d t 100 = t 0 t 0 + 100 ( V ˙ a i r ) p l u s a t i n g d t 100 = ( V ˙ ¯ a i r ) p l u s a t i n g
φ ¯ = V ˙ ¯ C H 4 / V ˙ ¯ a i r 0.104

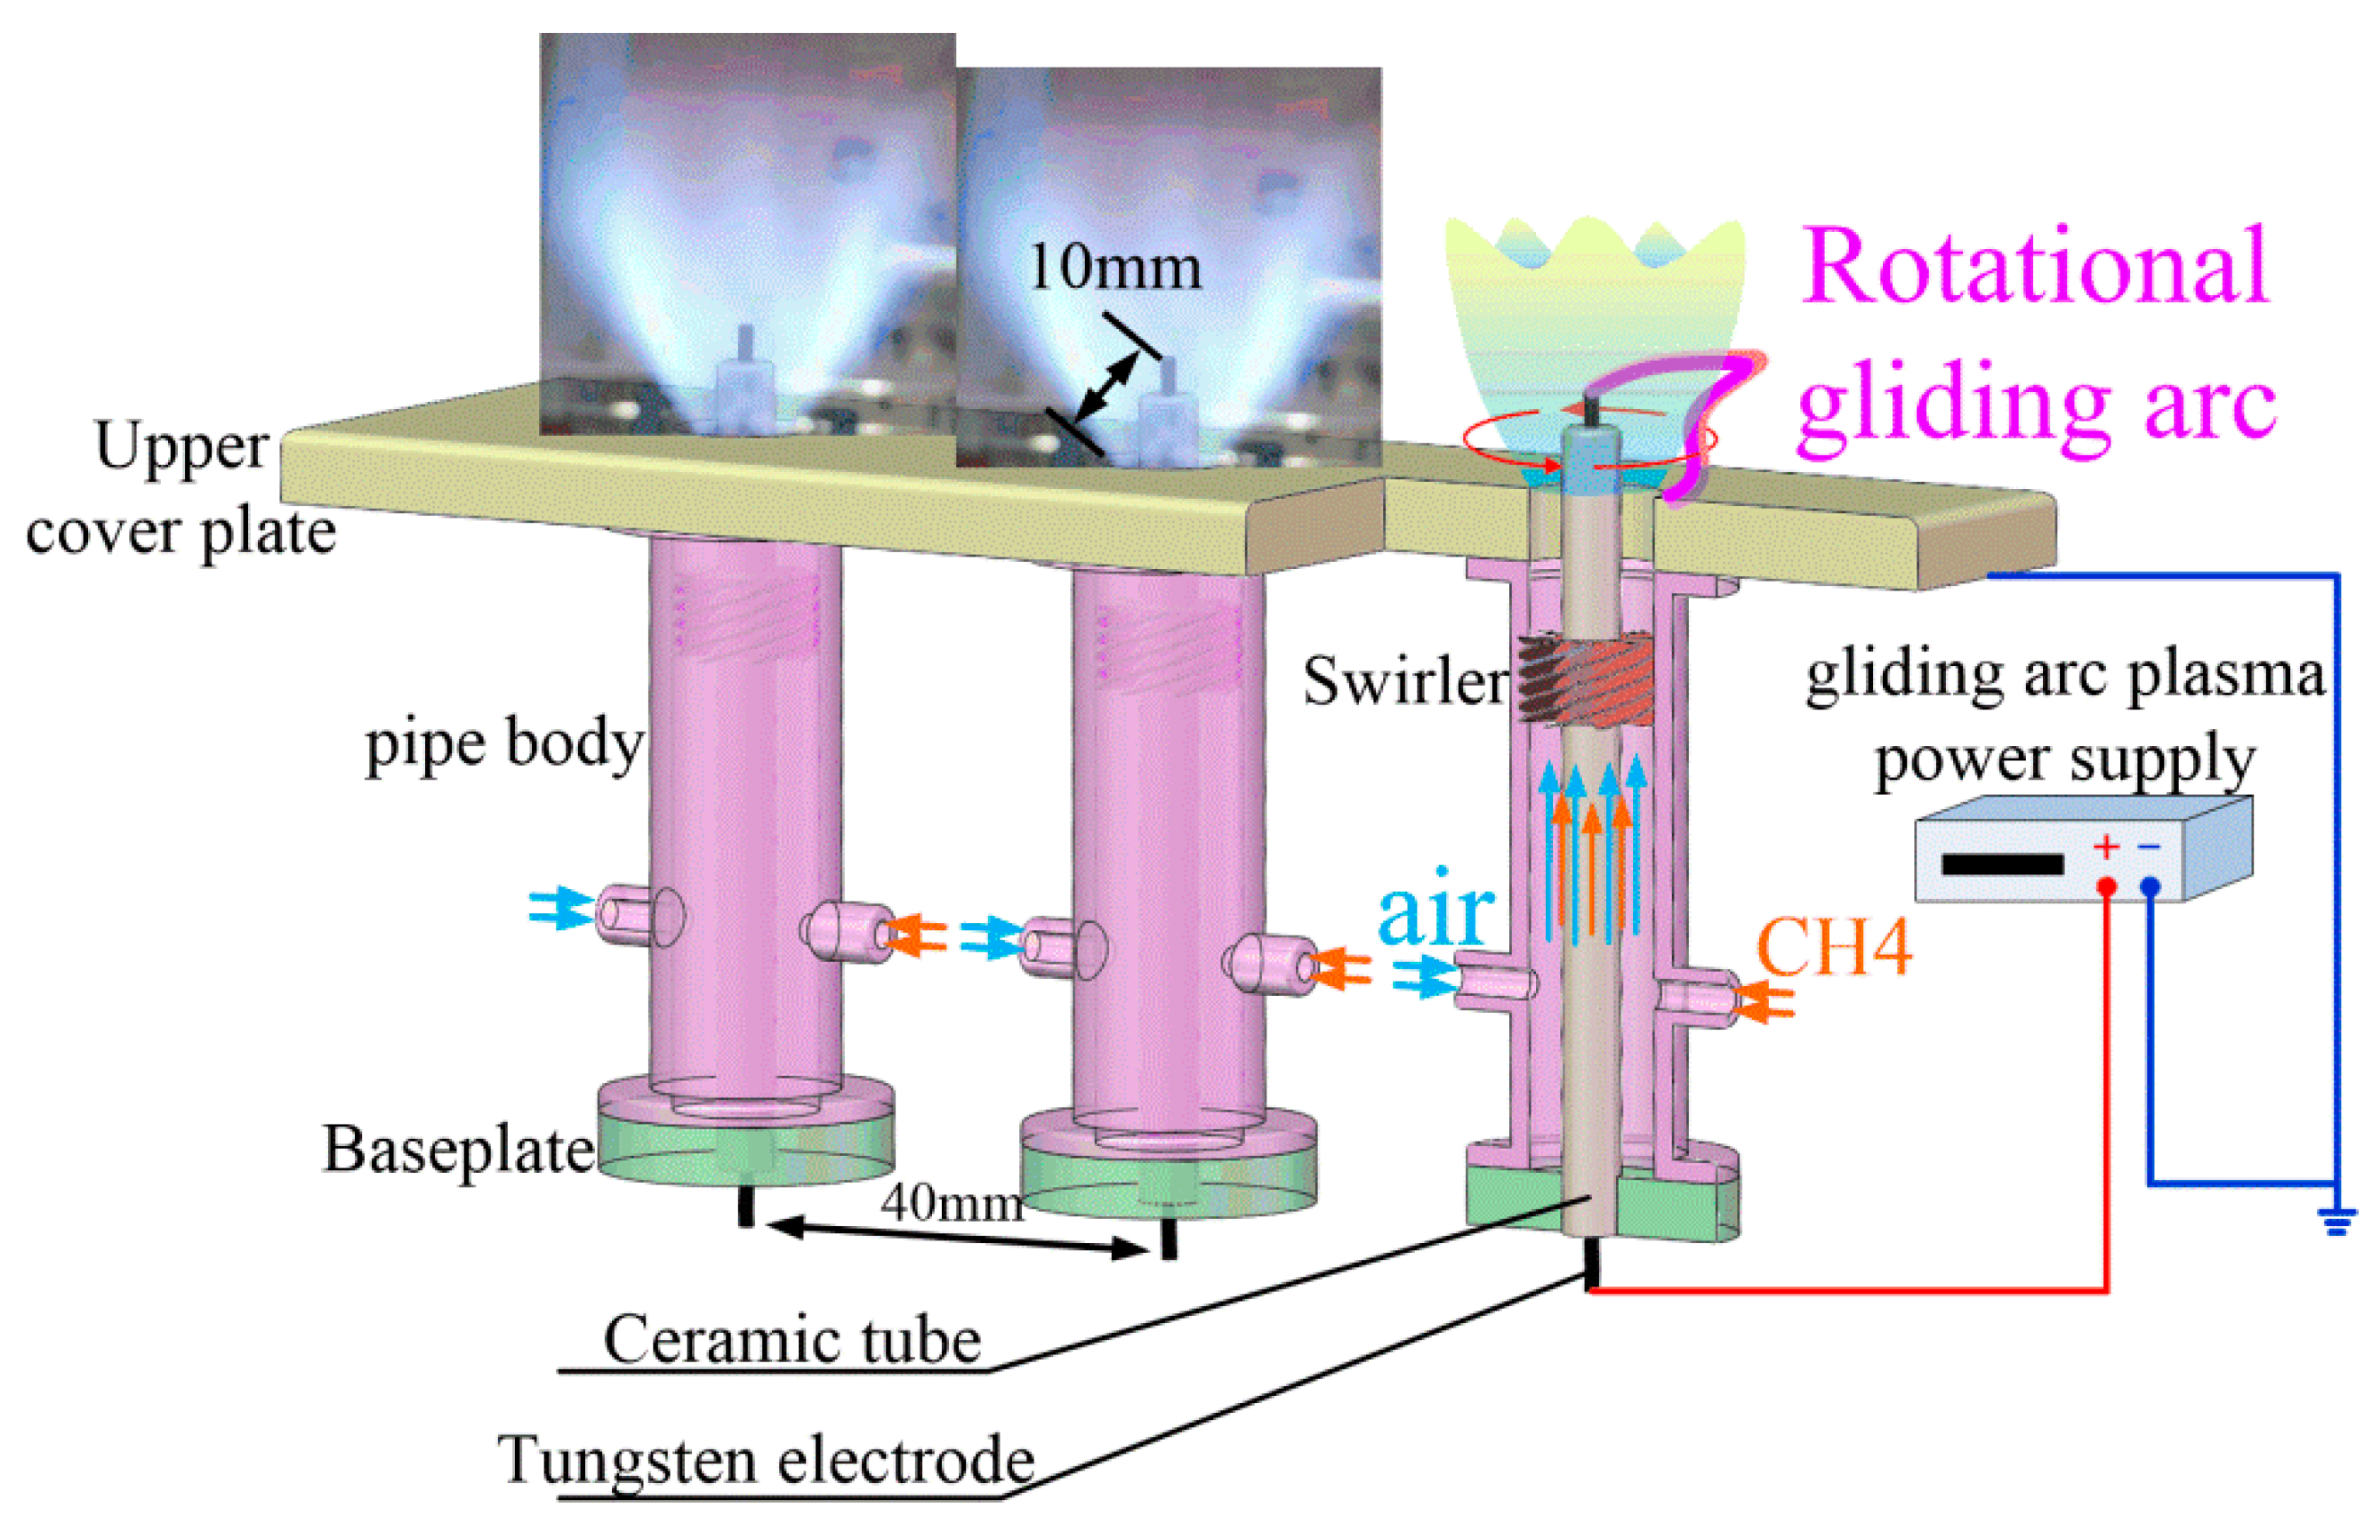
2.2. The Multi-Burner and Arrangement of Electrodes

The multi-burner consisted of an upper cover plate, three stainless pipe bodies with inner diameters of 20 mm, three swirlers, and ceramic tubes implanted with tungsten electrodes, as shown in Figure 4.
The tungsten electrode was connected to the high voltage output of gliding arc power supply, while the upper cover plate of the burner was grounded as the cathode. The discharge gap between the top of tungsten electrode and the edge of the burner outlet was 10 mm. When the voltage between the electrode and the cover plate was higher than the breakdown voltage, the discharge occurred and the arc plasma filament was generated. Then the plasma filament was blown out by swirl flow to form the rotational gliding arc.
The strength of the gas swirl was reflected by the swirl number ( S w ), which was calculated as Formula (4) and was defined in [24]:
S w = 2 3 tan α 1 ( R i n / R e x ) 3 1 ( R i n / R e x ) 2
where α is the angle between swirler vane and axis of pipe body, R e x is the external diameter of swirler, and R i n is the inner diameter of the swirler. Usually a stable recirculation zone can be generated when S w is higher than 0.6 (known as strong swirl). The recirculation zone disappeared when S w approached 0.4 (known as weak swirl) and the flame remained stable because of the shear of the vortex [25]. Three different angles of swirler vanes ( 30 ° , 45 ° , and 60 ° ) were used in the experiment, and the corresponding swirl numbers were: S w ( 30 ° ) = 0.449 , S w ( 45 ° ) = 0.778 , S w ( 60 ° ) = 1.347 , respectively. The extinction performances of both strong and weak swirl were tested in the experiment.

2.3. The Gliding Arc Plasma Power Supply and Measurements

The gliding arc plasma was generated by a low-temperature plasma power supply (CTP2000K). The waveform was a modulated sine wave, and the output voltage varied from 0 to 30 kV. The air and methane came from the compressed tanks, and were controlled by D08-1 mass flow controllers (MFCs). The pressure of the intake flow was no more than 0.3 MPa, and the measurement range of the MFC was 0–200 SLM, with ±2% full scale (F.S.) accuracy and 1–4 s response times.
The current and voltage were measured simultaneously using a Tektronix TCP0030A current probe (120 MHz bandwidth and 0–30 A range) and a P6015A high voltage probe, and were then recorded by the MDO3024 oscilloscope.
The pressure was captured by ICP® PCB pressure sensor with sampling frequency of 1 kHz. The rise time was shorter than 1.0 μsec and non-linearity within 1.0% F.S.
The evolution of CH luminescence in pulsating flame and the stretch of the gliding arc plasma were imaged using a Phantom v251112 high-speed camera equipped with a f/1.8 Nikon zoom lens; a bandpass filter (centered at 430 nm, with a 10-nm full width at half maxima) was also adopted.

3. Results and Discussion

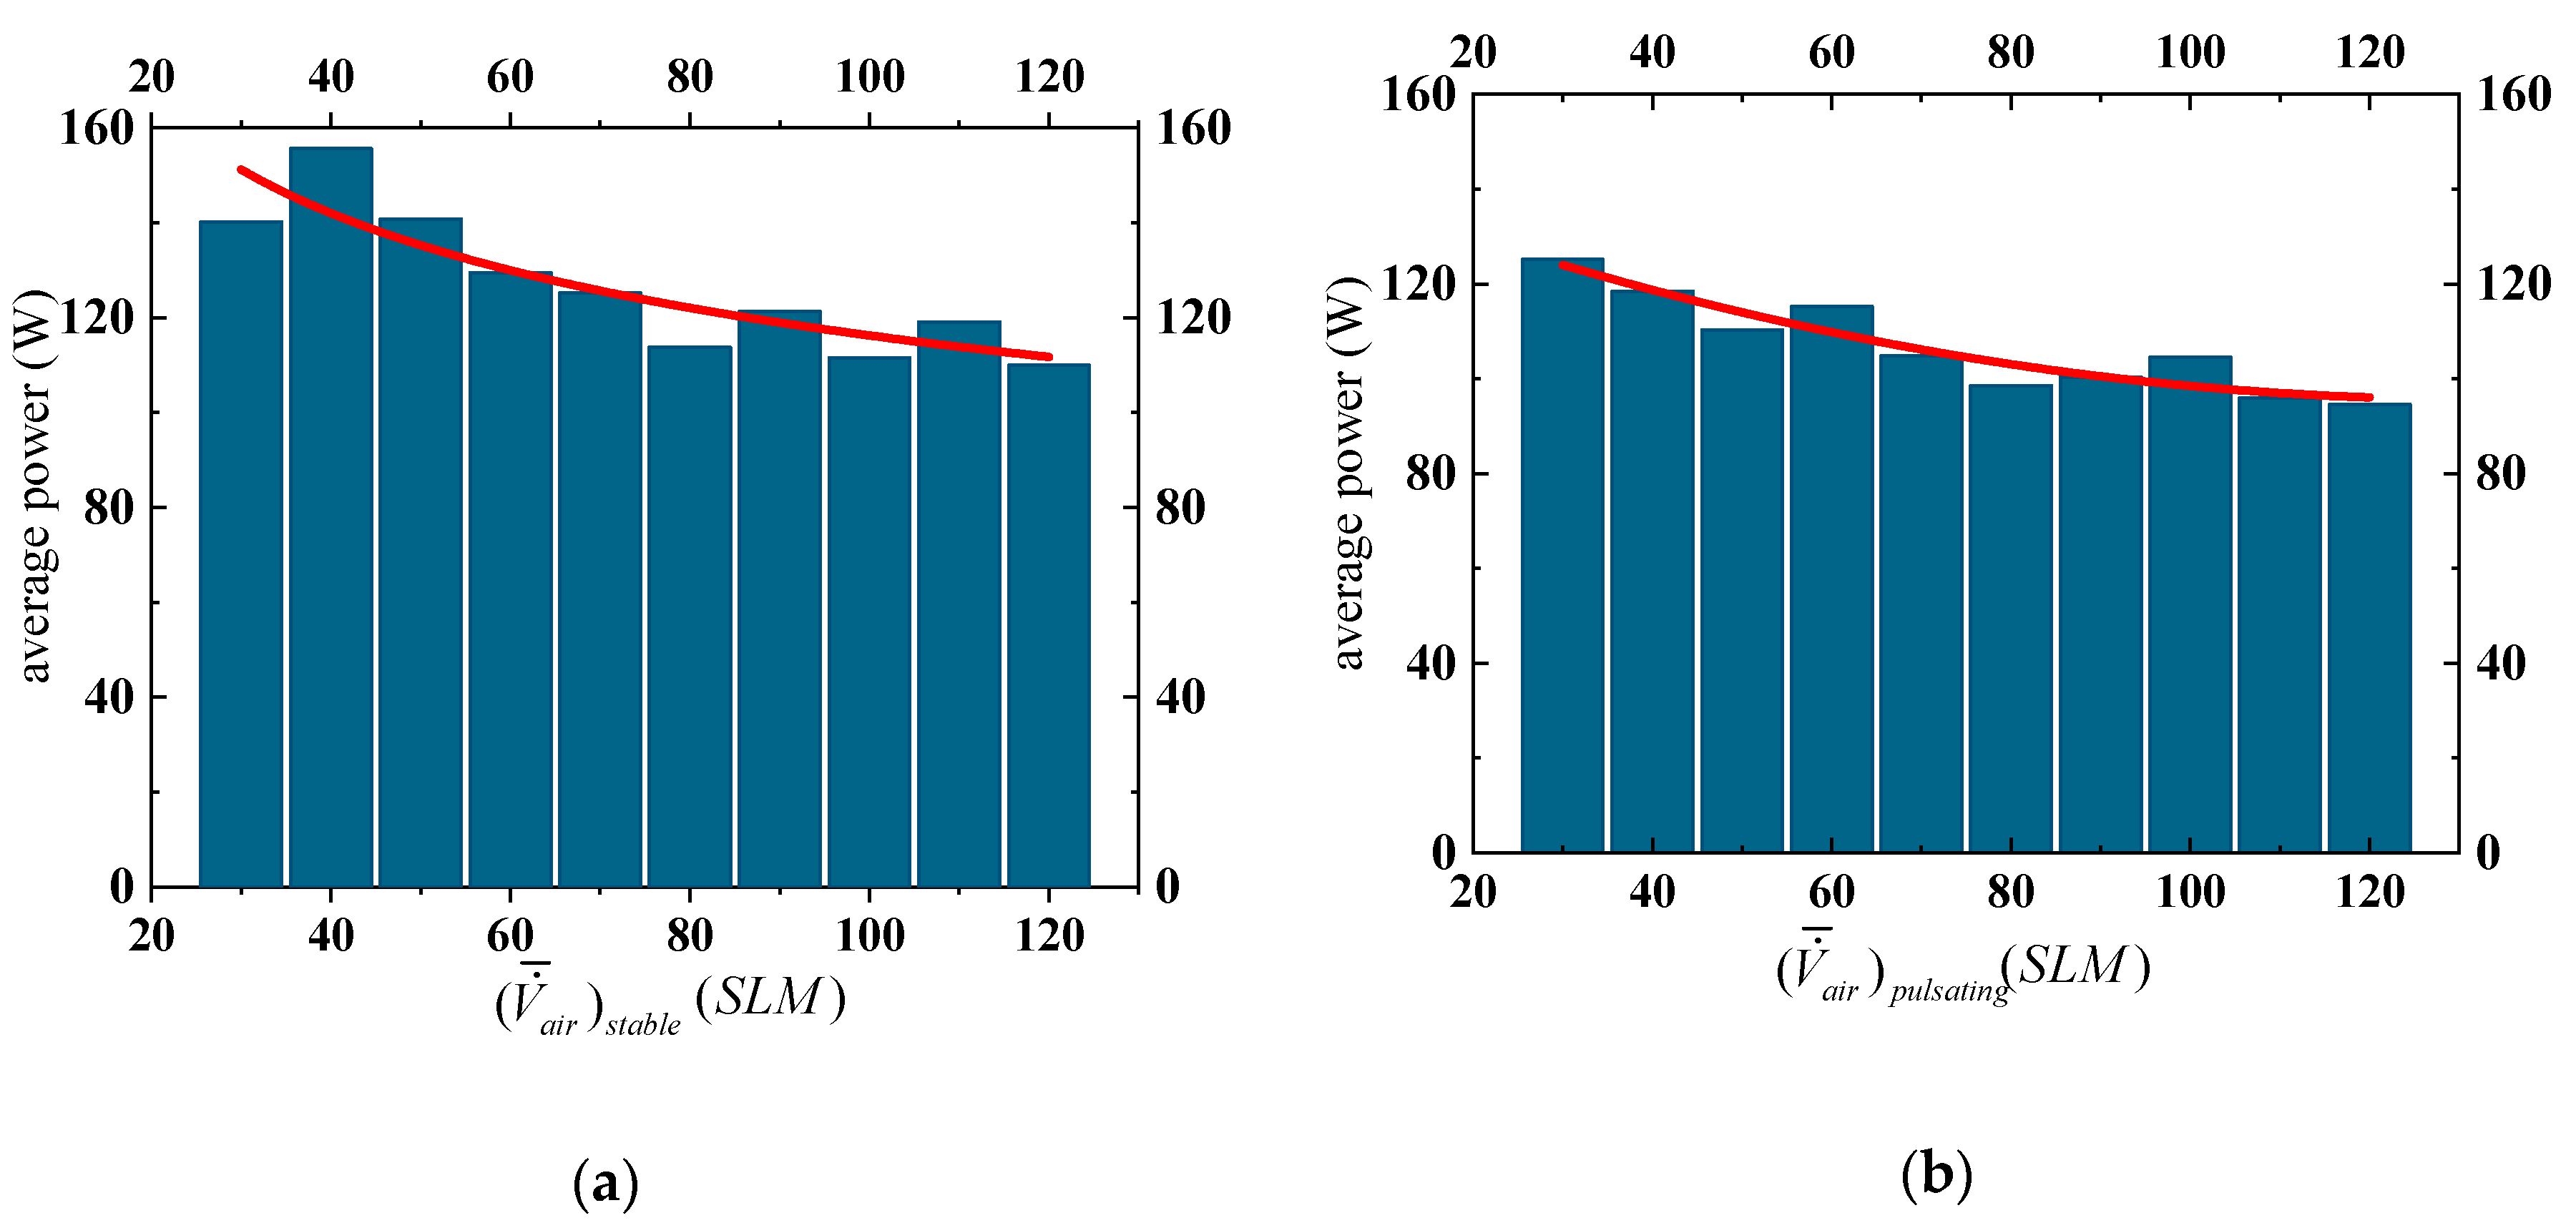
3.1. Characteristics of Gliding arc Plasma Discharge in Stable Flow Mode

Many studies have confirmed that the air flow rates have a great influence on gliding arc plasma [26,27]. In this experiment, the current, voltage, and power waveforms were measured with different flow rates. At the same time, the images of gliding arc plasma topology were recorded simultaneously. During the test process, the supply of CH4 was cut off, and the pulsating air flow generator was in stable flow mode, which meant the combustor operated in stable cold flow conditions. The characteristics of gliding arc plasma with two specific air flow rates ( ( V ˙ ¯ a i r ) s t a b l e = 30 SLM , ( V ˙ ¯ a i r ) s t a b l e = 120 SLM ) were analyzed specifically and different discharge types were investigated.
The ta was defined as the moment that a new arc was generated, while the tb was defined as the moment that this new arc broke up. When ( V ˙ ¯ a i r ) s t a b l e = 30 SLM it could be seen that the triangle-shaped voltage waves of gliding arc plasma appeared approximately periodically (Figure 5). The evolution of gliding arc topology captured by high speed camera is presented in Figure 6. At moment ta (ta = 18.533 ms) the former arc began to extinguish and a new arc formed. Meanwhile, the voltage amplitude decreased from 6.8 kV to 2 kV and the initial arc discharge power was then only 200 W. As the arc elongated gradually and was blown out of the combustor by the swirl airflow (Figure 6), the amplitudes of voltage and power increased, but the current amplitude basically remained in the order of hundreds of milliamperes (Figure 5b). With the increase in arc length, the power for maintaining the arc channel also increased. Once it exceeded threshold of power supply, the arc broke up and the plasma filament was extinguished, as shown in the image at moment tb in Figure 6. The peak voltage was about 4.5 kV at moment tb, and then decreased sharply. Instead of the arc plasma, which disappeared, a new arc was generated in another position randomly because of the swirl flow. As the process was repeated periodically, the gliding arc discharge was maintained.
Figure 5 and Figure 6 illustrate that the period time of gliding arc from formation to fracture was 7 ms in approximately ( V ˙ ¯ a i r ) s t a b l e = 30 SLM air flow, and the voltage waveform in the experiment was similar that in [28].
The ta was defined as the moment that a new arc was generated, the tb was defined as the moment that the peak current happened, and the tc was defined as the moment that this new arc broke up. The characteristics of discharge in higher flow rate are illustrated in Figure 7. When ( V ˙ ¯ a i r ) s t a b l e = 120 SLM , the period of arc plasma discharge was significantly shortened, and the form of the arc also differed greatly from the arc in ( V ˙ ¯ a i r ) s t a b l e = 30 SLM . Similarly, the evolution of gliding arc topology is presented in Figure 8. As shown in Figure 7b and Figure 8, a new arc was generated at moment ta and the voltage amplitude was close to 2 kV. Then the amplitude of voltage increased from ta to tc and the plasma filament elongated simultaneously. This new arc extinguished eventually at moment tc, at which the voltage reached 8.4 kV and was almost two times higher than that in ( V ˙ ¯ a i r ) s t a b l e = 30 SLM conditions. The peak of transient discharge power at moment tc in ( V ˙ ¯ a i r ) s t a b l e = 120 SLM was larger than that in ( V ˙ ¯ a i r ) s t a b l e = 30 SLM as well. The discharge process was maintained at 1.2 ms, a shorter period than that in ( V ˙ ¯ a i r ) s t a b l e = 30 SLM , indicating that the discharge period decreased as the air flow rate increased. In particular, at moment tb the emission of plasma filament suddenly became much brighter, coupled with the obviously transient current peak that was up to 1.1 A in 1 μs. The phenomenon was very different from the ordinary discharge and was denominated as a spark-type discharge. Correspondingly, the ordinary discharge, which was characterized by a long duration and an amplitude of hundreds of milliamperes in the currents (like the currents in Figure 5a), was recognized as a glow-type discharge. The experimental result was in accordance with [27,29].
From the discussion, the characteristics of gliding arc discharges in low flow rate and high flow rate can be summarized with respect to:
(1) The amplitudes of voltages in discharge processes. In high flow rate conditions, the voltage reached over 5 kV when the former arc broke up and the new arc formed, higher than the voltage found in the low flow rate conditions (about 4 kV). The amplitude of transient power with a high flow rate was also larger than that with a low flow rate.
(2) The periods of discharge processes. The period of gliding arc from forming to extinguishing was about less than 1 ms in high flow rate, while the period in low flow rate was approximately 7 ms. The period of discharge processes decreased as the flow rate increased.
(3) The discharge types. With the low flow rate, the discharge always maintained the glow type discharge and no current peak formed. However, with a high flow rate, another discharge type known as the spark-type began to appear, which generated many current peaks. When the flow rate increased, the possibility of conversion from glow type to spark type increased as well.
Figure 9 analyzes the variation of average power of the gliding arc discharge with different V ˙ ¯ a i r values in stable and pulsating flow mode. It was found that with the increase in air flow rate the average power decreased slightly. The average power in Figure 9b was slightly lower than that in Figure 9a, but the two curves were similar, indicating that compared with the flow rate, the flow mode seemed to have little influence on discharge. Together with Figure 5 and Figure 7, it could be concluded that although the peak of transient power in the ( V ˙ ¯ a i r ) s t a b l e = 120 SLM condition was larger than that in the ( V ˙ ¯ a i r ) s t a b l e = 30 SLM condition, the average power was smaller. The reason was probably that the discharge period time decreased as the air flow rate increased, so the high transient power in high flow rate could not be maintained for a long time and quickly decreased, and the average power decreased accordingly.

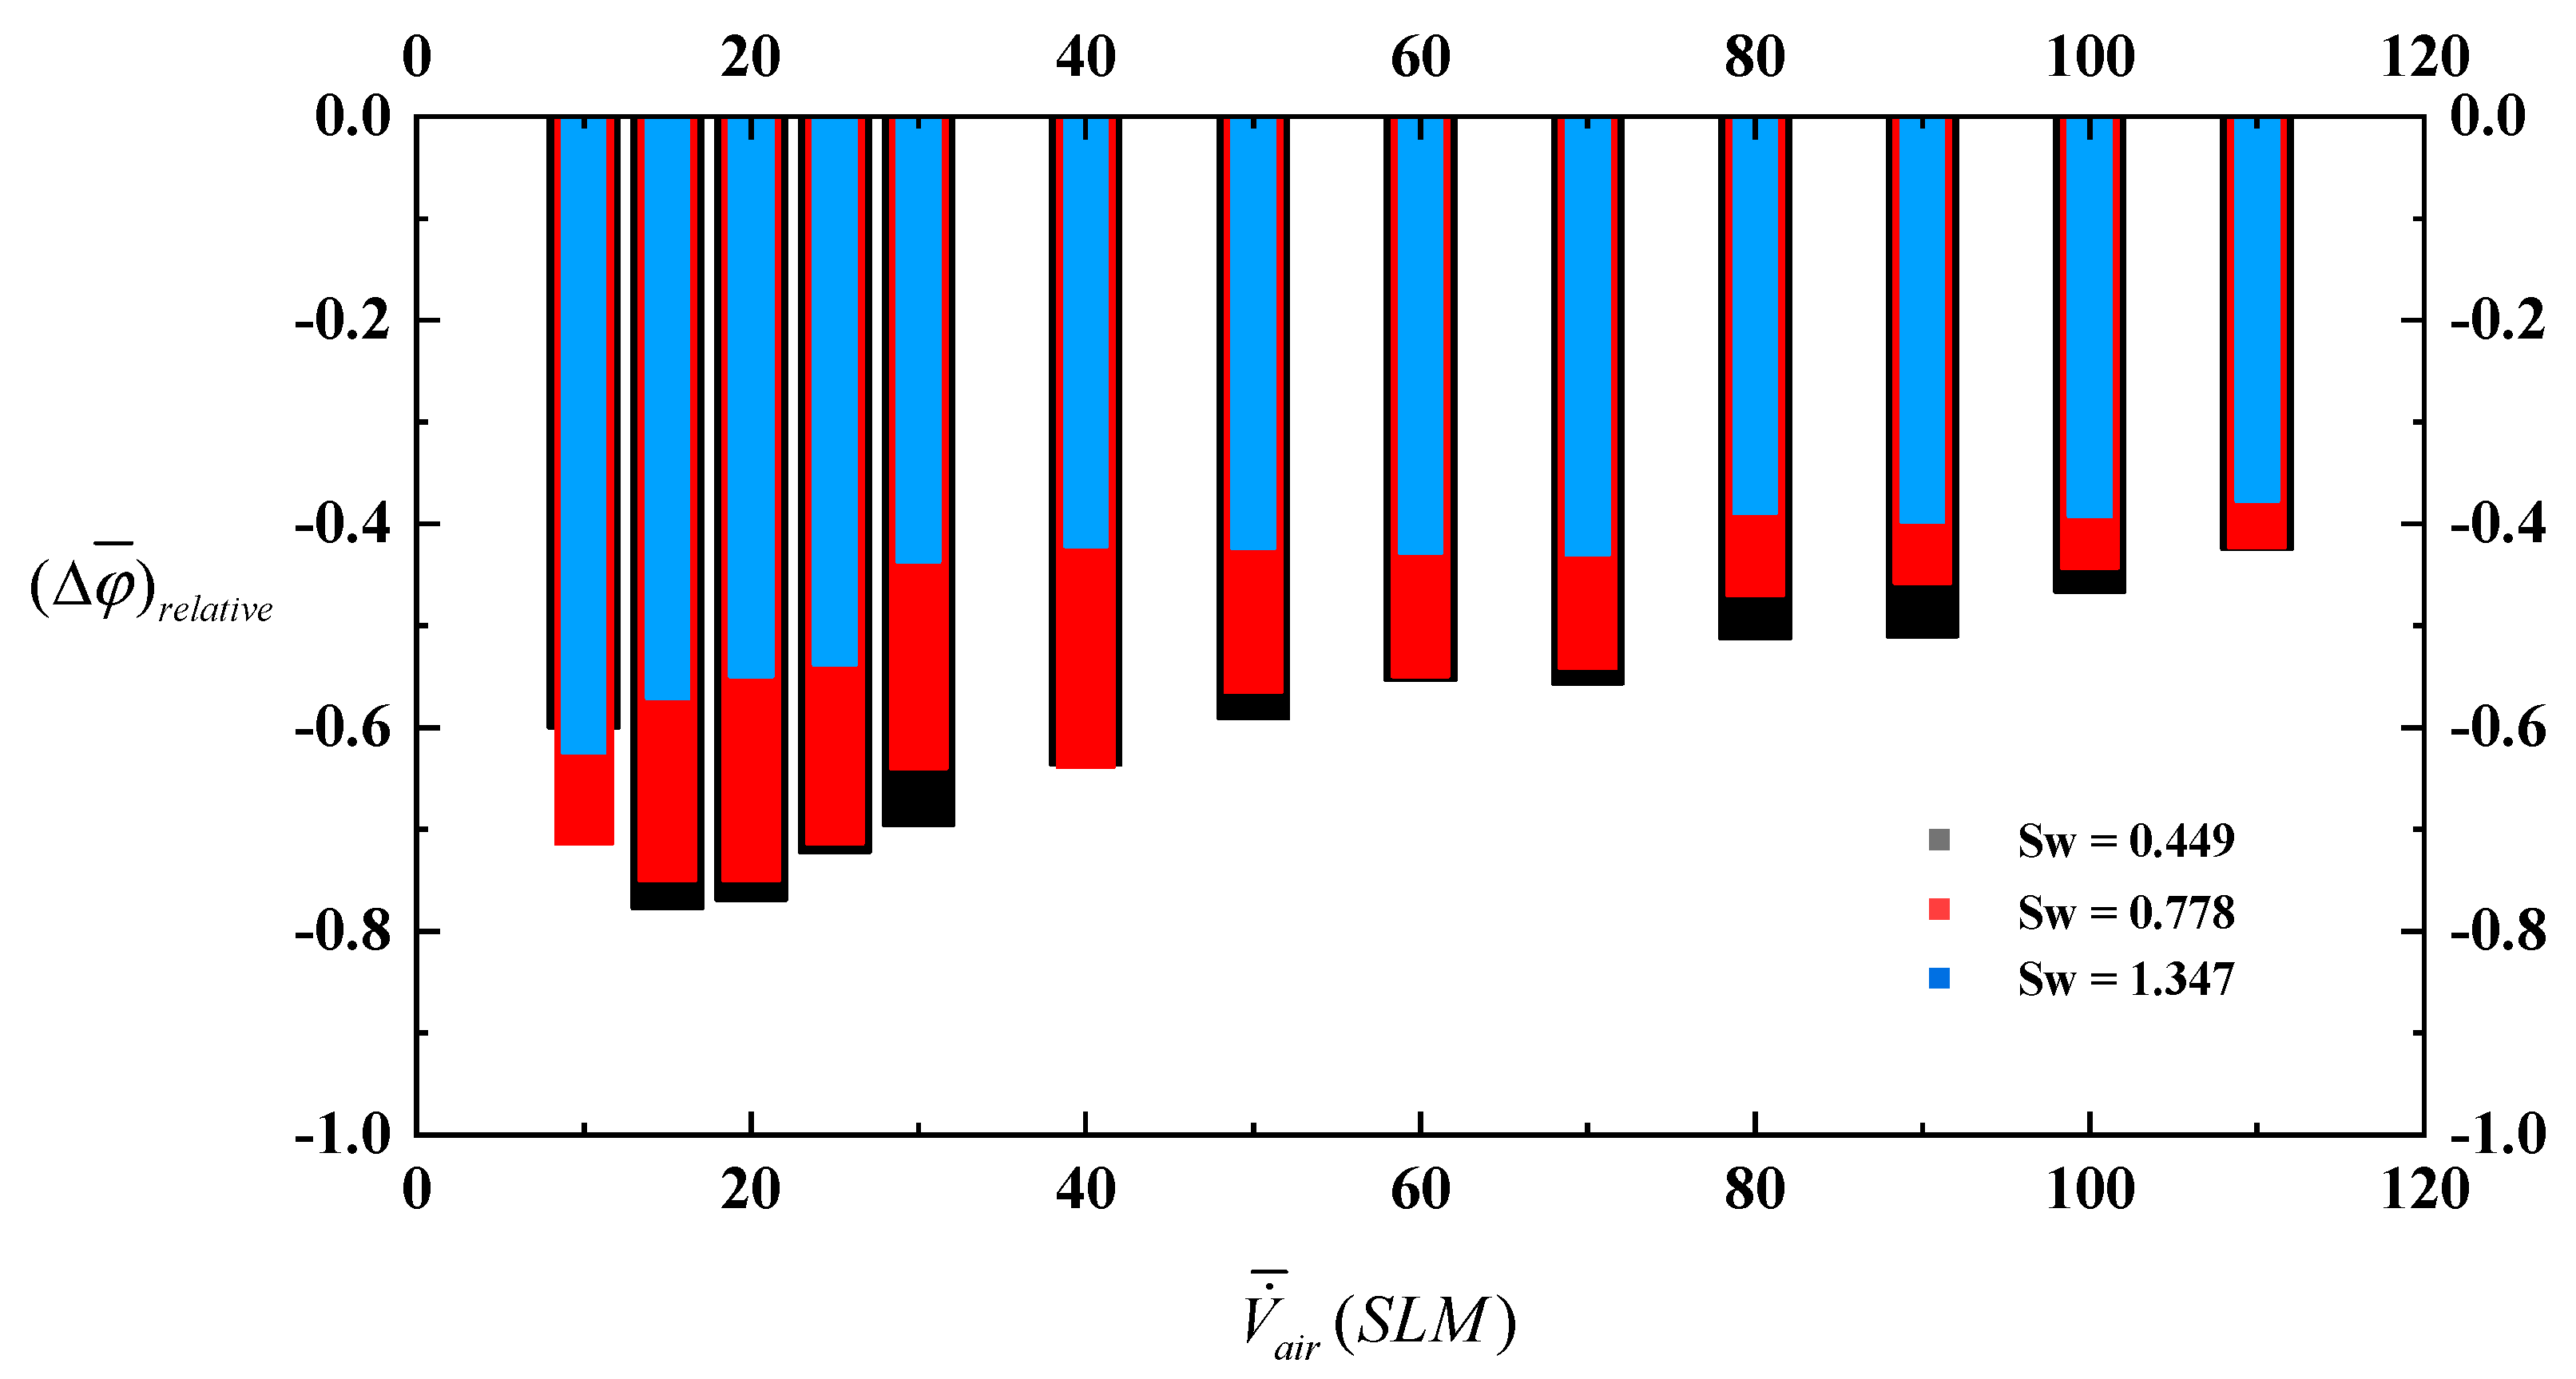
3.2. The Influence of Static Instability on the Lean Blowout Limits of Swirl Flame

In the experiment, the lean blowout limits of swirl flame were detected. The average equivalence ratios (represented by φ ¯ ) of blowout were measured in different flow modes, different V ˙ ¯ a i r , and different swirl numbers (represented by S w ). Then these measured average equivalence ratios were connected to form the lean blowout limits.
Figure 10 shows the lean blowout limits of swirl flames in different flow mode conditions. When the S w and flow modes were fixed and the V ˙ ¯ a i r increased, the φ ¯ of blowout increased as well, which indicated that the extinction performance of swirl flame deteriorated as the air flow rate increased.
With the flow mode unchanged, when the S w increased from 0.449 to 1.347, the lean blowout limit gradually increased correspondingly. In other words, the lean blowout limit worsened as the S w increased, similar to [25].
When the S w was fixed and the flow mode changed from stable flow to pulsating flow, the static flame instability was generated, and the lean blowout limits became higher than in stable flow mode.
With three different S w from 0.449 to 1.347, the relative increase in equivalence ratio (represented by ( Δ φ ¯ ) r e l a t i v e ) in pulsating flow mode was calculated by Formula (5), and is depicted in Figure 11.
( Δ φ ¯ ) r e l a t i v e = φ ¯ p u l s a t i n g φ ¯ s t a b l e φ ¯ s t a b l e
In Figure 11, compared with stable mode, the blowout equivalence ratios in pulsating mode increased relatively by about 20–50%, indicating that the inlet flow oscillation had a negative influence on extinction performance of swirl flame. In addition, no rules could be determined from the variation of ( Δ φ ¯ ) r e l a t i v e with the increases in S w or V ˙ ¯ a i r . It seemed that the relative increase in equivalence ratio was mainly related to the change of flow modes.

3.3. The Improvement of Lean Blow-Out Limits with Gliding Arc Plasma

Previous experiments [30] found that the flame was extinguished temporarily and then relighted by the burned gas when the equivalence ratio approached lean blowout limits. If the equivalence ratio was to decrease further, unburned gas would not be reignited and the flame would be completely extinguished.
Fortunately, arc plasma can act as an additional heat source, which is believed to be helpful for the re-ignition process. The lean blowout limits of swirl flame in pulsating flow with gilding arc plasma (defined as the plasma-pulsating flow mode) were measured and are shown in Figure 12.
Compared with Figure 10b, the lean blowout limit in Figure 12 reduced significantly with the use of gliding arc plasma, and the relative decreases in φ ¯ (represented by ( Δ φ ¯ ) r e l a t i v e ) were calculated using Formula (6) in order to better reflect the advantage of the gliding arc plasma. The ( Δ φ ¯ ) r e l a t i v e is depicted in Figure 13.
( Δ φ ¯ ) r e l a t i v e = φ ¯ p l a s m a p u l s a t i n g φ ¯ p u l s a t i n g φ ¯ p u l s a t i n g
In Figure 13 the negative value shows that the blowout equivalence ratio in plasma-pulsating flow mode was lower than that in pulsating flow mode. The lean blowout limit generated by the inflow oscillation was expanded by more than 40% with gliding arc plasma. Interestingly, unlike in Figure 11, the trend of the ( Δ φ ¯ ) r e l a t i v e is obvious with the increase in V ˙ ¯ a i r in Figure 13. When the V ˙ ¯ a i r rose, the ( Δ φ ¯ ) r e l a t i v e decreased, indicating that the effect of the plasma with the high flow rate was weaker than it was with the low flow rate. Figure 9 shows that the average power of the gliding arc in high flow rate was smaller than that in low flow rate, so it is reasonable that the effect of the plasma was weakened in high flow rate.
As to why the lean blowout limit could be extended by plasma, one of the reasons could be that the plasma continuously transformed the electric energy into the heat, injected heat into the flame region, and impaired the blowing effect of pulsating airflow on flame heat so the lean blowout limit of pulsating swirl flame was greatly extended. The explanation needs to be confirmed through the dynamic analysis of swirl flame in pulsating flow with plasma.

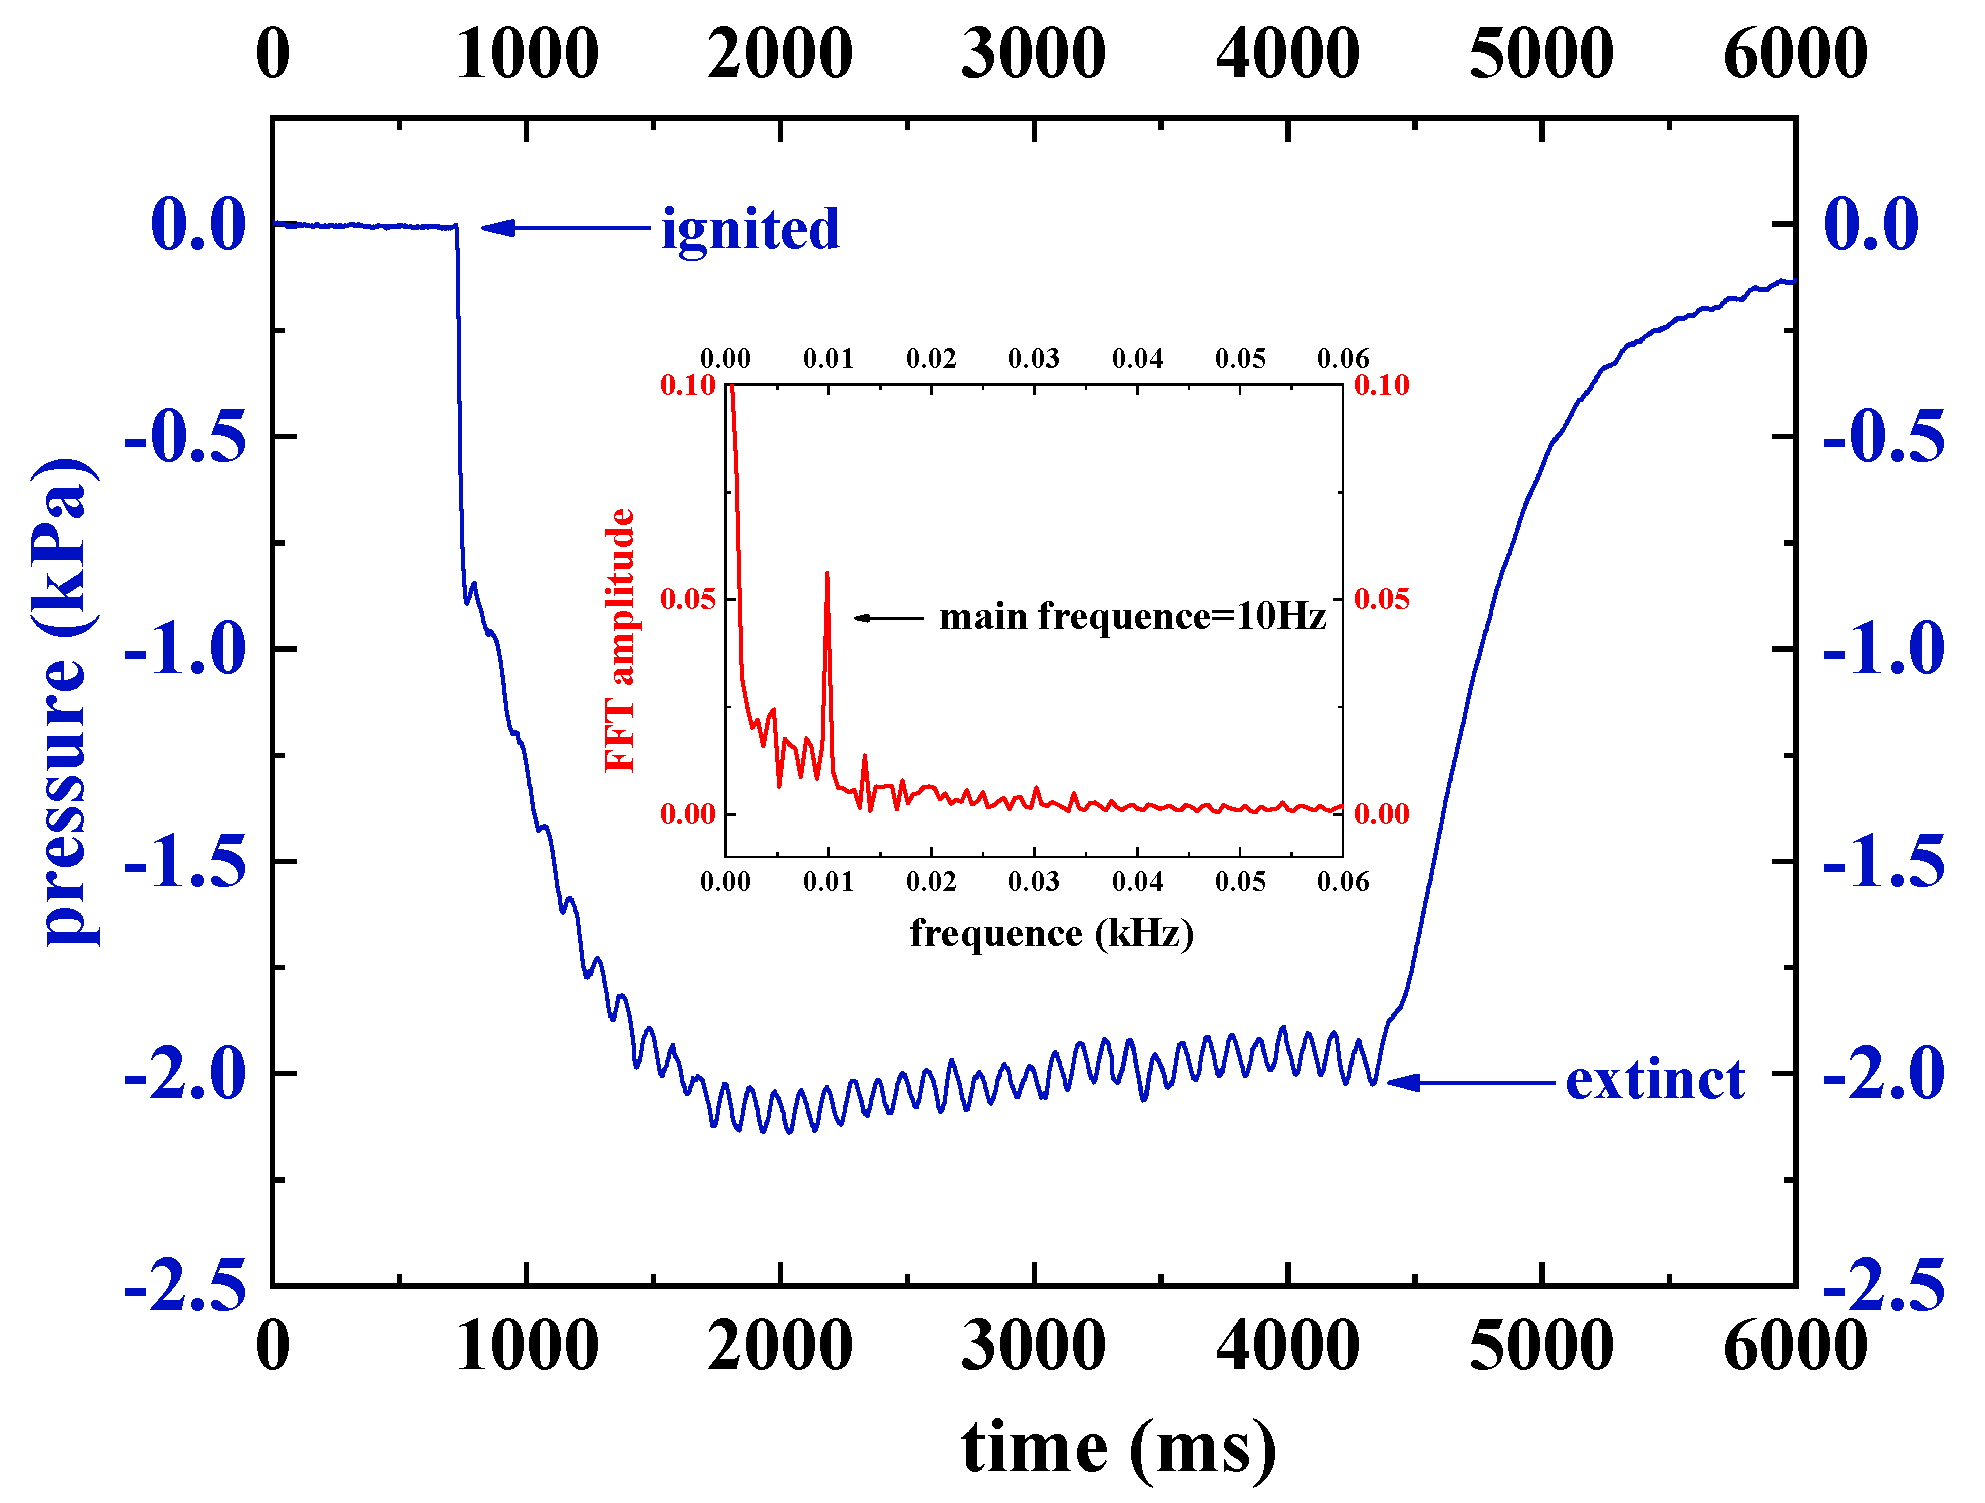
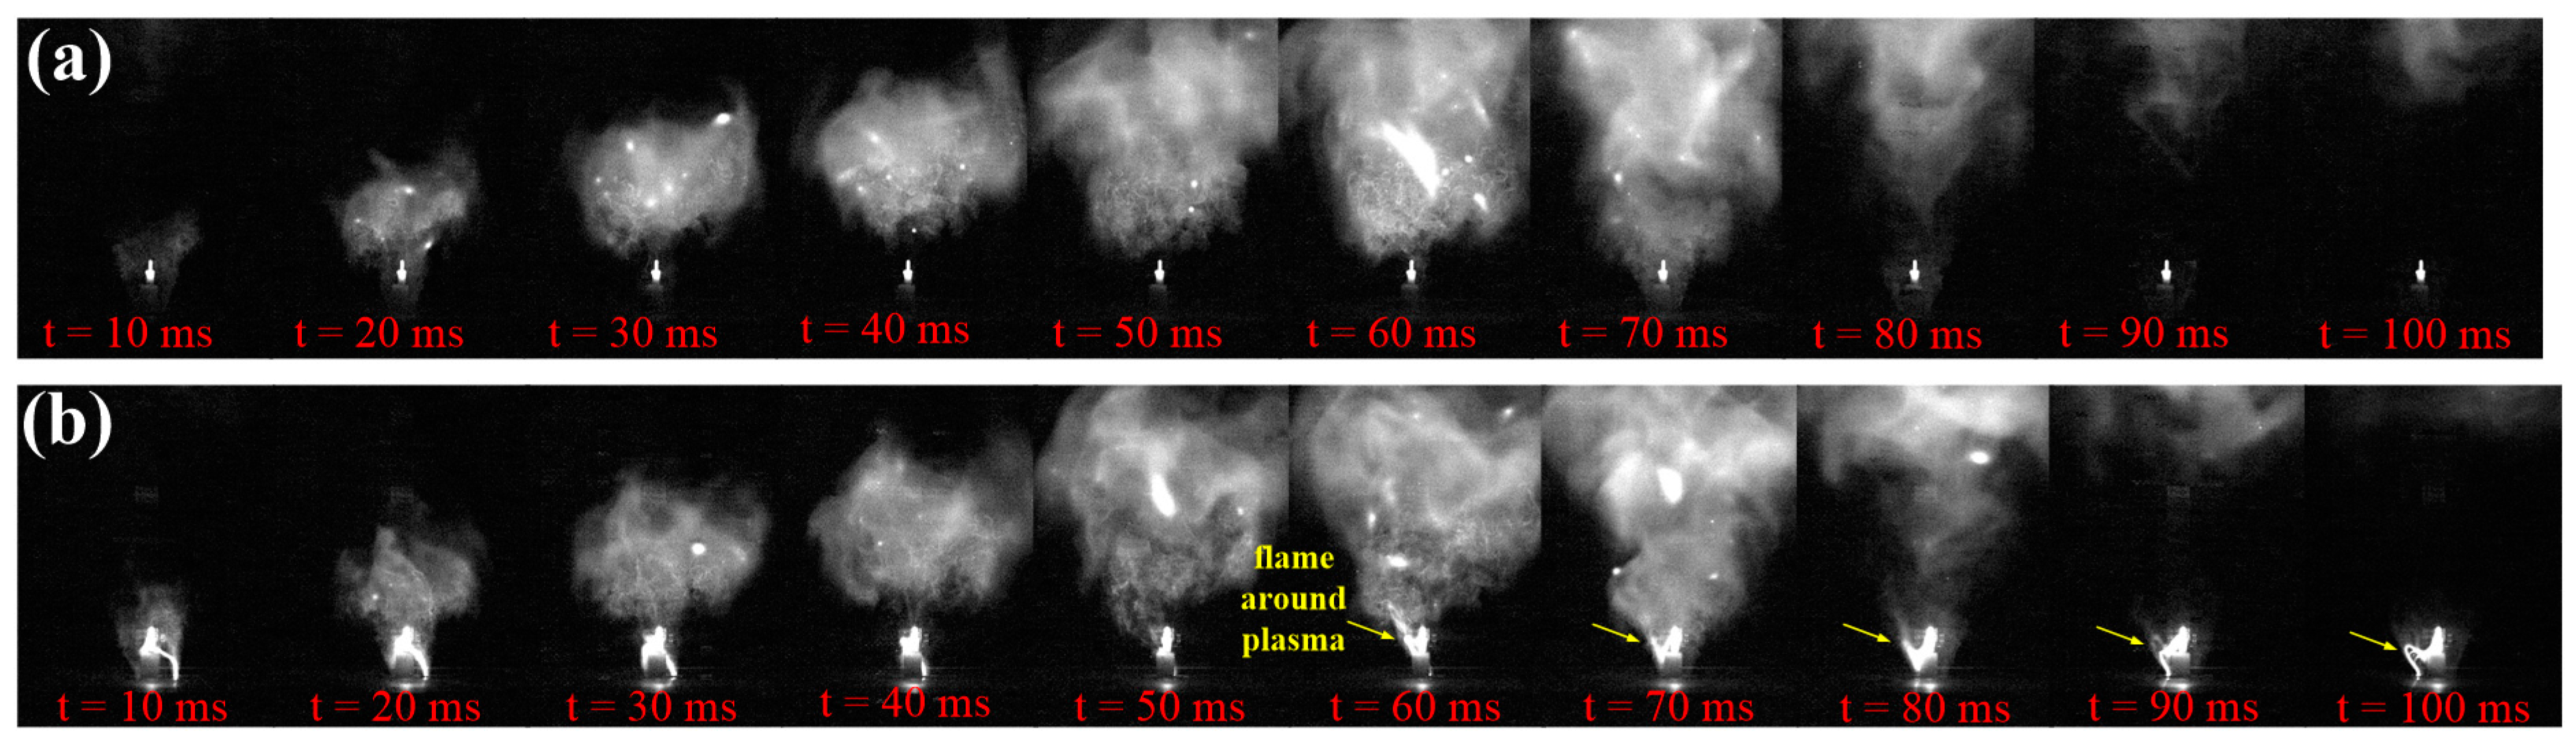
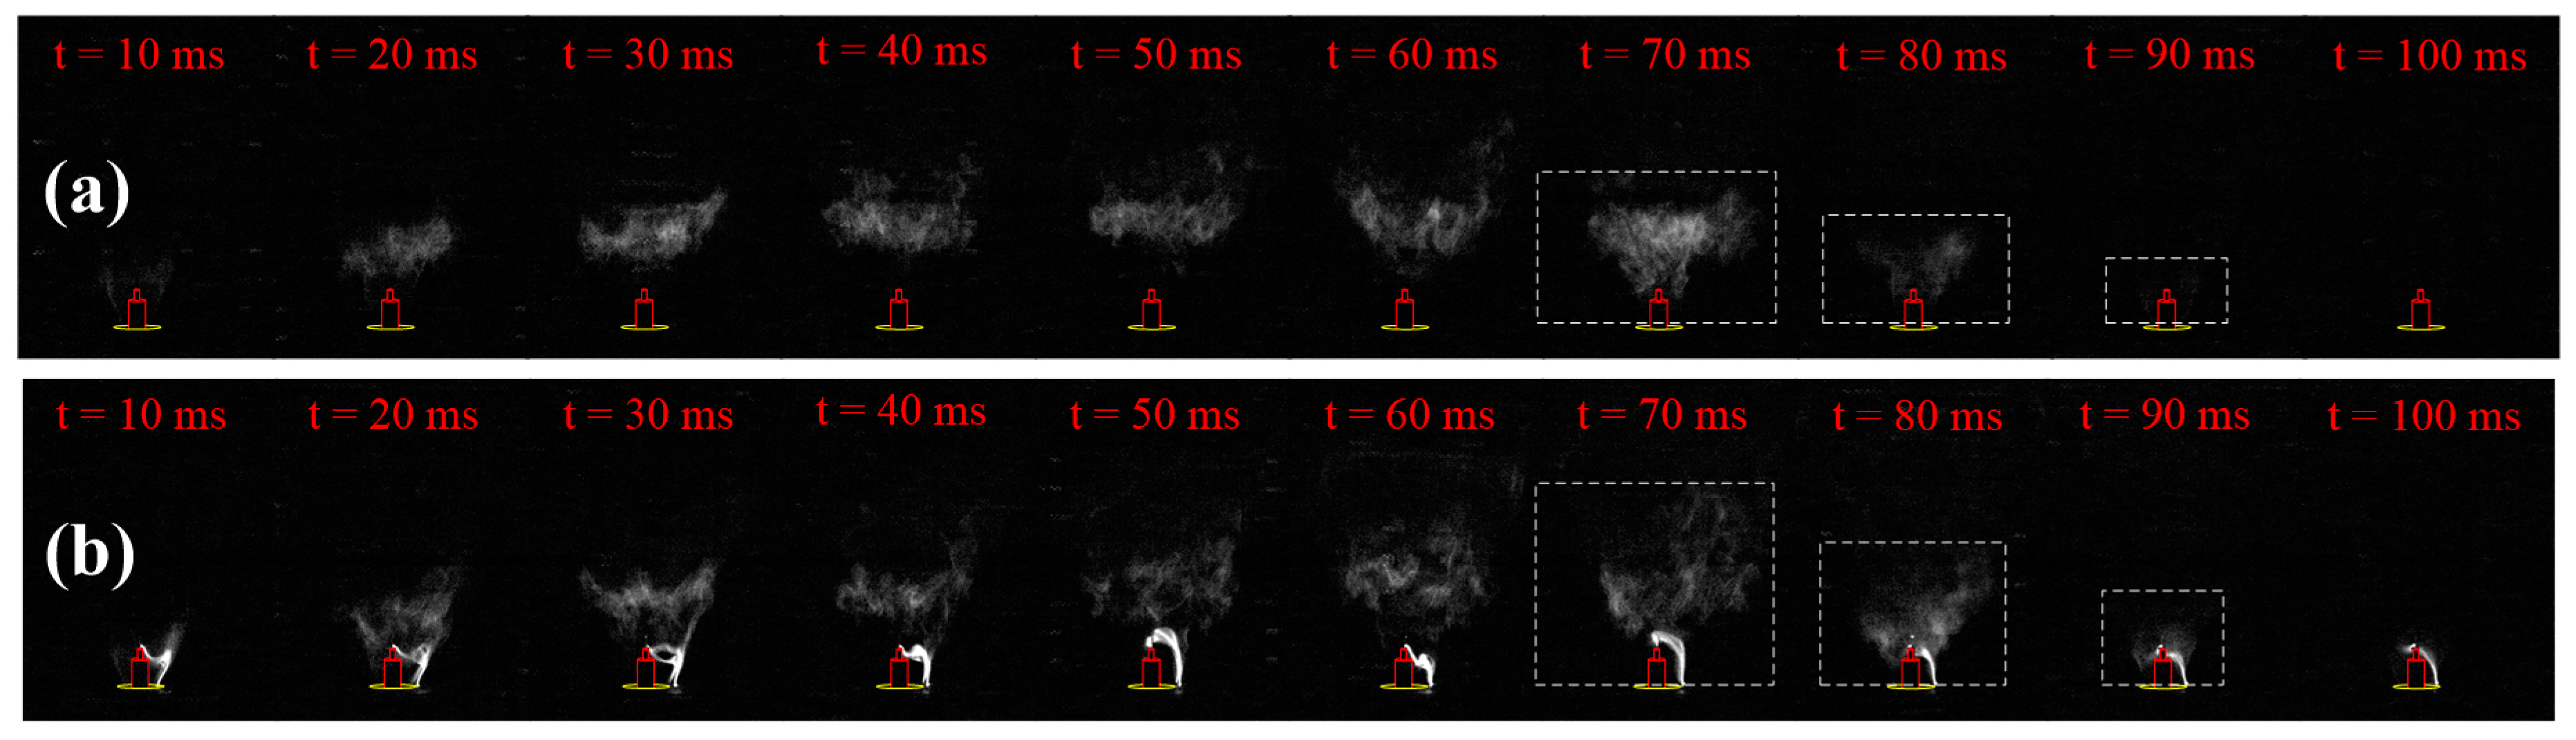
3.4. Dynamic Analysis of Swirl Flame in Pulsating Flow with Plasma

The pressure in burner outlet was measured and the frequency was calculated in pulsating flow mode, as shown in Figure 14. It can be seen from the pressure curve that the combustion oscillation of swirl flame was excited by the inlet air pulsation, and the main frequency was about 10 Hz. As reported in [4], the frequency of static instability is usually below 30 Hz. It is thus believed that the pulsating flow mode in this experiment showed typical static instability.
The extinction of the swirling flame was a dynamic process consisting of flame front fracture, partial extinction, re-ignition caused by high temperature residual gas, and global extinction [31]. The change of the flow velocity generated by the pulsating air damaged the recirculation zone of swirl flame, causing flame front breaking, combustion instability, and extinction [32].
The dynamic processes of re-ignition and extinction of swirl flames in pulsating air flow mode and plasma-pulsating flow mode are were illustrated in Figure 15. The working conditions include ( V ˙ ¯ a i r ) p u l s a t i n g = 120 SLM , S w = 1.347 , φ ¯ = 1.34 . In Figure 15a, when the transient air flow rate decreased (from t = 10 ms to t = 60 ms), the flame volume and brightness increased continuously, with both reaching a maximum at t = 60 ms. As the transient flow rate increased gradually from t = 60 ms to t = 100 ms, the flame firstly broke, and then the burned gas left the burner outlet. At t = 100 ms no more swirl flame at the burner outlet could be observed. Compared with Figure 15a, the main difference in Figure 15b was that the swirl flame existed around the gliding arc plasma throughout the whole pulsating period. It can be concluded that the gliding arc plasma acted as an ignition source which made the swirl flame stabilize at the burner outlet.
Generally, the chemiluminescence of radicals like CH, OH, and CH2O is related to the reaction intensity and heat release rate of the flame [33,34,35]. For example, CH2O is the symbol of the preheat region, OH represents the high-temperature region [34], and CH is regarded as the indicator of the flame front [35]. According to previous research [36,37,38], CH could better reflect the local or global heat release rate. In the experiment, the high-speed camera with bandpass filter was used to capture the instantaneous structure of CH radical, which could reveal the distribution of heat release rate in both pulsating flow mode and plasma-pulsating flow mode, as shown in Figure 16.
The dynamic processes of CH distribution are shown in Figure 16a,b. The transient flow rate gradually increased during the first 50 ms. As the valve was closed, it decreased in the following 50 ms. It can be seen that the CH mainly concentrated on the top of swirl flame, in accordance with [39]. Within the first 60 ms, there was little difference between Figure 16a,b. However, the CH in Figure 16b was significantly stronger than that in Figure 16a after t = 50 ms. The comparison showed that plasma has a positive effect on the heat release rate, which may be one of the reasons why the lean blowout limit was extended with gliding arc plasma.

4. Conclusions

The characteristics of gliding arc, as well as its control effect on static instability of premixed swirl flame, were investigated experimentally, and the main conclusions can be summarized as follows:
(1) The gliding arc plasma was characterized by periodic discharge, and its current, voltage, and power waveforms as well as plasma topology were related to the air flow rate. In the low flow rate, the discharge kept the glow type discharge and no current peaks formed. As the flow rate increased, another discharge type named the spark type began to appear, with many current peaks. When the flow rate increased, the period of gliding arc discharge and the average power decreased, while the amplitude of the voltage wave and the peak of instantaneous discharge power increased.
(2) The extinction performance of the flame was influenced deeply by the static flame instability. When the flow mode changed from stable flow to pulsating flow, static flame instability was generated, and the lean blowout limit became higher than in stable flow mode. Apart from the static instability, swirl number also influenced the extinction performance, as the lean blowout limit increased as the swirl number increased.
(3) As the gliding arc plasma was adopted, the lean blowout limit of swirl flame in pulsating flow mode was significantly reduced and was found to be better than the limit of the stable flame. It seemed that when the air flow rate increased, the beneficial effect of the plasma was weakened.
(4) In contrast to the flame dynamic process in pulsating flow mode, the flame existed throughout the whole pulsating period with gliding arc plasma. Thus, it seemed that the gliding arc plasma acted as an ignition source in pulsating mode, which made the swirl flame stabilize at the burner outlet. The CH distribution showed that plasma had a positive effect on the heat release rate, which may be one of the reasons why the lean blowout limit was extended with gliding arc plasma.
In the experiment the discharge characteristics of gliding arc in different swirling flow rates were studied mainly based on the current, voltage, power waveforms, and plasma topology, but other parameters of the gliding arc, such as translational, rotational, and vibrational parameters as well as electron temperatures and the reduced electric field were not researched. Future works should be focused on the measurements of plasma parameters in order to provide a better understanding of the mechanism of plasma assisted-combustion. In addition, the species of the gliding arc plasma in swirl flame also need to be investigated.

Author Contributions

Conceptualization, W.C. (Weiqi Chen) and W.C. (Wei Cui); methodology, D.J.; validation, W.C. (Weiqi Chen); writing—original draft preparation, W.C. (Weiqi Chen); writing—review and editing, D.J. and S.H. All authors have read and agreed to the published version of the manuscript.

Funding

This research was funded by two programs of National Natural Science Foundation of China with grant numbers No. 91641204 and No. 51807204.

Acknowledgments

Thanks to the great support of the National Natural Science Foundation of China.

Conflicts of Interest

The authors declare no conflict of interest.

References

  1. Oefelein, J.C.; Yang, V. Comprehensive Review of Liquid-Propellant Combustion Instabilities in F-1 Engines. J. Propuls. Power 1993, 9, 657–677. [Google Scholar] [CrossRef]
  2. Malbois, P.; Salaun, E.; Vandel, A.; Godard, G.; Cabot, G.; Renou, B.; Boukhalfa, A.M.; Grisch, F. Experimental investigation of aerodynamics and structure of a swirl-stabilized kerosene spray flame with laser diagnostics. Combust. Flame 2019, 205, 109–122. [Google Scholar] [CrossRef]
  3. Nair, S.; Lieuwen, T. Acoustic detection of blowout in premixed flames. J. Propuls. Power 2005, 21, 32–39. [Google Scholar] [CrossRef]
  4. Mongia, H.C.; Held, T.; Hsiao, G.; Pandalai, R. Challenges and progress in controlling dynamics in gas turbine combustors. J. Propuls. Power 2003, 19, 822–829. [Google Scholar] [CrossRef]
  5. Strutt, J.W.; Rayleigh, B. The Theory of Sound; Macmillan: London, UK, 1945. [Google Scholar]
  6. Candel, S.; Durox, D.; Schuller, T.; Bourgouin, J.-F.; Moeck, J.P. Dynamics of swirling flames. Annu. Rev. Fluid Mech. 2014, 46, 147–173. [Google Scholar] [CrossRef]
  7. Ateshkadi, A.; McDonell, V.G.; Samuelsen, G.S. Lean blowout model for a spray-fired swirl-stabilized combustor. Proc. Combust. Inst. 2000, 28, 1281–1288. [Google Scholar] [CrossRef]
  8. Richards, G.A.; Straub, D.L.; Robey, E.H. Passive control of combustion dynamics in stationary gas turbines. J. Propuls. Power 2003, 19, 795–810. [Google Scholar] [CrossRef]
  9. Ju, Y.G.; Sun, W.T. Plasma assisted combustion: Dynamics and chemistry. Prog. Energy Combust. Sci. 2015, 48, 21–83. [Google Scholar] [CrossRef]
  10. Leonov, S.B.; Yarantsev, D.A.; Napartovich, A.P.; Kochetov, I.V. Plasma-assisted chemistry in high-speed flow. Plasma Sci. Technol. 2007, 9, 760–765. [Google Scholar] [CrossRef]
  11. Leonov, S.B.; Yarantsev, D.A. Plasma-induced ignition and plasma-assisted combustion in high-speed flow. Plasma Sources Sci. Technol. 2007, 16, 132–138. [Google Scholar] [CrossRef]
  12. Pilla, G.; Galley, D.; Lacoste, D.A.; Lacas, F.; Veynante, D.; Laux, C.O. Stabilization of a turbulent premixed flame using a nanosecond repetitively pulsed plasma. IEEE Trans. Plasma Sci. 2006, 34, 2471–2477. [Google Scholar] [CrossRef]
  13. Ombrello, T.; Qin, X.; Ju, Y.; Gutsol, A.; Fridman, A. Enhancement of combustion and flame stabilization using stabilized non-equilibrium plasma. In Proceedings of the 43rd AIAA Aerospace Sciences Meeting and Exhibit, Reno, NV, USA, 10–13 January 2005; p. 1194. [Google Scholar]
  14. Ombrello, T.; Qin, X.; Ju, Y.; Gangoli, S.; Gutsol, A.; Fridman, A. Non-equilibrium plasma discharge: Characterization and effect on ignition. In Proceedings of the 44th AIAA Aerospace Sciences Meeting and Exhibit, Reno, NV, USA, 9–12 January 2006; p. 1214. [Google Scholar]
  15. Ombrello, T.; Qin, X.; Ju, Y.; Gutsol, A.; Fridman, A.; Carter, C. Combustion Enhancement via Stabilized Piecewise Nonequilibrium Gliding Arc Plasma Discharge. AIAA J. 2006, 44, 142–150. [Google Scholar] [CrossRef]
  16. Fridman, A.; Gutsol, A.; Gangoli, S.; Ju, Y.G.; Ombrellol, T. Characteristics of Gliding Arc and Its Application in Combustion Enhancement. J. Propuls. Power 2008, 24, 1216–1228. [Google Scholar] [CrossRef]
  17. Ombrello, T.; Ju, Y.; Fridman, A. Kinetic Ignition Enhancement of Diffusion Flames by Nonequilibrium Magnetic Gliding Arc Plasma. AIAA J. 2008, 46, 2424–2433. [Google Scholar] [CrossRef]
  18. Moeck, J.P.; Lacoste, D.A.; Durox, D.; Guiberti, T.F.; Schuller, T.; Laux, C.O. Stabilization of a Methane-Air Swirl Flame by Rotating Nanosecond Spark Discharges. IEEE Trans. Plasma Sci. 2014, 42, 2412–2413. [Google Scholar] [CrossRef]
  19. Larsson, A.; Zettervall, N.; Hurtig, T.; Nilsson, E.J.K.; Ehn, A.; Petersson, P.; Alden, M.; Larfeldt, J.; Fureby, C. Skeletal Methane-Air Reaction Mechanism for Large Eddy Simulation of Turbulent Microwave-Assisted Combustion. Energy Fuels 2017, 31, 1904–1926. [Google Scholar] [CrossRef]
  20. Discepoli, G.; Cruccolini, V.; Ricci, F.; Di Giuseppe, A.; Papi, S.; Grimaldi, C.N. Experimental characterisation of the thermal energy released by a Radio-Frequency Corona Igniter in nitrogen and air. Appl. Energy 2020, 263, 13. [Google Scholar] [CrossRef] [Green Version]
  21. Zhu, J.J.; Ehn, A.; Gao, J.L.; Kong, C.D.; Alden, M.; Salewski, M.; Leipold, F.; Kusano, Y.; Li, Z.S. Translational, rotational, vibrational and electron temperatures of a gliding arc discharge. Opt. Express 2017, 25, 20243–20257. [Google Scholar] [CrossRef] [Green Version]
  22. Zhu, J.J. Optical Diagnostics of Non-Thermal Plasmas and Plasma-Assisted Combustion. Ph.D. Thesis, Lund University, Lund, Sweden, 2015. [Google Scholar]
  23. Sun, Z.W.; Zhu, J.J.; Li, Z.S.; Aldén, M.; Leipold, F.; Salewski, M.; Kusano, Y. Optical diagnostics of a gliding arc. Opt. Express 2013, 21, 6028–6044. [Google Scholar] [CrossRef]
  24. Beér, J.M.; Chigier, N.A. Combustion Aerodynamics; Applied Science Publication: London, UK, 1972. [Google Scholar]
  25. Cheng, R.K.; Littlejohn, D.; Strakey, P.A.; Sidwell, T. Laboratory investigations of a low-swirl injector with H-2 and CH4 at gas turbine conditions. Proc. Combust. Inst. 2009, 32, 3001–3009. [Google Scholar] [CrossRef] [Green Version]
  26. Niu, Z.T.; Zhang, C.; Ma, Y.F.; Wang, R.X.; Chen, G.Y.; Yan, P.; Shao, T. Effect of flow rate on the characteristics of repetitive microsecond-pulse gliding discharges. Acta Phys. Sin. 2015, 64, 8. [Google Scholar] [CrossRef]
  27. Feng, R.; Li, J.; Wu, Y.; Jia, M.; Jin, D.; Lin, B.X. Experimental Research on Discharge Characteristics of Multiple-channel Gliding Arc Discharge. High Volt. Eng. 2018, 44, 4052–4060. [Google Scholar]
  28. Kong, C.D.; Gao, J.L.; Zhu, J.J.; Ehn, A.; Alden, M.; Li, Z.S. Characteristics of a Gliding Arc Discharge Under the Influence of a Laminar Premixed Flame. IEEE Trans. Plasma Sci. 2019, 47, 403–409. [Google Scholar] [CrossRef]
  29. Kong, C.D.; Gao, J.L.; Zhu, J.J.; Ehn, A.; Alden, M.; Li, Z.S. Effect of turbulent flow on an atmospheric-pressure AC powered gliding arc discharge. J. Appl. Phys. 2018, 123, 9. [Google Scholar] [CrossRef]
  30. Nair, S.; Lieuwen, T. Near-blowoff dynamics of a bluff-body stabilized flame. J. Propuls. Power 2007, 23, 421–427. [Google Scholar] [CrossRef]
  31. Cui, W.; Ren, Y.H.; Li, S.Q. Stabilization of Premixed Swirl Flames Under Flow Pulsations Using Microsecond Pulsed Plasmas. J. Propuls. Power 2018, 35, 190–200. [Google Scholar] [CrossRef]
  32. Cohen, J.; Bennett, J. An experimental study of the transient flow over a backward-facing step. In Proceedings of the 34th Aerospace Sciences Meeting and Exhibit, Reno, NV, USA, 15–18 January 1996; p. 322. [Google Scholar]
  33. Zhou, B.; Brackmann, C.; Li, Q.; Wang, Z.K.; Petersson, P.; Li, Z.S.; Alden, M.; Bai, X.S. Distributed reactions in highly turbulent premixed methane/air flames Part I. Flame structure characterization. Combust. Flame 2015, 162, 2937–2953. [Google Scholar] [CrossRef]
  34. Gao, J.; Kong, C.; Zhu, J.; Ehn, A.; Hurtig, T.; Tang, Y.; Chen, S.; Aldén, M.; Li, Z. Visualization of instantaneous structure and dynamics of large-scale turbulent flames stabilized by a gliding arc discharge. Proc. Combust. Inst. 2019, 37, 5629–5636. [Google Scholar] [CrossRef]
  35. Poinsot, T.J.; Trouve, A.C.; Veynante, D.P.; Candel, S.M.; Esposito, E.J. Vortex-driven acoustically coupled combustion instabilities. J. Fluid Mech. 1987, 177, 265–292. [Google Scholar] [CrossRef]
  36. Bandaru, R.; Miller, S.; Lee, J.G.; Santavicca, D. Sensors for measuring primary zone equivalence ratio in gas turbine combustors. In Proceedings of the Advanced Sensors and Monitors for Process Industries and the Environment, Boston, MA, USA, 22 January 1999; p. 11. [Google Scholar]
  37. Venkataraman, K.; Preston, L.; Simons, D.; Lee, B.; Lee, J.; Santavicca, D. Mechanism of combustion instability in a lean premixed dump combustor. J. Propuls. Power 1999, 15, 909–918. [Google Scholar] [CrossRef]
  38. Huang, S.F.; Wu, Y.; Song, H.M.; Zhu, J.J.; Zhang, Z.B.; Song, X.L.; Li, Y.H. Experimental investigation of multichannel plasma igniter in a supersonic model combustor. Exp. Therm. Fluid Sci. 2018, 99, 315–323. [Google Scholar] [CrossRef]
  39. Liu, Y.; Tan, J.G.; Wang, H.; Gao, Z.W. Radiation Characteristics of Radicals in Low Swirl Methane-Air Flames. J. Propuls. Technol. 2019, 40, 2022–2029. [Google Scholar]
Figure 1. A schematic of the experimental system.
Processes 08 00684 g001
Figure 2. The working progress of pulsating air flow generator (a) in pulsating flow mode, and (b) in stable flow mode.
Processes 08 00684 g002
Figure 3. Air flow rates in different modes.
Processes 08 00684 g003
Figure 4. The multi-burner and electrodes.
Processes 08 00684 g004
Figure 5. (a) Voltage, current, and power waveforms of the gliding arc discharge when average flow rate in stable mode was 30SLM. (b) Zoomed-in view voltage, current, and power waveforms (from t = 0.0183 s to t = 0.0265 s).
Processes 08 00684 g005
Figure 6. Simultaneous images of gliding arc topologies captured by a high-speed camera (sample rate: 30,000 fps, exposure time: 29.23 μs) and two pictures taken using a regular digital camera when average flow rate in stable mode was 30SLM.
Processes 08 00684 g006
Figure 7. (a) Voltage, current, and power waveforms of the gliding arc discharge when average flow rate in stable mode was 120SLM. (b) Zoomed-in view voltage, current, and power waveforms (from t = 0.0108 s to t = 0.0124 s).
Processes 08 00684 g007
Figure 8. Simultaneous images of gliding arc topologies captured by a high-speed camera when average flow rate in stable mode was 120SLM (sample rate: 30,000 fps, exposure time: 29.23 μs).
Processes 08 00684 g008
Figure 9. (a) The average power in stable flow mode; (b) The average power in pulsating flow mode.
Processes 08 00684 g009
Figure 10. (a) The lean blowout limits in stable flow mode; (b) The lean blowout limits in pulsating flow mode.
Processes 08 00684 g010
Figure 11. The relative increases in equivalence ratio when the flow mode changed from stable to pulsating.
Processes 08 00684 g011
Figure 12. The lean blowout limits in plasma-pulsating flow mode.
Processes 08 00684 g012
Figure 13. The relative decreases in equivalence ratio when gliding arc plasma was applied to the pulsating flame.
Processes 08 00684 g013
Figure 14. The time signal and frequency signal of flame pressure when ( V ˙ ¯ a i r ) p u l s a t i n g = 120 SLM .
Processes 08 00684 g014
Figure 15. (a) The dynamic process of swirl flame in pulsating air flow mode; (b) the dynamic process of swirl flame in plasma-pulsating flow mode (sample rate: 30,000 fps, exposure time: 29.23 μs).
Processes 08 00684 g015
Figure 16. (a) The dynamic process of CH distribution in pulsating air flow mode; (b) The dynamic process of CH distribution in plasma-pulsating air flow mode (sample rate: 1000 fps, exposure time: 1 ms).
Processes 08 00684 g016

