Article

Numerical Simulation of Cavitation Performance in Engine Cooling Water Pump Based on a Corrected Cavitation Model

1
Research Center of Fluid Machinery Engineering and Technology, Jiangsu University, Zhenjiang 212013, China
2
Institute of Fluid Engineering Equipment Technology, Jiangsu University, Zhenjiang 212009, China
3
College of Mechanical Engineering, Nantong University, Nantong 226019, China
*
Authors to whom correspondence should be addressed.
Processes 2020, 8(3), 278; https://doi.org/10.3390/pr8030278
Submission received: 26 December 2019 / Revised: 22 February 2020 / Accepted: 24 February 2020 / Published: 28 February 2020

Abstract

:
To analyze the internal flow of the engine cooling water pump (ECWP) under thermodynamic effect, Zwart cavitation model based on the Rayleigh-Plesset equation is corrected, and NACA0015 hydrofoil was selected to verify the corrected model. The cavitation performances of ECWP with different temperatures were numerically simulated based on a corrected cavitation model. Research results show that simulation values of pressure distribution coefficient in hydrofoil surface at 70 °C are in closest agreement with experimental values when the evaporation and condensation coefficients are 10 and 0.002, respectively. With the decrease of absolute pressure in pump inlet, bubbles firstly occurred at the blade inlet side near the suction surface and then gradually extended to the pressure surface, finally clogged the impeller passage. Compared to the inlet section, the cavitation degree is much more serious close to the trailing edge. With the temperature increases, the cavitation in ECWP occurs in advance and rapidly, and the temperature plays an important role in promoting cavitation process in ECWP. Based on the unsteady simulation of ECWP, the influence of cavitation on the performance characteristics is studied. The results provide a theoretical reference for the prediction and optimization of the cavitation performance in ECWP.

1. Introduction

As the key component of circulating cooling water in engine cooling system, the engine cooling water pump (ECWP)’s performance not only impacts the dynamic and economical property of engine but also shortens the lifespan of the entire machine. Compared with general pumps, cavitation is more likely to occur in ECWP as a result of its high working temperature, large variation of rotation speed, and its size limitation restricted by the engine. Currently, cavitation has become a leading inducement shortening operation life of vane pumps, inducing hydraulic excitation and other detriments, which gravely effects the normal operation of engine cooling system [1,2,3].
Cavitation (erosion), which belongs to multi-phase flow category, is a phase transition phenomenon when the pressure of internal fluid is lower than the saturation pressure [4,5,6]. Nowadays, there exist two main numerical models to handle multiphase flow, which are homogeneous flow model and the non-homogeneous model. As the thermodynamic effect plays an important role in the cavitation process, it has already attracted the attention of researchers. In terms of theoretical analysis, Plesset [7] deduced the mechanism of bubble growth in water under high temperature. Fruman [8] proposed a method that uses thermal conduction in bubble surface to handle thermal dynamical process of cavitation, he applied low temperature medium as the study object to compare the temperature drop in cavitation flows, simulation results are basically the same with experimental data. Franc [9,10] took thermodynamic effect into consideration to study the cavitation phenomenon in the inducer, and the results found that with the increase of temperature, the length of the cavity is reduced and the cavitation performance is enhanced. Cervone [11,12] applied inducer and NACA0015 hydrofoil as research objects to study the cavitation flow at different temperatures, the results found that as the temperature increases, pressure pulsation degree in inducer reduces, the length and thickness of cavity in hydrofoil increases at the same cavitation number. Yoshida [13] studied rotating cavitation at three different temperatures and analyzed the distribution of cavity lengths and temperatures. Gustavsson [14] studied the cavitation flow characteristics in fluorinated ketone of NACA0015 hydrofoil at different speeds and different attack angles.
Based on the Plesset-Zwick formula, Zhang [15] proposed a cavitation model which considers the bubble growth rate controlled by heat transfer, introduced the concept of thermal boundary of the bubbles. Ji [16] proposed a cavitation model which took thermodynamic effect into account based on local uniform equilibrium flow method, considering the local liquid mass fraction and the absolute difference between local pressure and saturated vapor pressure. Wang [17] applied NACA0066 hydrofoil as the research object, considered the effect of turbulent kinetic energy on cavitation flow, and modified the vaporization pressure formula. Shi [18,19,20] considered the change function of physical parameters with temperature and introduced the improved Kunz and Merkle cavitation model through the secondary development technology of CFX, and considered the cavitation effect in the source term of energy equations. Tang Fei [21] used the homogeneous multiphase flow model and considered cavitation thermodynamic effect to numerically analyze the hypothermia rotating cavitation phenomenon in two-dimensional cascade at low temperature. In summary, the research on cavitation process considering the thermodynamic effect has made some achievements, but these studies mainly focus on the cavitation flow of inducers and hydrofoils, while there are few studies on cavitation under the thermodynamic effect in the vane pumps. The cavitation models applied in the existing researches especially on cavitation of ECWP [22,23,24,25], have not considered the thermodynamic effect, which results in low simulation accuracy and incomplete understanding about its true cavitation flow pattern and mechanism.
In this study, the Zwart-Gerber-Belamri cavitation model is corrected based on the Rayleigh-Plesset equation. By comparing the numerical and experimental results of NACA0015 hydrofoil [15], the reliability of the corrected model was verified. Based on the corrected cavitation model considering the thermodynamic effect, the cavitation performances of ECWP were numerically simulated. Comparison and analysis were carried out emphatically about the cavitation forming process and interfacial mass exchange rate at 25 °C. Besides, the influence of temperature variation on cavitation performance of ECWP have also been discussed. By performing the unsteady simulation of ECWP, the periodic development process of bubbles is investigated and the periodic change process of cavitation effect is explored. This study provides a theoretical basis for the optimization design of ECWP.

2. Research Model

2.1. Calculation Model

The design and structure parameters of ECWP discussed in this study are shown in Table 1. The working medium is water. Considering the cylinder structure, the working environment and the space limitation of the engine, the design method of ECWP is different from that of other types of centrifugal pumps. The volute of the researched pump is casted together with the cylinder block of the engine, the cross-section of the volute is almost rectangular, the impeller is semi-open with a comparatively wide blade outlet, the cross-section of suction chamber is annular, while its diameter is 90 mm. Three-dimensional models generated by software Pro/E are shown in Figure 1.

2.2. Mesh Generation

The whole computational domain is divided into three parts: inlet section, impeller region and outlet section. By using software ICEM, the grid of three parts of the computational domain is generated separately. The whole computational domain is discretized with hexahedral cells. To increase the accuracy of the simulation, local refinement was conducted both in the impeller inlet side and tongue of volute. The meshes are shown in Figure 2.

2.3. Grid Independence Verification

By using the same grid topology, the quality of the grid is guaranteed to be consistent with the changing of grid nodes number on the topology. Mesh independence test in ECWP by using the same boundary conditions was conducted in the rated flow rate under 25 °C temperature, as shown in Table 2. When the total cell number of computational domains reaches 2.34 million, the head and efficiency change little with the increase of mesh number and the error is less than 2%, which meets the mesh independence testing requirements.

3. Simulation Methods

3.1. Governing Equations

In this paper, by assuming that the two phases of gas and liquid are considered as homogeneous incompressible fluid and there is no slippage between phases, the homogeneous equilibrium flow model is used to simulate the cavitation flow of gas–liquid two-phase. In this model, the density of gas–liquid mixture is regarded as a uniform single density, and the mixture has the same flow rate and pressure. The basic governing equations include continuity equation (shown in Equation (1)), momentum equation (shown in Equation (2)), energy equation (shown in Equation (3)) and transport components equation (shown in Equation (4)).
ρ m t + ( ρ m u j ) x j = 0
( ρ m u i ) t + ( ρ m u i u j ) x j = p x i + x j [ ( μ + μ t ) ( u i x j + u j x i 2 3 u i x j δ i j ) ]
t [ ρ m c p T ] + x j [ ρ m u j c p T ] = x j [ ( μ Pr L + μ Pr t ) h x j ] { t [ ρ m ( f v L ) ] + x j [ ρ m u j ( f v L ) ] }
ρ v α v t + x j · ( ρ v α v u j ) = m + m
In the continuity equation, ρm is the density of gas–liquid mixture, and the equation is ρm = ρl (1 − αv) + ρvαv; t represents the time; uj is the component of velocity u in j direction. In the momentum equation, μ, μt is laminar viscosity and turbulent viscosity; p represent pressure; δij is Kronecker function; when i = j, δij = 1; when Ij, δij = 0. In the energy equation, h represents the enthalpy; Cp is specific heat capacity at constant pressure; αl is volume fraction of liquid phase; αv is volume fraction of vapor phase; fv is mass fraction of vapor; L represents the latent heat of vaporization; PrL and Prt represent the laminar Prandtl number and turbulent Prandtl number of mixed medium respectively.

3.2. Modification of Cavitation Model

The working medium of ECWP is high-temperature water, its vapor pressure, density, latent heat of vaporization and heat transfer coefficient are all functions of temperature. In this case, interfacial mass transfer should take into account cavitation thermodynamic effect. Therefore, to simulate cavitation performance and phenomenon of pumps more accurately, the current cavitation model needs some appropriate correction by adding the source term that considers the thermodynamic effect.
The current cavitation models based on transport equation (Transport Equation Model, TEM) including Zwart–Gerber–Belamri model, Singhal full-cavitation model, Schnerr–Sauer model, Kunz and Merkle model, are used to simulate phase transformation between vapor and liquid. In this research, Zwart model was modified based on R-P thermal equation [26], condensation source term (m+) and evaporation source term (m) are as follows:
m + = C vap 3 α nuc ( 1 α v ) ρ v R B 2 3 p v ( T ) p ρ l + R thermal     ( p     p v ( T ) )
m = C cond 3 α v ρ v R B 2 3 p p v ( T ) ρ l + R thermal     ( p   >   p v ( T ) )
where Cvap and Ccond are empirical coefficients, Cvap = 50, Ccond = 0.01; αnuc is initial volume fraction of vapor which is generally selected as 5 × 10⁻⁴; αv is the vapor volume fraction; ρv is the vapor density, kg/m3; RB is bubble radius and its value is 1 × 10⁻⁶ m; ρl is the density of the surrounding liquid, kg/m3; pv(T) is the vapor pressure of the surrounding liquid that considering thermal effect, Pa; Rthermal is thermal term.
Thermal term Rthermal, as is shown in Equation (7), can obtained by using Clapeyron equation to deduce growth rate of bubble radius. The modified cavitation model is recorded as TCM (Thermal Cavitation Model):
R thermal = 2 3 ρ l ρ v ( ρ l ρ v ) T L ( T T ) ρ l
where L is latent heat of vaporization; T is reference temperature, K.

3.3. Boundary Conditions

In this paper, RNG kε turbulence model is used to simulate the cavitation characteristics of ECWP under different temperatures by adopting Ansys CFX 17.1. Total pressure was set as the inlet boundary condition, the reference pressure was selected as 0 Pa, and the occurrence of the cavitation is controlled by adjusting the total pressure value at the inlet. The outlet boundary condition was set as mass flow rate, which was used to control the mass flow of the model. About the transient simulation, the time step of transient simulation is 2.703 × 10⁻⁴ s, which corresponding to 6° of impeller rotating. The total time of transient simulation is 1.459 s, which corresponding to the time required for impeller to rotate 90 revolutions. Standard wall function was used for the near wall boundary treatment and the boundary condition was set as adiabatic no-slip wall with the roughness of 12.5 μm. The convergence criterion was set as 1 × 10⁻⁴ in order to provide a relatively accurate numerical result. The specific computational setup is shown in Table 3.
In numerical simulation of cavitation phenomenon and performance in ECWP, the degree of cavitation was controlled by adjusting the inlet total pressure, the average bubble radius is set as 2 × 10⁻⁶ m. Based on the physical parameters of water and vapor [27] shown in Table 4 and Table 5, the vapor pressure pv at different temperatures is respectively set as 3169 Pa (25 °C), 12,310 Pa (50 °C) and 31,164 Pa (70 °C). The initial water volume fraction was set as 1, the vapor volume fraction was set as 0, and the calculation results of external characteristics under this inlet pressure was set as initial condition of cavitation simulation.
The dimensionless parameters including cavitation number σ and head coefficient ψ are defined as follows:
σ = p p v 0.5 ρ v 2
ψ = 2 g h u 2 2
where p is the reference pressure, Pa; v is the reference velocity, m/s; u2 is the blade outlet velocity, m/s.

4. Results Analysis

4.1. Verification of Corrected Cavitation Model Reliability

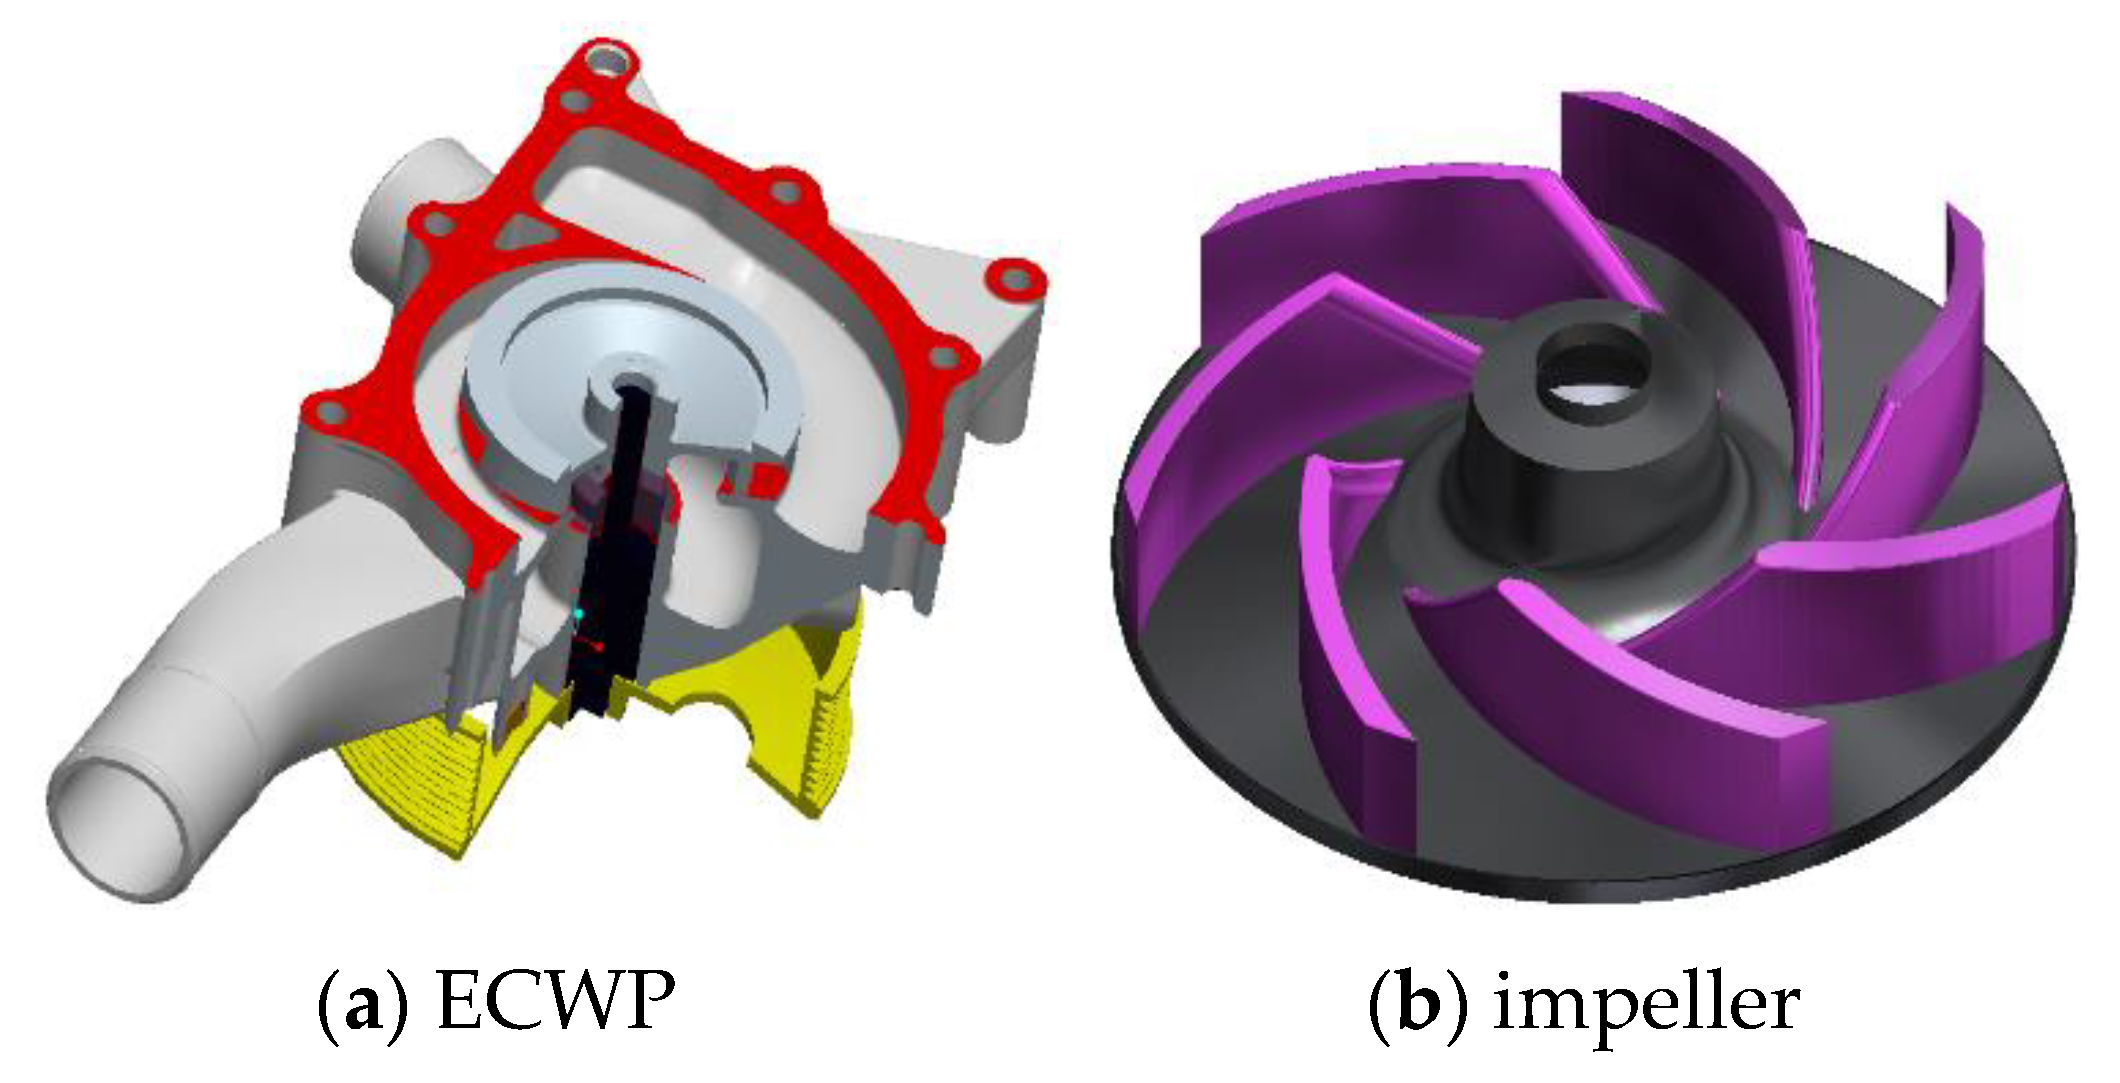
NACA0015 hydrofoil is chosen to verify the reliability of the corrected cavitation model and its parameters are as follows: the chord length is 115 mm, the wingspan is 80 mm, the angle of attack is adjustable (4°, 5°, 6°, and 8°). During the experiment, three pressure taps are set evenly at 100 mm in front of the hydrofoil and at 140 mm in rear of the hydrofoil. Meanwhile, ten pressure taps were arranged on suction surface of NACA0015 hydrofoil, and two pressure taps were arranged on pressure surfaces of the hydrofoil, which are all shown in 
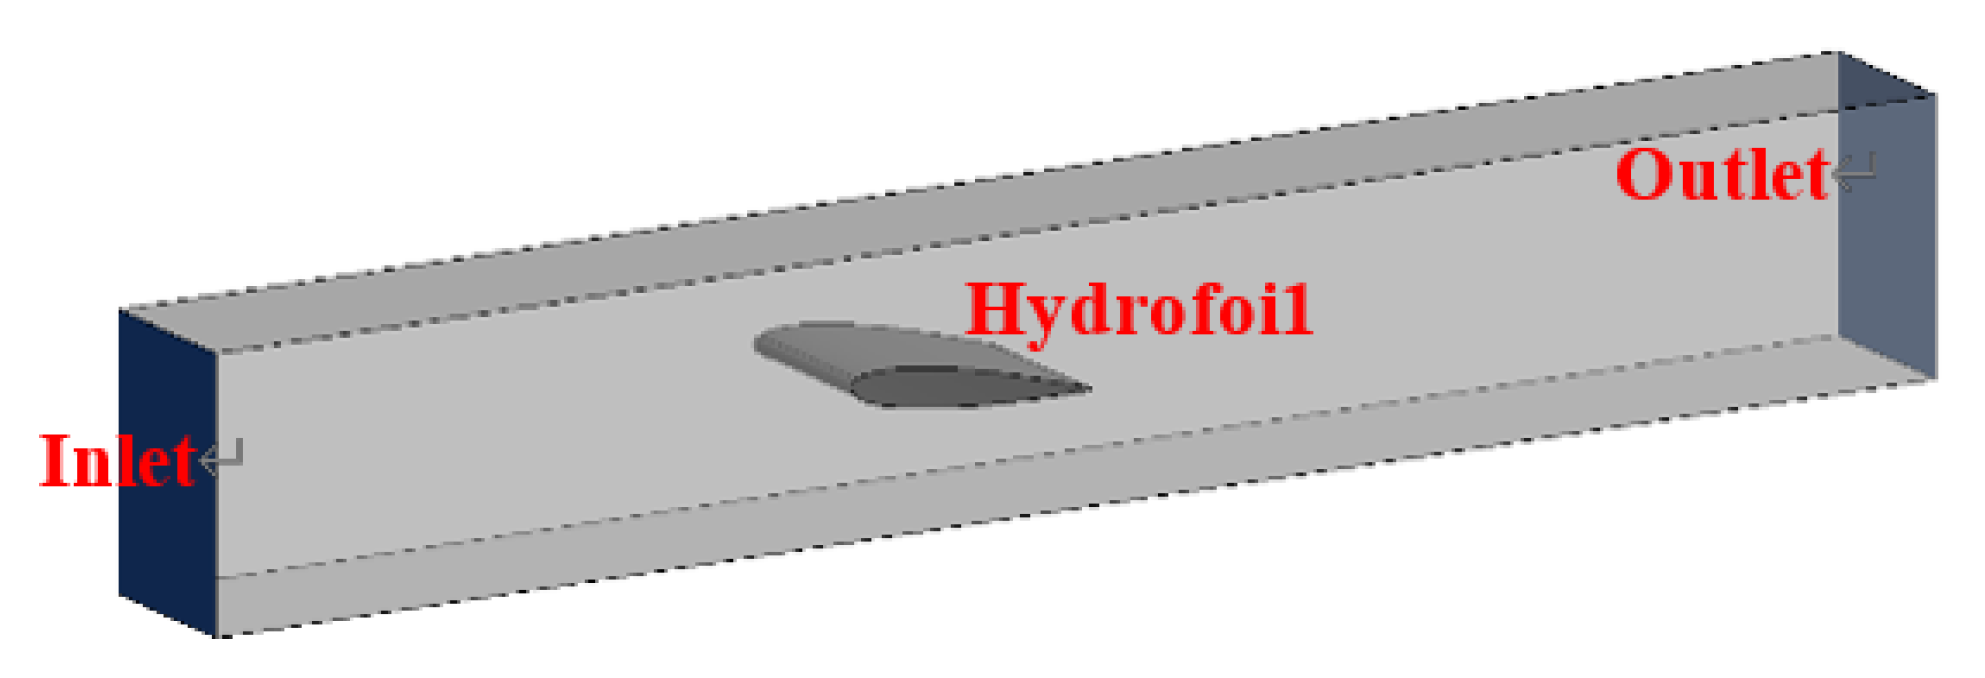
Figure 3. Three-dimensional model of numerical simulation is shown in Figure 4. Detailed description about the experiment is referred to reference [9,10].
The total mesh number reaches about 1.01 million, the whole meshes and the partial view of the head and tail of hydrofoil are shown in Figure 5. The average y+ value of mesh in suction surface of hydrofoil is 21.2 while in pressure surface is 18.5 as shown in Figure 6. The boundary conditions are consistent with the experiment, which applied speed as the inlet boundary condition and used static pressure of mandatory outflow as outlet boundary condition. The suction surface and the pressure surface of the hydrofoil are set as slip-free solid wall, and both sides are symmetrical. Surface roughness of hydrofoil is ignored and the convergence precision is set as 10−5.
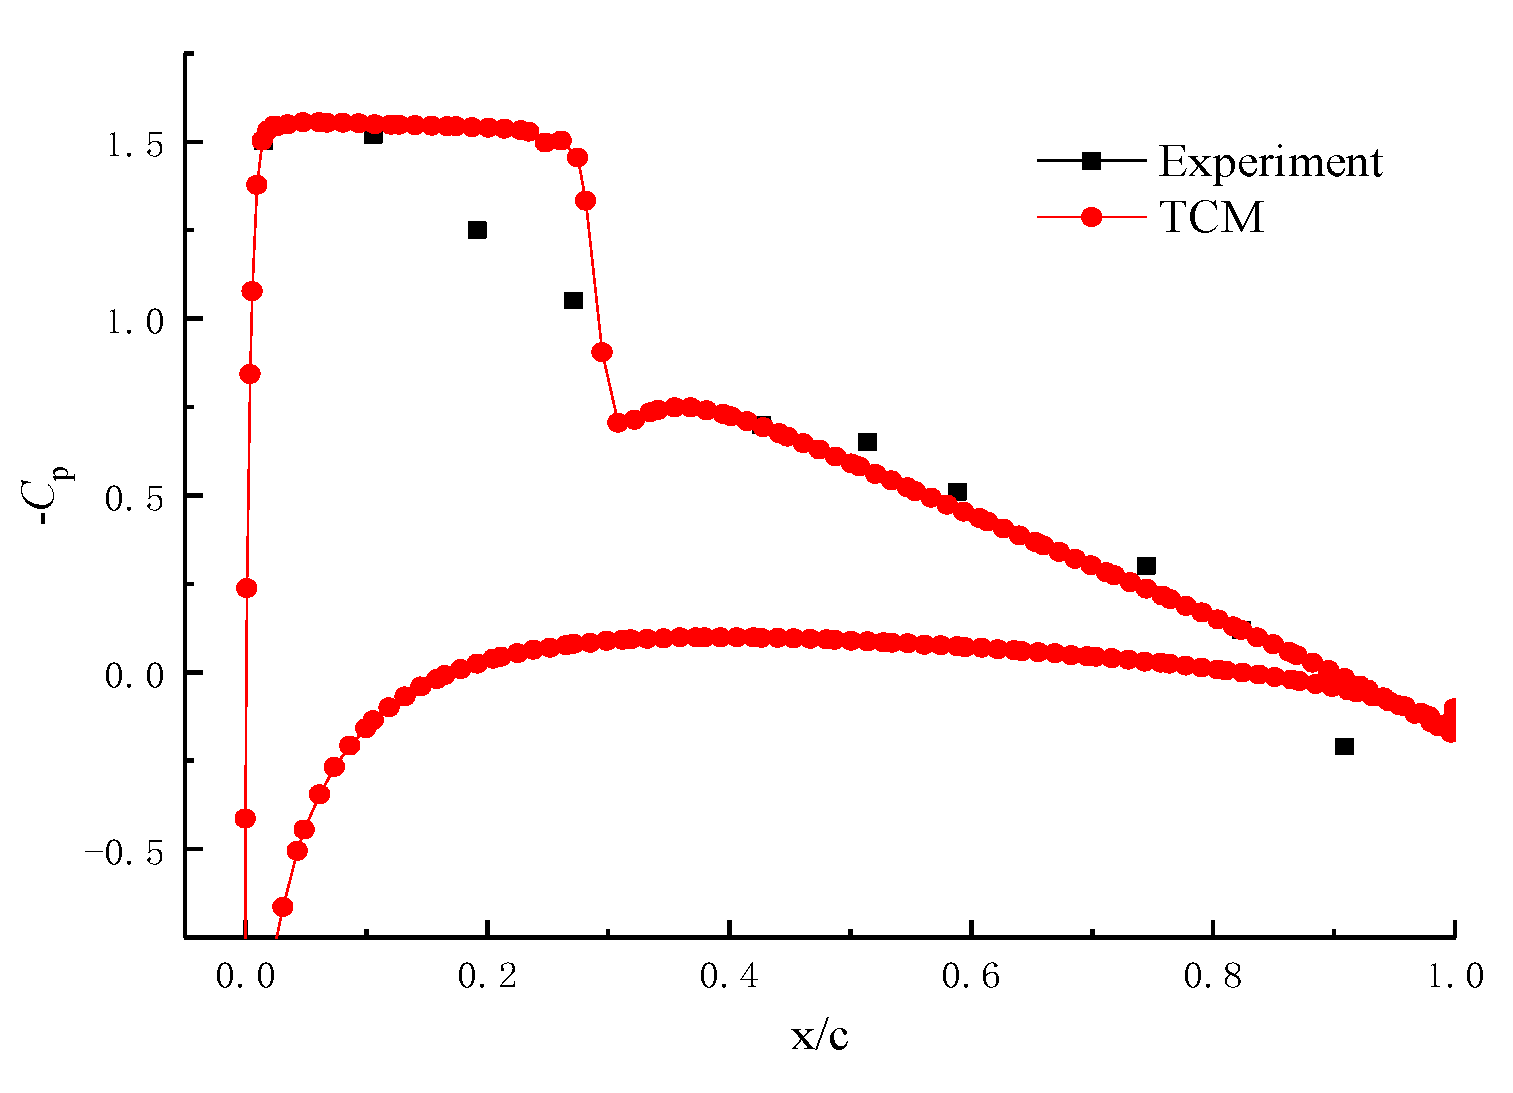
The pressure distribution coefficient in hydrofoil surface is obtained through corrected cavitation model at 70 °C, and its default evaporation and condensation coefficients are 0.01 and 50 respectively. Besides, the value of pressure distribution coefficient in surface of hydrofoil is compared with the experimental values, which is shown in Figure 7. As can be seen from the figure, the numerical data meets well with the experimental data in the rear of the hydrofoil, but large difference exists in the head of hydrofoil where the chord length ratio ranges from 0.1 to 0.4. Compared with the results in reference [17] that applied the full cavitation model with the adjunction of energy equation, the corrected cavitation model in this paper is much more precise than that of cavitation model.
Considering the impact of evaporation and condensation coefficient, other two groups of coefficients are defined as 10, 0.002 and 1, 0.0002 based on experience. Diagram of the pressure distribution coefficients in hydrofoil surface are contrast when cavitation model is under three different evaporation and condensation coefficients at 70 °C, which is shown in Figure 8. As can be seen in the figure, when the evaporation coefficient is 10 and condensation coefficient is 0.002, the numerical data is in best agreement with the experimental data. Along with the decrease of condensation and evaporation coefficient, pressure coefficient distribution curve tends to be smooth gradually. However, when evaporation coefficient is 1, several important turning points of chord ratio did not appear, the growth rate of bubbles was inhibited, the volume fraction of bubbles becomes lower, the shape of the bubble zone becomes flat. Therefore, the thermodynamic effect have been considered in the cavitation model of this study, and evaporation and condensation coefficient are respectively 0.002 and 10, which are set as the same in reference [16].

4.2. Comparisons of Hydraulic Performance Characteristics

Figure 9 shows the hydraulic performance curves under different temperatures of ECWP based on corrected cavitation model. As can be seen from the figure, as the temperature increases, the pump head rises, the pump shaft power decreases and the pump efficiency increases. The same phenomenon has been found in the aviation fuel pump with Daqing RP-3 kerosene as working medium [28], which shows the universality of this phenomenon. The impact is relatively small that temperature has on the external characteristics of the pump. From 25 °C to 70 °C, head difference under the design condition is about 0.9%, the power difference is about 2.5% and efficiency difference is about 3%.

4.3. Bubble Morphology in the Forming Process of Cavitation at 25 °C

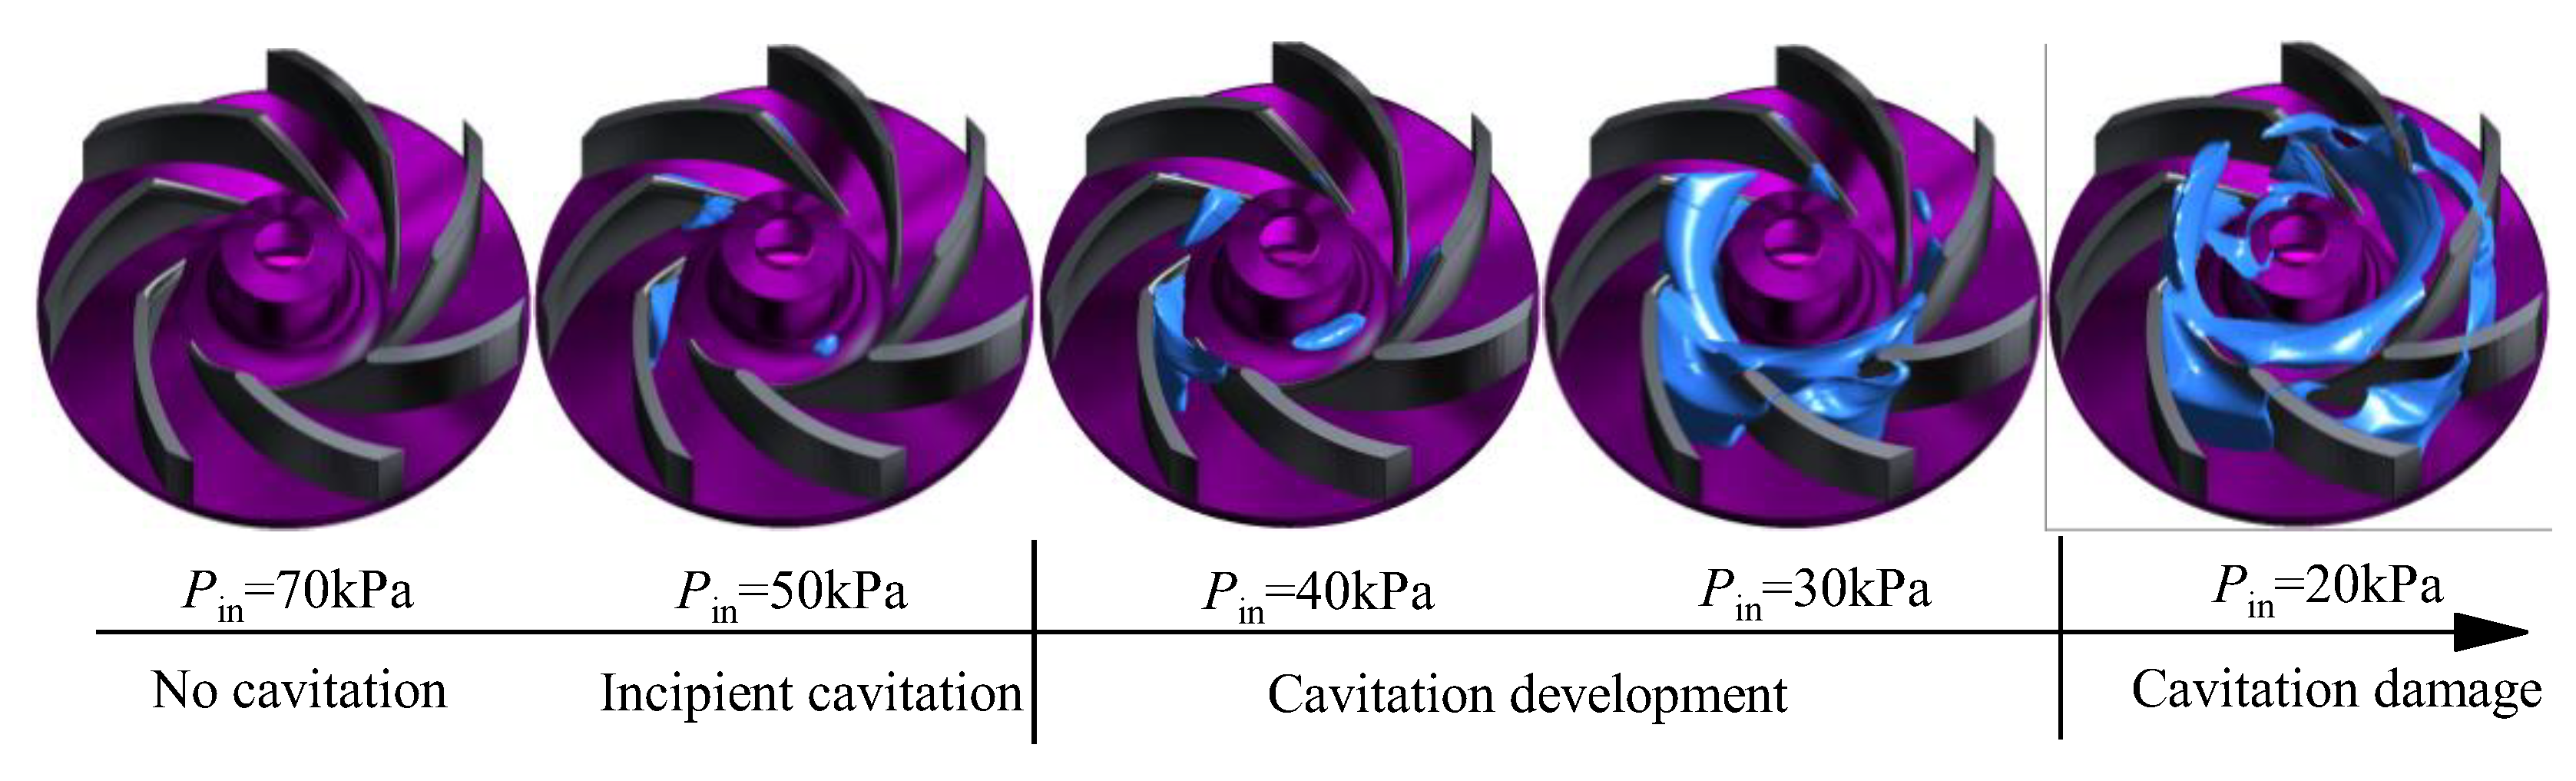
The appearance of bubbles is the most intuitive cavitation phenomenon. The larger the bubble volume fraction is, the more serious the cavitation phenomenon is. Meanwhile, if bubbles flow to the high pressure zone it will collapse and cause cavitation damage, which can seriously damage the safe and stable operation of the pump. Figure 10 shows cavitation formation processes and distributions in ECWP under different inlet pressures when the internal volume fraction of bubble is 0.1, the temperature is 25 °C, flow rate is 150 L/min with 3700 r/min rotation speed. When inlet absolute pressure is comparatively high, cavitation does not occur in impeller. With the reduction of inlet absolute pressure, bubbles firstly occur at the blade inlet side near the suction surface, which is called cavitation inception. Along with the further reduction of inlet absolute pressure, net positive suction head (NPSH) decreases gradually while bubble distribution area expands, bubbles expand gradually from suction surface to pressure surface. During this process, cavitation gets developed. When the absolute pressure of pump inlet continues to decrease below the critical cavitation point, the quantity of bubbles will have a significant increase, the bubbles begin to clog the entire flow path of impeller, the bubbles will collapse when flowing to the high-pressure zone. The impeller will be shocked and eroded strongly when bubbles collapse, which will cause cavitation damage and significant decline in external characteristic of pump.
Impeller inlet parameters have signification impact on the internal impeller cavitation, and impeller cavitation area is mainly near the suction surface in the impeller inlet. In order to learn more details about cavitation bubbles, the distribution of bubbles in different cross-sections of impeller is researched in this study. The relative position of blade and tongue is shown in Figure 11a. Three selected axial cross-sections (Planes 1–3) are shown in Figure 11b.
The interphase mass conversion of different cross-sections, which obtained under 40 kPa inlet pressure condition, is shown in Figure 12. As can be seen from the figure, in these three cross-sections, the areas where cavitation is generated are all near suction surface of blade inlet, bubbles flow to the suction surface near the mid and fore sections of blade (as is shown in red area) and condense in there. At the same time, due to the impacts of volute passage and tongue, the cavitation degrees of different blades along the circumferential direction are totally different. There is no bubble on the suction surface of two blades that have just passed through the volute tongue, and the cavitation on the blades far away from the tongue is more serious. Although bubble distribution in three kinds of blade cross-sections is similar, but the degree of cavitation in different cross-sections is different. From cross-section 1 to cross-section 3 (the diameter of inlet flow line becomes larger gradually), the region where cavitation occurs increases, the area of these region becomes larger, which indicates that the cavitation degree is more serious close to trailing edge, the cavitation is comparatively lighter on cross-section 1 where the inlet diameter of the impeller streamline is larger. On the other hand, it also implies that the inlet diameter of the impeller has a great impact on the cavitation performance, the better blade inlet environment means stronger anti-cavitation ability. Namely, the uniformity of the flow upstream of the impeller inlet is a significant method for reducing cavitation in vane pumps [29,30].

4.4. Influence of Temperature on Cavitation Performance

4.4.1. Cavitation Performance

In order to study the cavitation law of ECWP considering thermodynamic effect, the modified cavitation model is applied in numerical calculation of ECWP under three different temperatures (25 °C, 50 °C, and 70 °C).
The cavitation performance curve of ECWP based on the corrected cavitation model with 150 L/min flow rate and 3700 r/min rotation speed was obtained as shown in Figure 13. It is known from the figure that the head difference is small at different temperatures when there is no cavitation in impeller.
Same as the general centrifugal pump, the critical cavitation point is defined at the point where head declines by 3%. As can be seen from cavitation performance curves, there is a big difference between cavitation curves at different temperatures. The inlet pressure in critical point of cavitation at 25 °C is 24.5 kPa, and at 70 °C is 42 kPa. It means that, it is more likely for ECWP to occur cavitation at 70 °C under the same conditions. On the other hand, it also indicated that temperature plays a significant effect in promoting cavitation growth process in ECWP.
The head curve in Figure 13b shows the stage from cavitation initiation to cavitation. The slope of dotted lines a, b, c is defined as the ratio of the head value that fallen by 3% to the corresponding pressure, which can be regarded as the rate of cavitation. It can be seen that the slope of dotted line c at 70 °C is the largest, which indicates that the higher the temperature is, the more rapidly cavitation occurs.

4.4.2. Analysis of Cavitation Flow Field

The bubble distribution in impeller is obtained when the flow rate is 150 L/min, and the absolute pressure of pump inlet is 40 kPa, as shown in Figure 14. At 25 °C, cavitation is generated in suction surface of leading edge while morphology of bubble is small. The position of bubble at 50 °C is the same as that of 25 °C, but the bubbles area is significantly larger accompanied the trend of bubble shed. At 70 °C, bubbles clog most of the flow passage inside impeller along with a serious shed. It can be seen from the curve of Figure 13 that when the inlet pressure is 40 kPa, the head at 25 °C does not decrease, cavitation is in its inception stage. While the head at 50 °C begins to drop, cavitation is in the developing stage. At 70 °C, the head has dropped more than 3%, which indicates serious cavitation has occurred in this stage. Bubbles distribution inside impeller is consistent with the curve of cavitation performance.
Due to the complexity of the flow in the impeller under cavitation, to accurately distinguish the position and structure of the vortex, this paper uses the Q-criterion vortex identification method. Figure 15 shows the vortex structure in impeller region of ECWP under different temperatures, and the Q-criterion is taken as Q = 1 * 106 s−1. As the cavitation in the impeller region increases more severely with temperature, the vortex scale in the impeller also increases greatly. At 70 °C, the vortex generated by cavitation has blocked the entire flow path and is massively deposited in the impeller inlet. Figure 16 shows the distribution of the turbulence kinetic energy of the blade more intuitively. Compared with the other two temperatures, the turbulence kinetic energy of the whole impeller region increases significantly under 70 °C, and the high turbulence kinetic energy distribution occurs in the leading edge and tip region of impeller inlet due to mass bubble shedding.
In summary, with the increase of temperature, the cavitation in ECWP will occurs in advance and rapidly. A critical temperature is found when considering the thermodynamic effect, and for 3000–4000 r/min rotational speed, the value is 70 °C [31]. When temperature is under 70 °C, the increase of temperature will boost the growth of cavitation; our simulation results also follow this rule. Temperature (the thermodynamic effect of medium) has significant impacts on the occurrence and development of cavitation in ECWP. The existence of thermodynamic effect not only affects the time sequence of cavitation occurrence, but also affects the speed and extent of cavitation development. Therefore, the thermodynamic effect of cavitation should be considered in the research of the cavitation in medium with varying temperatures.

4.5. Unsteady Cavitation Evolution in ECWP

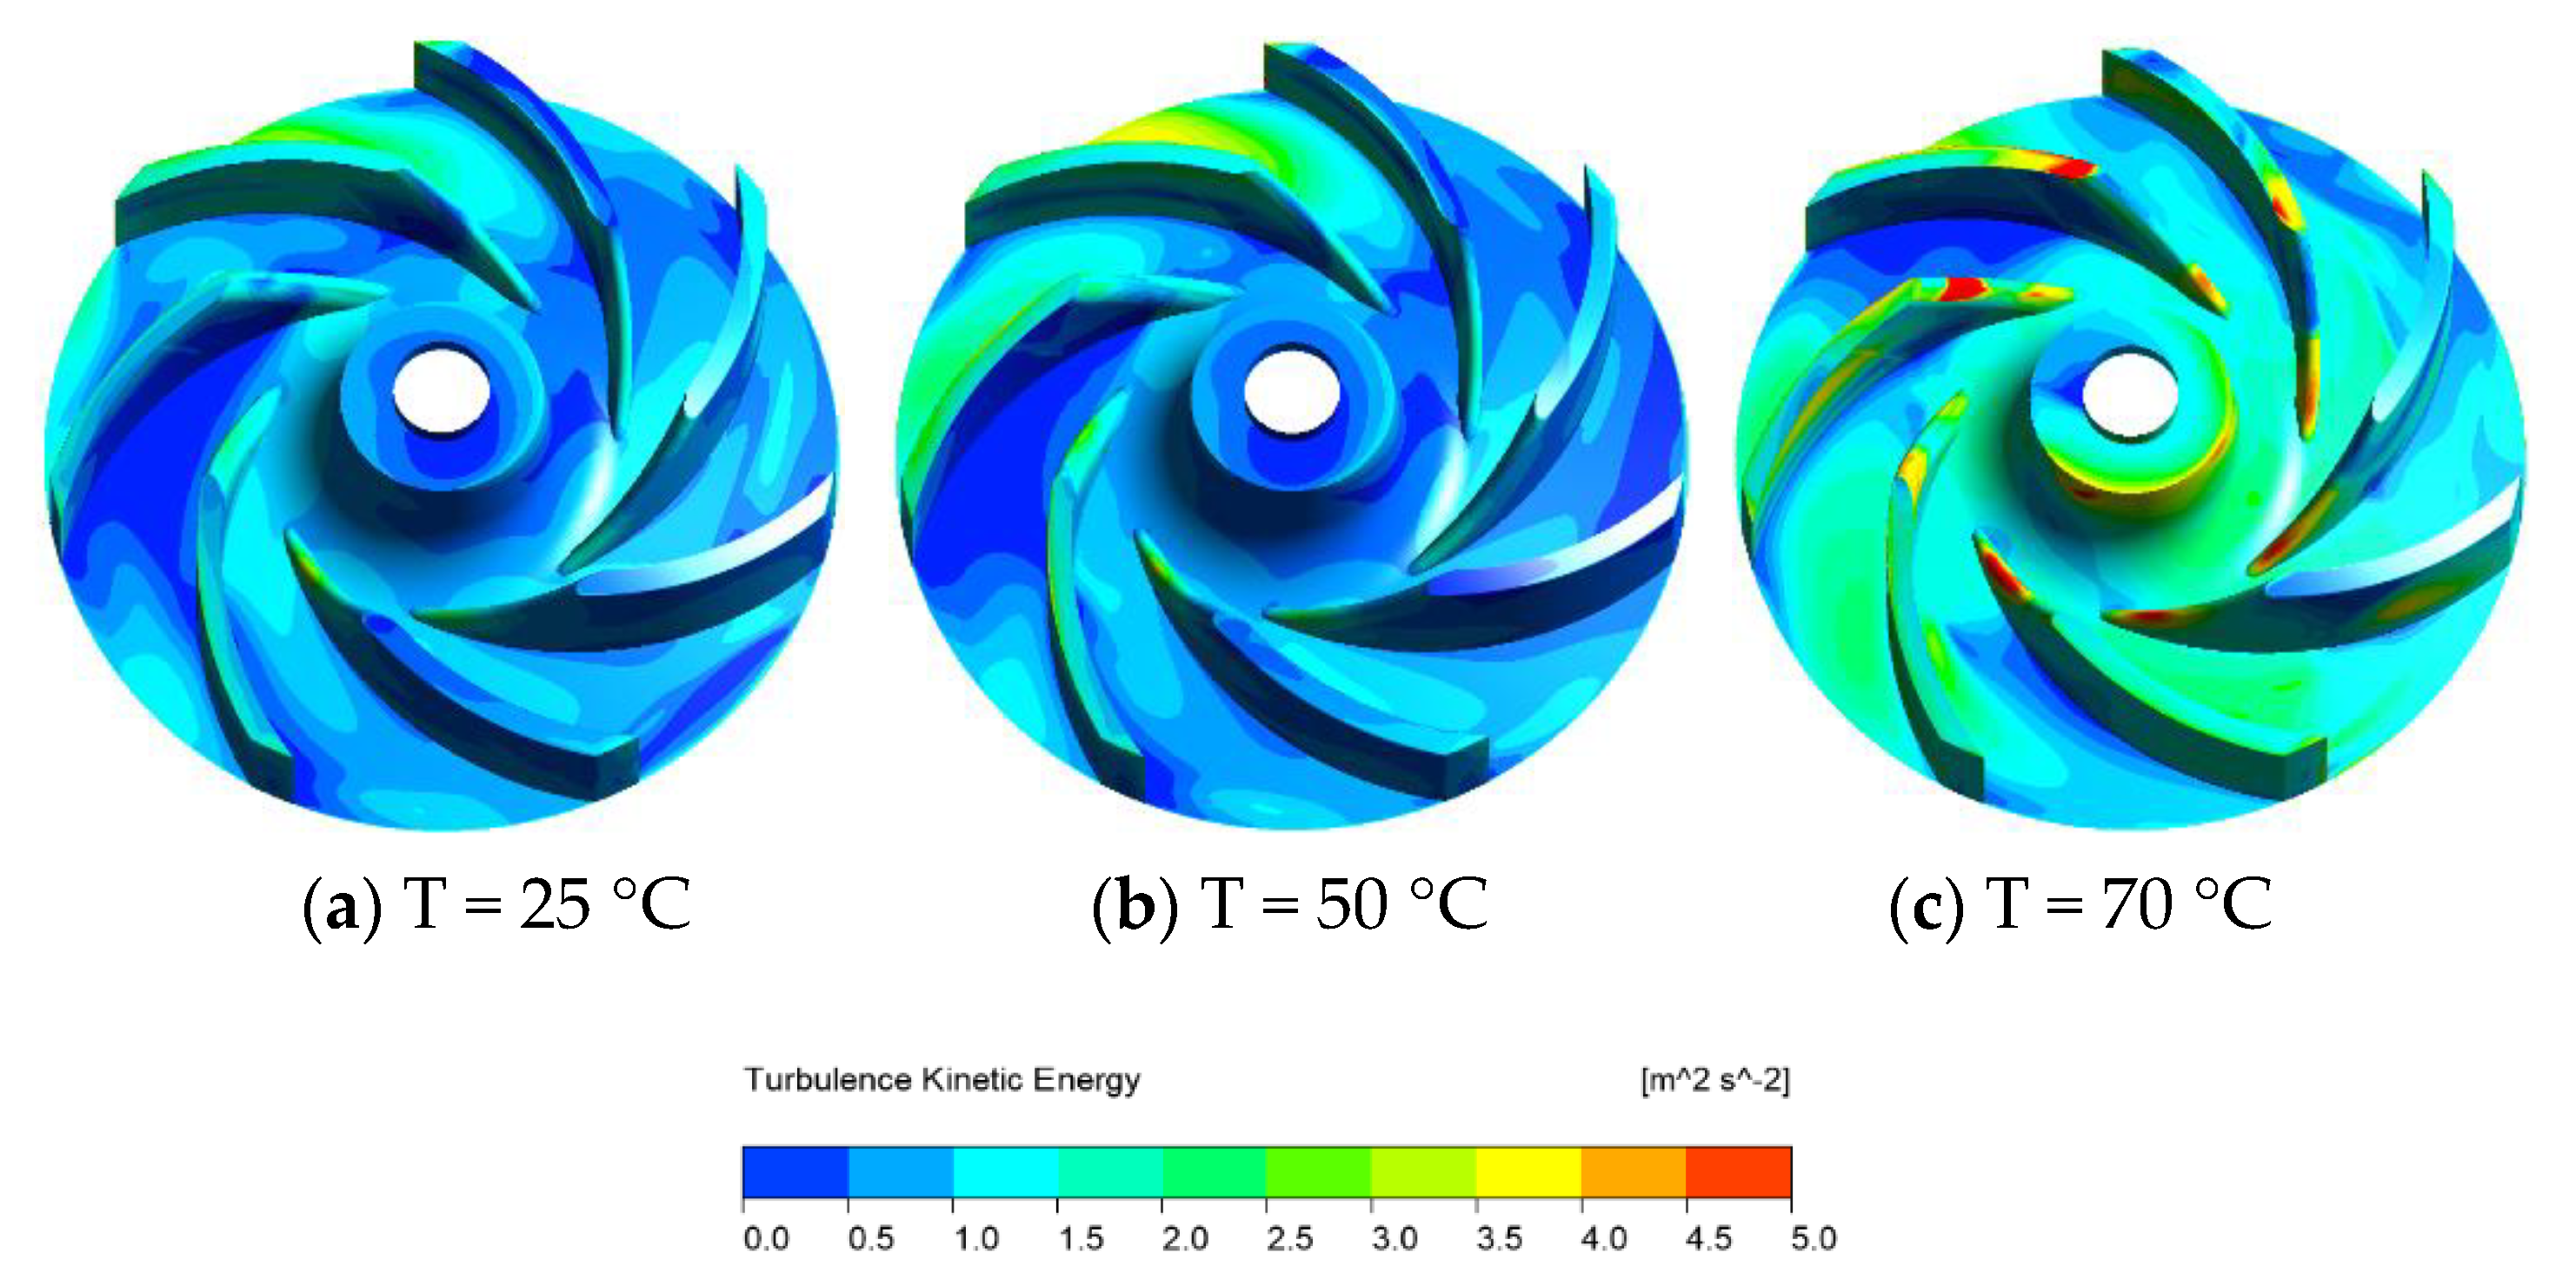
As can be seen from the above, temperature plays a catalytic role in the cavitation effect of ECWP. Cavitation is most significant at 70 °C when the inlet pressure is 40 kPa, and the vortex in the pump is also very chaotic. At the same time, the daily working temperature of ECWP is about 70 °C, so the modified cavitation model is used to calculate the unsteady simulation of ECWP at 70 °C, to explore the transient process of cavitation and the impact on the performance characteristics of the pump.
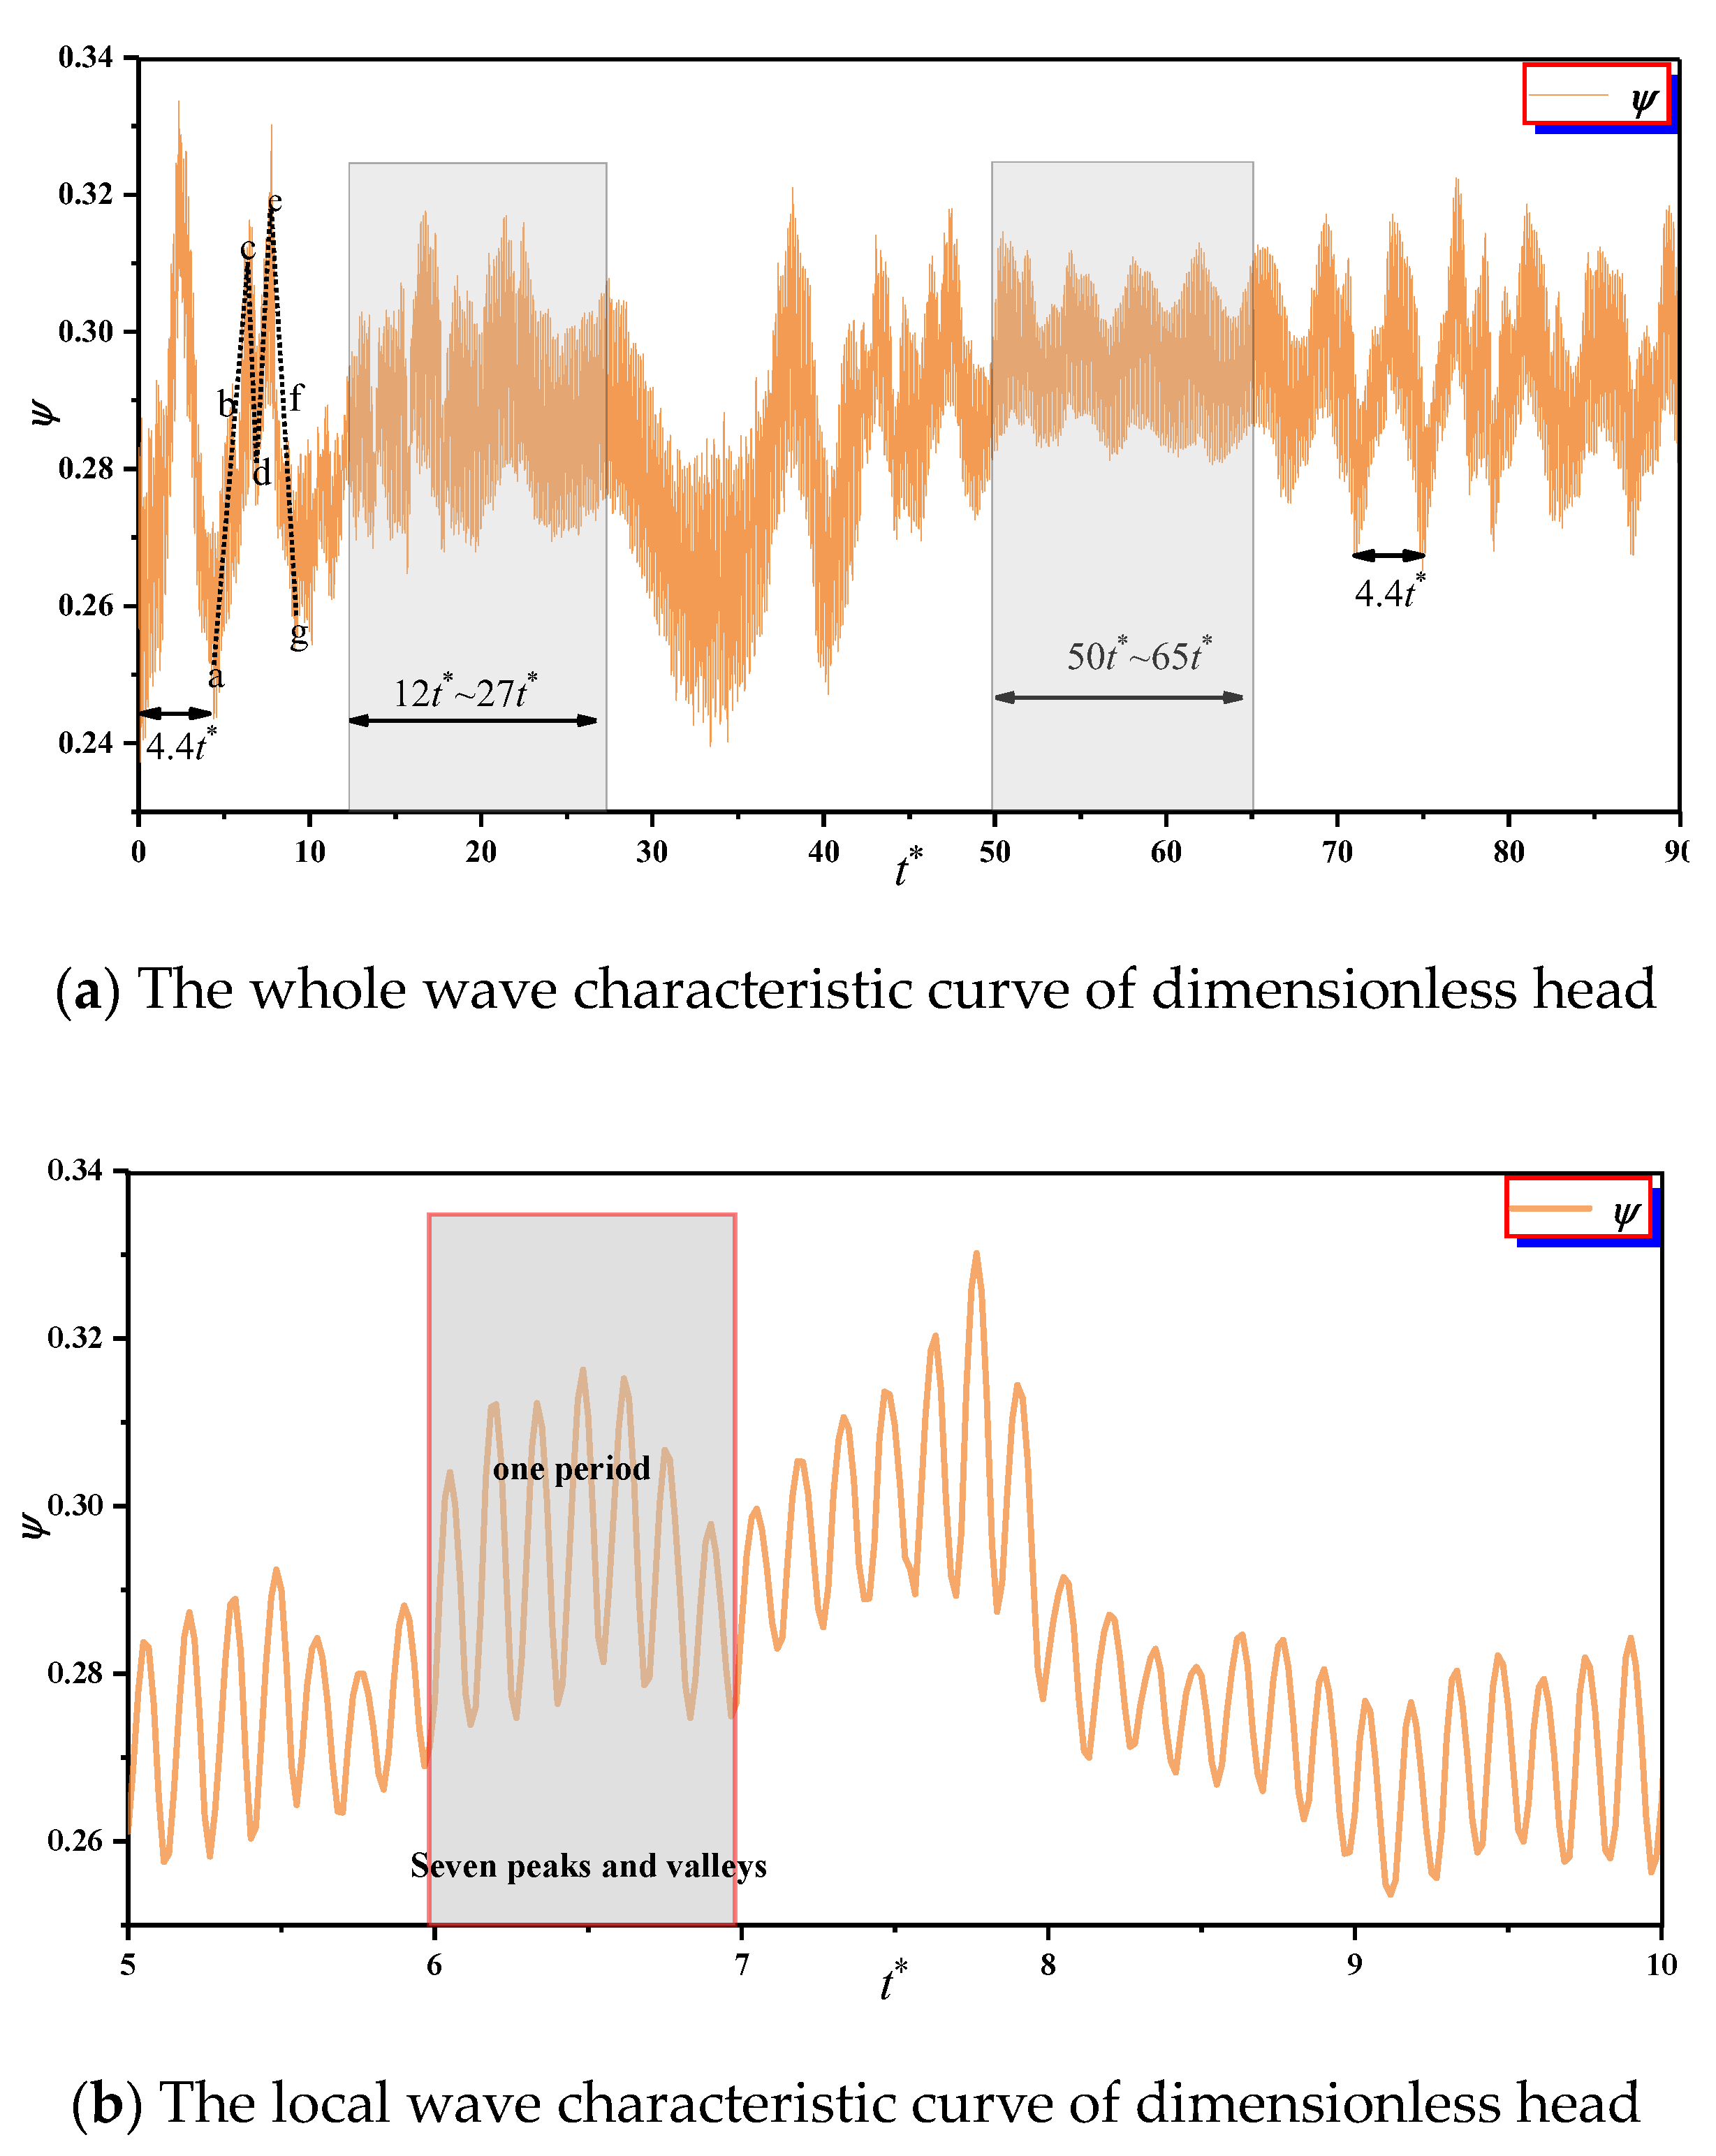
Figure 17 shows the transient pulsation process of dimensionless head at 70 °C and explores the unsteady relationship between cavitation and performance characteristics. Figure 17a shows the transient pulsation process in the time range of 0~90 t*, where t* represents the time required for impeller to rotate for one circle, and Figure 16a shows the head fluctuation process of impeller rotating for 90 circles. Figure 16b shows the local pulsation characteristic curve of 5 t*~10 t*.
As can be seen from the figure, the head waves with time with irregular pulsation characteristics at 70 °C. In the range of 0~10 t*, the amplitude of head pulsation is very large, and the characteristics of head pulsation show obvious periodicity. The time length of large-scale wave is about 4.35 t*, and cavitation plays a leading role in the performance of ECWP. However, in the range of 12 t*~27 t*, the amplitude of head pulsation weakens and shows stable pulsation. Therefore, the cavitation effect in ECWP is weakened and the distribution of volume fraction changes steadily. Then the cavitation effect increases gradually, and the head shows large-scale pulsation. At 50 t*~65 t*, the cavitation effect weakens to the extreme again, showing the same pulsation as that of 12 t*~27 t*. Then, with the increasing cavitation effect, a large-scale wave with the time range about 4.35 t* appears again. Then, the pulsation process of head is accompanied by the weakening, stability, and enhancement of cavitation. Meanwhile, as can be seen from Figure 17b, in each impeller rotation cycle t*, there are seven peaks and troughs in the head fluctuation curve, corresponding to seven blades of the impeller. Therefore, when cavitation affects the head of ECWP, the circumferential rotation effect of impeller also plays a corresponding role in head pulsation.
In a single large-scale wave, namely the single vapor developing period (5 t*~10 t*), take seven different times from a to g, the variation law of vapor volume fraction in single vapor developing period is calculated, shown in Figure 18. In a single large-scale wave, bubble appears the process of periodic collapse, birth, development, and collapse. Therefore, the volume fraction of vapor has a periodic oscillation relationship, which is inversely proportional to the head.
To analyze the frequency characteristic of pressure fluctuation, time domain data is transferred to frequency domain using fast Fourier transform (FFT) [32,33,34]. Figure 19a shows the frequency spectrum of head fluctuation in impeller, Figure 19b shows the local frequency spectrum, the range is 0~100 Hz. As the sampling frequency is 3700 Hz, the shaft frequency fs is 61.67 Hz, and the blade passing frequency fb is 431.69 Hz.
As can be seen from the figure, the main frequency is composed of two parts under the cavitation condition of ECWP at 70 °C, including low frequency below 100 Hz and blade passing frequency (fb = 431.69 Hz). The low frequency part is the uneven pulsation caused by the periodic initiation, development and collapse of cavitation. Through further analysis of the low-frequency components, it is found that the main low frequency consists of the two components, Where f1 = 0.65 Hz, f2 = 14.2 Hz. It can be seen from the above that the propagation period of large-scale wave is 4.35t*. Therefore, the frequency of f2 corresponds to the large-scale wave, f2 is the cavitation frequency.
As FFT cannot reflect the change process of frequency with time, wavelet transform is used to explore the unsteady process of cavitation frequency amplitude with time, shown in Figure 20. As can be seen from the figure, the cavitation frequency f2 and blade passing frequency fb alternate into dominant frequency in the time range of 0~90 t*.The main frequency components after wavelet transform are consistent with the above, namely fb and f2, and the lower frequency f1 is not captured due to the insufficient data. It can be seen from the figure that the frequency of f2 does not change with time as the impeller rotates in the circumferential direction, and keeps a fixed value. With the impeller rotating, the main frequency which affects the head pulsation of ECWP is changing alternately. Especially in 15 t*~30 t*, with the decrease of cavitation effect, the rotor and stator interference effect is enhanced, fb replace f2 as the dominant frequency. Then, the influence of cavitation process on the head pulsation becomes more and more serious, while the rotor and stator interference effect decays after maintaining stability for a period of time, and f2 replaces fb as the dominant frequency. From Figure 20b, we can more clearly observe the unsteady process of cavitation effect. It is not only the initiation, development and collapse of bubble in a single large-scale wave (like 5 t*~10 t*), the cavitation effect is also in the process of strengthening, stabilizing, and weakening. The period of cavitation effect is much longer than that of bubble developing period, constitutes an extremely low frequency as low as 0.65 Hz.

5. Conclusions

(1)
NACA0015 hydrofoil is chosen to verify modified cavitation model. At 70 °C, when evaporation and condensation coefficients are 0.01 and 50 respectively, simulation results and experimental values have a large difference in the hydrofoil head where the chord length ratio ranges from 0.1 to 0.4. While evaporation and condensation coefficients are respectively 0.002 and 10, simulated value meets well with experimental data. This implies that the modified cavitation model is more applicable in forecasting and analyzing the cavitation performance of ECWP.
(2)
Along with the reduction of inlet absolute pressure, bubbles firstly occurred at the blade inlet side near suction surface, and then bubbles expand gradually from suction surface to pressure surface, bubbles even began to clog the entire passage of impeller, which will cause cavitation damage and significant decline in external characteristic of pump. The cavitation degree close to trailing edge is more serious, which indicates that the inlet diameter of the steam line has a great impact on the cavitation performance. The better blade inlet environment means stronger anti-cavitation ability.
(3)
Under cavitation conditions, with the increase of temperature, the cavitation in ECWP occurs in advance and rapidly, the scaled of vortices in ECWP increases sharply and the turbulent dissipation becomes more serious. The thermodynamic effect not only affects the time sequence of cavitation occurrence, but also affects the speed and extent of cavitation development.
(4)
The unsteady pulsation of pressure and head in ECWP caused by cavitation belongs to low-frequency disturbance. Consistent with the periodic process of initiation, development and collapse of cavitation, the unsteady influence of cavitation effect on head is also in the process of periodic strengthening and weakening.

Author Contributions

Methodology and project administration, W.L.; writing—original draft preparation and review and editing, E.L.; review and editing, W.S., W.L. and X.X. All authors have read and agreed to the published version of the manuscript.

Funding

The work was sponsored by the National Natural Science Foundation of China (Nos.51679111, 51979138), Key R&D Program Project in Jiangsu Province (BE2017126), Synergistic Innovation Center of Jiangsu Modern Agricultural Equipment and Technology (4091600014), PAPD, National Key R&D Program Project (No.2017YFC0403703), Key R&D Program Project of Zhenjiang (No.SH2017049), and Scientific Research Start Foundation Project of Jiangsu University (No.13JDG105).

Conflicts of Interest

The authors declare that there is no conflict of interest regarding the publication of this paper.

Nomenclature

Symbols
ucomponent of velocity (m/s)Prtturbulent Prandtl number
αvolume fractionCvapempirical coefficient
fvmass fraction of water vaporCcondempirical coefficient
ppressure (Pa)αnucinitial volume fraction of gas core
μlaminar viscosityRBbubble radius
μtturbulent viscosityTtemperature (K)
δijKronecker functionRthermalthermal term
Cpspecific heat capacityψhead coefficient
henthalpy (kJ/kg)σcavitation number
fvmass fraction of gas phaseu2blade outlet velocity (m/s)
PrLlaminar Prandtl numberfbblade passing frequency (Hz)
Llatent heat of vaporizationvreference velocity (m/s)
Treference temperature (K)preference pressure (Pa)
ρvvapor density (kg/m3)ρldensity of the surrounding liquid
Subscripts
mvapor-liquid mixturelliquid
vvaporijdimension of tensors
reference

References

  1. Li, W.; Li, W.; Shi, W.; Ji, L.; Zhao, X. A review of engine cooling water pump. J. Drain. Irrig. Mach. Eng. 2016, 34, 9–17. (In Chinese) [Google Scholar]
  2. Kang, J.; Zhu, R.; Wang, X.; Liu, Y.; Zhong, W.; Zhang, B.; Qi, L. Effects of impeller geometry parameters on fracture cavitation performance of centrifugal pump. J. Drain. Irrig. Mach. Eng. 2018, 36, 111–117. (In Chinese) [Google Scholar]
  3. Cheng, X.; Pan, L.; Ju, H. Research Progress of Cooling System for Modern Vehicle Engine. Veh. Engine 2008, 1, 1–7. [Google Scholar]
  4. Ji, B.; Luo, X.W.; Arndt, R.E.A.; Peng, X.X.; Wu, Y.L. Large Eddy Simulation and theoretical investigations of the transient cavitating vortical flow structure around a NACA66 hydrofoil. Int. J. Multiph. Flow 2015, 68, 121–134. [Google Scholar] [CrossRef] [Green Version]
  5. Chen, X.; Tu, Y.; Teng, F.; Liu, H. Effect of inducer inlet hub ratio on suction performance of centrifugal pumps. J. Drain. Irrig. Mach. Eng. 2020, 38, 7–14. (In Chinese) [Google Scholar]
  6. Huang, B.; Wu, Q.; Wang, G. Progress and prospects of investigation into unsteady cavitating flows. J. Drain. Irrig. Mach. Eng. 2018, 36, 1–14. (In Chinese) [Google Scholar]
  7. Plesset, M.S.; Prosperetti, A. Bubble dynamics and cavitation. Annu. Rev. Fluid Mech. 2003, 9, 145–185. [Google Scholar] [CrossRef]
  8. Fruman, D.H.; Reboud, J.L.; Stutz, B. Estimation of thermal effects in cavitation of thermosensible liquids. Int. J. Heat Mass Transf. 1999, 42, 3195–3204. [Google Scholar] [CrossRef]
  9. Franc, J.P.; Rebattet, C.; Coulon, A. An experimental investigation of thermal effects in a cavitating inducer. J. Fluids Eng. 2004, 126, 716–723. [Google Scholar] [CrossRef]
  10. Franc, J.P.; Pellone, C. Analysis of thermal effects in a cavitating inducer using rayleigh equation. J. Fluids Eng. 2007, 129, 974–983. [Google Scholar] [CrossRef]
  11. Cervone, A.; Rapposelli, E.; d’Agostino, L. Thermal Cavitation Experiments on a NACA0015 Hydrofoil. J. Fluids Eng. 2006, 128, 326–331. [Google Scholar] [CrossRef]
  12. Dong, L.; Zhao, Y.; Dai, C. Detection of Inception Cavitation in Centrifugal Pump by Fluid-Borne Noise Diagnostic. Shock Vib. 2019, 2019, 9641478. [Google Scholar] [CrossRef]
  13. Yoshida, Y.; Kikuta, K.; Hasegawa, S.; Shimagaki, M.; Tokumasu, T. Thermodynamic effect on a cavitating inducer in liquid nitrogen. J. Fluids Eng. 2007, 129, 273–278. [Google Scholar] [CrossRef]
  14. Gustavsson, J.P.R.; Denning, K.C.; Segal, C. Hydrofoil Cavitation under Strong Thermodynamic Effect. J. Fluids Eng. 2008, 130, 091303-1–091303-5. [Google Scholar] [CrossRef]
  15. Zhang, Y.; Luo, X.; Xu, H.; Wu, Y. The Improvement and Numerical Applications of A Thermodynamic Cavitation Model. J. Eng. Thermophys. 2010, 31, 1671–1674. [Google Scholar]
  16. Ji, B.; Luo, X.; Wu, Y.; Zhang, Y.; Xu, H. Cavitating Flow Simulation For Hightemperature Water Based on Thermodynamic Effects. J. Tsinghua Univ. (Sci. Technol.) 2010, 50, 262–265. [Google Scholar]
  17. Wang, W.; Lin, Y.; Wang, X.; Wang, Y. Thermodynamics effect on cavitation for high temperature water. J. Drain. Irrig. Mach. Eng. 2014, 32, 15–39. (In Chinese) [Google Scholar]
  18. Shi, S.; Wang, G.; Hu, C.; Gao, D. Experimental Study on Hydrodynamic Characteristics of Cavitating Flows around Hydrofoil under Different Water Temperatures. J. Mech. Eng. 2014, 50, 174–181. [Google Scholar] [CrossRef]
  19. Shi, S.; Wang, G.; Ma, R. Numerical Study of Cavitation in Cryogenic Fluids. Eng. Mech. 2012, 29, 61–67. [Google Scholar]
  20. Shi, S.; Wang, G.; Chen, G. Evaluation of the mass transport models in computations of cavitating flows with thermal effects. Chin. J. Appl. Mech. 2011, 28, 589–594. [Google Scholar]
  21. Tang, F.; Li, J.; Li, Y.; Zhou, C. Influence of Thermodynamics Effect on Inducer Rotating Cavitation under Low Temperature Condition. J. Rocket Proplsion 2013, 39, 29–34. [Google Scholar]
  22. Li, W.; Shi, W.; Pei, B.; Zhang, H.; Lu, W.G. Numerical Simulation and Improvement on Cavitation Performance of Engine Cooling Water Pump. Trans. Csice 2013, 2, 165–170. [Google Scholar]
  23. Li, W.; Zhao, X.; Li, W.; Shi, W.; Ji, L.; Zhou, L. Numerical Prediction and Performance Experiment in an Engine Cooling Water Pump with Different Blade Outlet Widths. Math. Probl. Eng. 2017, 2017, 8945712. [Google Scholar] [CrossRef] [Green Version]
  24. Shi, W.; Pei, B.; Lu, W.; Wang, C.; Li, W. Optimization of automobile pump based on CFD. J. Drain. Irrig. Mach. Eng. 2013, 31, 15–19. [Google Scholar]
  25. Wei, L.; Wang, C.; Shi, W.; Zhao, X.; Yang, Y.; Pei, B. Numerical calculation and optimization designs in engine cooling water pump. J. Mech. Sci. Technol. 2017, 31, 2319–2329. [Google Scholar] [CrossRef]
  26. Li, W.; Yang, Y.; Shi, W.D.; Zhao, X.; Li, W. The Correction and Evaluation of Cavitation Model considering the Thermodynamic Effect. Math. Probl. Eng. 2018, 2018, 7217513. [Google Scholar] [CrossRef] [Green Version]
  27. Lemmon, E.W.; Huber, M.L.; Mclinden, M.O. NIST Standard Reference Database 23: Reference fluid thermodynamic and transport properties—REFPROP, version 9.1, Standard Reference Data Program, National Institute of Standards and Technology. NIST NSRDS 2010, 22, 2010. [Google Scholar]
  28. Xiong, Y.; Liu, Y.; Li, S.; Chen, T.; Wang, G. Cavitation characteristic in aviation fuel pump based on surrogate fuel. J. Aerosp. Power 2015, 30, 2607–2615. [Google Scholar]
  29. Luo, X.; Zhang, Y.; Peng, J.; Xu, H. Effect of impeller inlet geometry on centrifugal pump cavitation performance. J. Tsinghua Univ. (Sci. Technol.) 2008, 48, 836–839. [Google Scholar]
  30. Li, W.; Ji, L.; Shi, W.; Zhou, L.; Chang, H.; Ramesh, K.A. Expansion of High Efficiency Region of Wind Energy Centrifugal Pump Based on Factorial Experiment Design and Computational Fluid Dynamics. Energies 2020, 13, 483. [Google Scholar] [CrossRef] [Green Version]
  31. Brennen, C.E. Hydrodynamics of Pumps; Concepts Nrec & Oxford University Press: London, UK, 2011. [Google Scholar]
  32. Wang, K.; Zhang, Z.; Xia, C.; Liu, Z. Experimental Investigation of Pressure Fluctuation, Vibration, and Noise in a Multistage Pump. Shock Vib. 2018, 2018, 2784079. [Google Scholar] [CrossRef] [Green Version]
  33. Tan, L.; Shi, W.; Zhang, D.; Zhou, L.; Wang, C. Numerical and experimental investigations of pressure fluctuations in single-channel pumps. Proc. Inst. Mech. Eng. Part A J. Power Energy 2018, 232, 397–415. [Google Scholar] [CrossRef]
  34. Li, W.; Li, E.; Ji, L.; Zhou, L.; Shi, W.; Zhu, Y. Mechanism and propagation characteristics of rotating stall in a mixed-flow pump. Renew. Energy. 2020, 153, 74–92. [Google Scholar] [CrossRef]
Figure 1. Geometric model of engine cooling water pump.
Processes 08 00278 g001
Figure 2. Mesh of computing domains.
Processes 08 00278 g002
Figure 3. Parameters of experimental test.
Processes 08 00278 g003
Figure 4. 3D model of the NACA0015 hydrofoil.
Processes 08 00278 g004
Figure 5. Mesh of NACA0015 hydrofoil.
Processes 08 00278 g005
Figure 6. y+ distribution of NACA0015 hydrofoil.
Processes 08 00278 g006
Figure 7. Comparison between experiment and TCM [26].
Processes 08 00278 g007
Figure 8. Comparison with different coefficients [26].
Processes 08 00278 g008
Figure 9. Performance curves of ECWP with different temperatures.
Processes 08 00278 g009
Figure 10. Cavitation formation process.
Processes 08 00278 g010
Figure 11. Location of blade cross section: (a) Relative position of blade and volute tongue (b) Three blade cross sections.
Processes 08 00278 g011
Figure 12. Bulk interface mass transfer rate with different blade cross sections.
Processes 08 00278 g012
Figure 13. Cavitation performance with different temperatures.
Processes 08 00278 g013
Figure 14. Vapor distribution with different temperatures based on the same cavitation.
Processes 08 00278 g014
Figure 15. Vortex distribution with different temperatures based on the same cavitation.
Processes 08 00278 g015
Figure 16. Turbulence kinetic energy distribution with different temperatures based on the same cavitation.
Processes 08 00278 g016
Figure 17. Dimensionless head pulsation characteristics.
Processes 08 00278 g017
Figure 18. Unsteady process of vapor volume fraction.
Processes 08 00278 g018
Figure 19. Frequency domain distribution of impeller.
Processes 08 00278 g019
Figure 20. The wavelet transform spectrum of 70 °C.
Processes 08 00278 g020
Table 1. Design and structure parameters of engine cooling water pump (ECWP).
ParametersValue
Flow rate/L·min−1285
Head/m14
Specific speed129
Number of blades7
Rated speed/r·min−13700
Inlet blade angle/°37
Outlet blade angle/°30
Inlet diameter of impeller/mm60
Outlet diameter of impeller/mm98
Outlet width of impeller/mm11
Wrap angle of blade/°45
Table 2. Comparison of the performance parameter with different mesh elements.
Grid SchemeMesh Elements (×106)H/HCη/ηC
A1.770.98350.9880
B2.090.99170.9937
C2.3411
Table 3. Computational setup.
Computational Setup
LocationBoundary type
Inlet of model pumpTotal pressure
Outlet of model pumpMass flow
Physical wall surfacesNo-slip wall
Interfaces of impeller
Steady stateFrozen rotor
Transient stateTransient rotor-stator
Solver control for transient simulation
Time step2.703 × 10−4 s
Total time1.459 s
Convergence criterion10−4
Table 4. Water parameters.
Physical ParametersTemperature T (K)
298323343
Density (kg/m3)997988.1977.8
Latent heat of vaporization (kj/kg)2441.52381.92333.1
Vaporization pressure (Pa)316912,31031,164
Viscosity (10−5 Pa·s)89.554.9440.16
Specific heat (kj/(kg K))4.1864.1744.178
Thermal conductivity (W/(m K))0.607560.64780.6676
Coefficient of volume expansion (10−4 1/K)2.574.494.7
Table 5. Vapor parameters.
Physical ParametersTemperature T (K)
298323343
Density (kg/m3)0.023080.083020.2056
Viscosity (10−5 Pa·s)0.98625.444
Specific heat (kj/(kg K))1.91161.93431.9627
Thermal conductivity (W/(m K))0.018540.021820.02346
Coefficient of volume expansion (10−4 1/K)33.5631.8730.18

