Article

Anaerobic Digestate Treatment Selection Model for Biogas Plant Costs and Emissions Reduction

Department for Renewable Energy Sources, Energy Efficiency, Environment and Climate Protection, Energy Institute Hrvoje Požar, 10 000 Zagreb, Croatia
*
Author to whom correspondence should be addressed.
Processes 2020, 8(2), 142; https://doi.org/10.3390/pr8020142
Submission received: 24 December 2019 / Revised: 19 January 2020 / Accepted: 20 January 2020 / Published: 22 January 2020
(This article belongs to the Special Issue Current Trends in Anaerobic Digestion Processes)

Abstract

:
Agriculture is one of the leading sectors on the global level contributing to greenhouse gas (GHG) emissions increase. With the utilization of biogas production technology within the agriculture sector, ecological benefits could be achieved, with immediate economic profit. Therefore, to retain economic profit and environmental sustainability, implementation of bioeconomy principles is of key importance. This paper examines four options of digestate treatment, which is identified as one of the highest operational cost for the biogas plant. A simple and robust model in Excel Solver was developed to determine the best solution for minimising GHG emissions and maximise profit for the biogas plant operator, through an upgrade of the plant with digestate treatment technologies. The model was implemented on a case of a Croatian biogas plant and the best solution in terms of GHG reduction and profit increase proved to be fertilizer production (Option 1), through a crystallization process of struvite within the digestate. This option obtains a significant reduction in GHG emissions compared to standard biogas production without additional upgrades (Option 4), by over 90%, and increase of profit for the biogas plant operator, which diversifies the income source and creates multiple positive impacts on the environment.

1. Introduction

Greenhouse gas (GHG) emissions represent one of the most significant environmental problems of today. In order to reduce their negative impact on climate change, it is vital to redirect the technological advancement towards more intensive utilization of renewable energy sources (RES) [1]. Generation of new products with added values from waste streams, i.e., replaced utilization of new raw materials, will ensure sustainability and circularity to industry. Replacement of fossil carbon in production processes, reduction of carbon footprint in end-products and development of new technologies and bio-based products are the main goals of new strategies, such as bioeconomy and circular economy strategies.
Agriculture is one of the leading sectors in GHG emissions production [2]. Therefore, it contains the highest potential to become a sustainable, resource-efficient, and climate-friendly sector with reduced GHG emissions (carbon sink), through the integration of smart solutions, production optimization and intersectoral connection. A good example is intensive livestock production, which includes the concept of biogas plant on the farm, where economic, environmental and social aspects need to be considered. Biogas production could be beneficial if managed properly and could deliver positive impacts on several segments of the farm: energy production (electrical, heat), economy improvement, increase in rural activities (agriculture) and environment protection [3].
Since biogas plants successfully operate mainly within incentive schemes, it is necessary to find an innovative technological solution and flexible business model that will keep all ecological, social and technical advantages of biogas plant operation after the expiration of feed-in-tariff (FiT) contracts. This model could be implemented through the generation of new products with added value. One of the potential solutions is the market valuation of digestate produced in anaerobic digestion (AD) process, which will benefit economic feasibility of biogas plant [4], but also to the reduction of digestate negative impact on the environment during its direct application to the soil, due to its quality and nutrient content that can lead to potential land contamination [5,6].
Through a literature overview, it was noticed that numerous researches have been conducted on the topic of optimization of biogas plant operation and creation of value chains for new products. Boldrin et al. [7] integrated energy, climate, and economic analysis with the goal of optimization of biogas plants, where pig manure and sugar cane pulp are used as feedstocks. The results showed how utilization of different feedstock ratio impacts the energy and climate component of plant operation. Enitan et al. [8] researched models based on computer methods for renewable and sustainable energy optimization. Their paper presented the best current solutions for the AD process optimization. A significant number of papers have focused on the selection of specific computer models, artificial networks and genetic algorithms for AD process improvement [9,10,11,12]. One broadly examined and tested model for AD process is ADM1 (Anaerobic Digestion Model No.1), which is used to operate the AD process, in order to determine how much biogas could be generated during the process, by altering a number of parameters that affect methane yield [13,14,15,16].
However, value chains and their optimization are examined in a smaller number of papers. Gaida et al. [17] developed an algorithm for feedstock control, that is used in the biogas plant, to optimize production. Uhlemair et al. [18] developed a mathematical model which is used for optimizing the economic component of bioenergy production (biogas) within a specific system (village, town, city, etc.). A similar model was developed by Jensen et al. [19], which additionally included energy balances and technical aspects of bioenergy production. Some models consider only the environmental life cycle assessment of the plant [20]. However, the most extensive scope was included in the work of Lyng et al. [21], who developed an optimization for decision-making model on the utilization of specific control system for the biogas plant. They included three alternatives for farmers and developed a model that assists in decision-making on which alternative to choose, with the purpose of cost and GHG emissions reduction.
Considering digestate, several types of research have been conducted, which examine the possibility of its utilization, but mainly as a fertilizer for agricultural soil. Logan and Visvanathan [22] explored the options of using digestate as a fertilizer, but also other applications: micro-algae cultivation, biofuels and bioethanol production. Kataki et al. [23] researched the possibility of digestate liquid fraction utilization for oyster mushroom production. Lukehurst et al. [24] created a handbook, which describes the usage of digestate from biogas plants as bio-fertilizers.
However, none of the conducted research has considered innovative technologies and methods for digestate treatment and solving economic and environmental problems that it represents for the biogas plant operator. Insecurities in business decisions in this case, for biogas plant operators, is a topic that has ever-growing importance with managers and changes the current role of analysis within the decision-making process.
This paper will describe the development of a model of decision support system (DSS), that will consider existing parameters of biogas plants, problems related to digestate treatment and examine several options of its management, with the purpose of biogas plants’ cost and emissions optimization.
The purpose of this model is connecting economic (costs) and environmental (GHG emissions) aspects and minimization of the same by implementing innovative solutions for digestate treatment, generated during the AD process. Innovative solutions in this paper are presented in mathematical relations and act as alternatives in the existing approach of biogas plant operations.

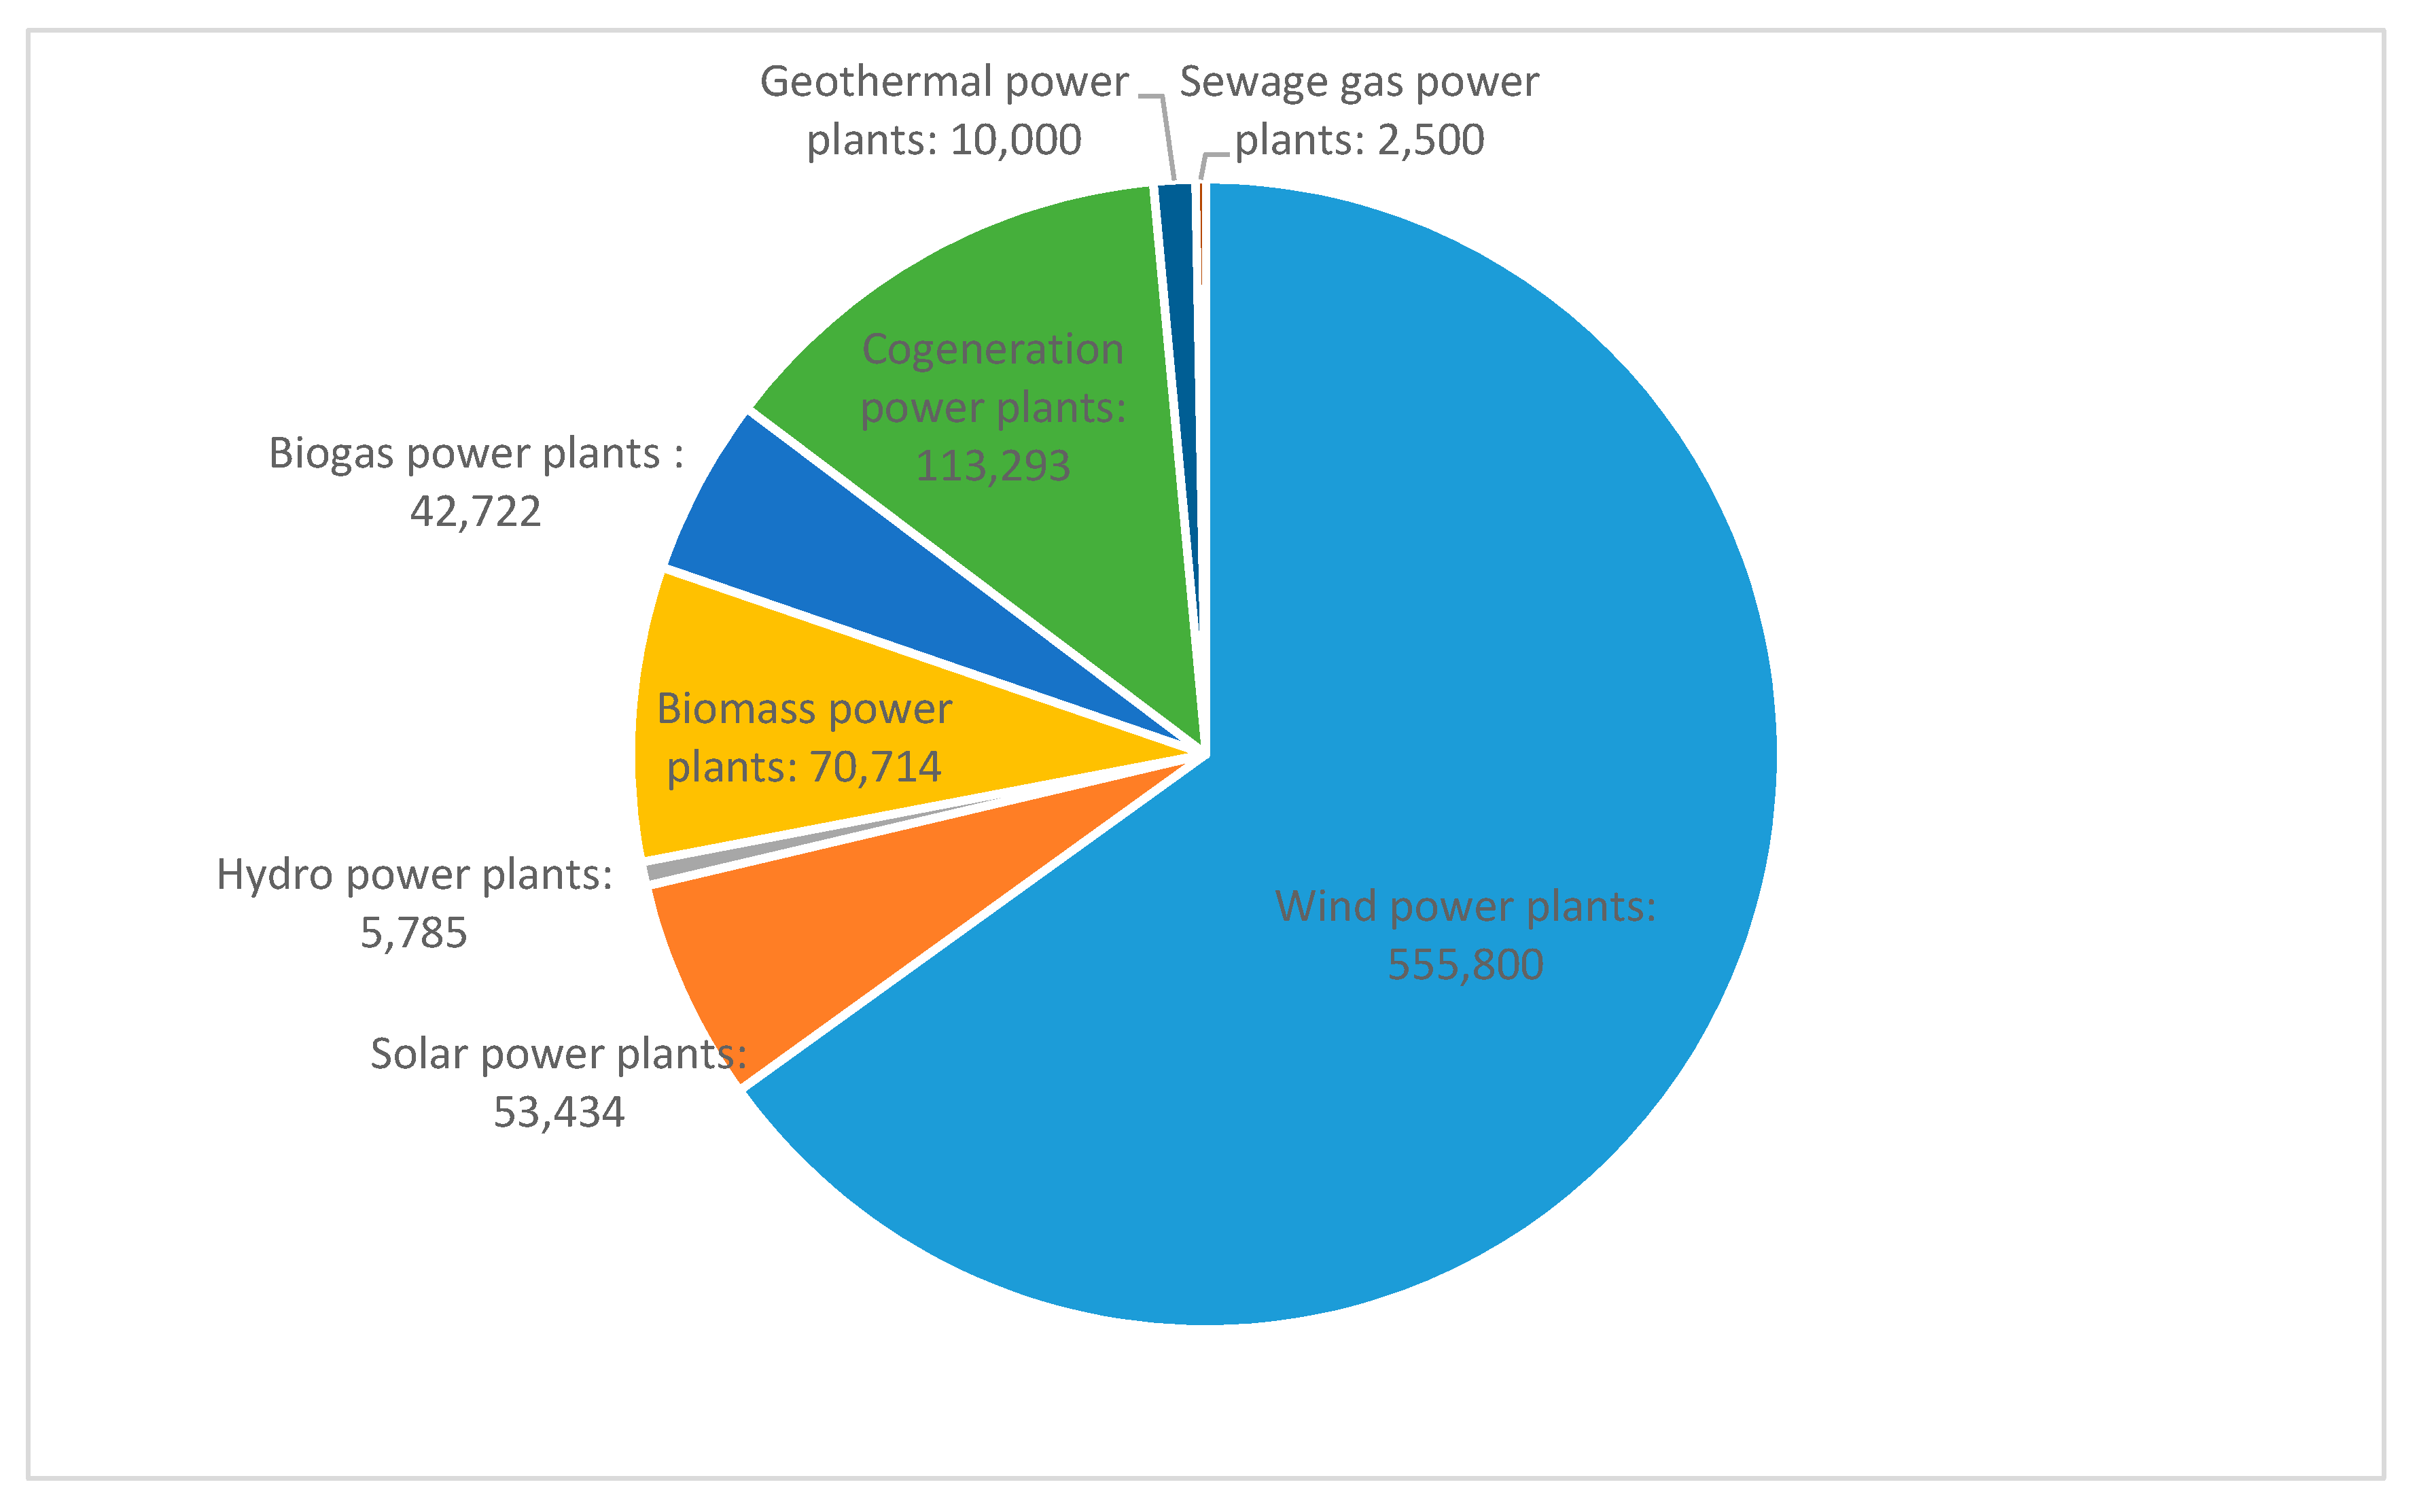
2. State-of-Art in Croatia

The Croatian sector of production and utilization of biogas is one of the less presented, but also a very dynamic sector among RES. Activities within the biogas production sector in Croatia started in 2007, by the enactment of Law on Energy [25]. By today, there are 37 operational plants and an additional 11 in the process of acquiring the FiT contract [26].
Croatian biogas market will reach its production maximum in 2019/2020, with 47.432 MW production capacity and additional potential of 13.168 MW contracted projects. The first plant exiting the existing FiT system will do that in 2020, and by 2022 altogether 4 MWel will leave the system. Specific rules will be required for further operations of these plants, related to AD settings (corn silage share, digestate production and storage), to relate this energy source to the realization of national energy goals.
The majority of Croatian biogas plants use pig or cow manure as feedstock, mainly mixed with corn silage as a co-substrate. Together they participate in the AD process, during which biogas is produced, but also digestate as a by-product. Corn silage, as a co-substrate, contains high concentrations of biodegradable components that positively affect the total yield of produced biogas [3].
The utilization of this feedstock for biogas plant operation is limited by existing agricultural production, seasonality and transport costs from biomass production site to conversion site. Therefore, it is understandable that biogas plants have lower power outputs, compared to other plants on biomass (including waste and wastewater), wind turbines, geothermal plants, and small hydro plants (Figure 1) [26].
Potential development routes for Croatian biogas market are [27]: micro-biogas plants (so-called “pocket” plants) suitable for Croatian livestock family farms (capacities ranging 10–50 kW, with potential market of 3620 farms in Croatia), joint biogas plants on municipality/town level (energy community concept), immersion in food processing industry (e.g., companies which are significant CO2eq emitters entering biogas market [28]) and expansion of utility companies’ business to energy-utility companies within circular economy concepts (e.g., biomethane production from biodegradable waste [29]).
However, most Croatian biogas plants are large (≥1 MWel) and have two significant problems: the market price of corn silage (high market oscillations; represent a high share of operational costs) and produced digestate that needs to be treated.
To solve these problems, this paper will present a model that will compare three innovative technologies of digestate treatment, in a manner that is economically, environmentally and technologically most suitable for a specific biogas plant.
These technologies are important for biogas plant operation, but they need to be presented in the form of the mathematical model, so their selection is simplified through the presentation of optimal cost and GHG emission reduction of the biogas plant.

3. Materials and Methods

3.1. Optimization Model

A decision support system is used for solving problems with two possible, but conflicting goals: the selection of the most cost-effective and most environmentally-friendly (with least GHG emissions) solution. This paper presents a developed binary optimization model, using the Excel Solver tool by upgrading the existing model developed in [21]. The utilization of this model by biogas plant operators is focused on digestate treatment processes, which is produced in the AD process.
Excel Solver is a simple tool for determining and solving problems. By using Solver, it is possible to find optimal (maximum or minimum) value for formulas in specific cells (Target cell), that is susceptible to limitations or restrictions defined in other cells (Constraints) with equations in the worksheet. The tool works with a group of cells called Decision variables, which are involved in formula calculations in Target cells and Constraint cells. The created decision-making tool adjusts to the value of determining variable in order to satisfy the Constraints and deliver the result in Target cell. Excel Solver is used for its simplicity, so it can enable biogas plant operator a simple use and possibility to make changes to specify it according to its needs.

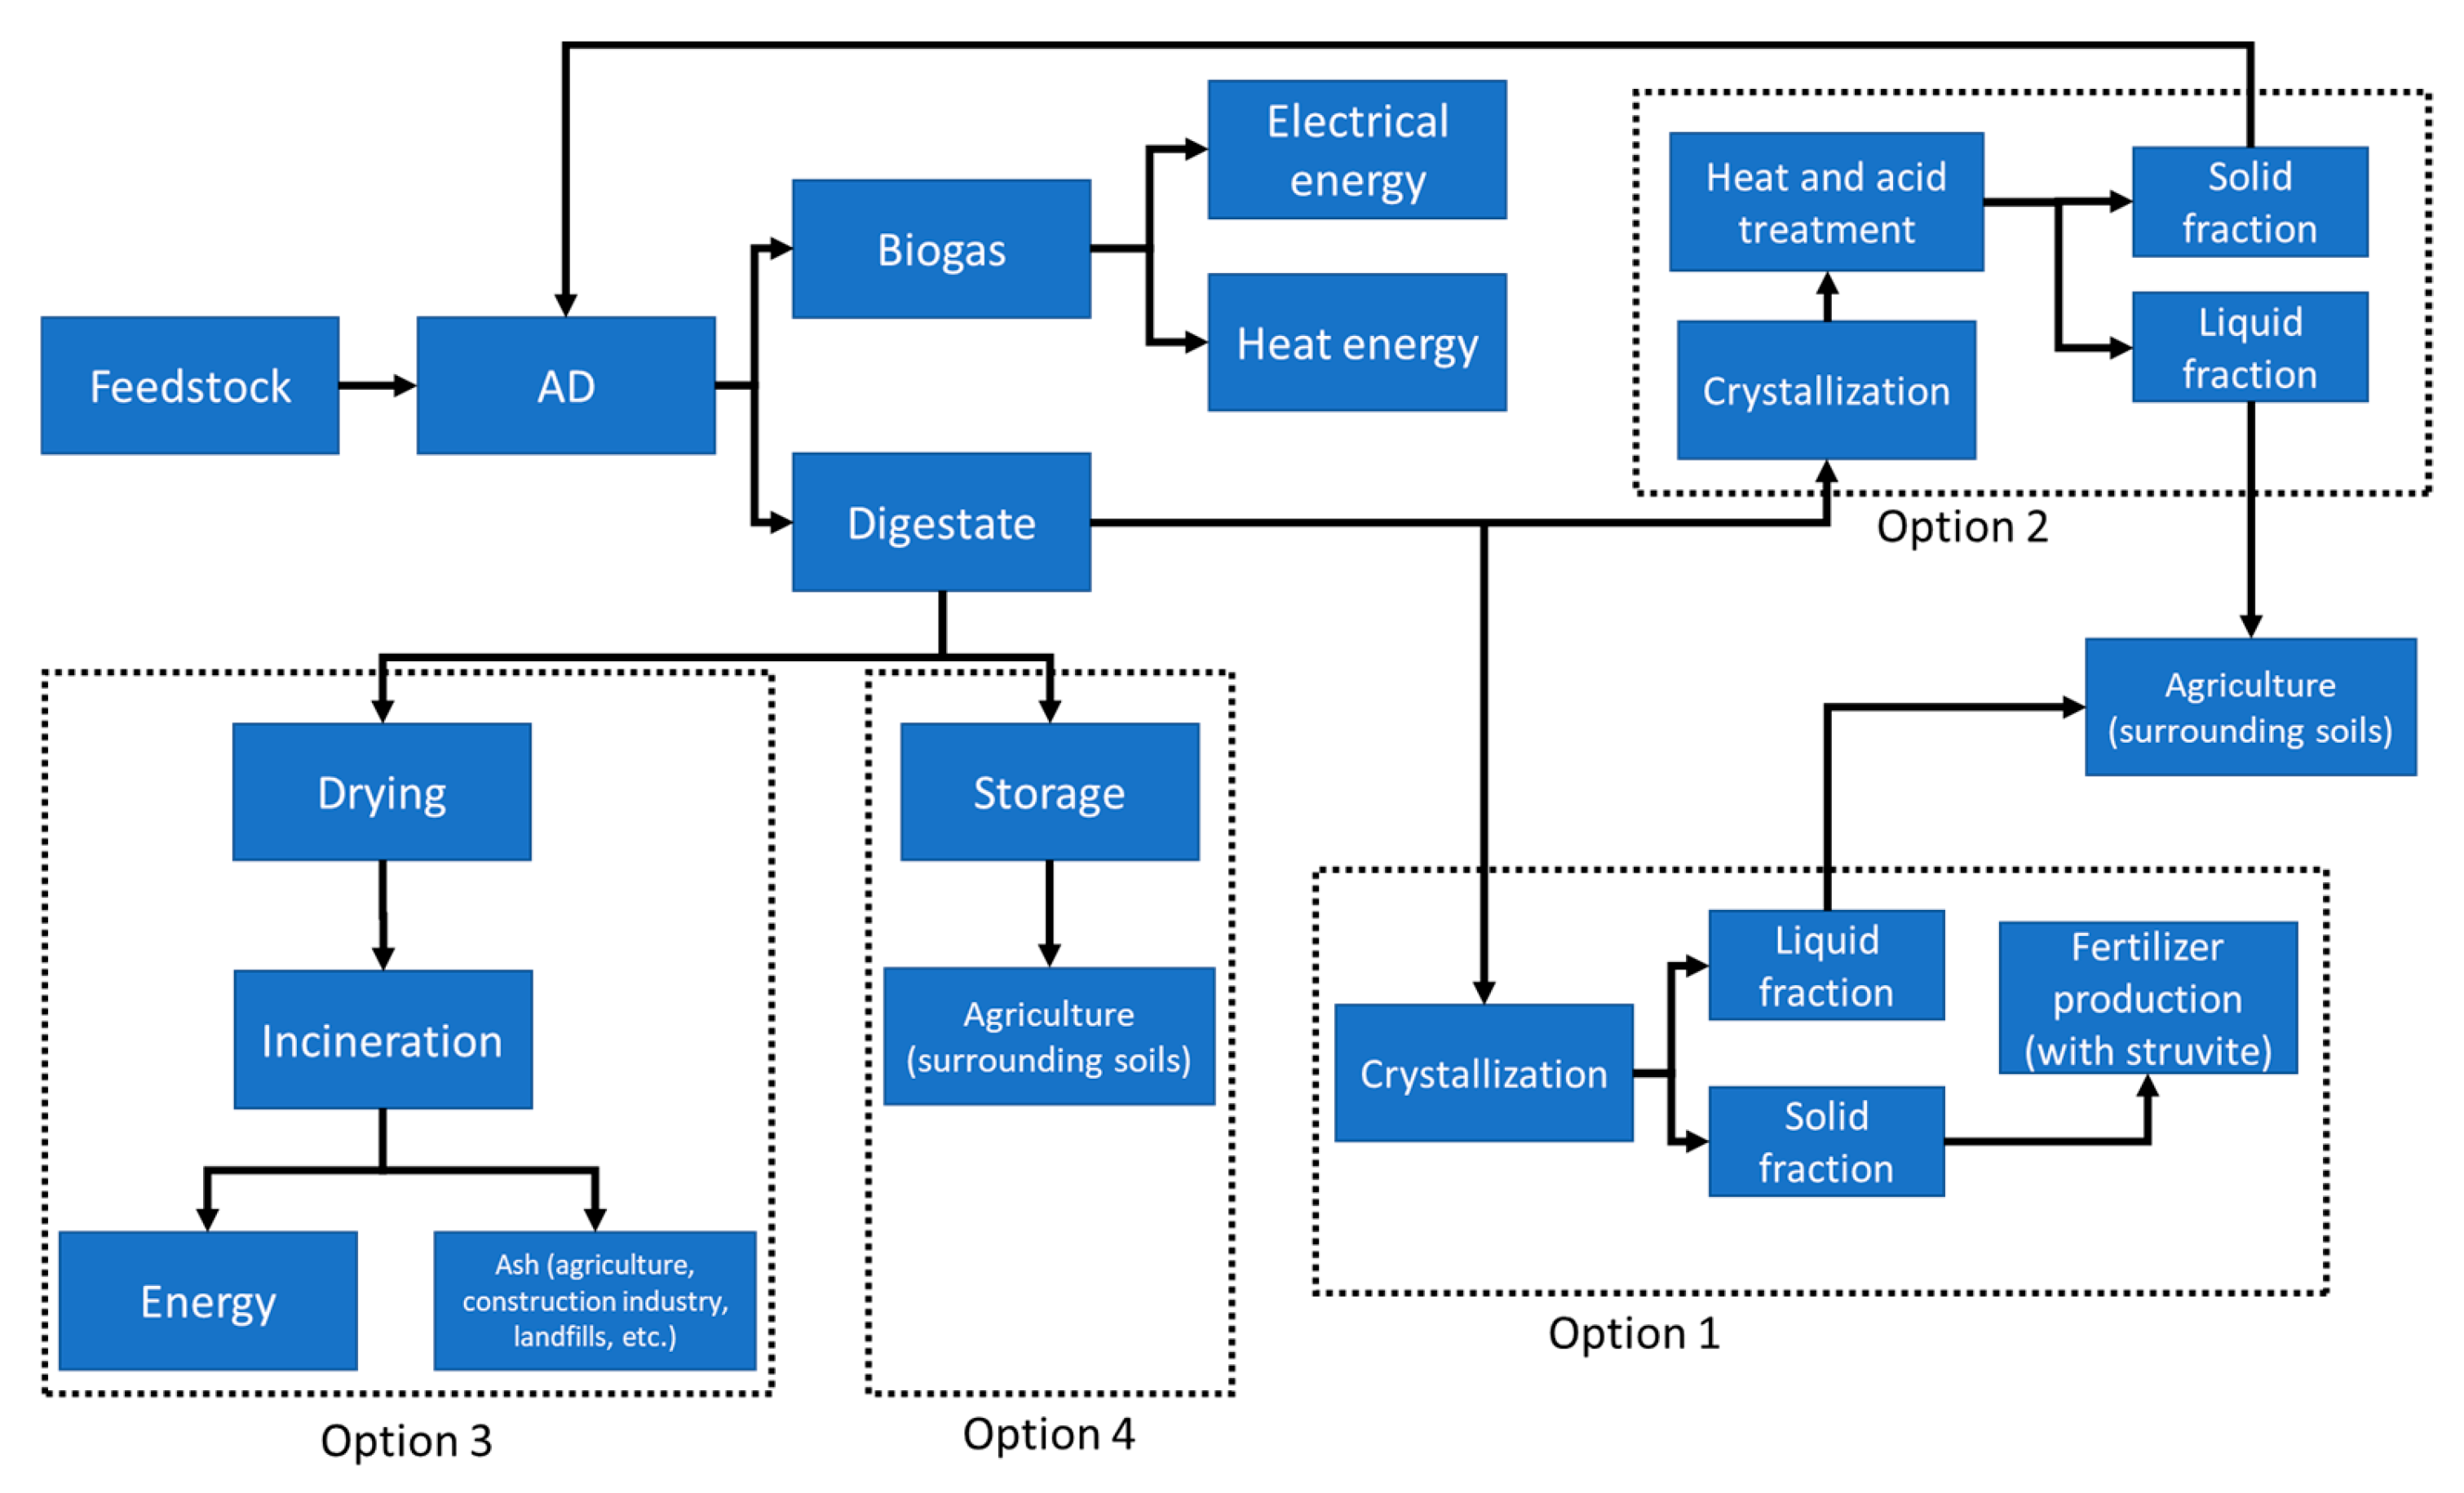
3.2. Options for Digestate Treatment

In terms of digestate treatment, this paper considers four options, as shown in Figure 2. These treatment pathways are considered due to its simplicity for application at the near vicinity of biogas plant, where digestate needs to be treated. Even though there are other advanced technologies for digestate treatment, such as pyrolysis, gasification, biotransformation, etc., they require far larger capital investment and operational costs, but also significantly larger knowledge on how to implement and operate them, than technologies considered in this paper. Moreover, two of the options presented in this paper are innovative and utilize all the waste streams at the biogas plant, which makes them environmentally-friendly and sustainable, which is the final goal for every biogas plant operator.
The first two options consider utilization of digestate produced in biogas plant during AD process utilization in two manners: (1) as a replacement of solid fraction for AD feedstock, where biogas yield is increased and corn silage costs reduced (digestate recirculation—Option 2); and (2) as a valuable agricultural fertilizer which contains struvite (Option 1). The process is presented within the experiment conducted by Đurđević et al. [30]. In Option 2, degradation of the lignocellulosic wall in digestate solid fraction occurs due to struvite crystallization process, mechanical separation operations and use of heat-acid treatments. By recirculation of treated solid fraction to AD reactor, as a feedstock replacement for corn silage, final biogas yield is increased and feedstock costs reduced. In Option 1 the process is the same as in Option 2, only the treated digestate is used as a fertilizer on agricultural soils due to newly formed materials (magnesium ammonium phosphate hexahydrate and calcium phosphate dihydrate). It is also important to mention that after separation to a solid and liquid fraction in these processes, digestate liquid fraction can be used on agricultural soils as a fertigation liquid, which helps improve the characteristics of the soil [31,32].
The third option (Option 3) considers standard biogas plant (described as Option 4), but including an additional upgrade with plant for energy recovery of digestate by incineration [25]. The process will include digestate drying by utilizing surplus heat energy produced in biogas plant’s cogeneration unit (CHP) and produced electrical energy will be used for covering the demand of this new plant or sold in the the electrical power system (EPS). Flue gases will be purified with the latest methods and produced ash treated accordingly (utilization in agriculture, landfilling, usage in the construction industry, etc., depending on the chemical characteristics of digestate and ash [33].
The last option (Option 4) takes into account the existing state-of-art at biogas plants. It includes biogas production through the AD process, with manure (cow/pig) and corn silage as substrates. Biogas is used for energy production in CHP, where electrical (part is used for satisfying plant demand and part is sold in the EPS through FiT) and heat energy (used primarily for plant heat demand, while the rest is emitted to the atmosphere) are produced. Produced digestate is landfilled near the plant and used as a fertilizer for surrounding agricultural surfaces (within 50 km, larger distances are not economically feasible due to digestate liquid fraction [3]).
Moreover, each option requires defined factors for economic and environmental aspects. Cost factors, incomes and GHG emissions are presented in the following table for each option (Table 1).

3.3. Input Data and Constraints

Motivations for initiating biogas plant projects can vary—from environmental protection and waste amounts reduction to energy production from RES—and can include financial and non-financial incentives. Farmers, producers and collectors of organic waste, municipalities, energy producers and other active stakeholders in this sector are the main initiators of biogas projects. Therefore, each plant is specific.
This paper considers the data for one typical Croatian biogas plant (1 MWel and production of 20,000 tonnes of digestate annually), taking into account real data at the specific plant site and literature data that can be used for the purpose of decision-making for other plants.
Generally, the parameters used in the model can be separated into two categories: (1) general parameters for all biogas plants and; (2) specific parameters for each upgrade option and digestate treatment. Hereafter, the parameters for observed biogas plant and parameters obtained from literature, specific for biogas plants are presented [3].
The general parameters include:
  • Share of dry matter in digestate;
  • Share of dry matter in manure;
  • Biogas potential for pig/cow manure;
  • Biogas energy potential;
  • Energy demand per pig/cow;
  • Price of electrical energy;
  • Number of pigs/cows on a farm during one year;
  • Amount of produced pig/cow manure;
  • Amount of produced digestate;
  • Biogas plant size (power);
  • Plant operational hours per year;
  • FiT prices for electrical energy (tariff system—incentives for production from RES and CHP);
  • Targeted reduction of GHG emissions;
  • Targeted reduction of operational costs.
Parameters specific for each upgrade option and digestate treatment are presented in the following table (Table 2).
The model considers two goals: reduction of GHG emissions and reduction of costs/increase of revenue for the plant operator. These are Objective functions, which are formulated as mathematical sums of costs/revenues and sums of GHG emissions for each option. Mathematically, this is described in the following manner, for GHG emission reduction function, in Equation (1):
M i n i m i s e i = 1 n ( X 1 , i G H G 1 , i + X 2 , i G H G 2 , i + X 3 , i G H G 3 , i + X 4 , i G H G 4 , i )
taking into account the binary function, which is described as the following Equation (2):
X 1 , i + X 2 , i + X 3 , i + X 3 , i = 1
where n presents the number of option in the model and GHG1,i, GHG2,i, GHG3,i and GHG4,i present annual impact of GHG emissions for options 1–4 for farm i. X1,i, X2,i, X3,i and X4,i are variables of optimization model, which can be changed. They are defined as binary functions, where it is possible to choose only one option (it can be 1 or 0 because biogas plant operator can select only one option for an upgrade).
Optimization function, i.e., minimization costs function, is determined in the same manner (Equation (3)):
M a x i m i s e i = 1 n ( Z 1 , i P r o f 1 , i + Z 2 , i P r o f 2 , i + Z 3 , i P r o f 3 , i + Z 4 , i P r o f 4 , i )
taking into account the binary function, which is described as the following Equation (4):
Z 1 , i + Z 2 , i + Z 3 , i + Z 3 , i = 1
where n is the number of options in the model, and Prof1,i, Prof2,i, Prof3,i and Prof4,i describe the potential annual revenue due to the costs reduction for options 1–4 for farm i. Z1,i, Z2,i, Z3,i and Z4,i are variables of the optimization model, which can be changed. They are defined as binary functions, where it is possible to choose only one option (it can be 1 or 0 because biogas plant operator can select only one option for an upgrade).

3.4. Calculation of Greenhouse Gas Emission Reductions

The potential impact of GHG emissions reduction from the four options considered in this paper (Equation (1)) is determined from the literature review and used as an input in the optimization model. The following (Table 3) defines the literature overview of the factors considered during the calculation of emissions and their reduction by using different options.
It should be noted that it is challenging to determine each emission due to innovation of the processes specifically, but also the specificity of each biogas plant—feedstock utilization, plant size, produced digestate, etc.

3.5. Calculation of Potential Cost Reduction and Profit

The annual profit of biogas plant for each option (Prof1,i, Prof2,i, Prof3,i, and Prof4,i) in Equation (3) is defined as annual revenue minus Capital Expenditure (CAPEX) and Operating Expenses (OPEX). Yearly CAPEX is averaged by an interest rate of 4%, with a payment period of 14 years (typical for these types of projects and under FiT contracts). Economic costs are presented in Croatian Kuna (HRK), where 1 HRK equals 0.14 EUR (approximation based on the exchange list on 14 January 2020). The annual profit of Option 4 (standard biogas plant, without upgrades) is zero, due to the absence of additional costs and revenues, compared to other options.
In Croatia, there is currently a support system related to energy production from RES and high-efficiency cogeneration. Until 2016 RES in Croatia were supported through a fixed FiT according to the (now obsolete) Tariff System for Electricity Production from Renewable Energy Sources and Combined Heat Power. In January 2016, the new Act on Renewable Energy Sources and High-efficiency Cogeneration (RES Act) came into force and introduced a tendering procedure through which a premium tariff and a guaranteed feed-in tariff is available.
Privileged producers of electricity from RES can receive a premium on top of the price of the electricity, which they have sold on the market pursuant to the Electricity Market Act if HROTE has selected them as lowest bidder in a public tender HROTE issues a call for bids at least once a year, provided quotas for the support of certain technologies of RES are available (70 MWel, in case of biogas and biomass).
As the biogas sector is relatively underrepresented in Croatia (Figure 1), the FiT system mainly benefits other RES (solar and wind). Consequently, for biogas facility operator, it is vital to find a new way on the closing of the economic balance sheet, to make the facility operationally sustainable. However, Croatian legislation framework still does not encourage waste treatment (in this case, digestate) by using commercial technologies that innovatively value by-products. Therefore, biogas plant operator needs to select a most profitable option, i.e., which can generate enough revenue to cover high CAPEX and OPEX costs, as soon as possible.
In Option 1 (struvite crystallization), it is assumed that CAPEX of an upgrade for digestate treatment of 2,500,000 HRK and OPEX of 500 HRK/t of treated digestate (utilization of materials at the plant—heat energy, sulphur from biogas cleaning [31]), and maintenance cost of 1,000,000 HRK per year are required. CAPEX in this case includes additional reactor construction, equipment required for analyzing the input and output streams and a rig for produced struvite transportation, while OPEX includes chemicals required for operation (energy is used from biogas plant), salaries for workers, maintenance, and unforeseen costs. Since there are no incentives available for this option, it is possible to assume the revenue from the produced fertilizer sale on the market (digestate with embedded struvite) for the price of 2000 HRK/t manure. Additionally, there is a cost reduction due to the utilization of fertigation liquid (digestate liquid fraction), which decreases the costs on plant level by 6000 HRK/t digestate [44]. It is also assumed that there is no need for additional investment in terms of storage due to the existing biogas plant infrastructure.
Option 2 (digestate recirculation) has higher CAPEX (15,000,000 HRK), but significantly lower OPEX (30 HRK/t digestate) because the process uses waste streams generated at the plant site (surplus heat energy, sulphur from biogas cleaning [31]). Costs related to maintenance are also lower and amount to 500,000 HRK annually. CAPEX in this case includes additional reactor construction (with closed recirculation with AD reactor) and equipment required for analyzing the input and output streams, while OPEX includes chemicals required for operation (energy is used from biogas plant), salaries for workers, maintenance, and unforeseen costs. This option also does not include incentives from the state, and therefore biogas plant operator can only rely on a reduction of corn silage costs due to feedstock change (treated digestate is recirculated to replace 10% of input corn silage) and increase of biogas yield by 5% [31]. Moreover, it is possible to consider the utilization of digestate liquid fraction as fertigation liquid.
Option 3 (digestate incineration) has higher costs—mainly due to small feedstock amounts used for the process [25], but also due to maintenance of the plant. CAPEX amounts to 9,000,000 HRK, while OPEX and maintenance costs amount to 1,000,000 HRK and 900,000 HRK annually, respectively [25,37]. CAPEX in this case includes reactor, dryer, and scrubber construction, while OPEX includes chemicals necessary for operation, electric energy, maintenance, and personnel costs.
Landfilling of produced ash should also be taken into account (most frequent case of ash management in Croatia), which costs amount to 1000 HRK per tonne of digestate. This option has available incentives (utilization of biomass for energy production in CHP unit), but only if emission standards are satisfied. Since biogas plants in Croatia utilize various feedstock for the process, this paper neglects the possibility of realising the FiT prices for energy production in an incineration plant. Due to changes on the electrical energy market, this paper considers the price of 0.50 HRK/kWh (the price for balancing energy [45]), where biogas plant operator achieves revenues (at a production of 250 kWh/t digestate) of 2,500,000 HRK annually.
Option 4 considers standard biogas plant with CAPEX of 6,000,000 HRK for 1 MWel plant and OPEX and maintenance costs of 1,500,000 HRK and 500,000 HRK annually, respectively. In this case, CAPEX includes construction of the AD reactor, while OPEX includes chemicals, feedstock (corn silage), and additional energy required for operation (additional to generated on-site), maintenance, personnel costs, and costs for digestate management. Since one of the feedstocks used is corn silage (mostly used), it is important to mention its costs on the market, which annually amount to around 3,000,000 HRK. From the revenue side, this options only has the revenue from selling electrical energy to EPS at incentive prices, which annually amounts to approximately 9,000,000 HRK (with plant operation at 7500 h per annum).

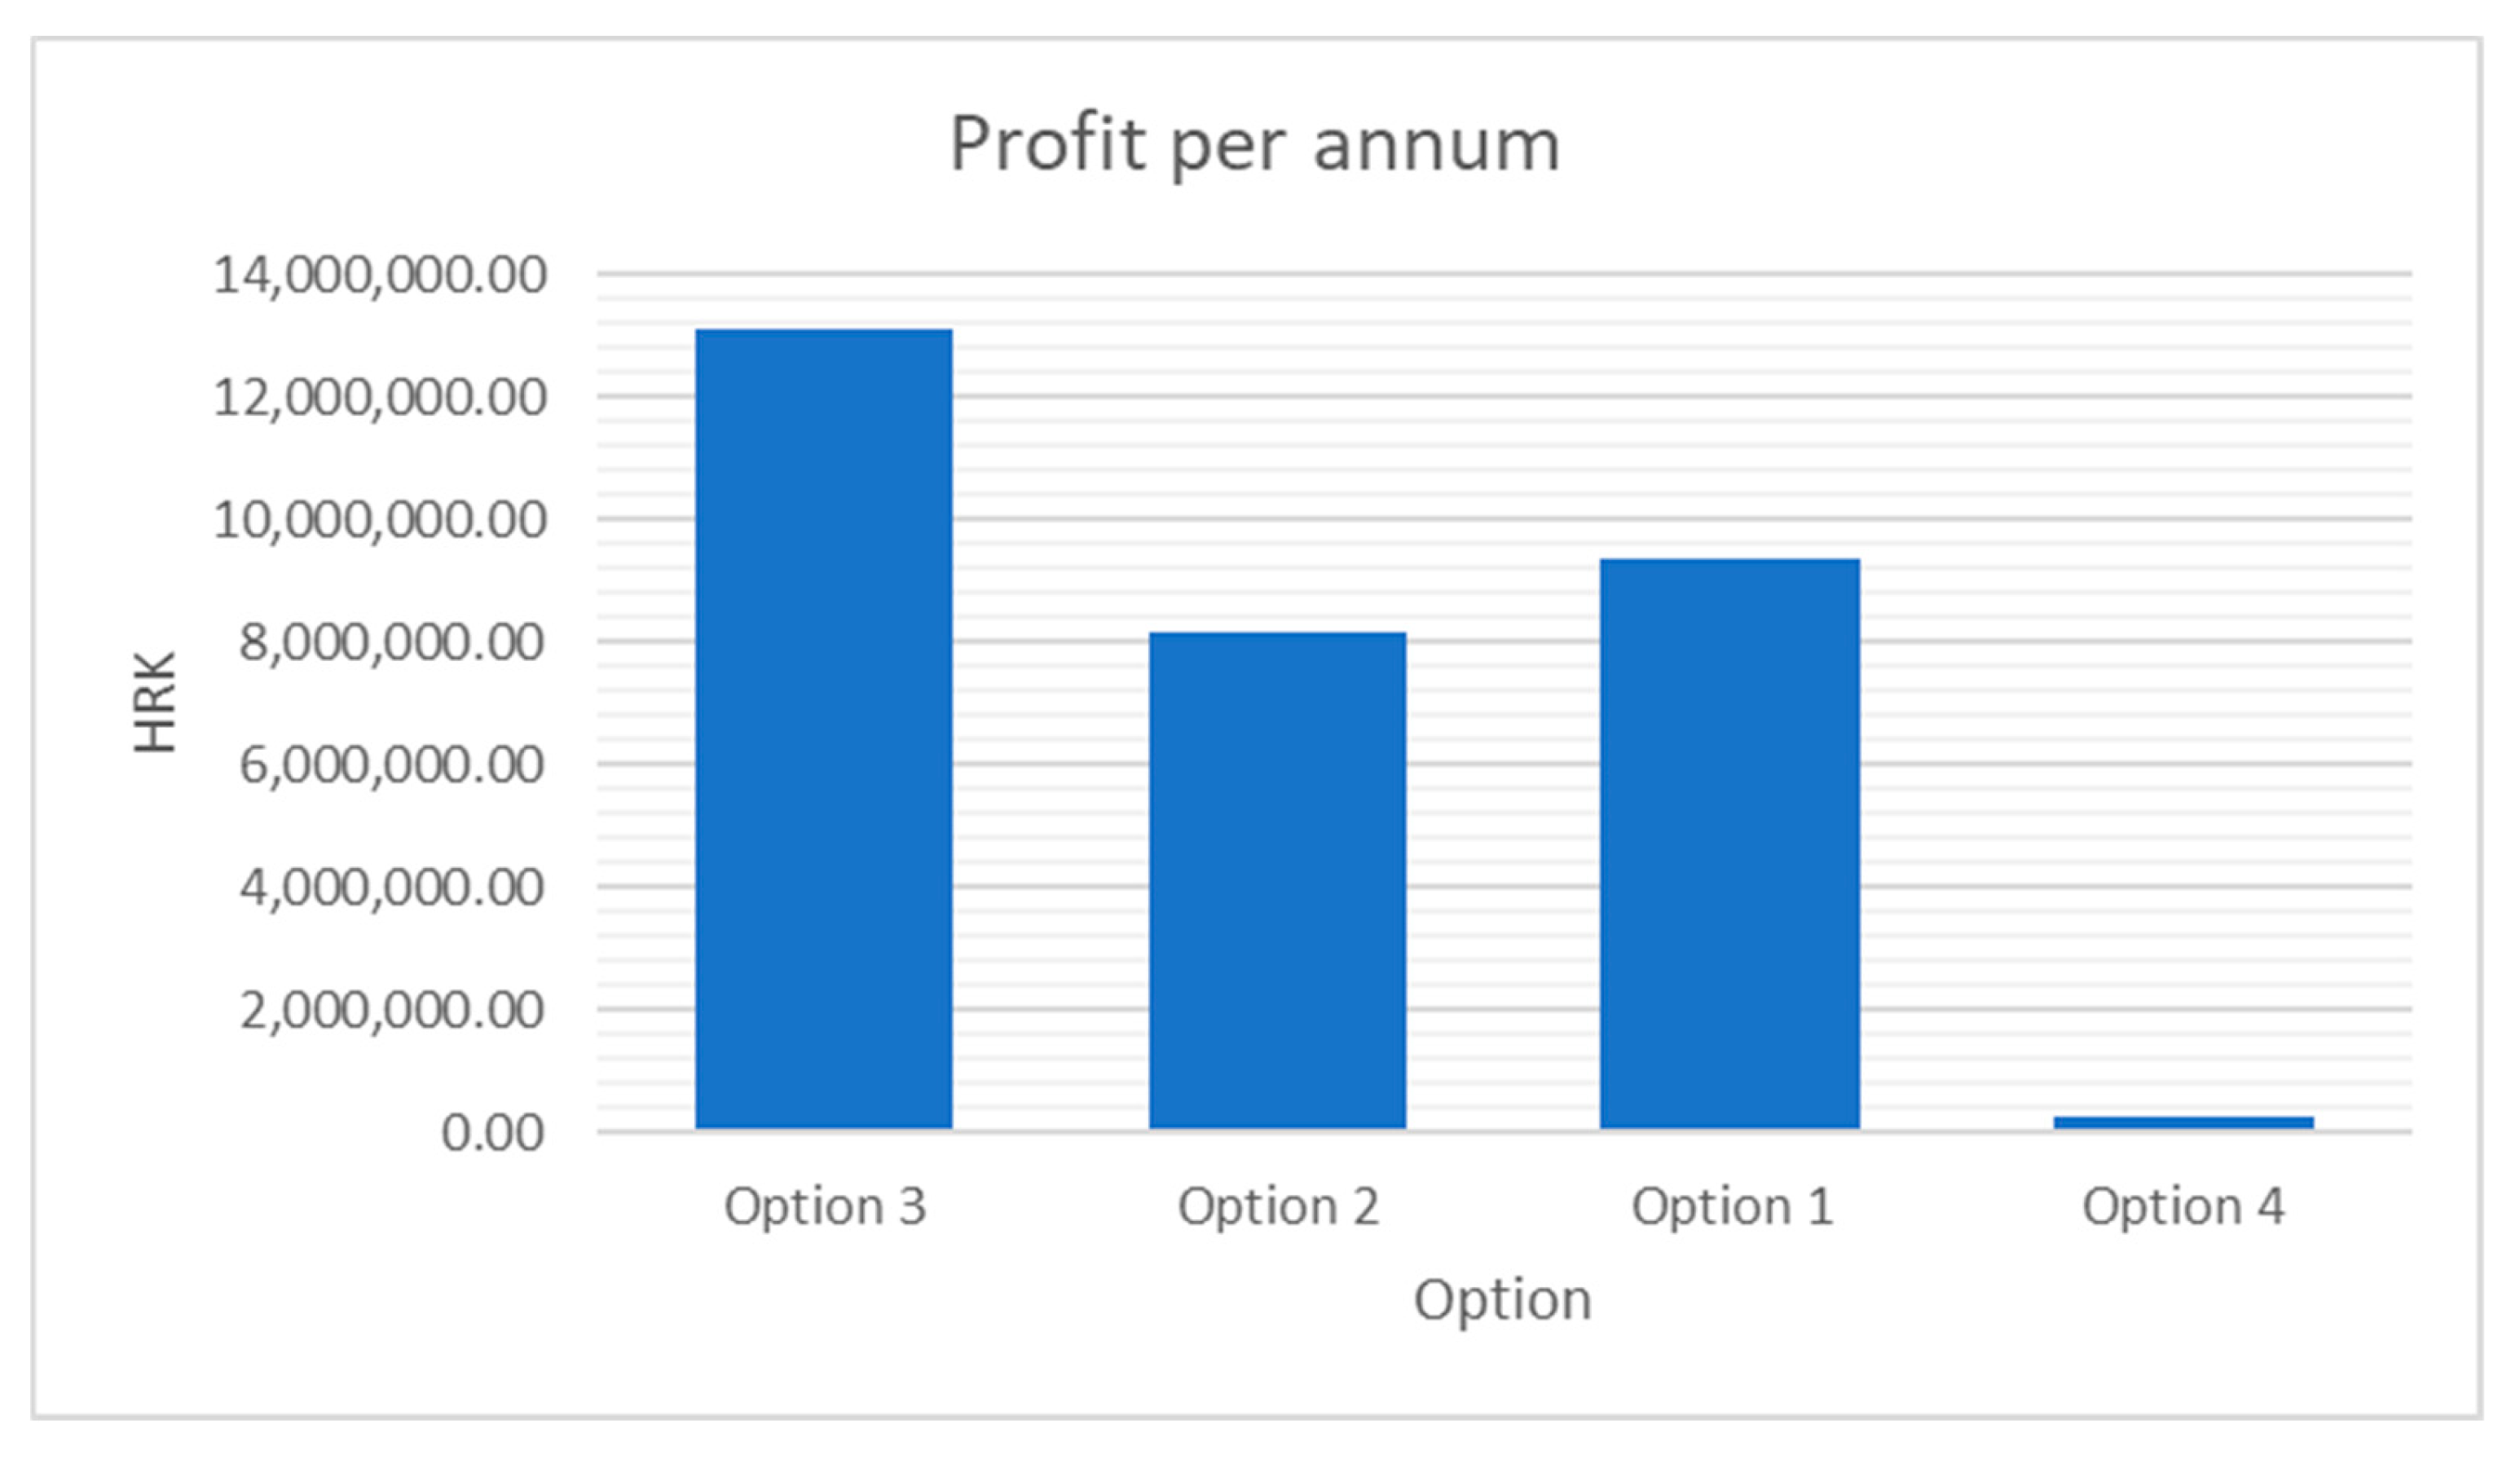
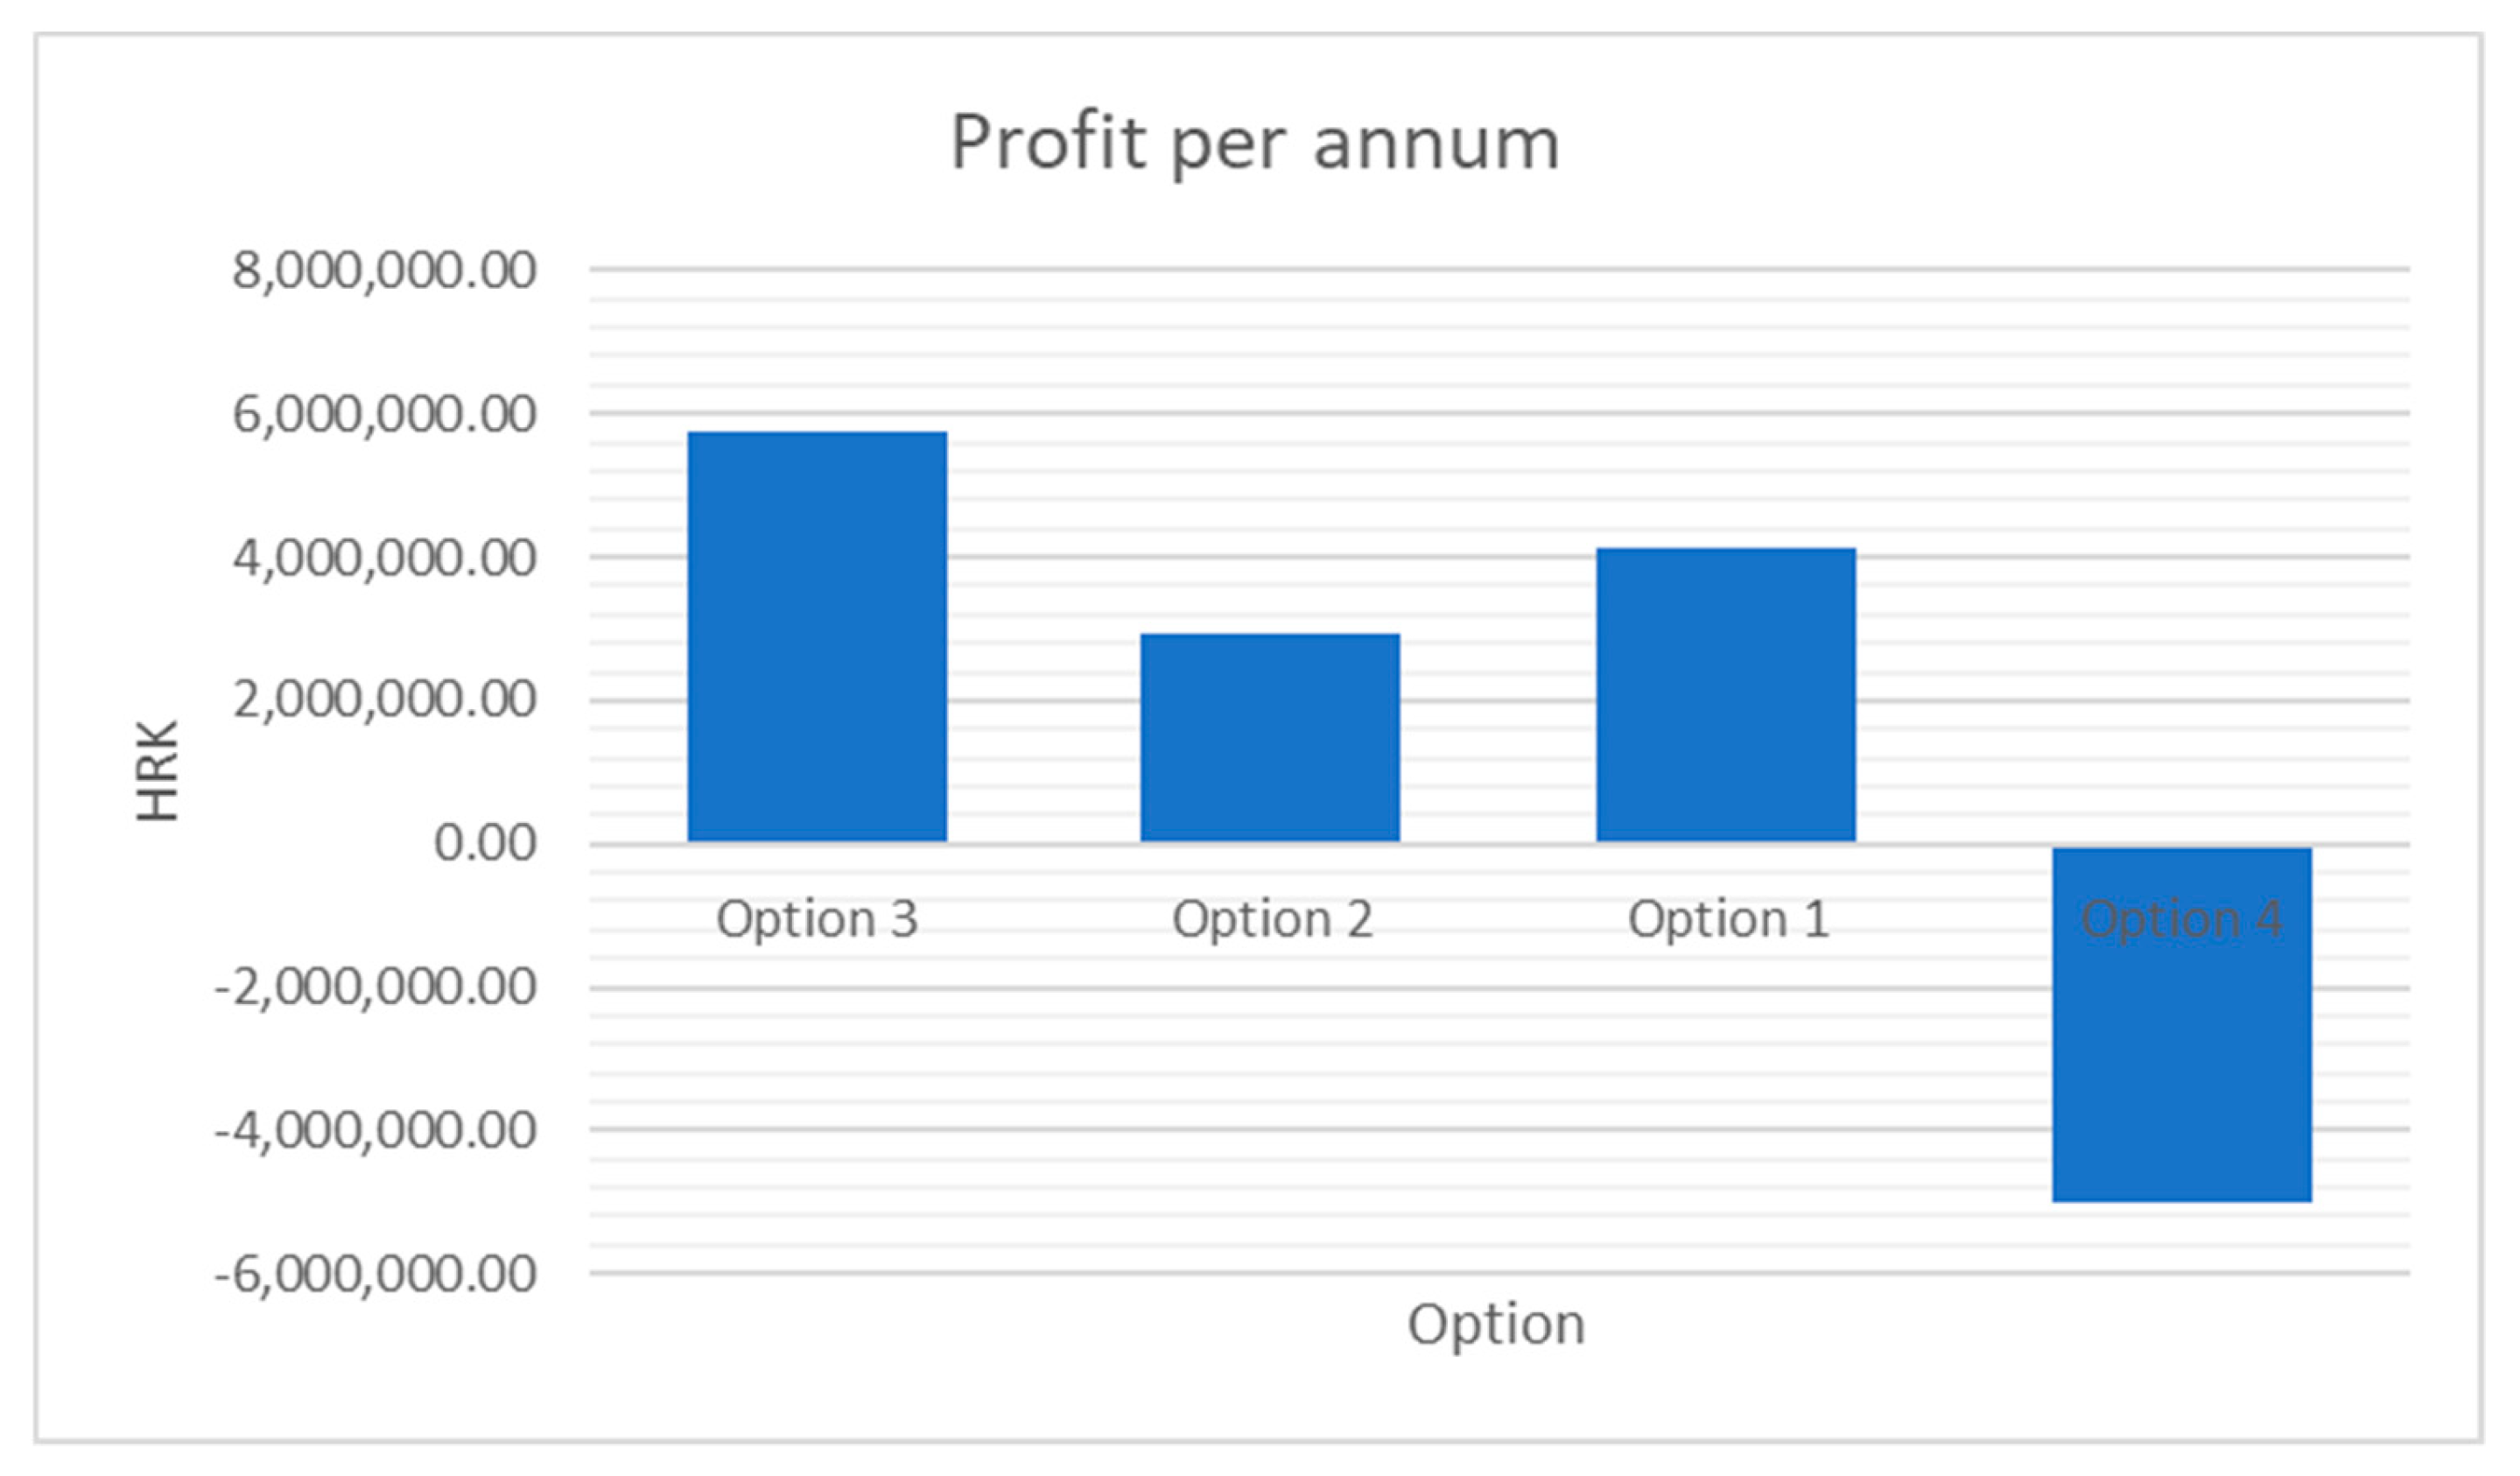
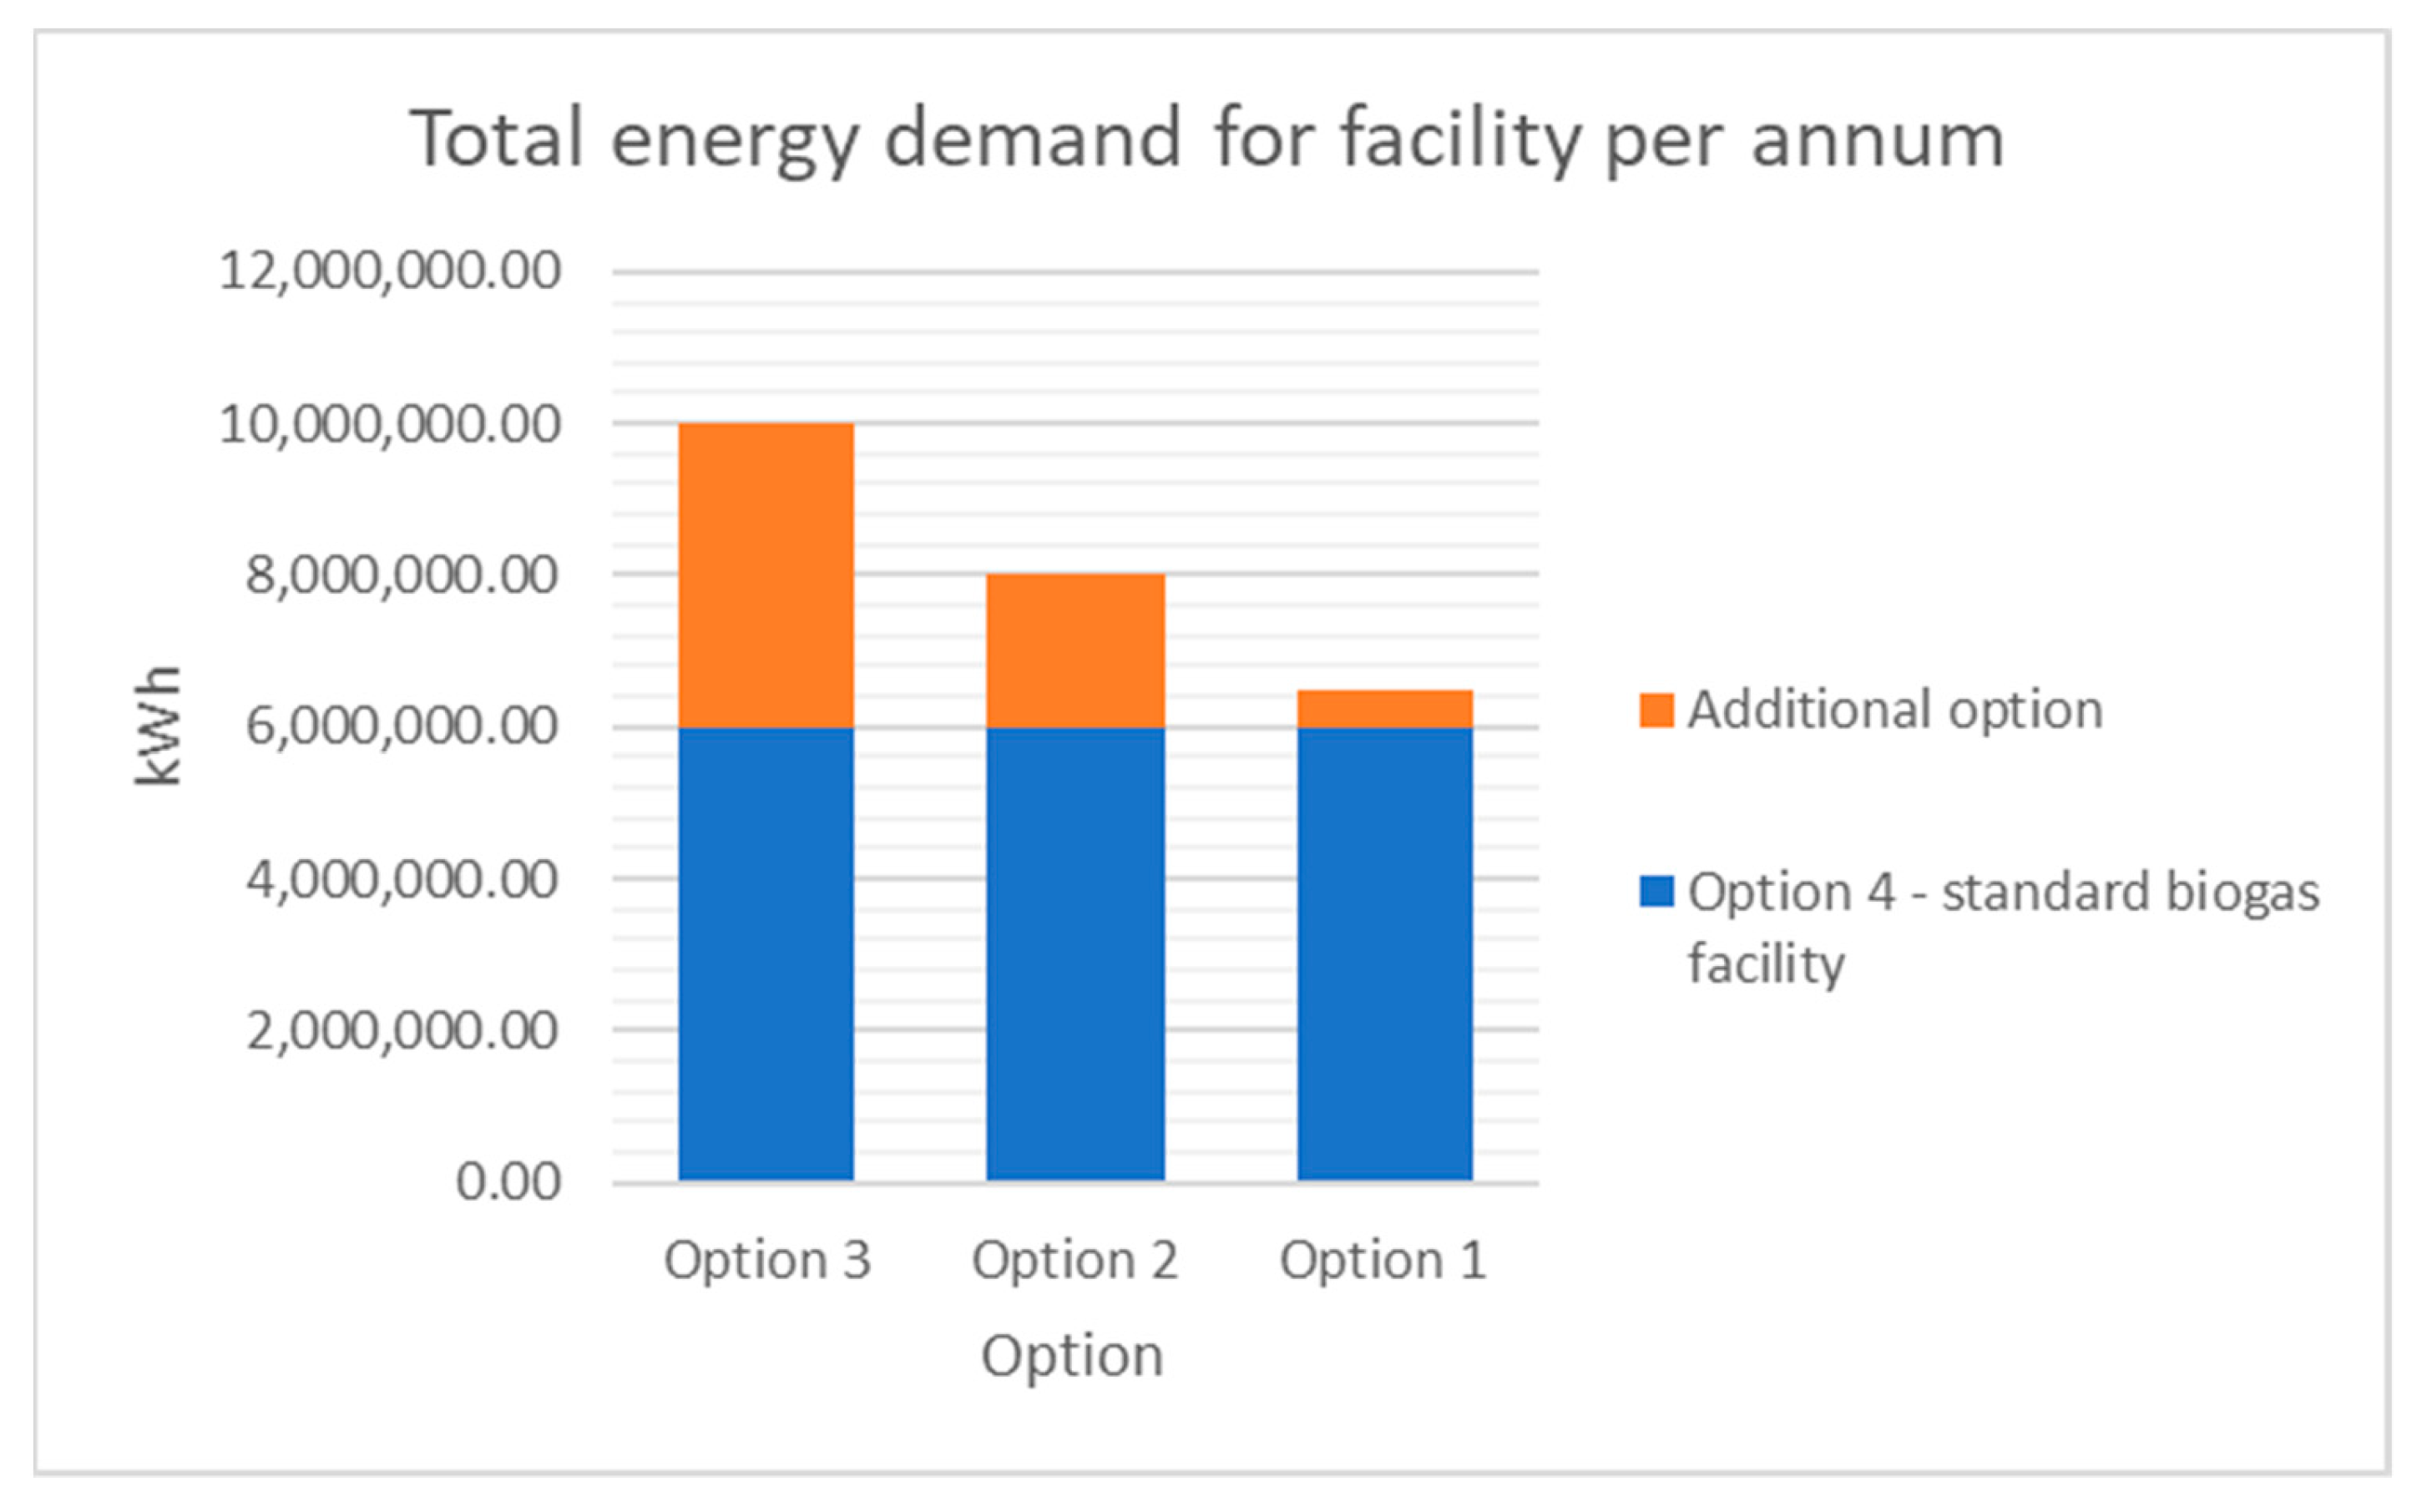
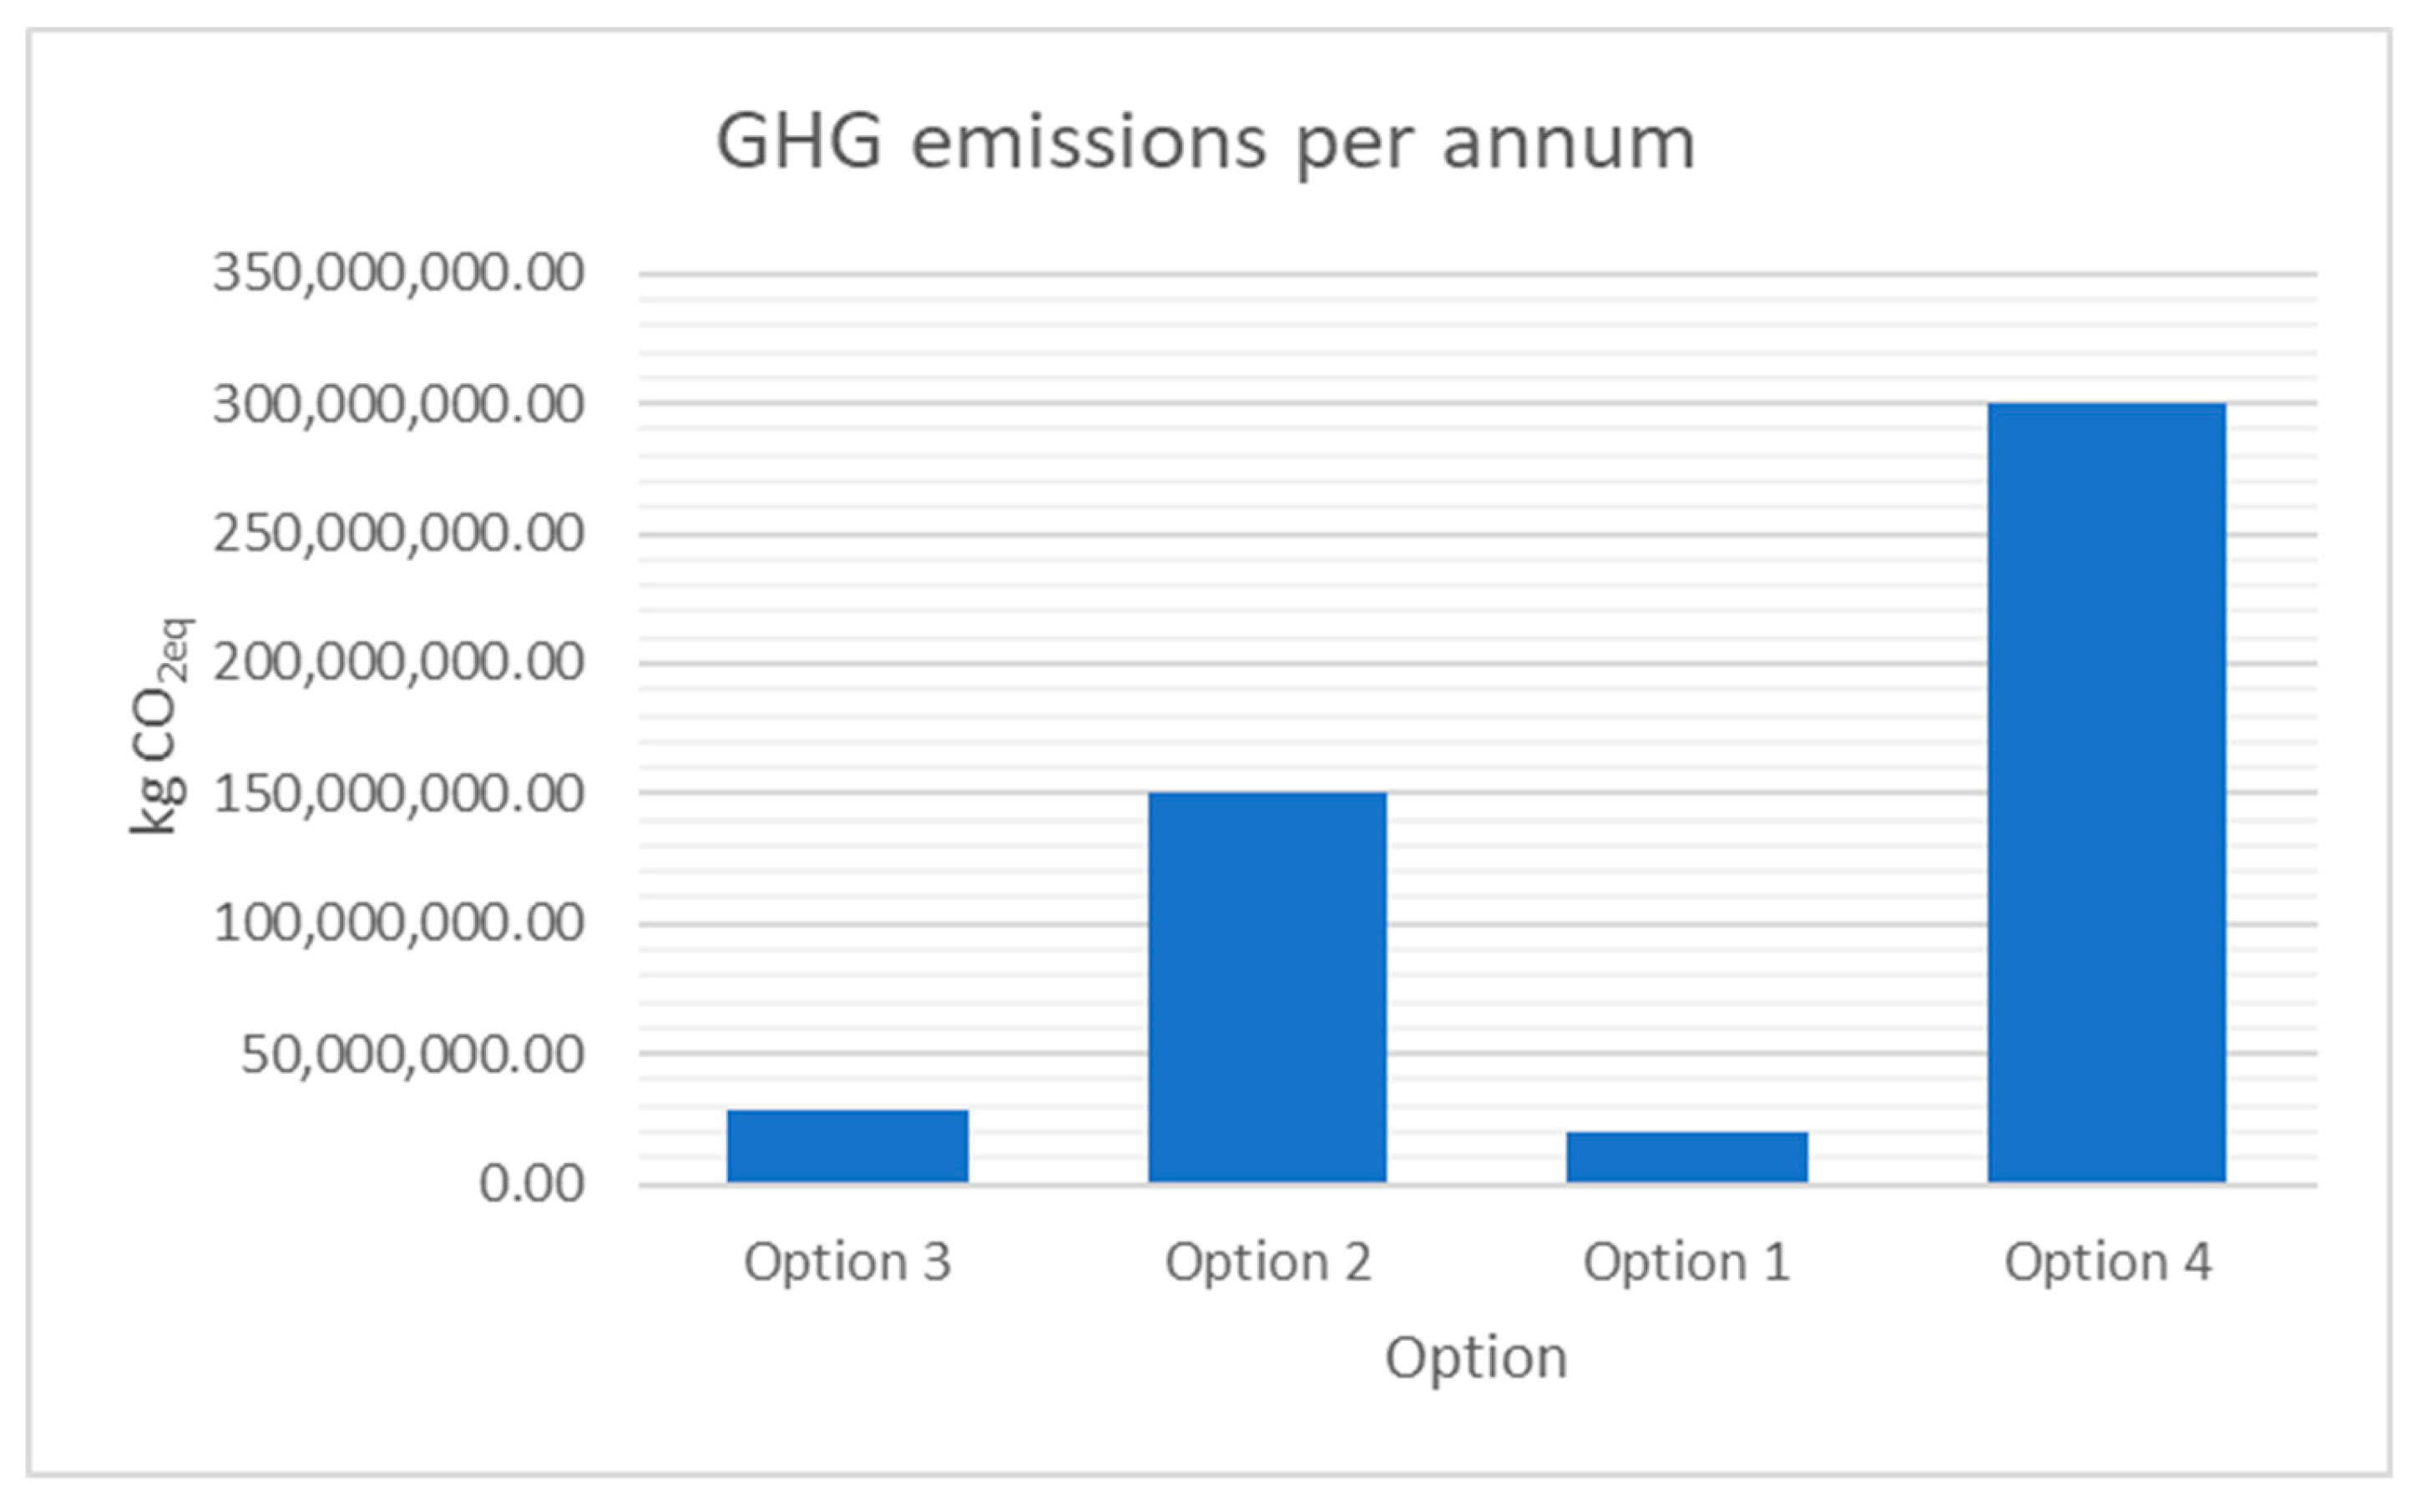
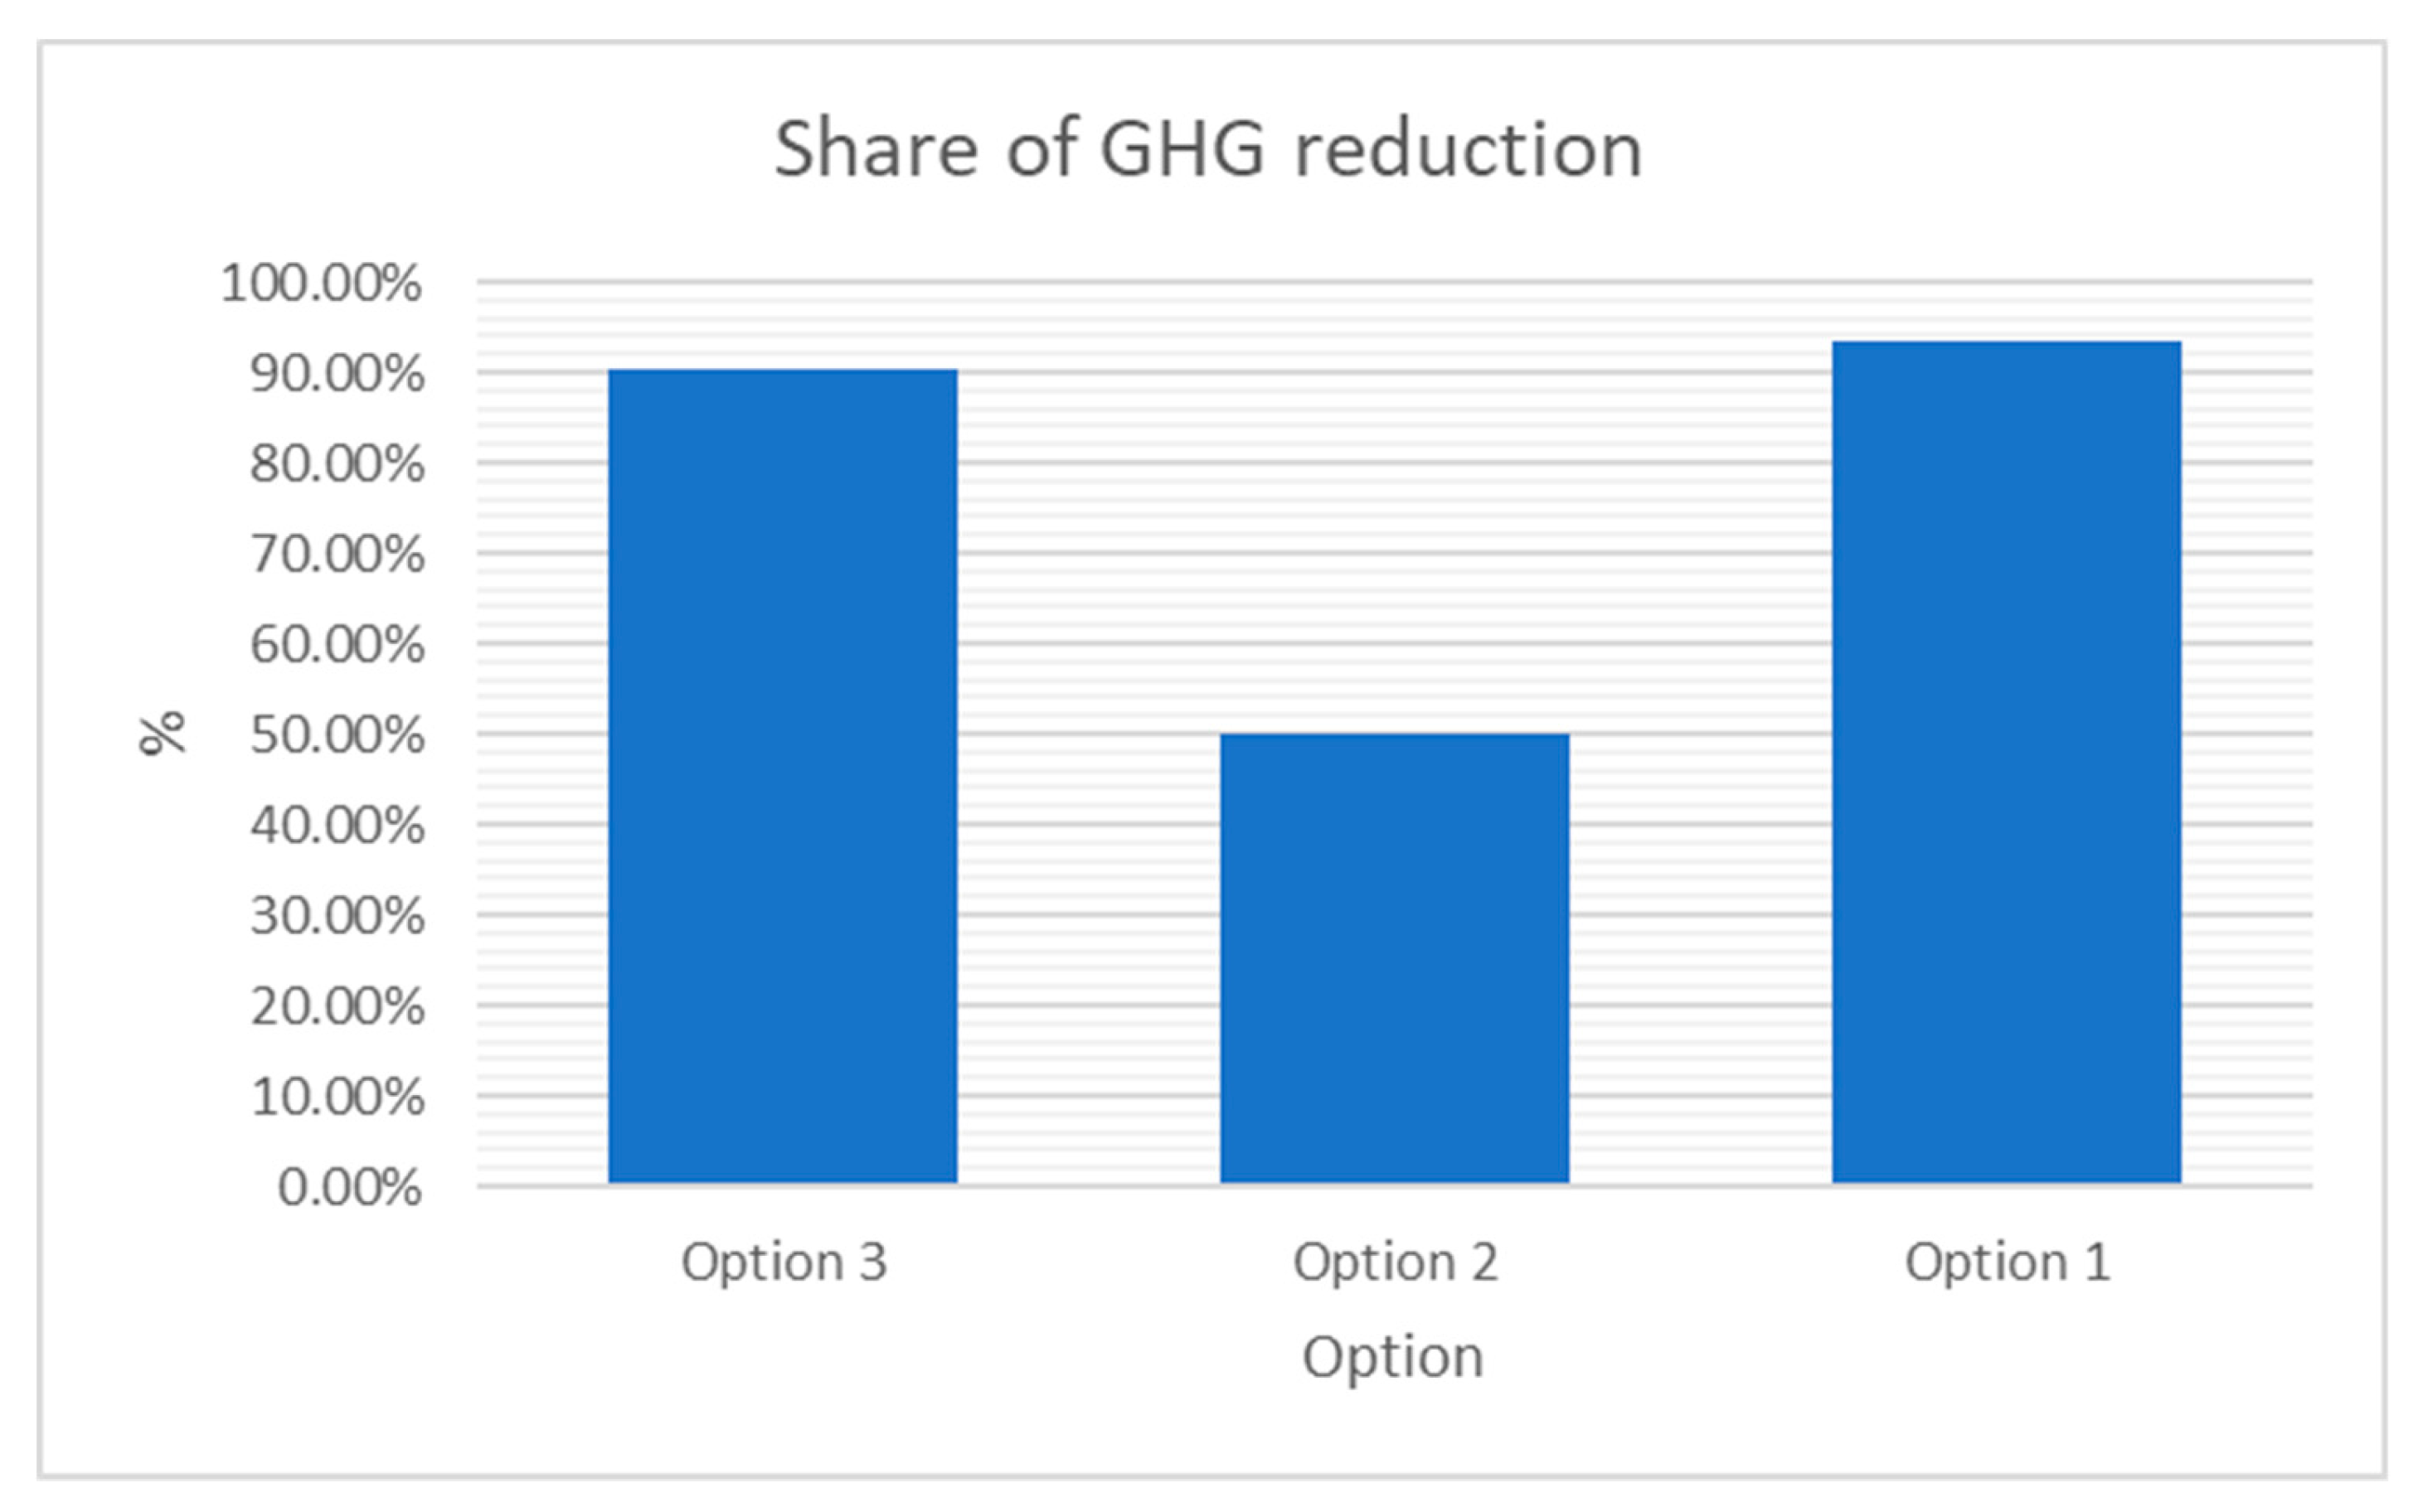
4. Results and Discussion

Based on the presented settings, calculations and available data, the optimization model provided initial solution on cost reduction, revenues increase, and GHG emissions reduction for the observed biogas plant, through the application of one of the solutions presented in this paper (Figure 2). Obtained results are a consequence of available table and in compliance with two objective functions set in the model.
Considering the OPEX of each option, Figure 3 shows that biogas plant on its own generates low profit, which is a result only because of the output of electrical energy to EPS with incentive prices, in compliance with the existing FiT.
In case that incentive prices were abolished, i.e., the selling prices for electrical energy would be equal to purchase price, biogas plant on its own would be financially unsustainable (Figure 4).
From a financial perspective, energy consumption was also examined for each option (Figure 5). This is significant due to prices of electrical energy in order to compare the costs of energy consumption for each option. Figure 5 presents how much additional energy demand each of the options requires (plant upgrade—Additional option), on top of energy demand of standard biogas plant. It shows that Option 1 (fertilizer production) has the lowest additional consumption on Option 4 (standard biogas plant). Options 2 and 3 have higher energy demands because these processes require energy input in the system for it to operate independently.
Since the premium system for RES stimulation is still in development, alternative ways of maintaining a financially favourable structure for biogas plants are required, but also solutions that have the lowest climate impact.
Even though Croatia still does not have standards related to GHG emissions that encourage RES production (such as biogas), and agricultural industry is not a topic of Emission Trading System (ETS), these fields will be significant in the near future, due to the goals set by European Union to reduce the negative impact of climate change and decarbonization of each sector.
By analyzing the potential and possible option for an observed biogas plant, GHG emissions per year are defined, which can be noticed in Figure 6. Figure 6 presents how much additional GHG emissions each of the options produces (Additional option), on top of GHG emissions of standard biogas plant. The figure shows how the least climate impact in terms of GHG emission has Option 1 (fertilizer production). This result could be related to the reduced need for landfilling and utilization of digestate as an upgrade fertilizer used on agricultural soils, where it presents a source of slow-release, high-quality mineral, with significantly reduced impact on GHG emission production.
The following Figure (Figure 7) shows the share of GHG emissions reduction for each option, compared to the standard biogas plant. It can be noticed that Option 1 (fertilizer production) indeed has the highest share of GHG emission reduction, while Option 2 is considered as an option with least emissions reduction, due to higher biogas yield. Option 2 produced additional biogas through digestate recirculation, and it is assumed that only 50% of the produced digestate is treated and recirculated in the process. The remaining 50% is stored or landfilled, which is the source of emissions.
Additionally, Figure 7 shows that Option 3 (digestate incineration) also has a high share of emissions reduction. However, this is related to the utilization of highly advanced technologies used for flue gas cleaning. It is also important to mention the need for treating produced ash from the process, whose management has its price. It is possible to utilize the produced ash as a substrate for compost production, which closes the cycle of waste management and is used as a feedstock for a new product.
However, considering the overall picture and taking into account the concept of bioeconomy [46] and circular economy [47], this is not sustainable because of the chemical structure and way in which nitrogen and phosphorus are connected in ash structure, and so are not efficient for implementation as a soil improver. Plants cannot utilize the mineral content, which is mainly bound in oxides and do not contribute to plant growth and development but leach deeper into the soil.
By using the model, results showed that fertilizer production (Option 1) through the crystallization process in digestate is the best approach for the achievement of the business case after exiting FiT.
The technology of digestate incineration (Option 3) also has a high positive impact on the environment and high revenues due to electrical energy sales. The downside of this technology in terms of Bioeconomy and Circular Economy is insufficient utilization of phosphorus, potassium and nitrogen, which are unavailable to plants for their growth and development during soil application. Moreover, their landfilling is not in accordance with guidelines on the reduction of amounts of landfilled waste.
Additionally, these results showed that digestate recirculation (Option 2) technology is the least acceptable by obtained results. It would be wrong to assume that this has a negative impact on the environment or economy of the biogas plant as a whole. On the contrary, by its utilization, reduced demand for corn silage is obtained, which impacts the reduced dependency on external suppliers and the possibility of creating more competitive redemption price. Moreover, it contributes to reduced consumption of mineral fertilizer, reduces emissions from transport, etc., which could be potentially more acknowledged in other cases, with different input data.

5. Conclusions

Biogas plants are considered as a good alternative for environmentally-friendly and sustainable energy production. However, from an economic aspect, only a small number of plants is cost-effective and sustainable, if only revenues from energy production (electrical energy) are considered. This paper examines the possibilities of digestate utilization produced in the AD process, through plant upgrade, as a feedstock for energy and material recovery, which could contribute to the economic sustainability of the plant itself.
Although GHG emissions reduction and environmental impact do not present an essential factor for the biogas plant operator, compared to economical sustainability, they need to be considered due to increased need for decarbonization of the agricultural sector and energy plants. Even though biogas plants are considered carbon-neutral, digestate produced during the AD process has a significant contribution to GHG emissions, if it is not managed properly. Currently, there are no sanctions and limitations which would force the plant operators to think on digestate management option, but in the near future, they will be inevitable. Taking into account the presented options in this paper, the biogas plant operator will not only become an environmentally-friendly energy producer but also financially sustainable, even in case of incentive prices abolition.
The Croatian biogas market is very dynamic, and the production and utilization of biogas is still in its initial stages. This paper presents a case study of a typical Croatian biogas plant, where it is possible to utilize innovative technology of struvite production in digestate through the crystallization process, in order to make it environmentally-friendly and cost-effective. Obtained results show that technology of fertilizer production (Option 1) has the most significant GHG emissions reduction and highest revenues, compared to independent biogas plant without additional upgrades. It should be noted that ranking of options in Excel Solver is not possible, due to its simplicity. Moreover, this result does not mean that other options are not good in terms of biogas plant’s GHG emissions and costs reduction. However, in this case, and taking into account the input data of the model, Option 1 has presented better results.
Even though this paper did not consider it, possible options of utilizing feedstock and nutrients contained in digestate need to be considered within concepts of bioeconomy and circular economy (e.g., utilization of ash from incineration as a fertilizer). By giving recommendations on further research, it is impossible to avoid the one recommendation to research the potentials of biogas and digestate outside the scope of the agricultural sector (transport, industry, etc.). Considering the existing biogas plants on agricultural biomass and manure and their development, research needs to be extended to the valorization of possible biogas contributions to GHG emissions reduction, sectoral decarbonization, and achieving goals set by Nitrate Directive and other uses of biogas to society as a whole, which could additionally involve local and regional authorities in development of biogas market.

Author Contributions

Conceptualization, D.Đ.; Formal analysis, D.Đ. and I.H.; Methodology, D.Đ. and I.H.; Supervision, D.Đ.; Writing—original draft, D.Đ.; Writing—review & editing, D.Đ. and I.H. All authors have read and agreed to the published version of the manuscript.

Funding

This research received no external funding.

Conflicts of Interest

The authors declare no conflict of interest.

References

  1. Owusu, P.A.; Asumadu-Sarkodie, S. A review of renewable energy sources, sustainability issues and climate change mitigation. Cogent Eng. 2016, 3, 1–14. [Google Scholar] [CrossRef]
  2. Tubiello, F.N.; Salvatore, M.; Rossi, S.; Ferrara, A.; Fitton, N.; Smith, P. The FAOSTAT database of greenhouse gas emissions from agriculture. Environ. Res. Lett. 2013, 8, 1–10. [Google Scholar] [CrossRef]
  3. Saedi, T.A.; Rutz, D.; Prassl, H.; Köttner, M.; Finsterwalder, T.; Volk, S.; Janssen, R. Biogas Handbook; University of Southern Denmark Esbjerg: Esbjerg, Denmark, 2008. [Google Scholar]
  4. Lyng, K.-A.; Stensgård, A.; Hanssen, O.; Modahl, I. Relation between greenhouse gas emissions and economic profit for different configurations of biogas value chains: A case study on different levels of sector integration. J. Clean. Prod. 2018, 182, 737–745. [Google Scholar] [CrossRef]
  5. Jensen, I.G.; Skovsgaard, L. The impact of CO2-costs on biogas usage. Energy 2017, 134, 289–300. [Google Scholar] [CrossRef] [Green Version]
  6. Timonen, K.; Sinkko, T.; Luostarinen, S.; Tampio, E.; Joensuu, K. LCA of anaerobic digestion: Emission allocation for energy and digestate. J. Clean. Prod. 2019, 235, 1567–1579. [Google Scholar] [CrossRef]
  7. Boldrin, A.; Baral, K.; Fitamo, T.; Vazifehkhoran, A.; Jensen, I.G.; Kjærgaard, I.; Lyng, K.-A.; van Nguyen, Q.; Nielsen, L.S.; Triolo, J.M. Optimised biogas production from the co-digestion of sugar beet with pig slurry: Integrating energy, GHG and economic accounting. Energy 2016, 112, 606–617. [Google Scholar] [CrossRef] [Green Version]
  8. Enitan, A.; Adeyemo, J.; Swalaha, F.; Kumari, S.; Bux, F. Optimization of biogas generation using anaerobic digestion models and computational intelligence approaches. Rev. Chem. Eng. 2017, 33, 309–335. [Google Scholar] [CrossRef]
  9. Qdais, H.; Hani, K.; Shatnawi, N. Modeling and optimization of biogas production from a waste digester using artificial neural network and genetic algorithm. Resour. Conserv. Recycl. 2010, 54, 359–363. [Google Scholar] [CrossRef]
  10. Meyer, A.D.; Cattrysse, D.; Orshoven, J. A generic mathematical model to optimise strategic and tactical decisions in biomass-based supply chains (OPTIMASS). Eur. J. Oper. Res. 2015, 245, 247–264. [Google Scholar] [CrossRef] [Green Version]
  11. Wolf, C.; McLoone, S.; Bongards, M. Biogas Plant Control and Optimization Using Computational Intelligence Methods. Autom. Methoden Anwend. Steuer. Regel. Inf. 2009, 57, 638–649. [Google Scholar]
  12. Zareei, S.; Khodaei, J. Modeling and optimization of biogas production from cow manure and maize straw using an Adaptive Neuro-Fuzzy Inference System. Renew. Energy 2017, 114, 423–427. [Google Scholar] [CrossRef]
  13. Blumensaat, F.; Keller, J. Modelling of two-stage anaerobic digestion using the IWA Anaerobic Digestion Model No. 1 (ADM1). Water Res. 2005, 39, 171–183. [Google Scholar] [CrossRef] [PubMed]
  14. Batstone, D.; Keller, J.; Angelidaki, I.; Kalyuzhnyi, S.; Pavlostathis, G.; Rozzi, A.; Sanders, W.; Siegrist, H.; Vavilin, V. Anaerobic digestion model No 1 (ADM1). Water Sci. Technol. 2002, 45, 65–73. [Google Scholar] [CrossRef] [PubMed]
  15. Mendes, C.; Esquerre, K.; Queiroz, L.M. Application of Anaerobic Digestion Model No. 1 for simulating anaerobic mesophilic sludge digestion. Waste Manag. 2015, 35, 89–95. [Google Scholar] [CrossRef]
  16. Biernacki, P.; Steinigeweg, S.; Borchert, A.; Uhlenhut, F. Application of Anaerobic Digestion Model No. 1 for describing anaerobic digestion of grass, maize, green weed silage, and industrial glycerine. Bioresour. Technol. 2013, 127, 188–194. [Google Scholar] [CrossRef] [PubMed]
  17. Gaida, D.; Luis, S.; Wolf, C.; Back, T.; Bongards, M.; McLoone, S. Optimal control of biogas plants using nonlinear model predictive control. In Proceedings of the 29th International System Safety Conference (ISSC 2011), Las Vegas, NV, USA, 23–24 June 2011. [Google Scholar]
  18. Uhlemair, H.; Karschin, I.; Geldermann, J. Optimizing the production and distribution system of bioenergy villages. Int. J. Prod. Econ. 2014, 147, 62–72. [Google Scholar] [CrossRef]
  19. Jensen, I.; Münster, M.; Pisinger, D. Optimizing the supply chain of biomass and biogas for a single plant considering mass and energy losses. Eur. J. Oper. Res. 2017, 262, 744–758. [Google Scholar] [CrossRef] [Green Version]
  20. Lyng, K.-A.; Modahl, I.; Møller, H.; Morken, J.; Briseid, T.; Hanssen, O. The BioValueChain model: A Norwegian model for calculating environmental impacts of biogas value chains. Int. J. Life Cycle Assess. 2015, 20, 490–502. [Google Scholar] [CrossRef]
  21. Lyng, K.-A.; Bjerkestrand, M.; Stensgård, A.; Callewaert, P.; Hanssen, O. Optimising Anaerobic Digestion of Manure Resources at a Regional Level. Sustainability 2018, 10, 286. [Google Scholar] [CrossRef] [Green Version]
  22. Logan, M.; Visvanathan, C. Management strategies for anaerobic digestate of organic fraction of municipal solid waste: Current status and future prospects. Waste Manag. Res. 2019, 37, 27–39. [Google Scholar] [CrossRef] [Green Version]
  23. Kataki, S.; Sarma, G.; Patowary, D.; Baruah, D. Prospects of Utilization of Liquid Fraction of Biogas Digestate as Substrate Supplement for Mushroom Cultivation. In Advances in Waste Management; Springer: Singapore, 2019; pp. 445–465. [Google Scholar]
  24. Lukehurst, C.; Frost, P.; Saedi, T. Utilisation of digestate from biogas plants as biofertilizer. IEA Bioenergy 2010, 2010, 1–36. [Google Scholar]
  25. Đurđević, D.; Blecich, P.; Lenić, K. Energy Potential of Digestate Produced by Anaerobic Digestion in Biogas Power Plants: The Case Study of Croatia. Environ. Eng. Sci. 2018, 35, 1286–1293. [Google Scholar] [CrossRef]
  26. Croatian Energy Market Operator. Yearly Report 2018; Croatian Energy Market Operator: Zagreb, Croatia, 2019. [Google Scholar]
  27. Energy Institute Hrvoje Požar. Case Studies in Biogas Action; EU Horizon 2020: Zagreb, Croatia, 2018. [Google Scholar]
  28. Chow, L. World’s First Large-Scale Carbon-Neutral Brewery Now in Operation Ethical Corporation. Available online: http://www.ethicalcorp.com/heineken-shows-its-bottle-climate (accessed on 30 September 2019).
  29. Štambaský, J.; Wellinger, A.; Scheidl, S. Biogas Action Brochure on Best Regional Integrated Biogas Plants; EU Horizon 2020: Copenhagen, Denmark, 2016. [Google Scholar]
  30. Đurđević, D.; Hulenić, I.; Kulišić, B. Degradation of Lignocellulosic Complex Through Production of Struvite from Digestate. Waste Biomass Valorization 2018, in press. [Google Scholar]
  31. Sigurnjak, I.; Vaneeckhaute, C.; Michels, E.; Ryckaert, B.; Ghekiere, G.; Tack, F.; Meers, E. Fertilizer performance of liquid fraction of digestate as synthetic nitrogen substitute in silage maize cultivation for three consecutive years. Sci. Total Environ. 2017, 599–600, 1885–1894. [Google Scholar] [CrossRef]
  32. Barzee, T.; Edalati, A.; El-Mashad, H.; Wang, D.; Scow, K.; Zhang, R. Digestate Biofertilizers Support Similar or Higher Tomato Yields and Quality Than Mineral Fertilizer in a Subsurface Drip Fertigation System. Front. Sustain. Food Syst. 2019, 3, 58. [Google Scholar] [CrossRef]
  33. Kulišić, B.; Đurđević, D.; Ivić, I. Increasing the economy of biogas plant through innovative digestate evaluation. In Znanstveno-Stručna Radionica Proizvodnja Bioplina; Faculty of Chemical Engineering and Technology: Zagreb, Croatia, 2016. [Google Scholar]
  34. Møller, J.; Boldrin, A.; Christensen, T. Anaerobic digestion and digestate use: Accounting of greenhouse gases and global warming contribution. Waste Manag. Res. 2009, 27, 813–824. [Google Scholar] [CrossRef] [Green Version]
  35. Monlau, F.; Sambusiti, C.; Ficara, E.; Aboulkas, A.; Barakat, A.; Carrere, H. New opportunities for agricultural digestate valorization: Current situation and perspectives. Energy Environ. Sci. 2015, 8, 2600–2621. [Google Scholar] [CrossRef]
  36. Visvanathan, Z.; Visvanathan, C. Evaluation of anaerobic digestate for greenhouse gas emissions at various stages of its management. Int. Biodeterior. Biodegrad. 2014, 95, 167–175. [Google Scholar]
  37. Gardoni, D.; Guarino, M. Drying and combustion of an anaerobic digestate: Results and economical evaluation of a demonstrative-scale plant. Int. J. Eng. Res. Sci. 2016, 2, 148–155. [Google Scholar]
  38. Nkoa, R. Agricultural benefits and environmental risks of soil fertilization with anaerobic digestates: A review. Agron. Sustain. Dev. 2014, 34, 473–492. [Google Scholar] [CrossRef] [Green Version]
  39. Johansen, A.; Carter, M.S.; Jensen, E.; Hauggard-Nielsen, H.; Ambus, P. Effects of digestate from anaerobically digested cattle slurry and plant materials on soil microbial community and emission of CO2 and N2O. Appl. Soil Ecol. 2013, 63, 36–44. [Google Scholar] [CrossRef]
  40. Wulf, S.; Maeting, M.; Clemens, J. Application technique and slurry co-fermentation effects on ammonia, nitrous oxide, and methane emissions after spreading: II. Greenhouse gas emissions. J. Environ. Qual. 2002, 31, 1795–1801. [Google Scholar] [CrossRef] [PubMed]
  41. Chen, S.; Chen, B.; Song, D. Life-cycle energy production and emissions mitigation by comprehensive biogas–digestate utilization. Bioresour. Technol. 2012, 114, 357–364. [Google Scholar]
  42. Maldaner, L.; Wagner-Riddle, C.; VanderZaag, A.; Gordon, R.; Duke, C. Methane emissions from storage of digestate at a dairy manure biogas facility. Agric. For. Meteorol. 2018, 258, 96–107. [Google Scholar] [CrossRef]
  43. Baldé, H.; VanderZaag, A.; Burtt, S.; Wagner-Riddle, C.; Crolla, A.; Desjardins, R.; MacDonald, D. Methane emissions from digestate at an agricultural biogas plant. Bioresour. Technol. 2016, 216, 914–922. [Google Scholar] [PubMed]
  44. Molinos-Senante, M.; Hernandez-Sancho, F.; Sala-Garrido, R.; Garrido-Baserba, M. Economic Feasibility Study for Phosphorus Recovery Processes. Ambio 2011, 40, 408–416. [Google Scholar] [CrossRef] [PubMed] [Green Version]
  45. Croatian Energy Market Operator. Balancing Energy; Croatian Energy Market Operator: Zagreb, Croatia, 2017; Available online: https://www.hrote.hr/balancing-energy (accessed on 30 August 2019).
  46. European Commission. A Sustainable Bioeconomy for Europe: Strengthening the Connection between Economy, Society and the Environment—Updated Bioeconomy Strategy; European Commission: Brussels, Belgium, 2018. [Google Scholar]
  47. European Commission. Closing the Loop: Commission Adopts Ambitious New Circular Economy Package to Boost Competitiveness, Create Jobs and Generate Sustainable Growth; European Commission: Brussels, Belgium, 2015. [Google Scholar]
Figure 1. Renewable energy sources production in Croatia, 2019 [kW].
Processes 08 00142 g001
Figure 2. Flow chart for the digestate treatment options within the biogas facility scope.
Processes 08 00142 g002
Figure 3. Profit of each facility per annum with incentive prices.
Processes 08 00142 g003
Figure 4. Profit of each facility per annum without incentive prices.
Processes 08 00142 g004
Figure 5. Total energy demand for each facility per annum.
Processes 08 00142 g005
Figure 6. GHG emissions for each facility per annum.
Processes 08 00142 g006
Figure 7. Share of GHG reduction, in comparison with Option 4.
Processes 08 00142 g007
Table 1. Economic costs and income for the biogas facility operator and emissions and avoided emissions for each option.
Option 1Option 2Option 3Option 4
Economic cost for operatorInvestment in additional plant, operational and maintenance cost, chemicalsInvestment in additional plant, operational and maintenance cost, chemicalsInvestment in additional plant, operational and maintenance cost, potential ash management (landfill)No change
Income for the operatorMarket cost of high-quality fertilizerLower cost of maize silage used as feedstockAdditional energy produced from incineration processNo change
Emissions of greenhouse gasesPre-storage of manure, anaerobic digestion (energy use, capital goods), chemicalsPre-storage of manure, anaerobic digestion (energy use, capital goods), chemicalsPre-storage of manure, anaerobic digestion (energy use, capital goods), emissions from incineration processStorage of manure and storage and spreading of digestate
Avoided emissions of greenhouse gasesElectricity and heat production, digestate use as fertilizer (no storage)Electricity and heat production, utilization of surplus heat for digestate drying and heat treatmentElectricity and heat production, surplus heat for digestate drying and start of incineration processElectricity and heat production
Table 2. Parameters specific for digestate treatment options.
Option 1Option 2Option 3Option 4
Amount of produced digestate that can be used as fertilizerPlant energy demandEnergy demand for digestate drying and plant operationGHG emissions from digestate
Market price of produced fertilizer Digestate share treated and recirculatedDigestate energy potentialCorn silage price per year
Plant energy demandCorn silage share replaced by treated digestateGHG emissions from incineration plantTotal energy efficiency of the biogas plant
Digestate share used for fertilizer productionBiogas yield increase due to treated digestate recirculationAsh treatment costAmount of manure used in AD
GHG emission due to utilization of fertilizer (struvite) on soilMarket price for fertigation liquidAdditional energy (biogas + digestate incineration)Amount of corn silage used in AD
Market price for fertigation liquid
Maintenance costs per year
Plant lifetime
Plant capital cost (CAPEX)
Plant operational cost (OPEX)
Interest rate for each plant
Table 3. Parameters specific for digestate treatment options.
FactorGreenhouse GasCO2eq [kg CO2eq/t Digestate]Source
Emissions from AD digestateCH4, N2O216.96[21]
Biogas productionCH4, N2O, CO25.8–9.4 [20,34,35,36]
Digestate recirculationCH4/[35]
Digestate incinerationCH4, CO2, NOx1410[35,37]
Fertilization with digestateCH4, CO2, N2O, NH3107.2[38,39,40,41]
Digestate storage (no cover)CH469.58[42,43]

