Article

Flow Ripple Reduction of Axial-Piston Pump by Structure Optimizing of Outlet Triangular Damping Groove

1
School of Mechanical Engineering, Zhejiang University, Hangzhou 310000, China
2
State Key Laboratory of Fluid Power & Mechatronic Systems, Zhejiang University, Hangzhou 310000, China
*
Authors to whom correspondence should be addressed.
Shared first authorship.
Processes 2020, 8(12), 1664; https://doi.org/10.3390/pr8121664
Submission received: 6 November 2020 / Revised: 7 December 2020 / Accepted: 15 December 2020 / Published: 17 December 2020

Abstract

:
The triangular damping groove on the valve plate can effectively reduce the discharge flow ripple of an axial piston pump, which structural parameters will directly affect the pump’s dynamic characteristics. Herein, a multi-parameter data-based structure optimizing method of the triangular damping groove is investigated using numerical models and simulation results. The mathematical models of a nine-piston pump are proposed and developed by MATLAB/Simulink, and the simulation results are verified by experimental results. Then, the effects of width angle and depth angle on discharge flow are analyzed. Based on the analysis of groove parameters, an optimizing index, which considering the time domain characteristics of discharge flow, is proposed. As results show, comparing with the initial specific groove structure, the amplitude of flow ripple is reduced from 14.6% to 9.8% with the optimized structure. The results demonstrate that the outlet flow ripple can be significantly reduced by the optimized structure, and the proposed multi-parameter optimizing method can play a guiding significance in the design of low-ripple axial piston pumps.

1. Introduction

In the hydraulic drive systems, fixed displacement axial piston pumps are essential and widely used in machining, transportation, aerospace, and other industrial fields due to their high power-to-weight ratio and wide operating range. However, there are periodic flow ripples during pump operation. Excessive flow ripples will weaken pump performance and service life. With the development of pump design and manufacturing, the damping groove on the valve plate was carried out and could effectively reduce the flow ripples. Traditionally, in order to obtain the optimized structure of the damping groove, researchers have to process and test damping groove structures with different structural parameters, which are inefficient and costly. The numerical simulation method was the focus and development as an auxiliary experimental method in the structure optimizing method. In the past 50 years, researchers have been working to improve numerical models of axial-piston pumps.
Yamaguchi [1,2] proposed a numerical model to calculate the pressure dynamics in the piston chamber. The leakages through the clearance between the cylinder and the port plate, and the clearance between the piston and the cylinder were counted. This is the first research of the numerical model of the axial-piston pump. Edge and Darling [3] conducted extensive research on the theoretical model of a swash plate axial piston pumps. The effects of inertial flow and cavitation phenomenon were studied, and an improved model was proposed to figure out the optimal structure of damping grooves. Manring [4] counted the leakage and compressibility of fluid in his model, and proposed improving models of flow dynamics, which directly improve the accuracy of the model. Ma et al. [5] counted the effect of fluid inertial on unsteady flow. Bergada et al. calculated leakages through the key friction pairs [6], and designed a special test rig to measure the dynamic pressure in the piston chamber [7]. The simulation results are in good agreement with the experimental results. Xu et al. [8] studied the erosion damage of the valve plate and proposed a computational fluid dynamics (CFD) turbulence model to predict pump dynamic characteristics. Yin et al. [9] proposed a complete numerical model, which counted the compressibility effects of fluids and the dynamic processes of gas, steam, pseudo-cavitation and cavitation failure. Lijian S. and Jun Z. [10] proposed a multi-disciplinary optimization design method based on the approximation model to improve the comprehensive performance of axial-flow pump impellers, which considered the interaction and mutual influences of the hydraulic and structural designs. The method provides guidance for the optimal design of axial-flow pump impellers.
In recent years, with the development of the computational accuracy of the numerical models, researchers have applied numerical models to the structural optimization of axial piston pumps. It is a more efficient and effective way compared with the actual test. Mandal et al. [11,12] emphasized the effects of the groove volume change, and used numerical analysis to optimize the groove structure. The oil compressibility and fluid inertial were counted, and the optimal dimensions were indicated. Xu et al. [13] developed dynamic models and studied the effects of cross-angle and pressure relief grooves of the valve plate on pumping dynamics. An optimization method based on the simulation model was proposed to reduce the transient flow. Wieczorek and Ivantysynova [14,15] developed an integrated computing software which is named Calculation of Swash- Plate Type Axial Piston Pump/Motor (CASPAR) framework to analyze and help improve pump design. It was a frame for the comprehensive analysis of the piston pump friction pairs and pump dynamics. In [5,16], Ma optimized the cross angle and pre-compression angle of the valve plate with the improved dynamics models. Xinjie Z. and Yanhui C. [17] established a simulation model based on the AMESim software, which considered the swash plate angle, spindle speed, and export volume. The results provided a reference for further study of the output pulsation of the control piston pump. Pan Y. and Li Y. [18] proposed a theoretical model of the outlet flow ripple and pressure pulsation of a constant power variable-displacement piston pump. The proposed model considered the vibration of the swash plate, flow leakage, and valve dynamic characteristics. The valve plate is optimized based on the theoretical model of the outlet flow ripple, using the amplitude of the instantaneous outlet flow ripple as the optimization objective function. The optimization work was a single parameter optimization process. Song L. and Chuan W. [19] proposed a nonlinear mathematical model of the flow characteristics of micro piston pump, considering the leakage of the friction pair. Based on a multi-objective optimization genetic algorithm, with pressure and flow value as optimization targets, the pre-compression and decompression angle of the kidney groove on a swash plate was optimized using the computational fluid dynamics (CFD) method.
This paper presents a method to optimize triangular damping groove, which is based on the dynamic characteristics of discharge flow. The optimization work aims to reduce the amplitude of flow ripples. Therefore, the content of the article contains the following aspects. In Section 2 and Section 3, the theoretical models of the fixed displacement axial piston pump are discussed. The effects of leakage flow, inertial flow, and reverse flow are counted, and the simulation models with a special damping groove structure are verified by experiments. In Section 4, the effects of the depth and width angle of the triangular groove on dynamic characteristics are analyzed based on the simulation results. In Section 5, an optimizing index is constructed based on four time-domain characteristics of the discharge flow, and the optimized solution of the triangular groove is figured out. The conclusions are drawn in Section 6.

2. Simulation Model

The pressure transient in the piston chamber is expressed as [3,13]:
d p f d t = K e V f ( Q o u t d V f d t ) ,
where pf is the pressure in the piston chamber, Vf is the fluid volume of the piston chamber, Ke is the bulk modulus of the oil, and Qout is the theoretical flow rate of the piston chamber.
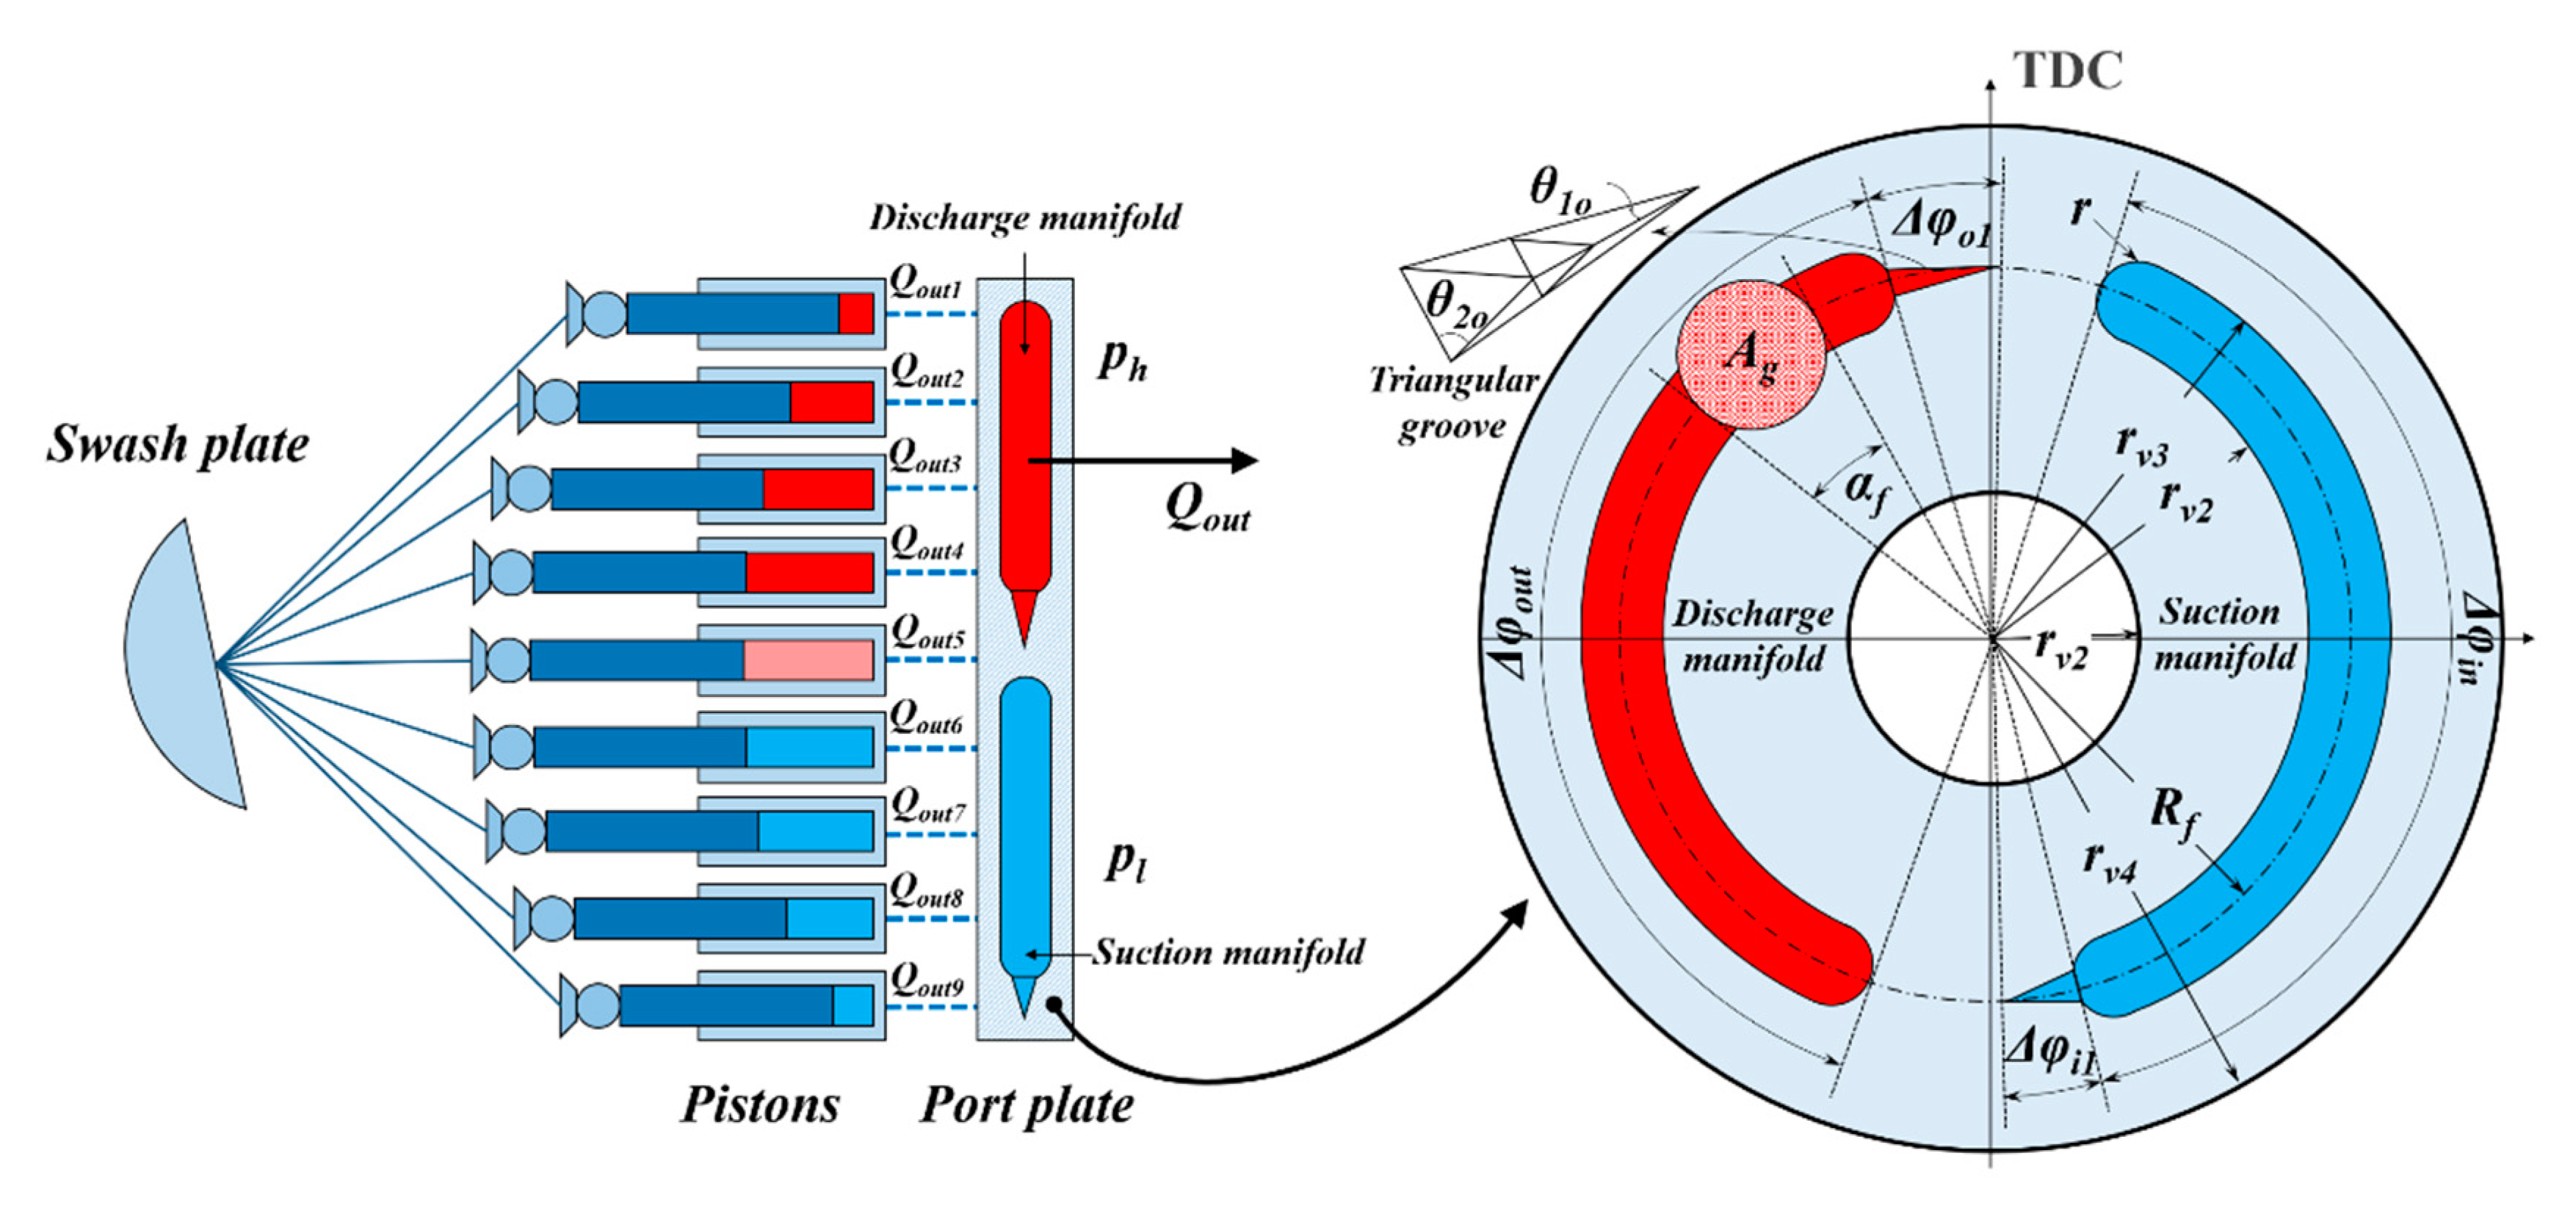
The schematic diagram of the piston chamber is shown in Figure 1. When the rotor is driven by the main shaft, the piston reciprocates in the piston chamber.
The theoretical output flow of the piston chamber is expressed as:
Q out = Q l p Q h p Q l Q m ,
where Qlp and Qhp are the flow rates between the piston chamber and the inlet and outlet, respectively, Ql is the leakage and Qm is the inertia flow rate of the oil.
The leakage from the valve plate and piston chamber is a thin-walled orifice. In this case, the leakage flow between the piston chamber and the inlet and outlet is turbulent, Qlp and Qhp are calculated flows through simple throttle orifice, which are expressed as [13,20]:
{ Q l p = C r A l p 2 | p f p l | ρ s i g n ( p f p l ) Q h p = C r A h p 2 | p f p h | ρ s i g n ( p h p f ) ,
where Cr is the flow coefficient, pf is the pressure of piston chamber, pl and ph are the pressure at the inlet and outlet, ρ is the density of the oil, and Alp and Ahp are the throttling areas between the piston chamber and the inlet and outlet.
Leakage includes piston/cylinder pairs, slipper/swash plate pairs, spherical piston/slipper pairs and cylinder/valve plate pair leakage, and the numerical models of leakage through the clearances have been studied by researchers. The classical equations of leakages are used in this study [7].
Q l = Q l p c Q l s s Q l s p s Q l v c ,
where Ql-pc is the leakage through the piston/cylinder pair, Ql−ss is the leakage through the slipper/swash-plate pair, Ql−sps is the leakage through the spherical piston/slipper pair, Ql−vc is the leakage through the cylinder/valve-plate pair.
Leakage between two friction pairs is expressed as:
Q = π d δ 3 12 u l Δ p ,
where δ is the clearance between two friction pairs, l is the generalized sealing length of the oil film, d is the cylindrical diameter. As for the friction pairs of axial piston pump, the leakage flow between the piston and piston chamber is an oil film with annular-shaped. For the leakage between the valve plate and the piston chamber, the leakage between the slipper and the swash plate, the leakage between spherical piston/slipper, the sealing length is expressed as:
l = d δ 3 r 1 r 2 d r r 12 0 δ y ( y h ) d y ,
In this case, the leakage of different friction pairs is expressed as
{ Q l p c = π D c h p 3 ( p f p c a s e ) 12 μ l p Q l s p s = π h s p 3 ( p f p c a s e ) 6 μ [ ln ( tan ( δ 2 2 ) ) ln ( tan ( δ 1 2 ) ) ] Q l s s = π D d 4 h s s 3 ( p f p c a s e ) μ [ 6 D d 4 ( ln r 2 ln r 1 ) + 128 h s s 3 l d ] Q l v c = α f h v c 3 12 μ [ 1 ln r v 2 ln r v 1 + 1 ln r v 4 ln r v 3 ] ( p f p c a s e ) ,
where μ is the dynamic viscosity of the oil, Dc is the diameter of the piston chamber, hp is the clearance between piston and chamber, pcase is the case pressure, pf is the pressure of piston chamber, lp is the contact length, hsp is the clearance between the spherical piston and slipper, δ1 and δ2 are the maximum and minimum angle of sphere position, Dd is the diameter of the pressure hole in slipper, hss is the clearance between the slipper and swash plate, r1 is the inner radius of the slipper, r2 is outer radius of the slipper, ld is the length of the center hole on the slipper, hvc is the clearance between the valve plate and rotor, rv1 is the inner radius of the inner plate, rv2 is the outer radius of the inner plate, rv3 is the inner radius of the outer plate, and rv4 is the outer radius of the outer plate and αf is the envelope angle of piston chamber.
The volume of oil in the piston chamber is expressed as:
V f = V 0 + π 4 D c R f tan β cos ( ω t ) ,
where Vf is the oil volume of the piston chamber, V0 is the fluid volume at the bottom dead center, Rf is the pitch radius of piston chamber, ω is the angular velocity of the pump and β is the swash plate angle. For the fixed-displacement pump, the swash plate angle β is constant.
The inertia flow caused by the pressure difference at the end of the relief groove is expressed as [20]:
d Q m d t = ( p c a s e p f ρ Q m 2 2 C r 2 A t 2 ) x 1 x 2 1 A g d x ,
where At is the flow area of the relief groove, x1 and x2 are the overlap line positions of the port plate, and Ag is the instantaneous cross section of the relief groove.
The flow rate of the nine-piston pump is the sum of all piston chambers, and the phase difference between each piston is under consideration.
Q P U M P = i = 1 9 Q o u t i ( φ i ) ,
where QPUMP is the total flow rate of the whole pump, Qouti is the flow rate of each piston, i is the number of the piston (in this paper, the maximum value of i is 9), φi is the phase angle of each piston.
The scheme of the simulation model is shown in Figure 2.
The pressure in the piston chamber is calculated based on certain operating conditions of the pump, and then the flow rates of a single piston chamber is calculated using Formula (2). Finally, the flow of the pump is calculated using Formula (9). The simulation model is modeled by MATLAB/Simulink, and the accuracy and reliability of the models are discussed in Section 3. Effects on the depth angle (θ1o) and width angle (θ2o) are studied by the flow under different groove structures, and the results are discussed in Section 3.

3. Validation Tests

In this section, an axial piston pump of a specific type (L11V71) was tested to verify the accuracy and reliability of the established pump model, the pressure and flow dynamics were measured by the secondary source method [16]. For the validation tests apply in this section, the structure parameters of the triangular damping groove, such as depth angle and width angle (the parameters of the damping grooves are listed in Table 2, Section 4), are specific. The schematic diagram of the test system is shown in Figure 3. The test system applied an auxiliary pump, which is used to detect source impedance of the test pump. The rotating speed of the auxiliary pump is 1500 r/min, and the rotating speed of the test pump is 1300 r/min. The outlet pressure of the system is 20 MPa. A long-rigid pipe is connected to the outlet of the test pump. Five pressure transducers (MPM4861, Measuring range: 0~40 MPa, Sampling frequency: 9.73 kHz) are installed in the pipeline. The distance differences are 100 mm, 400 mm, 700 mm, 1400 mm, and 2100 mm. The pressure relief valves are used as safety valves. Further details are listed in Table 1.
Firstly, keep the ball valve open; the test pump and the auxiliary pump outlets are connected together. The pressure pulsation of the auxiliary pump is used to calculate the source impedance. According to the rotation speed of the pumps, the basic pulsation frequency of the auxiliary pump is 225 Hz, and the basic pulsation frequency of the test pump is 195 Hz. The source impedance of the test pump harmonics is calculated using a distributed parameter mathematical model. The pressure pulsations of the pressure sensor are calculated. The calculation method of flow ripples can be seen in our earlier studies [16].
The experimental and simulated pressure curves are shown in Figure 4. The experimental results are in good agreement with the simulation results, and the pressure calculation error is less than 0.7%. The pressure pulsation amplitude in experimental and simulation are 8.76% and 5.95%, respectively.
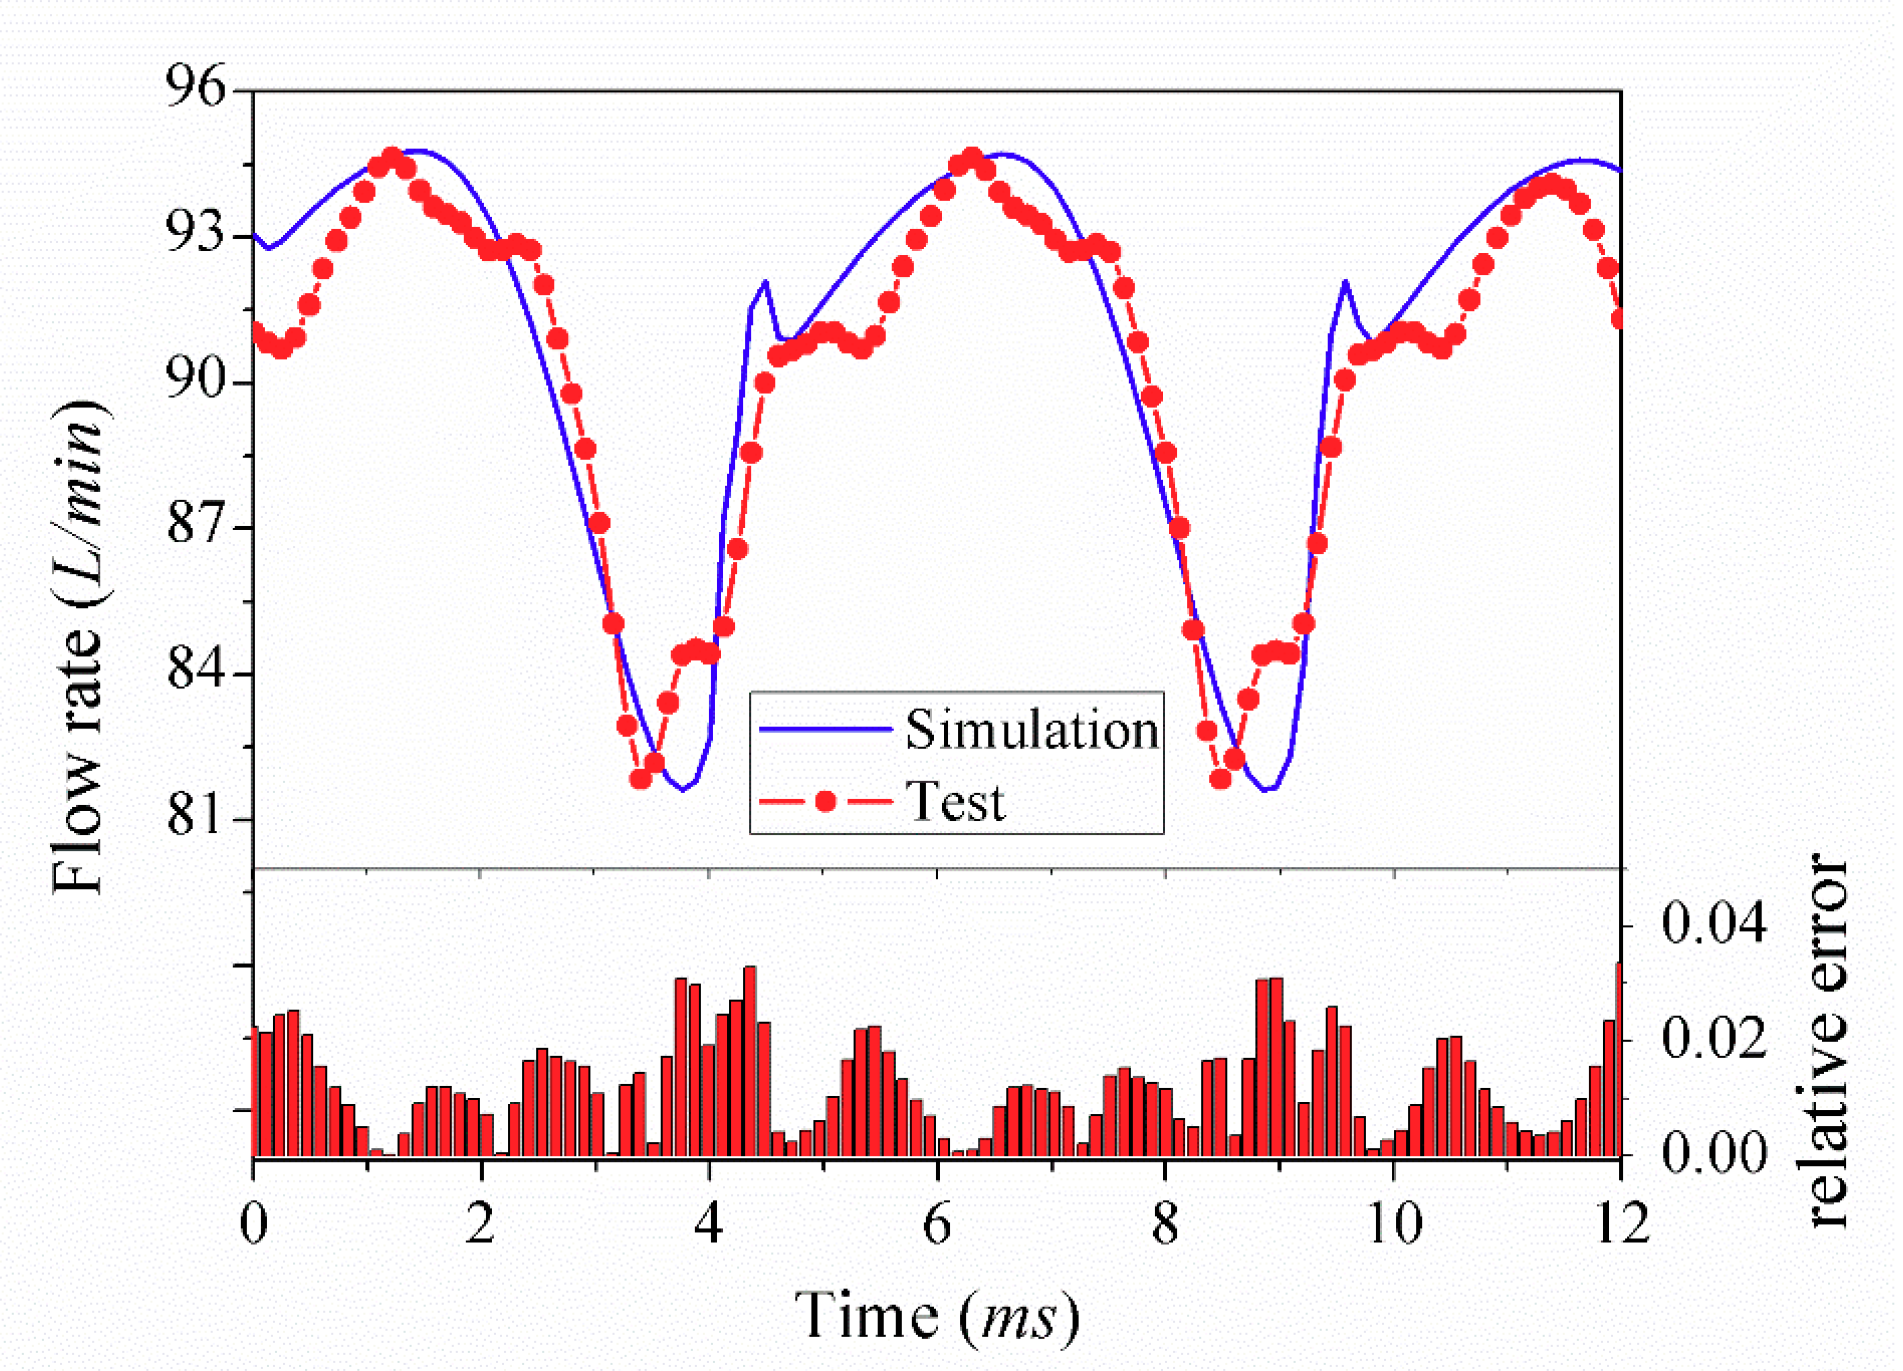
In addition, the experimental and simulated flow curves are shown in Figure 5. The relative error of the experimental and simulation results is less than 1.34%. The measured flow pulsation amplitude is 14.23%, and the simulated flow pulsation amplitude is 14.55%.
The comparison between the experiment and the simulation results proves that the proposed numerical model has certain accuracy. In Section 4, the output flow results under triangular grooves; different depth and width angle parameters are calculated by the proposed numerical model.

4. Effects of Depth Angle and Width Angle

4.1. Simulation Model Parameters

As Figure 2 shows, the valve plate includes a triangular groove at the front of the outlet manifold, which is the optimizing object in this section. Table 2 lists the details of the simulation model. The simulation model is coded by MATLAB’s m-function.
The simulation results are drawn in Figure 6 and Figure 7, in which parameters are based on the validated test pump. For the simulation model, the initial depth angle (θ1o) is 14° and the initial width angle (θ2o) is 60°. The pressure in the piston chamber, the outlet pressure, and the discharge flow are calculated.
The solid blue line in Figure 6 represents the change in pressure within the piston chamber, and the solid red line represents the outlet pressure. At point “A”, the piston chamber is located between the outlet and the inlet. As the piston passes the top dead center, the volume of the pressure chamber increases, and the pressure within the chamber decreases. When the piston chamber is connected to the triangular groove, the pressure in the chamber increases rapidly. At point “B”, the pressure in the piston chamber is equal to the outlet pressure. At point “C”, the piston chamber is separated from the outlet. However, as the piston moves, the remaining oil in the piston chamber are further compressed and the pressure in the piston chamber increases. Once the piston chamber is connected to the inlet, the chamber pressure is released (point “D”). However, the change rate of the chamber volume is smaller than the flow rate, so that the negative pressure is generated in the chamber. As can be seen from Figure 6, there are nine pressure ripples in a cycle of pressure change in the piston chamber. The pressure and flow rate changes between point “C” and point “D” are shown in Figure 7.
The solid red line is the curve of the discharge flow, and the solid blue line is the curve of the pressure in piston chamber. At point “H”, the flow curve reaches the minimum, and at point “G”, the flow curve reaches the local maximum. It happens during the period in which the piston chamber is switched from contact with the damping groove to contact with the outlet. At point “F”, the flow curve reaches a local minimum. At this moment, the piston chamber leaves the damping groove and fully in contact with the outlet. Besides, the pressure in the piston chamber starts to rise after the “G” point, and reaches the maximum “C”. The cause of the pressure rise is the volume change of the piston chamber. Since there are always 4 to 5 pistons in contact with the outlet. When the piston-1 is switching from contact with the damping groove to contact with the outlet. According to the structure diagram of the valve plate, there are three pistons that are in full contact with the outlet at this moment (piston-2, piston-3, piston-4). The contact angle of the piston-5 is 3°. When the piston-5 is completely separated from the outlet, there is a blocked cavity between the piston chamber and the valve plate. As the cavity is further compressed, the pressure in the cavity rises and reaches point “C” when the chamber is connected to the inlet.

4.2. Effects of the Width Angle on Output Flow

To study the effects of the width angle, the envelope angle Δφo1 remains unchanged in this section (Δφo1 = 21°) firstly. Besides, the depth angle θ1o is 14° in this section. The pump outlet flows at different width angles are calculated. As shown in Figure 8, the discharge flow rate under width angles of 50°, 60°, and 70° are calculated, respectively. As the curves show, the local maximum point (point “G” in Figure 7) increases as the width angle increasing, and the minimum point (point “H” in Figure 7) decreases as the width angle increasing. According to the structure of triangular damping groove, the local maximum point happens at the transition period between damping and outlet port. Because of the sudden increase of the flow area, the high-pressured oil is pumped into the damping groove, which causes a flow backward. While, with the decrease of width angle, the flow area is decreased. In this case, the backward flow is decreased, and the local flow peaks in Figure 8A could be decreased. As Figure 8 shows, the smaller width angle has a better flow dynamic characteristic.

4.3. Effects of the Depth Angle on Output Flow

Next, the width angle is maintained at 50° in this section, and the flow curves are drawn in Figure 9. The flow results at the depth angles of 10°, 14°, and 18° are drawn. Compared with Figure 8, the trend of the flow curve is the same as the effect of the width angle. We are aware that the nature of changing the width and depth angles is to change the flow area of the triangular groove. The local maximum point (point “G” in Figure 7) increases as the depth angle increases, and the minimum point (point “H” in Figure 7) decreases as the depth angle increases. While the depth angle is less than 10°, there is a sharp undershoot peak at the valley of the flow curve (Figure 9B). As the solid black line in Figure 9 shows, the local maximum “G” almost disappeared, which is beneficial for reducing flow ripples. However, the sharp undershoot peak at “H” can weaken the discharge dynamics, which should be avoided. Therefore, in the optimization process based on the premise of reducing the flow ripples, it is necessary to weigh the balance between reducing the local maximum point “G” and raising the minimum point “H”.
As can be observed in Figure 8 and Figure 9, the local maximum and minimum values are the main changes of the output flow. To evaluate the change of the output flow, the first derivative of flow versus time is calculated. As Figure 10 shows, the curves of q’ under different width angles and depth angles are drawn. The minimum flow corresponds to the “I” point at the curve of q’, and the local maximum flow corresponds to the “K” point at the curve of q’.

4.4. Variations of Flow Discordance

It can be found that the decrease of width angle can reduce the flow peak at the beginning of the discharge period. Besides, the point “M” in Figure 10b indicates that there is a sudden change in the valley of the flow curve. To optimize the groove structure, the flow results and the first derivative of flow are used as the basic data. The aim of the optimization is to decrease the flow peak at the beginning of the discharge period (point “G” in Figure 7), and increase the minimum value of discharge flow (point “H” in Figure 7). Otherwise, the sudden change like the lower peak in Figure 9B should be avoided. The optimizing method is discussed in the next section.

5. Optimization

In Section 4, the discharge flow rate and flow discordance are calculated. Results of flow discordance show that the flow ripples could cause a sudden peak (as point “L” in Figure 10). Regarding discharge flow rate as a time series function. The time domain characteristics of the discharge flow are calculated, such as the variance, the median absolute deviation, and other higher-order statistics. According to the characteristics of statistical features, the higher-order statistics, such as kurtosis and skewness, are much sensitive than the mean value and variance value on identifying local maximum point (point “G” in Figure 7). In this paper, when the depth angle is smaller than 10.5° or the width angle is smaller than 44°, the value “M” (in Figure 10) of q’ appears at the peak, which means that there has a sudden change at end of the suction period. The variance of the flow is sensitive to the amplitude changes, which are used to identify change of flow peak at the beginning of the discharge period. The median absolute deviation of flow is sensitive to the variation of width angle. The kurtosis of the flow is sensitive to the variation of depth angle. The skewness of q’ is sensitive to the sudden change in the flow. Variations of those time domain characteristics are drawn in Figure 11.
The optimizing index is expressed as:
E = X v a r + X k u r t o s i s + X s k e w n e s s + X m i d d l e 4 ,
{ X v a r = n = 1 N ( X ( n ) X m ) 2 N 1 X k u r t o s i s = n = 1 N ( X ( n ) X m ) 4 ( N 1 ) X s t d 4 X s k e w n e s s = n = 1 N ( X ( n ) X m ) 3 ( N 1 ) X s t d 3 X m i d d l e = n = 1 N ( X ( n ) X m ) N ,
where Xvar is the pulsation of flow rate, Xskewness is the skewness index of flow rate, Xmiddle is the absolute error of median, Xkurtosis is the kurtosis index of flow rate, X(n) is the discrete curve, N is the number of the sampling points, Xm is the mean of the flow rate, Xstd is the mean of the flow rate.
The optimizing index E is proposed as the weighted mean value of Xvar, Xkurtosis, Xskewness and Xmiddle. In this paper, the weight of each parameter is 1/4 respectively. To avoid dimensionless impact between indicators, the feature value should be normalized to [0, 1]. The width angle and depth angle are ranged from 0 to 90° and 0 to 29° respectively. The results of the optimizing index are drawn in Figure 12. As shown in Figure 12, while the depth angle is up to 30° or as low as 0°, the optimizing index E is large, and the discharge flow has a large ripple. Therefore, to obtain the minimum flow ripple, the optimizing index E should be minimized. The variations of E displayed as a reversed saddle-shaped plate. As the definition of E, in order to get the best optimized structure, the optimized E should be the minimum. Using the gradient descent method to calculate the minimum value of E, which is listed in Table 3.
Table 3 lists the comparison of the optimized structure and the initial structure, and the comparison curves are shown in Figure 13.
The amplitude of flow ripple is reduced from 14.60% to 9.78%. Besides, the backflow at the beginning of the discharge period is decreased effectively.

6. Conclusions and Further Studies

Herein, a multi-parameter structure optimizing method for the triangular damping groove of the axial piston pump is proposed.
Firstly, the theoretical models of the nine-piston pump are proposed to study the effects of triangular damping groove on outlet flow dynamics. The leakage flow, the inertial flow, and the reverse flow are calculated. The simulation results and experimental results are verified, in which good agreement is demonstrated as well as the high accuracy of the simulation. Next, the effects of the width angle and depth angle on flow dynamics are analyzed. The results indicate that as the width and depth angles increase, the minimum of the flow is decreased owing to the blocked volume of the piston chamber. The structure optimizing index based on the time domain characteristics of the discharge flow rate is proposed. The variance, the absolute error, the kurtosis of the flow results, and the skewness of the discharge flow rate are calculated to from the optimizing index. The optimized structure is figured out and decreases flow ripple from 14.60% to 9.78%. Besides, the backflow at the beginning of the discharge period is decreased, and the sudden break is effectively decreased.
This work proposed a structure optimizing method of triangular damping groove of the outlet port on the valve plate, which considers effects of multi-parameters of discharge flow rate. The validated numerical models of the axial piston pump are applied to calculate discharge flow rate of a specific pump type, which is much more efficient and convenient comparing with the traditional optimizing method through practical experiments.
In this paper, the numerical models are based on the specific type of L11V71. However, the validation tests of the optimized structure haven not been discussed in this paper due to the limitation of the test conditions. For further study, the validation tests of the optimized structure are our principal work. Additionally, the generalization properties of the proposed numerical model should be expanded to other types of pumps.

Author Contributions

Conceptualization, H.H. and H.Y.; methodology, H.H.; software, H.H. and C.Z.; validation, H.H., C.Z., and D.B.; investigation, C.Z. and H.H.; data curation, H.H. and C.Z.; writing—original draft preparation, H.H. and C.Z.; writing—review and editing, H.H., B.Z., D.B., and H.Y. All authors have read and agreed to the published version of the manuscript.

Funding

This research was supported by the National Key Research and Development Project (No. 2020YFB2007100).

Conflicts of Interest

The authors declare no conflict of interest.

Nomenclature

The nomenclature of the paper is shown below:
AgInstantaneous cross section of the relief groove (mm2)
AhpThrottle areas between piston chamber and outlet (mm2)
AlpThrottle areas between piston chamber and inlet (mm2)
AtFlow area of the relief groove (mm2)
CrFlow coefficient
DcDiameter of the piston chamber (mm)
DdDiameter of the pressure hole on slipper (mm)
hpClearance between piston and chamber (μm)
hspClearance between spherical piston and slipper (μm)
hssClearance between the slipper and swash plate (μm)
lpContact length of the piston and chamber (mm)
KeBulk modulus of the hydraulic oil (Pa)
pcasePressure in case (MPa)
phOutlet pressure (MPa)
plInlet pressure (MPa)
pfPressure in the piston chamber (MPa)
QhpFlow rate between piston chamber outlet ports (L/min)
QlpFlow rate between piston chamber and inlet (L/min)
QlLeakage flow rate (L/min)
Ql−pcLeakage across the piston/cylinder pair (L/min)
Ql−ssLeakage across the slipper/swash-plate pair (L/min)
Ql−spsLeakage across spherical piston/slipper pair (L/min)
Ql−vcLeakage across the cylinder/valve-plate pair (L/min)
QmInertia flow rate of the oil (L/min)
QoutTheoretical flow rate of the piston chamber (L/min)
RfPitch radius of piston chamber (mm)
rv1Inner radius of the inner plate (mm)
rv2Outer radius of the inner plate (mm)
rv3Inner radius of the outer plate (mm)
rv4Outer radius of the outer plate (mm)
V0fluid volume at the bottom dead center (mm3)
VfFluid volume of the piston chamber (mm3)
αfEnvelope angle of piston chamber (°)
βSwash-plate angle (°)
φiPhase angle of each piston (°)
ρDensity of the oil (kg/m3)
μDynamic viscosity of the fluid (kg/ms)
ωAngular velocity of the pump (rad/s)

References

  1. Yamaguchi, A. Studies on the Characteristics of Axial Plunger Pumps and Motors: 1st Report, Effects of Trapping Phenomena on the Characteristics. Bull. JSME 1966, 9, 305–313. [Google Scholar] [CrossRef]
  2. Yamaguchi, A. Motion of the Piston in Piston Pumps and Motors. (Experiments and Theoretical Discussion). Int. J. Ser. B Fluids Therm. Eng. 1994, 37, 83–88. [Google Scholar] [CrossRef] [Green Version]
  3. Edge, K.A.; Darling, J. The Pumping Dynamics of Swash Plate Piston Pumps. J. Dyn. Syst. Meas. Control 1989, 111, 307–312. [Google Scholar] [CrossRef]
  4. Maring, N. The Discharge Flow Ripple of an Axial-Piston Swash Plate Type Hydrostatic Pump. J. Dyn. Syst. Meas. Control 1998, 122, 263–268. [Google Scholar] [CrossRef]
  5. Ma, J.E.; Fang, Y.T.; Xu, B.; Yang, H.Y. Optimization of cross angle based on the pumping dynamics model. J. Zhejiang Univ. Sci. A 2010, 11, 181–190. [Google Scholar] [CrossRef]
  6. Bergada, J.M.; Watton, J.; Haynes, J.M.; Davies, D.L. The hydrostatic/hydrodynamic behaviour of an axial-piston pump slipper with multiple lands. Meccanica 2010, 45, 585–602. [Google Scholar] [CrossRef] [Green Version]
  7. Bergada, J.M.; Kumar, S.; Davies, D.L.; Watton, J. A complete analysis of axial-piston pump leakage and output flow ripples. Appl. Math. Model. 2012, 36, 1731–1751. [Google Scholar] [CrossRef]
  8. Xu, B.; Sun, Y.H.; Zhang, J.H.; Sun, T.; Mao, Z.B. A new design method for the transition region of the valve plate for an axial-piston pump. J. Zhejiang Univ. Sci. A Appl. Phys. Eng. 2015, 16, 229–240. [Google Scholar] [CrossRef]
  9. Yin, F.L.; Nie, S.L.; Xiao, S.H.; Hou, W. Numerical and experimental study of cavitation performance in sea water hydraulic axial-piston pump. Proc. Inst. Mech. Eng. Part I J. Syst. Control Eng. 2016, 230, 716–735. [Google Scholar] [CrossRef]
  10. Lijian, S.; Jun, Z.; Fangping, T.; Chuan, W. Multi-Disciplinary Optimization Design of Axial-Flow Pump Impellers Based on the Approximation Model. Energies 2020, 13, 1–19. [Google Scholar]
  11. Mandal, N.P.; Saha, R.; Sanyal, D. Theoretical simulation of ripples for different leading-side groove volumes on manifolds in fixed-displacement axial-piston pump. Proc. Inst. Mech. Eng. Part I J. Syst. Control Eng. 2008, 222, 557–570. [Google Scholar] [CrossRef]
  12. Mandal, N.P.; Saha, R.; Sanyal, D. Effects of flow inertia modelling and valve-plate geometry on swash-plate axialpiston pump performance. Proc. Inst. Mech. Eng. Part I J. Syst. Control Eng. 2011, 226, 451–466. [Google Scholar]
  13. Xu, B.; Ye, S.G.; Zhang, J.H.; Zhang, C. Flow ripple reduction of an axial-piston pump by a combination of cross-angle and pressure relief grooves: Analysis and optimization. J. Mech. Sci. Technol. 2016, 30, 2531–2545. [Google Scholar] [CrossRef]
  14. Wieczorek, U.; Ivantysynova, M. Computer aided optimization of bearing and sealing gaps in hydrostatic machines—The simulation tool Caspar. Int. J. Fluid Power 2002, 3, 7–20. [Google Scholar] [CrossRef]
  15. Jaroslav, I.; Ivantysynova, M. Hydrostatic Pumps and Motors: Principle, Design, Performance, Modeling, Analysis, Control and Testing; Akademia Books International: New Delhi, India, 2001. [Google Scholar]
  16. Ma, J.E. Study on Flow Ripple and Valve Plate Optimization of Axial Piston Pump. Ph.D. Thesis, Zhejiang University, Zhejiang, China, 2009. [Google Scholar]
  17. Xinjie, Z.; Yanhui, C.; Zhijin, Z. Application of Virtual Prototype Technology in the Simulation and Analysis of Axial Piston Pump. Mach. Tool Hydraul. 2019, 47, 144–148. [Google Scholar]
  18. Pan, Y.; Li, Y.; Liang, D. The influence of dynamic swash plate vibration on outlet flow ripple in constant power variable-displacement piston pump. Proc. Inst. Mech. Eng. Part C J. Mech. Eng. Sci. 2019, 233, 095440621984037. [Google Scholar] [CrossRef]
  19. Song, L.; Chuan, W.; Longlong, G.; Lihui, L.; Baoren, L. Multi-objective Optimization Design Method for Valve Plate Structure of Micro Piston Pump. In Proceedings of the IEEE 8th International Conference on Fluid Power and Mechatronics (FPM), Wuhan, China, 10–13 April 2019; IEEE: New York, NY, USA, 2020. [Google Scholar]
  20. International Organization for Standardization. ISO 10767-1:1996, Hydraulic Fluid Power—Determination of Pressure Ripple Levels Generated in Systems and Components—Part1: Precision Method for Pumps; London British Standards Institution: London, UK, 1996. [Google Scholar]
Figure 1. The configuration of the single piston model.
Processes 08 01664 g001
Figure 2. Scheme of the simulation model.
Processes 08 01664 g002
Figure 3. Schematic diagram of the test system.
Processes 08 01664 g003
Figure 4. Comparison of pressure pulsation (p = 20 MPa, n = 1300 rpm).
Processes 08 01664 g004
Figure 5. Comparison of discharge flow rate (p = 20 MPa, n = 1300 rpm)
Processes 08 01664 g005
Figure 6. Simulation variations in the chamber pressure and outlet pressure.
Processes 08 01664 g006
Figure 7. Simulation variations in the pressure and flow rate.
Processes 08 01664 g007
Figure 8. Effects on discharge flow rate with different width angles.
Processes 08 01664 g008
Figure 9. The Figure shows the effects on discharge flow rate with different depth angles: (A) a local enlargement at A in the figure; (B) a local enlargement at B in the figure.
Processes 08 01664 g009
Figure 10. The Figure shows the variations of flow discordance: (a) flow discordance of varied width angles; (b) flow discordance of varied depth angles.
Processes 08 01664 g010
Figure 11. The Figure shows the variations of picked time domain features: (a) variations of variance; (b) variations of median absolute deviation; (c) variations of kurtosis; (d) variations of skewness.
Processes 08 01664 g011
Figure 12. The Figure shows the optimized results of the optimizing index.
Processes 08 01664 g012
Figure 13. Comparison of initial structure and optimized results.
Processes 08 01664 g013
Table 1. Details of the test hydraulic system.
DescriptionDetails
MotorRotation speed: 0~2900 rpm, Rated power: 160 kW
Test pumpRated pressure: 28 Mpa, Rated displacement: 71 cm3/r
Auxiliary pumpRated pressure: 28 Mpa, Rated displacement: 71 cm3/r
Throttle valveRated pressure: 35 MPa, Maximum flow: 375 L/min
Relief valveMaximum pressure 31.5 MPa
Rigid pipeWall thickness: 5 mm, Inner diameter: 25 mm
FlowmeterTurbine flowmeter, maximum flow rate 200 L/min
Ball valveMaximum pressure 31.5 MPa
Data Acquisition equipment (DAQ)National Instruments (NI)’s PCI-6229, sampling rate: 250 kS/s
Table 2. Parameters of the pump model.
ParametersValues
Rated displacement (Q0)71 cm3/r
Angle of the swash plate (β)17.23°
Diameter of the piston chamber (Dc)20 mm
Pitch radius of the cylinder block (Rf)40.5 mm
Width radius of the kidney port (r)8 mm
Thickness of friction pair (hp, hss, hsps, hvc)10 μm
Minimum volume of piston chamber (V0)2 mm3
Number of piston (Np)9
Flow coefficient (Cr)0.74
bulk modulus of the hydraulic oil (Ke)1.7 × 10⁹ Pa
rotation speed (n)1300 rpm
Oil density (ρ)876 kg/m3
Viscosity of oil (μ)0.048 kg/ms
Angle of the input kidney groove (Δφin)134°
Angle of the output kidney groove (Δφout)134°
Angle of piston chamber outlet (αf)29°
Envelope angle of triangular groove at inlet (Δφi1)21°
Depth angle of triangular groove at inlet (θ1i)5.5°
Width angle of triangular groove at inlet (θ2i)60°
Envelope angle of triangular groove at outlet (Δφo1)21°
Depth angle of triangular groove at outlet (θ1o)14°
Width angle of triangular groove at outlet (θ2o)60°
Table 3. Optimized solutions.
ParametersInitial StructureOptimized Structure
Width angle60°46.62°
Depth angle14°12.20°
Flow ripple14.60%9.78%
Publisher’s Note: MDPI stays neutral with regard to jurisdictional claims in published maps and institutional affiliations.

