Article

Application of a Modeling Tool to Describe Fly Ash Generation, Composition, and Melting Behavior in a Wheat Straw Fired Commercial Power Plant

1
Grupo de Reactores Químicos y Procesos para la Valorización de Recursos Renovables, Departamento de Ciencias, Edificio de los Acebos, Universidad Pública de Navarra, Campus de Arrosadía s/n, 31006 Pamplona, Spain
2
National Renewable Energy Centre (CENER), C/Ciudad de la Innovación 7, 31621 Sarriguren, Navarra, Spain
3
Institute for Advanced Materials and Mathematics (InaMat2), Universidad Pública de Navarra, Campus de Arrosadía, 31006 Pamplona, Spain
*
Author to whom correspondence should be addressed.
Processes 2020, 8(11), 1510; https://doi.org/10.3390/pr8111510
Submission received: 15 September 2020 / Revised: 13 November 2020 / Accepted: 18 November 2020 / Published: 20 November 2020
(This article belongs to the Special Issue Progress in Thermochemical Conversion of Solid Fuels)

Abstract

:
Ash behavior is a key operational aspect of industrial-scale power generation by means of biomass combustion. In this work, FactSageTM 6.4 software was used to develop and assess three models of wheat straw combustion in a vibrating grate-fired commercial boiler of 16 MWth, aiming to describe the inorganic elements release as well as fly ash melting behavior and composition. Simulations were carried out solving four consecutive calculation stages corresponding to the main plant sections. Chemical fractionation was adopted in order to distinguish between reactive, inert and partially reactive biomass fractions. The developed models allow take into account different levels of partial reactivity, values of the temperature for each sub-stage on the grate, and ways to apply entrained streams based on data from the elemental analyses of the fly ashes. To this end, two one-week experimental campaigns were conducted in the plant to carry out the sampling. It has been found that considering chemical fractionation is indispensable to describe the entrainment of solid particles in the gas stream. In addition, the best results are obtained by adopting a small reactivity (2%) of the inert fraction. As for fly ash composition, the concentrations of the major elements showed good agreement with the results from the chemical analyses. In the case of S and Cl, calculations revealed a match with gas cooling effects in the superheaters as well as an entrainment effect. The melting behavior together with the presence of KCl and K2SO4 condensates, point out at possible corrosion phenomena in walls at temperatures of 700–750 °C.

1. Introduction

Combined heat and power (CHP) generation by biomass combustion constitutes an important share of the energy mix worldwide. Indeed, the most extended use of biomass, around 90%, is heat generation through its direct combustion. Forecasts for biomass exploitation in industrial CHP and tri-generation plants highlight the ever-increasing role of bioenergy in the energy system. As a result, the deployment of bioenergy in the European Union is expected to double by 2030 [1], whether by the substitution of fossil fuels or through new advanced biomass combustion plants.
Different biomass firing technologies are available, with varying installed capacities ranging from a few electric megawatts (MWe) to high-throughput plants of around 100 MWe or even higher. Amidst other possibilities, grate furnaces and fluidized beds are the prevalent technologies for large-scale power generation by biomass firing [2]. Of these, grate firing offers some advantages, including feedstock flexibility and less fuel preparation and handling requirements [3]. On the one hand, this is advantageous because operation is allowed with a wide variety of biomass fuels including wastes and low-cost materials such as forestry residues, peat, fast growth crops or straws. In particular, wheat straw combustion is of great interest in many agricultural regions owing to its abundance and to the possibility of obtaining new valuable byproducts [4]. On the other hand, the typical problems related to biomass combustion, namely ash deposition and corrosion may worsen by the characteristics of non-woody biomass fuels, which typically have high chlorine, alkali and alkali-earth metal contents together with some sulfur (S), which promote the formation of corrosive ash deposits and fouling [5,6]. It is therefore necessary to gain knowledge about the behavior of these materials during combustion in order to reduce operational problems such as corrosion and fouling in long-term operations at an industrial scale.
Several studies can be found in the literature dealing with non-woody biomass combustion at different scales [5,6,7,8,9,10]. Most of the studies concerning standalone biomass combustion focus either on laboratory and small pilot-scale plants or on fluidized bed technologies and their operational problems, especially de-fluidization. Some studies have focused on modeling the release of inorganic compounds by comparing the experimental data collected in lab-scale setups against the physicochemical characterization of biofuels and from the global analysis of the combustion process [11,12]. However, biomass combustion modeling on a large scale has been investigated in only a few works. Yin et al. modeled, by means of computational fluid dynamics (CFD), two large-scale grate-fired boilers using wheat straw such as fuel, and validated their results with onsite experimental data [13,14]. The objective was to develop a tool for diagnosis and optimization as well as for improving the design of grate boilers. Further CFD models were also developed and validated against data from the literature [15]. All these works focused on developing reliable models of the whole installations with special emphasis on the combustion process on the grate, and on the gaseous species.
As pointed out by Kaer et al. [16], efforts directed toward studying deposit formation in biomass firing in grate-based boilers are scarce. These authors developed a mechanistic deposit formation model based on information collected from ash deposits and operational parameters of the plant. Neither the deposition mass fluxes nor the deposits compositions could be accurately modeled, especially in the superheater area, though operational trends could be reasonably predicted. Other researchers modeled ash deposition and alkali sulfates formation, and implemented the models in a CFD code of a full-scale cotton straw firing grate [17]. The models could only qualitatively describe the actual behavior of ash deposition.
Works performed at the Technical University of Denmark (DTU) can be regarded as the state-of-the-art on modeling ash deposition at large-scale in biomass combustion plants. In Zhou et al., a dynamic mathematical model of ash deposit growth in a straw-fired grate boiler was developed and validated against data collected from a straw fired power plant of 105 thermal megawatts (MWth) [18]. The authors also studied shedding phenomena and heat transfer in ash deposits [19,20]. In other works [21,22,23], experimental measurements and characterization of ash deposits in full-scale grate and suspension wheat straw firing boilers were carried out. The effects of the operational parameters on the chemistry of ash and deposits, deposit build-up rates and shedding behavior were studied, though these works were not aimed at modeling ash formation and deposition.
The mechanisms of ash formation in biomass combustion have been widely investigated and excellent reviews can be found on this topic [24,25]. Most of the models reported in the literature try to describe the behavior of biomass in co-combustion with coal or in large-scale firing plants using non-woody biomass fuels with a lack of model validation. Therefore, there is still a lack of predictive tools that can accurately model the behavior and fate of ash-forming species through the different sections of full-scale biomass combustion plants, particularly those based on vibrating grate technologies.
Three different models were developed and evaluated through FactSageTM 6.4, aiming to describe the release of inorganic elements during wheat straw combustion, as well as fly ash melting behavior and composition downstream. The ultimate objective of the model is to describe the properties of the ash deposits generated in the process from the point of view of their fusibility to predict the slagging and fouling phenomena that could affect the operation of industrial boilers based on vibrating grate-fired technology.
Data from plant operation as well as wheat straw and ash samples were collected from onsite measurements in a commercial power plant (16 MWth) using vibrating grate technology. The effects of combustion temperature and biofuel composition on ash behavior were studied. Physicochemical characterization of the collected samples, with special emphasis on chemical composition, was conducted to understand the distribution of the inorganic compounds during combustion.

2. Materials and Methods

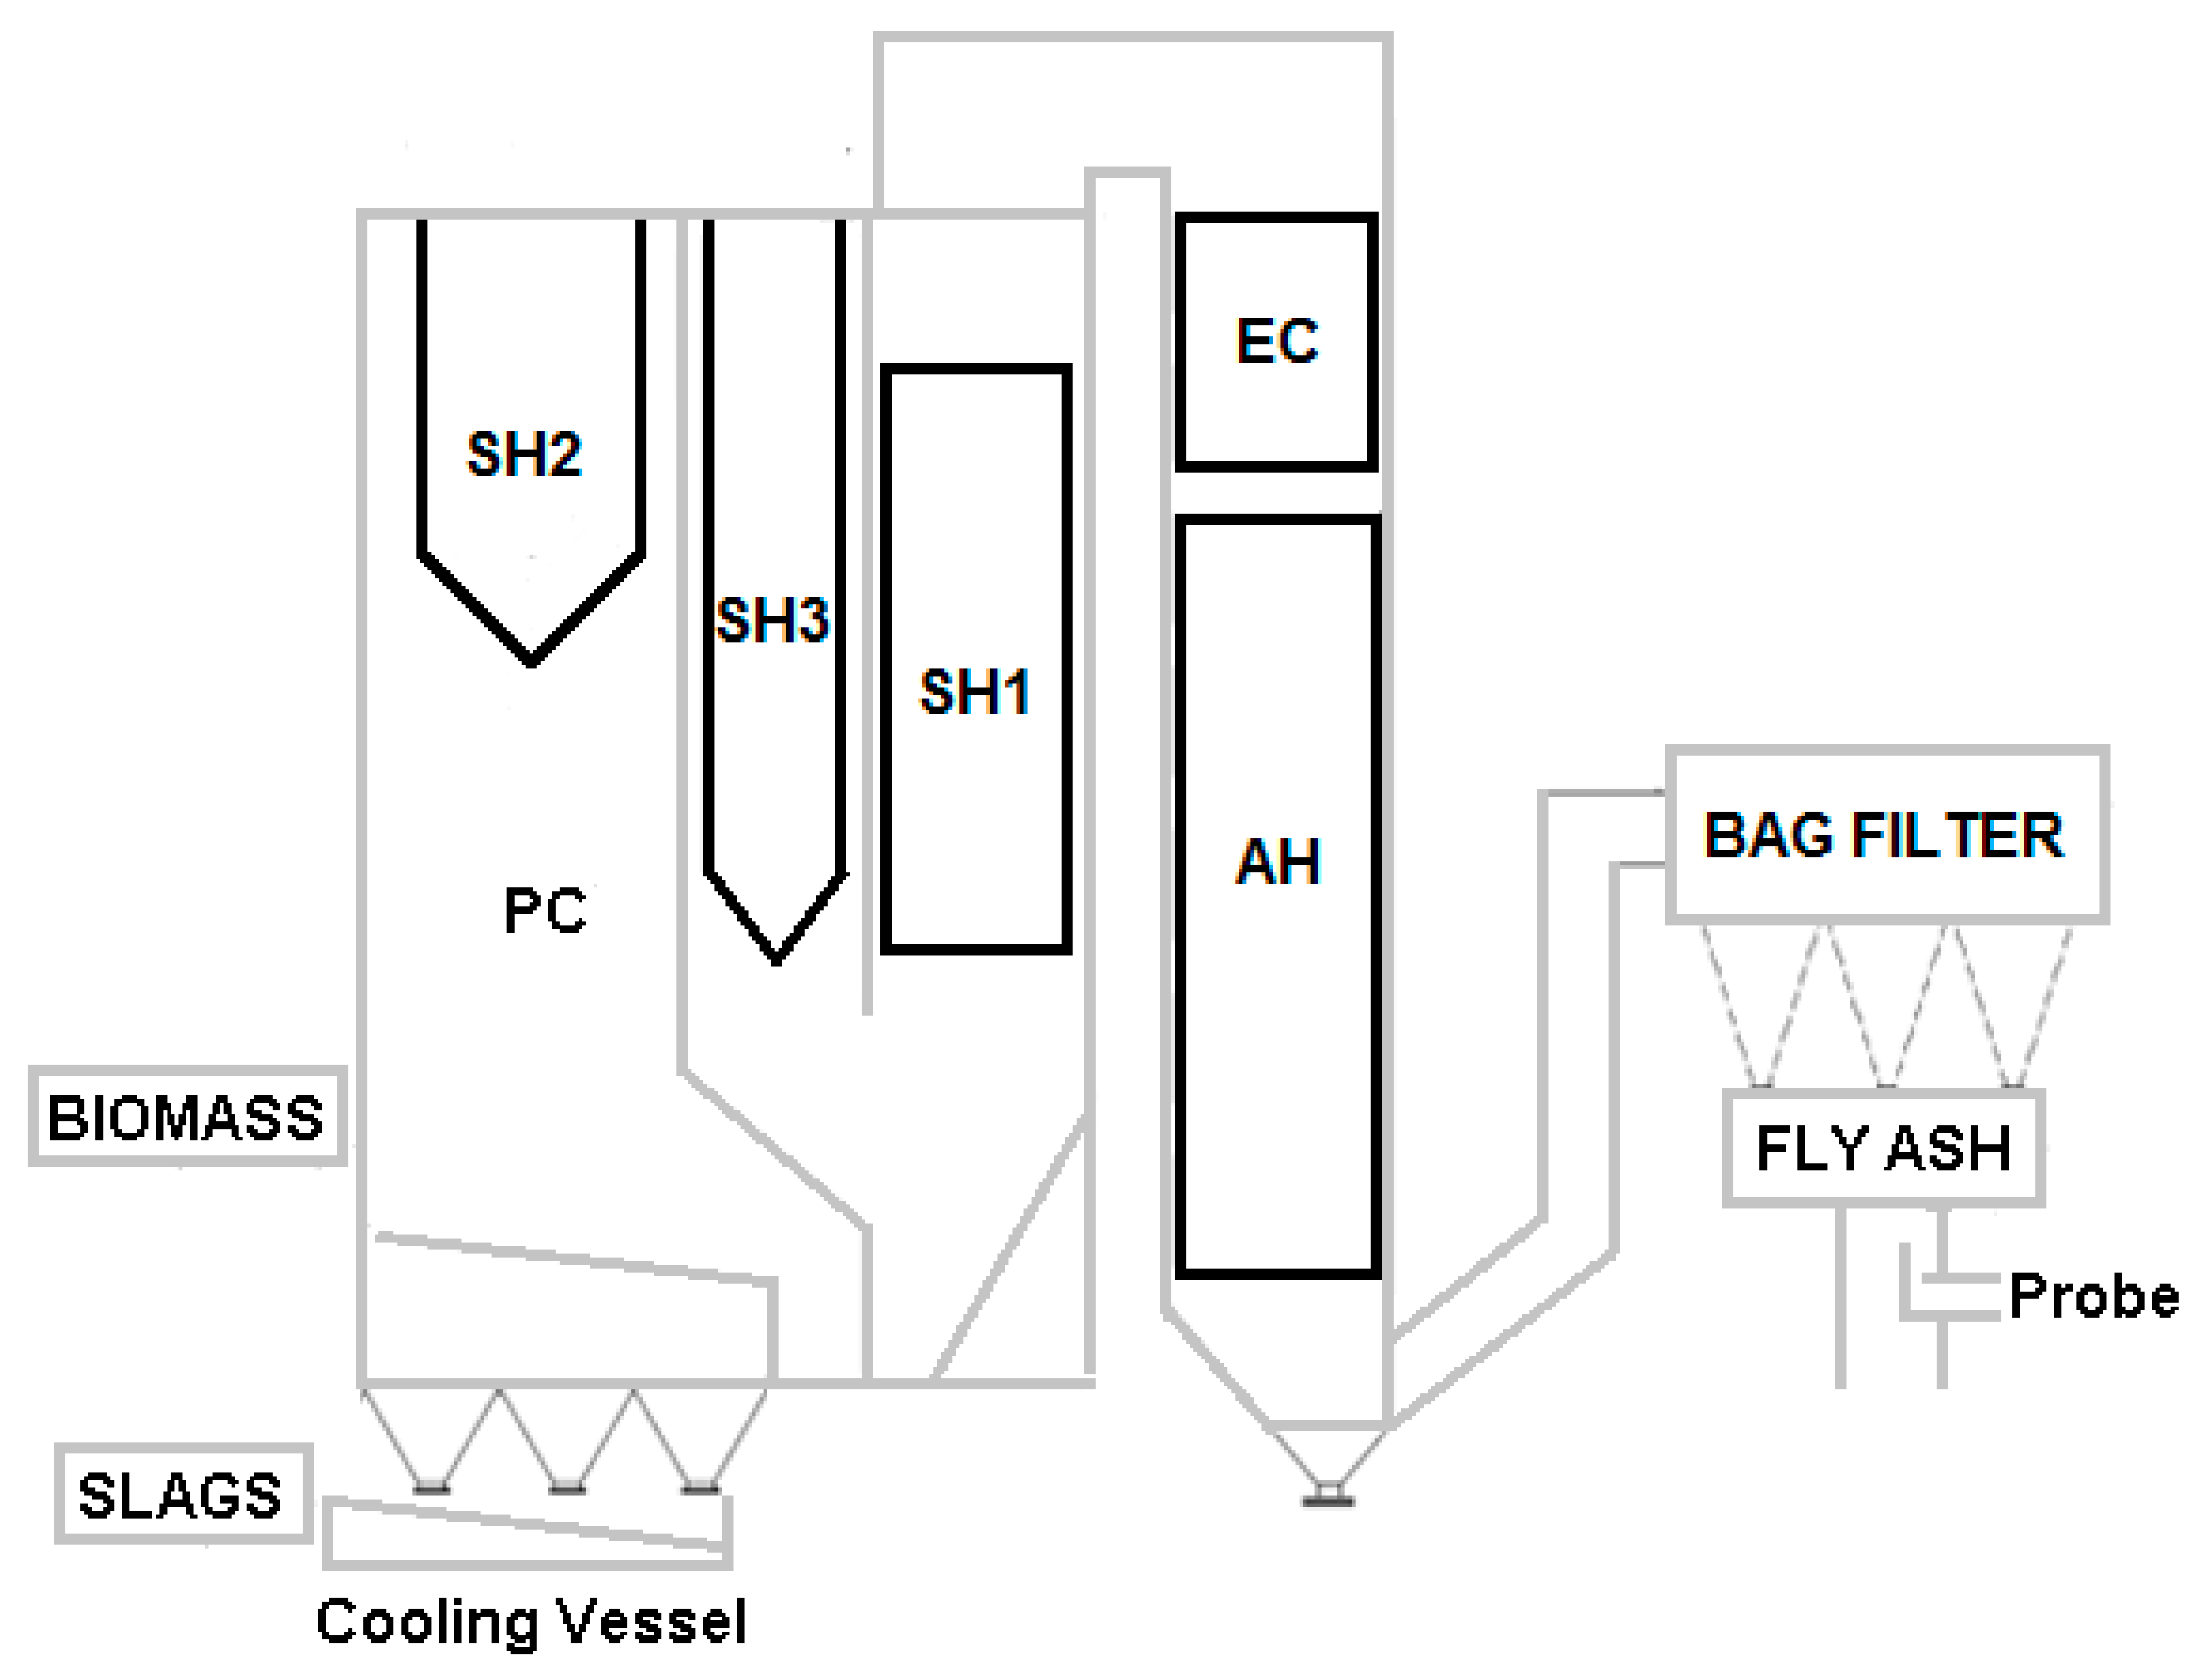
2.1. Plant Characteristics and Sampling Procedures

A two-week experimental campaign was performed to obtain the necessary information and to carry out the sampling. This campaign comprised two different steady-state 5-day non-stop test runs developed in the 16 MWth biomass firing power plant owned by Acciona Energía in Briviesca (Burgos, Spain). The setup configuration is based on the vibrating grate technology developed by the company Termisa. Wheat straw bales were used as fuel at an average mass feeding rate of 13,200 kg/h (wet basis). As can be seen in the schematic diagram of the plant (Figure 1), it has three heat exchangers: SH2, located over the firing grate after the post-combustion section (PC), as well as SH3 and SH1, both downstream from SH2. Next, the combustion gas flows through the economizer (EC), the air preheater (AH), and is led to the bag filter, where fly ashes are collected.
Based on the process diagram, the necessary parameters to describe the plant operation were identified. In addition, the sampling plan was designed by taking into account the access points for sample collection, the biomass feeding system, the slags and fly ash discharging systems and the corresponding mass flow rates. Slag discharge is continuously made after cooling in a water tank, which may lead to the dissolution of some components. As for the solid materials entrained along with ash particles and aerosols by the flue gas, they are all collected in the bag filter located right after the air preheater. This filter incorporates a discharge system by programmed backflush combined with an ash recollection probe that is composed of a stainless steel container attached to the discharge line of the bag filter.
Sampling was carried out following the EN 14,778 standard, which established the amounts needed to obtain representative samples. In this study, the minimum sample amounts required were 5 kg of biomass and 1 kg of ashes. Wheat straw sampling was conducted in the three ports available in the feeding lines, right after the shredders. Samples were collected in four different increments at 1 h intervals until 5 kg of samples were attained. In each of the recollection stints, mixing of 450 g of biomass from each of the operating feeding lines was done, thus representing a total amount of 1.3 kg per increment. Sampling was conducted in each of the lines alternatively, by taking one increment each 15 min. All the increments were subsequently mixed together to form a combined sample.
Slags coming from the firing grate were sampled at the entrance of the discharge container right after the cooling vessel. Samples were taken from the nearest point to the discharge ramp possible, on the basis of four increments within 1 h interval until final samples of 1 kg each were attained. In each of the increments, the sampling tool was used following the quartering method. All the increments were readily mixed together to form a single sample.
Fly ashes from the bag filter were collected by the combination of four increments taken within each 1 h interval to get a final sample mass of 1 kg. As in the case of the slags, the quartering method was observed for obtaining the sub-samples in each of the increments, ensued by the mixing up of all them. Sampling periods were programmed so as not to coincide with the bag filter shoot-blowing period, thus avoiding the recollection of adhered particles.
To successfully develop the thermochemical model, measurement of temperature profiles in the hearth of the installation and especially on the firing grate section is essential. Onsite data collection to establish the temperature profiles was carried out by means of a series of thermocouples distributed along the firing grate. Measurements were conducted during the first of the two assays of the experimental campaign. Biomass flow rates and moisture contents, as well as primary and secondary air-flow rates, were provided by Acciona Energía and are shown in Table 1. Test run 1 was completed at an air-to-fuel ratio (λ) of 1.5 and wheat straw bales having an average moisture content of 13.9%. Temperatures of the biomass bed located on the grate typically ranged between 1200 and 1300 °C, depending on the zone, which could reach a maximum range between 800 and 1300 °C. These values are concordant with those found in the literature for large-scale wheat straw combustion using a vibrating grate operating at λ = 1.3 [26]. As for test run 2, the temperature profiles were assumed to be the same, given that the values of the operational parameters (λ = 1.3 and biomass moisture content of 9.3%) were similar.
Acciona Energía kindly supplied also data on the temperature profiles, gas and tube temperatures in the heat exchangers section and on the gas outlet temperature measured during plant operation. These values ranged as follows:
  • Post combustion section (PC, see Figure 1): 900–1300 °C
  • SH2: 700–1150 °C
  • SH3: 700–900 °C
Furthermore, data corresponding to gas composition, temperature and fly ash flow rates in the last section of the installation (composed of the economizer, air preheater and bag filters) were also taken from the information supplied by the company. Other data necessary to develop the model comprise onsite measurements obtained during the experimental campaign as regards biomass feeding flow rates on a wet mass basis. For slags and fly ash production, since it is not possible to conduct onsite measurements, the annual average rates of 868 kg/h and 87 kg/h, respectively, were adopted as the values of the mass flow rates.

2.2. Samples Characterization

All samples were characterized following the protocols included in the EN 14588:2011 standard, together with additional characterization techniques, which include thermogravimetric analysis coupled with mass spectrometry (TGA-MS), differential thermal analysis (DTA) and chemical fractionation.
Biomass composition was determined by ultimate analysis through EN 16948:2015 standard assays. Moisture contents were determined following UNE-EN 14774-2:2009 standard, and lower heating values (LHV) of the biomass samples by means of the procedures established in the UNE-EN 14918:2011 standard. Ultimate analyses were conducted for the determination of the C, H, and N contents in the samples following UNE-EN 16948:2015 standard. The O content was calculated by the difference. The ash content of biomass was determined according to UNE-EN 14,775 standard. For S and Cl determination in biomass samples, the reference standard was UNE-EN 15289:2011.
The procedures established by CEN/TS 15,290 standard were adopted to establish the wheat straw, slags and fly ash major elements (Al, Ca, Fe, Mg, P, K, Si and Na) chemical composition, which included microwave-assisted acid digestion of the samples instead of biomass calcination at 550 °C; in this way, losses due to volatilization during calcination are avoided. As for the determination of the minor components in all ash samples, microwave-assisted acid digestion has been conducted following CEN/TS 15,297 standard.
In the case of slags and fly ash samples, S and Cl contents cannot be analyzed properly following biomass analysis standards because of the mineral nature of the matrices. Consequently, S contents were determined following the DIN 51724-3 standard (Solid mineral fuels. Determination of S), whereas Cl contents were obtained according to the DIN EN 196-2 standard (Method of testing Cement. Part 2: Chemical analysis of Cement). These methods involved high-temperature extraction in the case of S and nitric acid digestion to solubilize Cl.
The mass of each element present in slags and fly ashes was calculated per kg of biomass fed in on a wet basis with the following expression:
m a s s   o f   X / m a s s   o f   b i o m a s s   =   C X Q C ( 1 H 100 ) Q B
where CX is the average concentration of element X in the slags or in fly ash expressed in g/kg on a dry basis; QC is the average flow rate of slags or fly ash expressed in kg/h; H is the average moisture of biomass percentage measured for each test run; and QB is the average biomass feed rate in kg/h for each test (including the moisture content).
Chemical fractionation was only applied to biomass samples from Test 1. The procedure followed was that described by Teixeira et al. [27]. The different liquid fractions obtained were analyzed by means of ICP-OES for the quantitative analysis of major compounds, Cl and S.

3. Thermochemical Modeling and Simulation

The overall scheme of the model describing the combustion process taking place in the plant is shown in Figure 2. The simulation of the reactions of the combustion process is essentially based on solving four consecutive calculation stages identified as EQ1, EQ2, EQ3, and EQ4. These stages correspond to the main plant sections. EQ1 comprises the combustion of the solid fuel on the firing grate. The first stage is divided into three sub-stages, denoted as EQ1.1, EQ1.2, and EQ1.3 (EQ1.3.1 and EQ1.3.2), which correspond to the following processes: drying, pyrolysis (volatilization) and char combustion, respectively. The next stage, EQ2, corresponds to the post-combustion processes in which secondary air reacts with gases and vapors released from EQ1. Next, EQ3 corresponds to the heat exchangers section, and finally, EQ4 includes the bag filters section.
The model was formulated, assuming that only the reactive fraction of the biomass on the basis of the chemical fractionation of the fuel is involved in the processes comprising the first stage, whilst the non-reactive fraction is summed to the solid products obtained in sub-stages EQ1.2 and EQ1.3.
Primary air distribution was established by considering the dimensions, pass diameters and flow rate regulation. This results in the following distribution of the primary air between the three sub-stages: 4.9% (EQ1.1); 31.7% (EQ1.2); 63.4% (EQ1.3). It has also been assumed that the maximum temperature of stage EQ3 is a coincident with that of stage EQ2.
Regarding the calculations for determining fly ash flow rate and composition, due to the entrainment of solid particles in the gas stream, and considering the temperature of the filter during plant operation, all chemical species formed when the gas is cooled down (calculation stage EQ3) are compiled in EQ4. The amount of fly ashes, expressed as the g of solids in the flue gas per kg of biomass fed in, have been calculated considering the measured flow rates and the filter temperature (150 °C).
Next, the bases of calculus as well as the information that these models should provide and the validation methodology were established. Compositional data and flow rates for modeled fly ashes per kg of biomass fed in were compared against real data. Furthermore, solids fractions in the modeled downstream gas, the percentage of fused solid, the volatile (i.e., condensable) fraction, and the major chemical compounds are calculated. The outcomes are the ash melting fraction of the total solids present in the cooling gas, named from now on as the ash melting curve (AMC) for the predicted fly ash and the critical control parameters (T15 and T70 temperatures) [28,29]. Finally, a comparative analysis of the model results from those obtained from the chemical analysis of the process ash samples collected is performed. In addition, comparisons with results from previous models reported in the literature corresponding to full-scale combustion of wheat straw using firing grate technology have been made.
Chemical fractionation was adopted, aiming to reduce the discrepancies between predicted and empirical values derived from the kinetic limitations of the processes involved. These limitations are not accounted for by thermodynamic package included in the software tool used (FactSage™ 6.4), which are based on the minimization of the Gibbs’s free energy. Therefore, only the fraction regarded as reactive is used as input variable in the first step of the initial calculation sub-stage (EQ1.1). Fractions, which are water (AF) and ammonium acetate (NF) soluble, are considered reactive, whilst hydrochloric acid soluble fraction (HF) and the solid residue are considered inert, or just partially reactive. In this regard, the following cases were evaluated during the development of the model:
  • CF100: AF and NF fractions are fully reactive.
  • CF102: similar to CF100, but including a 2% of reactivity from the HF fraction and solid residue.
  • CF110: same as CF102, but increasing up to 10% the reactivity of the partially reactive fractions.
  • N°CF: no chemical fractionation considered; the biomass bulk composition is considered as input data.
The following predictive models were developed: the Global Entrainment (GE) model, Individual Entrainment (IE) model, and the Temperature Effect (TE) model. They differ from each other:
  • In the way that chemical fractionation is applied.
  • In the way that the temperatures of each sub-stage on the grate are calculated.
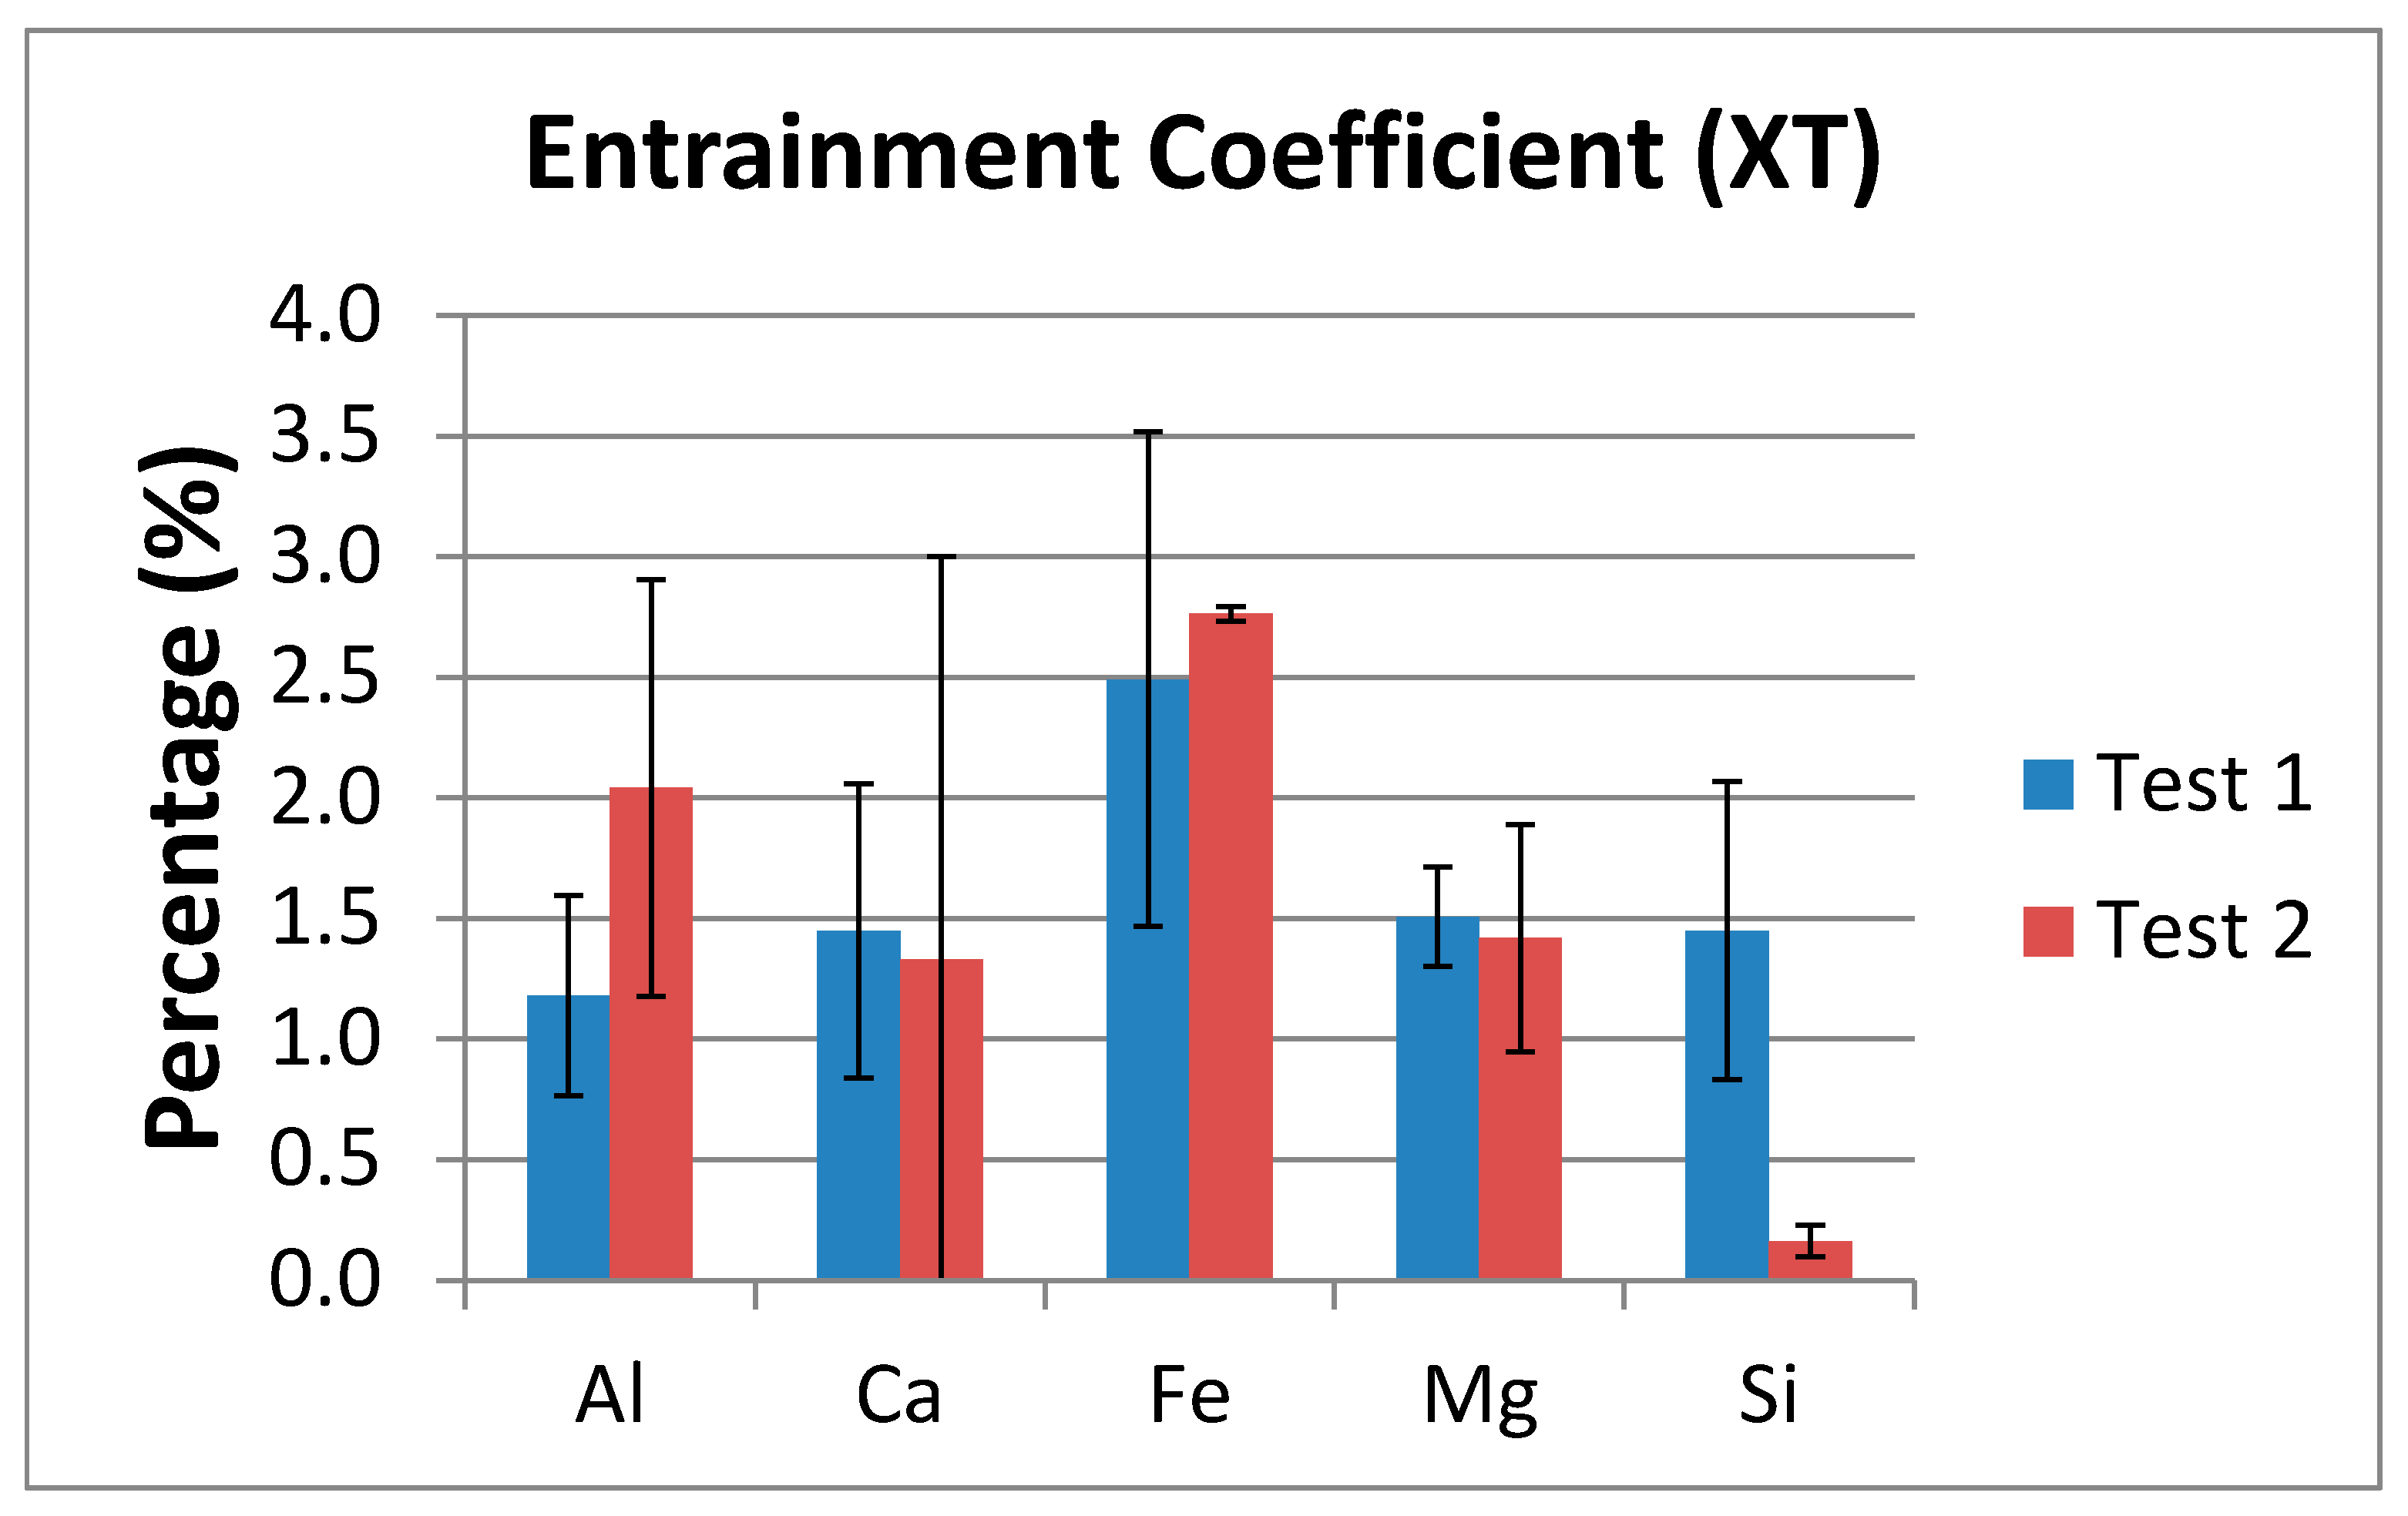
  • In the way that the entrained streams are applied based on data from the elemental analyses of the fly ashes.
However, all three models share the following conditions:
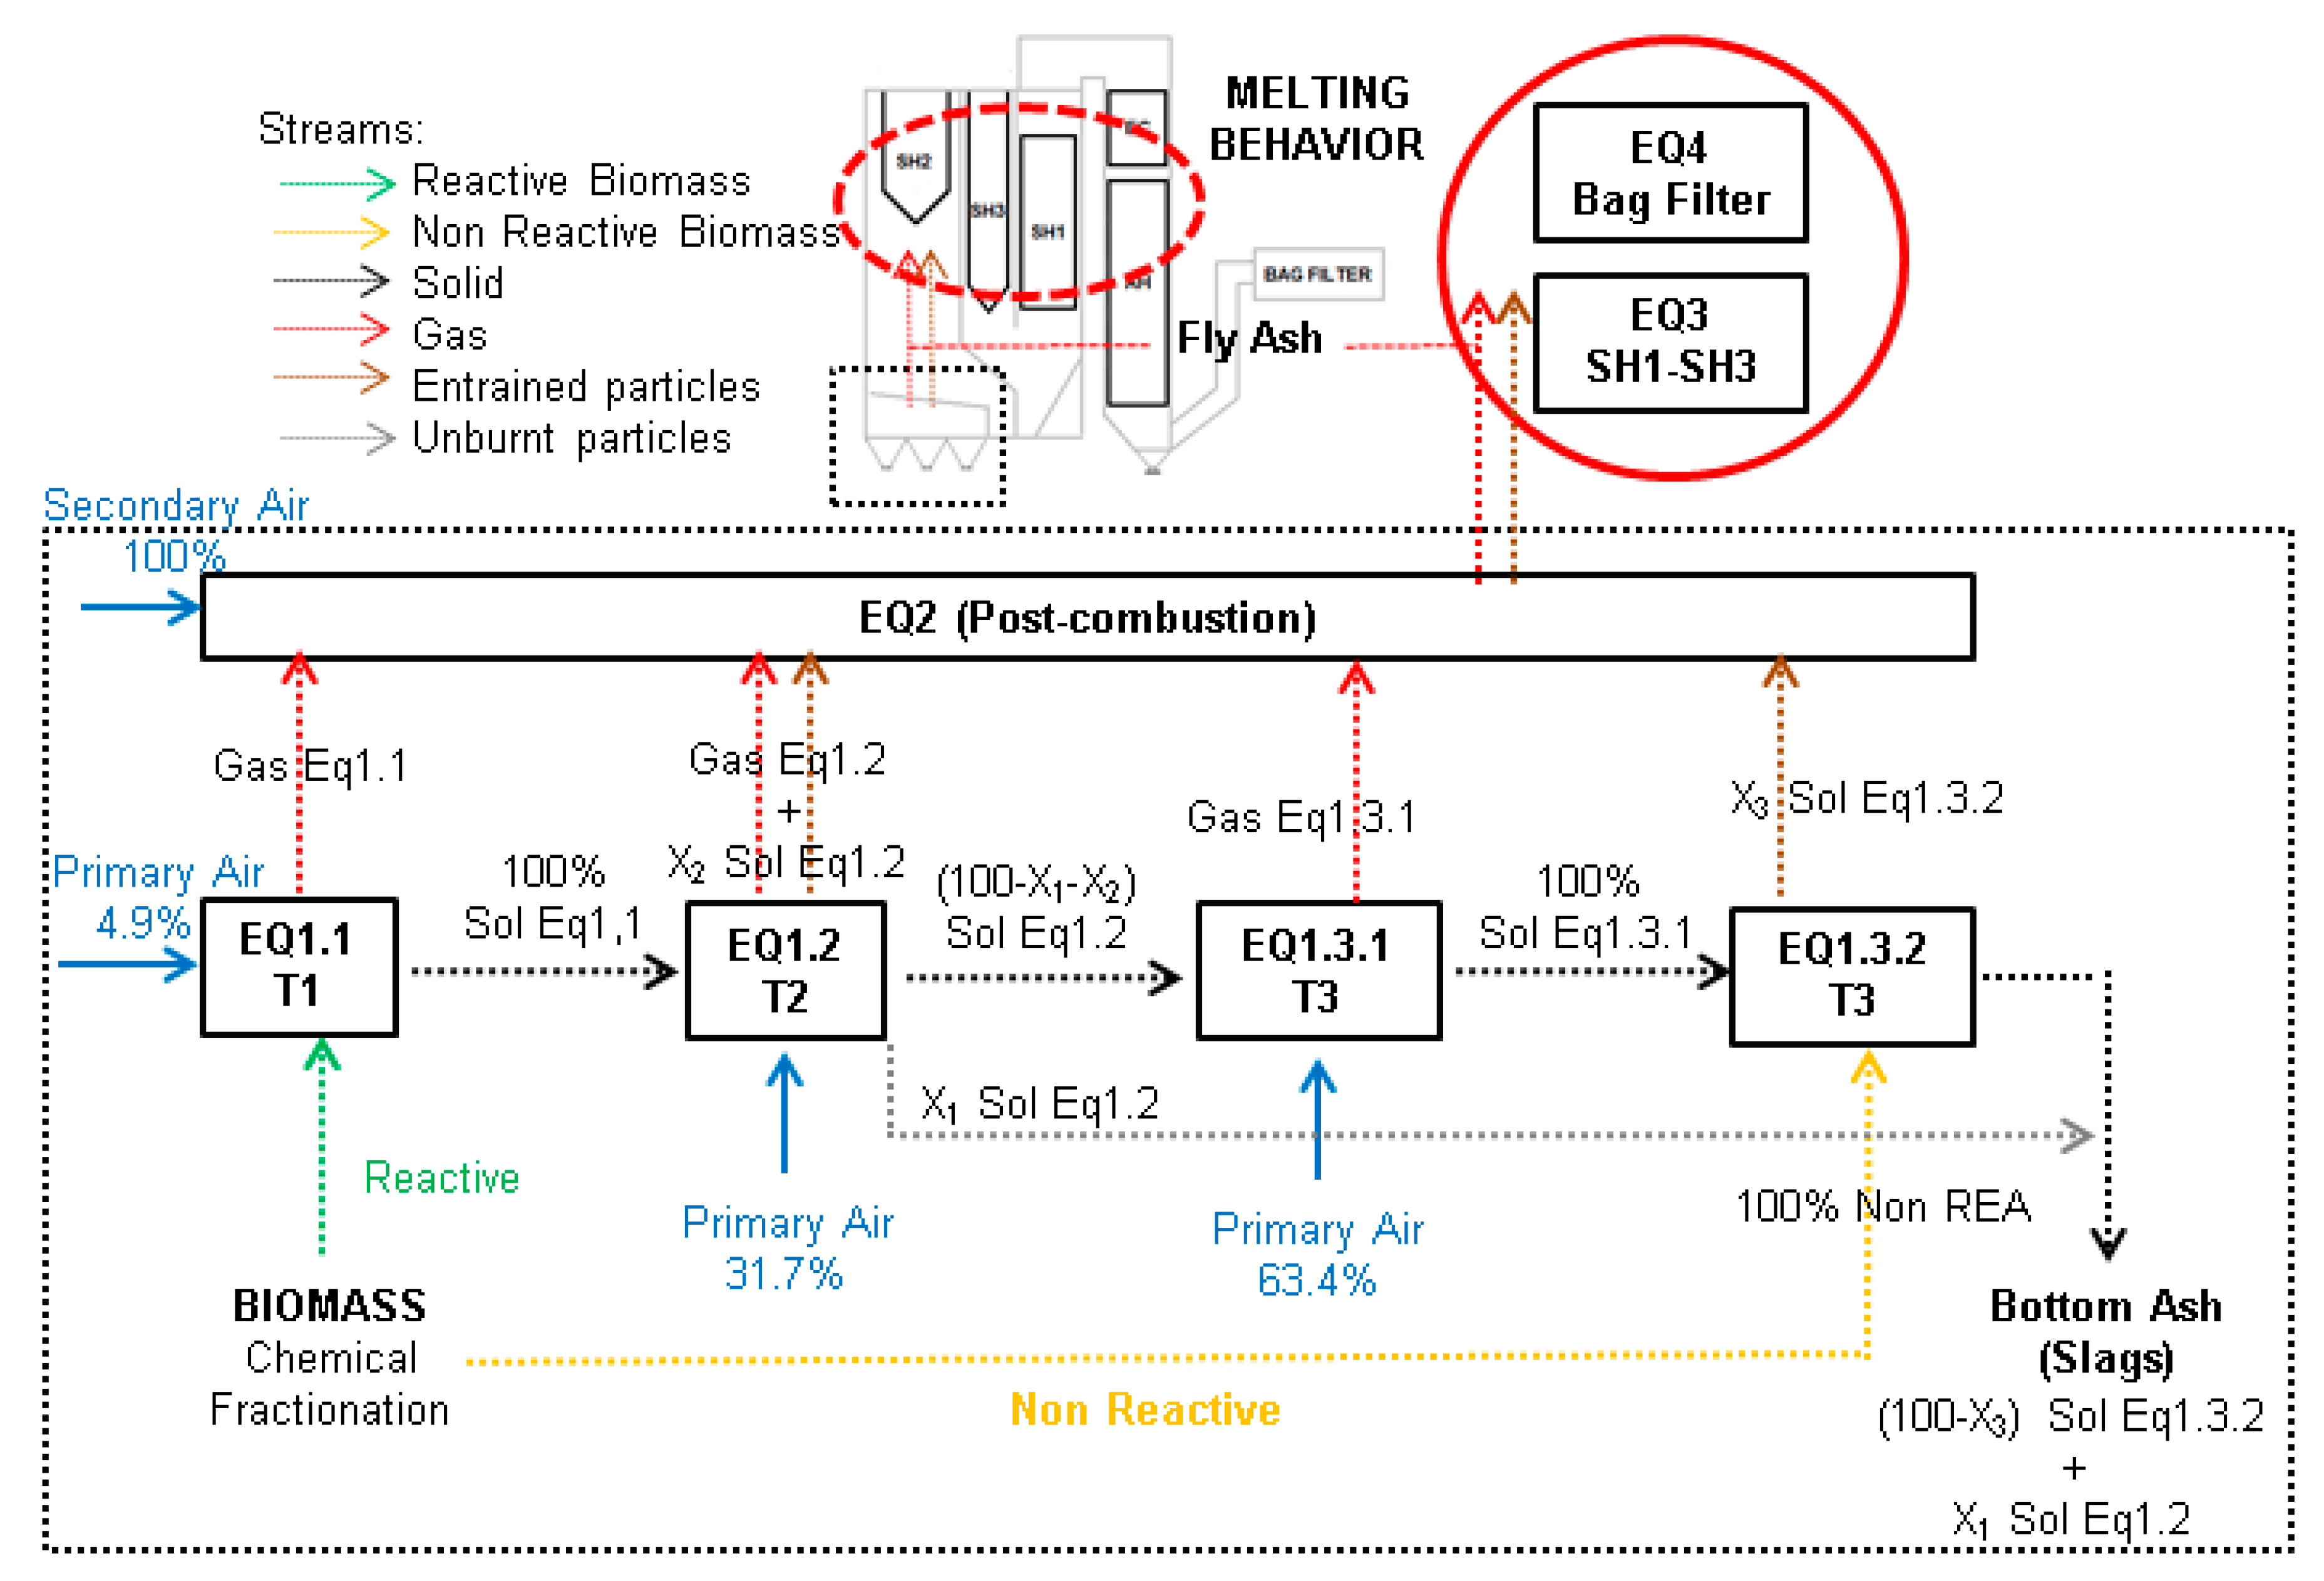
  • The boiler design temperature values have been assumed when solving the post-combustion stage (EQ2), and in the SH2 and SH3 heat exchangers of EQ3.
  • Temperatures in the rest of the stages have been established according to process data measured on the site for SH1, as well as in the economizer/air pre-heater (EC-AH) and in the bag filter (EQ4).
  • A stream of unburnt species (X1) has been systematically applied between EQ1.2 and EQ1.3.1 (slags flow rate calculation) stages for the entrained streams from pyrolysis and char combustion based on the results of the TGA analyses of the slags samples performed under air atmosphere. Calculations were done using the normalized percentage of mass loss, i.e., without accounting for the mass losses below 300–350 °C. The contribution of each fraction was calculated as a function of temperature. Slags mass losses above 600–700 °C and up to 900–1000 °C were assumed to be due to matter that had not reached the maximum grate temperature. This stream is removed from the solids stream when shifting from EQ1.2 to EQ1.3.1 (X1), being led to the final slags stream. The streams of entrained solids from EQ1.2 and EQ1.3 (X2 and X3, respectively) were established by means of the composition of the fly ash determined from the analyses in a specific way for each complete model tested.

3.1. Global Entrainment Model (GE)

In this case, the temperatures of the grate sub-stages are those experimentally measured by means of a series of thermocouples during Test 1: 500 °C (EQ1.1), 900 °C (EQ1.2), and 1300 °C (EQ1.3.1 and EQ1.3.2, slags flow rate and composition calculation, respectively). As for the solids entrained streams (X2 and X3), only those compounds that are non-volatile at the maximum temperature on the grate were considered, as reported in the literature [27,30,31], in accordance to the composition obtained for fly ash: Al, Fe and Si. Calculations were based on the partition coefficient or ash enrichment factor [27,32,33], which establishes the relationship between the presence of these elements in the fly ash and in the biofuel. This coefficient allows for determining which compounds are more prone to remain on the grate and which are more likely to be entrained by the flue gas stream. The total entrainment coefficient (XT) is defined as the relationship between the content of each element in the fly ash with respect to the biomass fed in. As shown in Figure 3, despite the fact that Mg and Ca could be considered, whether including these elements or not does not affect the determined value since all the cited elements show a similar trend in both test except Si in the second one.
X2 and X3 are calculated from XT by taking into account the distribution of primary air on the grate for each sub-stage according to the following expressions:
X 2   =   X T 31.7 31.7 + 63.4
    X 3   =   X T 63.4 31.7 + 63.4
where 31.7 and 63.4 are the percentages of the primary air use in the grate sub-stages EQ1.2 and EQ1.3, respectively.

3.2. Individual Entrainment Model (IE)

Temperatures of the grate sub-stages were the same as those used in the GE model. As for the way the solids entrained streams have been calculated, in this case, based on the analyses of the fly ash composition, partition coefficients for Al, Fe, and Si are now applied as follows: for Fe, which is the element showing the highest content in all the samples, the total entrainment coefficient (XT) is applied to compute the composition by means of the solid state databases FactPS, SPINA, MeO_A, cPyr_A, WOLL, Oliv_A, ACL_B and KSO. For the smallest partition coefficients obtained, that of Al in Run 1 and Si in Run 2, the XT coefficient is applied in the calculations done using the SLAG_A and SALT_F. melted solid state databases.
The distribution of the calculated values for XT coefficients for Al, Fe, and Si is again done between EQ1.2 (X2) and EQ1.3 (X3), according to the distribution of primary air on the grate following Equations (2) and (3).

3.3. Temperature Effect Model (TE)

In this model, the temperatures of the different sub-stages on the grate are established by means of the plant design calculations, and thus the following values were considered: 500 °C (EQ1.1), 800 °C (EQ1.2) and 1100 °C (EQ1.3.1 and EQ1.3.2). The solids entrainment streams (X2 and X3) were defined as indicated for the GE model.

4. Results and Discussion

4.1. Mass Balances

Figure 4 shows the results corresponding to the main elements found in biomass and ash samples for the two tests performed. Other elements such as Ti were present at levels below the detection limits of the analytical techniques employed. Data are given as g of the element per kg of dry biomass. Error bars correspond to the standard deviations from the data obtained in the analyses of series of n samples taken in both tests, being n = 5 in Test 1 and n = 3 in Test 2.
Mass balance closures can be qualitatively checked in Figure 4 by comparing the total content of any given element in the raw biomass (dark grey bars) against the sum of the contents of that same element in fly ash and bottom ash (light grey and white bars). By comparing the analyses of the major components from samples extracted in both tests, it can be seen that Ca shows a reasonably good level of mass balance closure, in contrast to K, which has significantly lower overall concentration values in the outlet streams with respect to the contents in the biomass. As for Si, this element shows clear discrepancies in the analytical results leading to poor mass balance closures. It must also be noted that there is a relatively higher analytical uncertainty in the values obtained in the analyses of the raw biomass samples for Si in comparison to the rest of the elements. As for Mg, Na, and P, they show reasonably good mass balance closures, whereas Al and Fe show large discrepancies, especially in the results from Test 2.
These results could be affected by the following facts: lack of representativeness of the slag samples owing to their heterogeneity and the possible leaching of components during the final cooling in water, the use of annual average hourly mass flow rates to determine the values of slags and fly ash outlet streams, and the presence of contaminants in the biomass, including stones, dirt and debris, which could alter the concentration levels of inorganic elements, especially Si and Al. It must be stressed that the annual average hourly mass flow rates considered for the ash contents of the input and output streams show a very good mass balance closure. Overall, average ash contents in the wheat straw samples analyzed ranged within 5–7 wt.% (dry basis). In addition, the uncertainties found in the ash content from biomass samples are in agreement with those typically found in the literature, which can reach values as high as 14% [34].

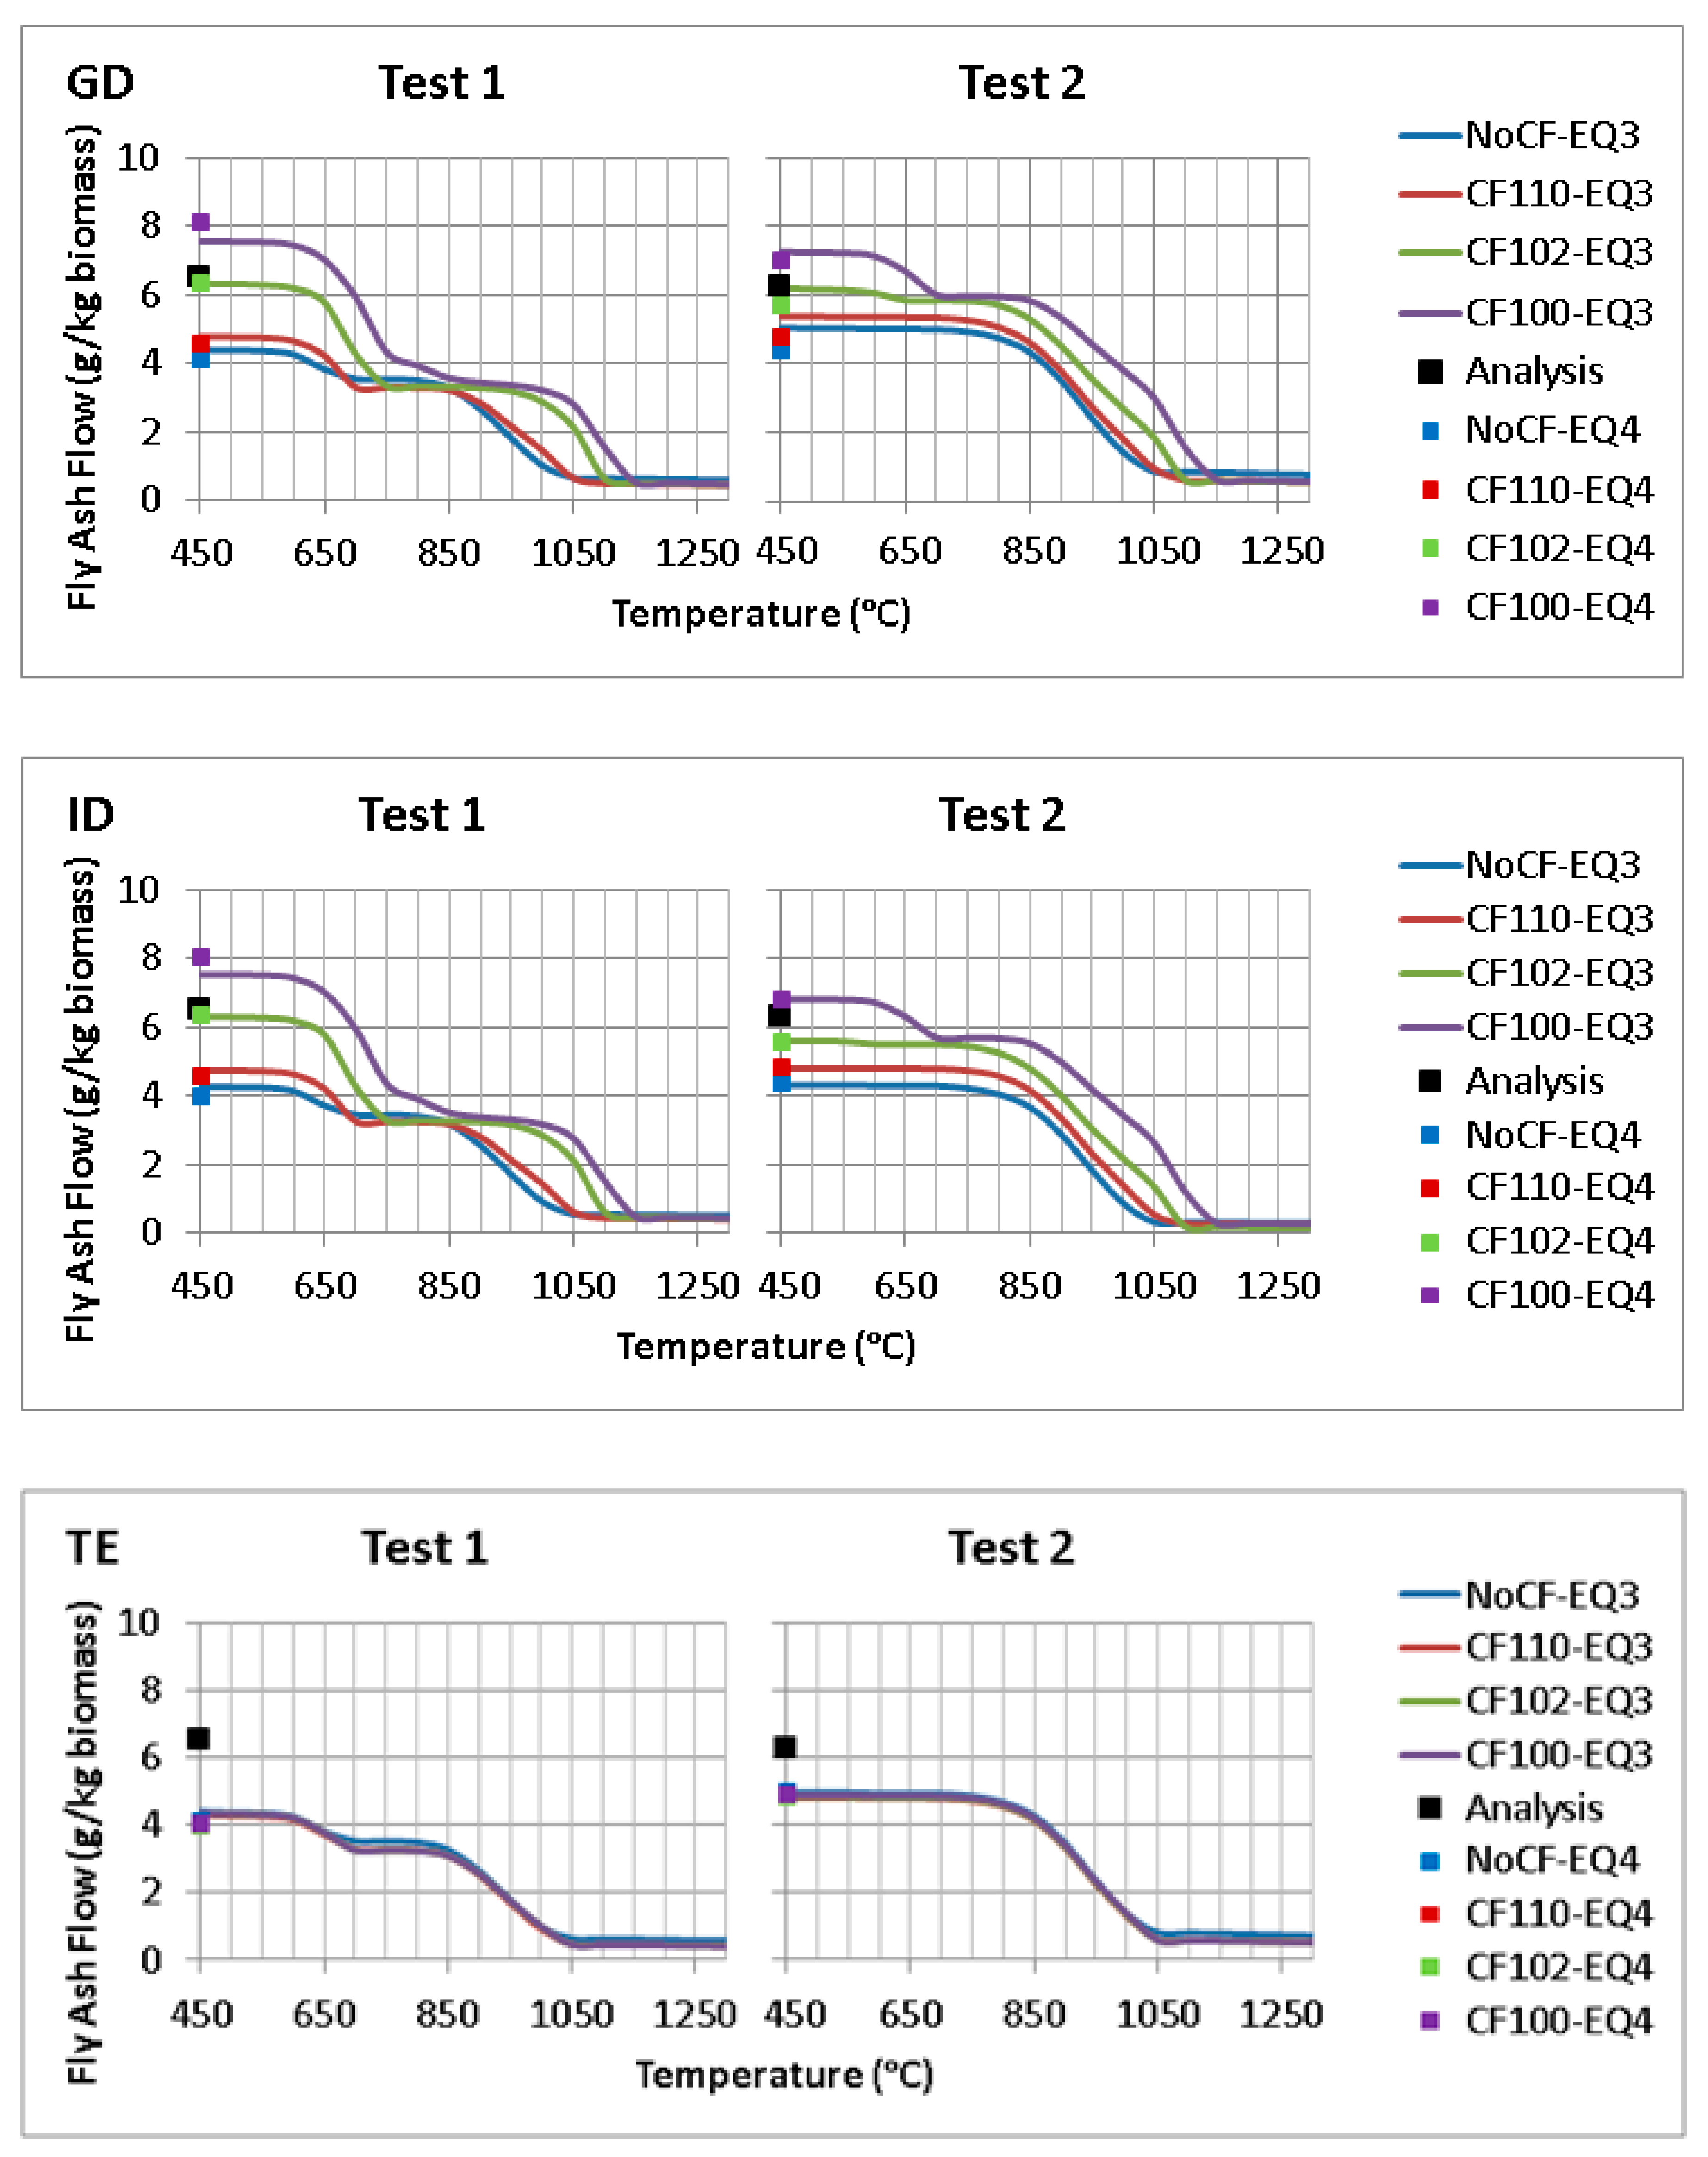
4.2. Fly Ashes Flow Rates

Figure 5 shows the results of the simulations corresponding to the three solid particles entrainment models (GE, IE, and TE) formulated and the four cases considered regarding chemical fractionation (CF100, CF102, CF110, and N°CF). The amount of fly ash is represented by means of the solids present in stage EQ3 (450–1300 °C), which is given at each temperature by the continuous curves depicted in Figure 5. Predicted amounts of fly ash are clearly diminished with an increase in model temperatures due to an increment on the volatization of elements. The amount of solids calculated at the filter temperature in stage EQ4 (at 150 °C) is given by the squares represented on the vertical axis. Data of the fly ashes flow rates from measurements onsite at the plant are also given.
It can be seen that GE and IE models provide results that are very sensitive to the chemical fractionation as well as to the degree of reactivity assigned to the inert fraction. The predicted amount of fly ashes per kg of biomass decreases as part of the inert fraction from the chemical fractionation being considered reactive, increasing from case CF100 to CF102, and finally CF110. However, disregarding chemical fractionation leads to the lowest amount of fly ashes as the bulk composition is considered reactive; therefore, interactions between reactive and non-reactive fractions yields a lower amount of volatile species. In contrast, the results obtained applying the TE model are not affected by the type of chemical fractionation considered. In fact, in this case, the temperatures considered in the simulations do not lead to the share of volatilization needed to reach the actual flow rate of fly ashes, regardless of the type of chemical fractionation that is assumed. Therefore, it can be concluded that GE and IE are the models that best describe the entrainment of solid particles in the gas stream. In both cases, the best results are obtained by considering chemical fractionation and adopting a small reactivity (2%) of the inert fraction (case CF102).
When modeling stage EQ4, equilibrium calculations predicted the formation of H2SO4(H2O)6,liq except for cases CF100 and CF102 using the GE and IE models. This result is obtained when the temperature considered of EQ4 is below 180–200 °C. The formation of this compound was not predicted during the EQ3 stage simulations, which were conducted at equilibrium temperatures ranging from 450 °C to 1300 °C. Hence, the simulations of the species formed during the cooling down of the flue gas in the heat exchangers are not affected by the formation of H2SO4(H2O)6,liq nor will it affect the simulation of the ash melting curve (AMC). Since such species are in the liquid state, they have been considered to be entrained by the flue gas stream and thus are not being recovered in the filter.
The results obtained in the simulations of the fly ash flow rate are in agreement with previous studies [34]. Reference levels for estimating uncertainty in fly ash generation are typically assumed to be equal to or lower than 14%, which could correspond to the present study in terms of fluctuations on the values obtained for this parameter ranging between 0.88 and 0.91 g of solid in the flue gas per kg of biomass fed in. Considering the CF102 case, GE and IE models present uncertainty values around 2–8%, whilst the uncertainty in the fly ash flow rate predicted by the simulations is somewhat higher when CF100 is considered, ranging between 12% and 25%. As concerns the TE model, the uncertainty levels are not acceptable, surpassing 60%. Therefore, it can thus be concluded that the best chemical fractionation cases and predictive models for estimating with adequate accuracy fly ash flow rates being CF102, using either GE or IE models.

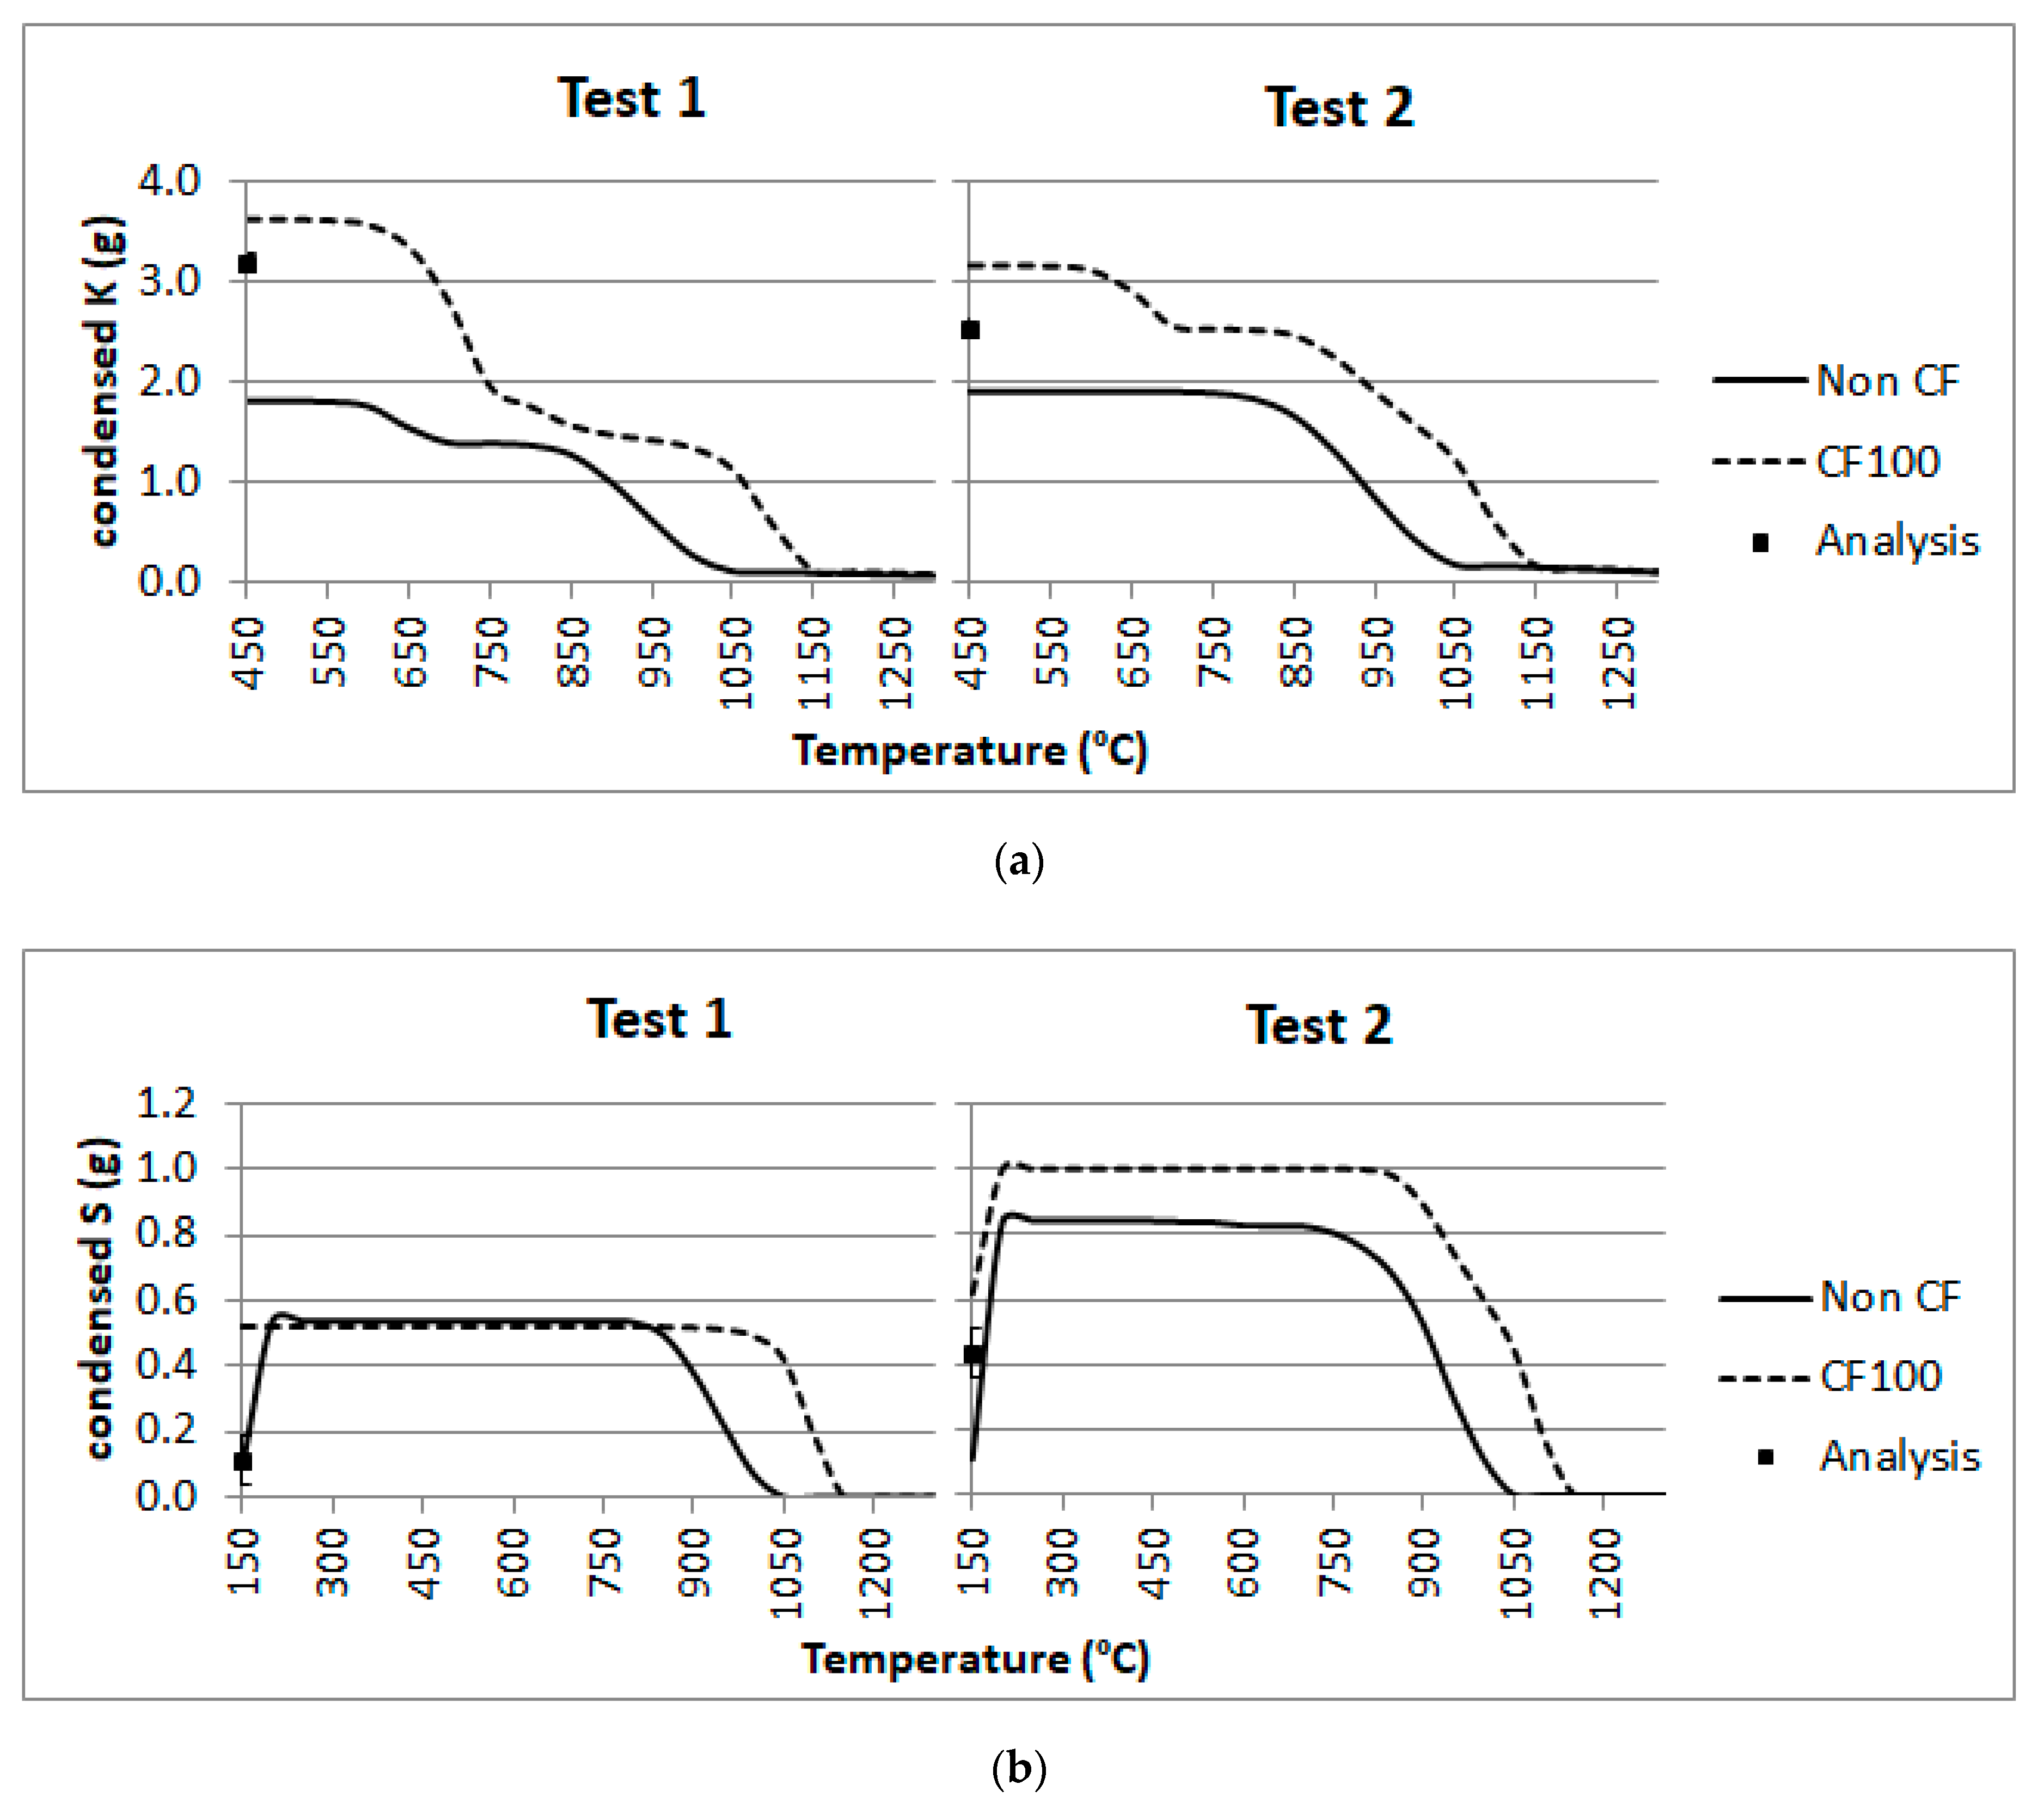
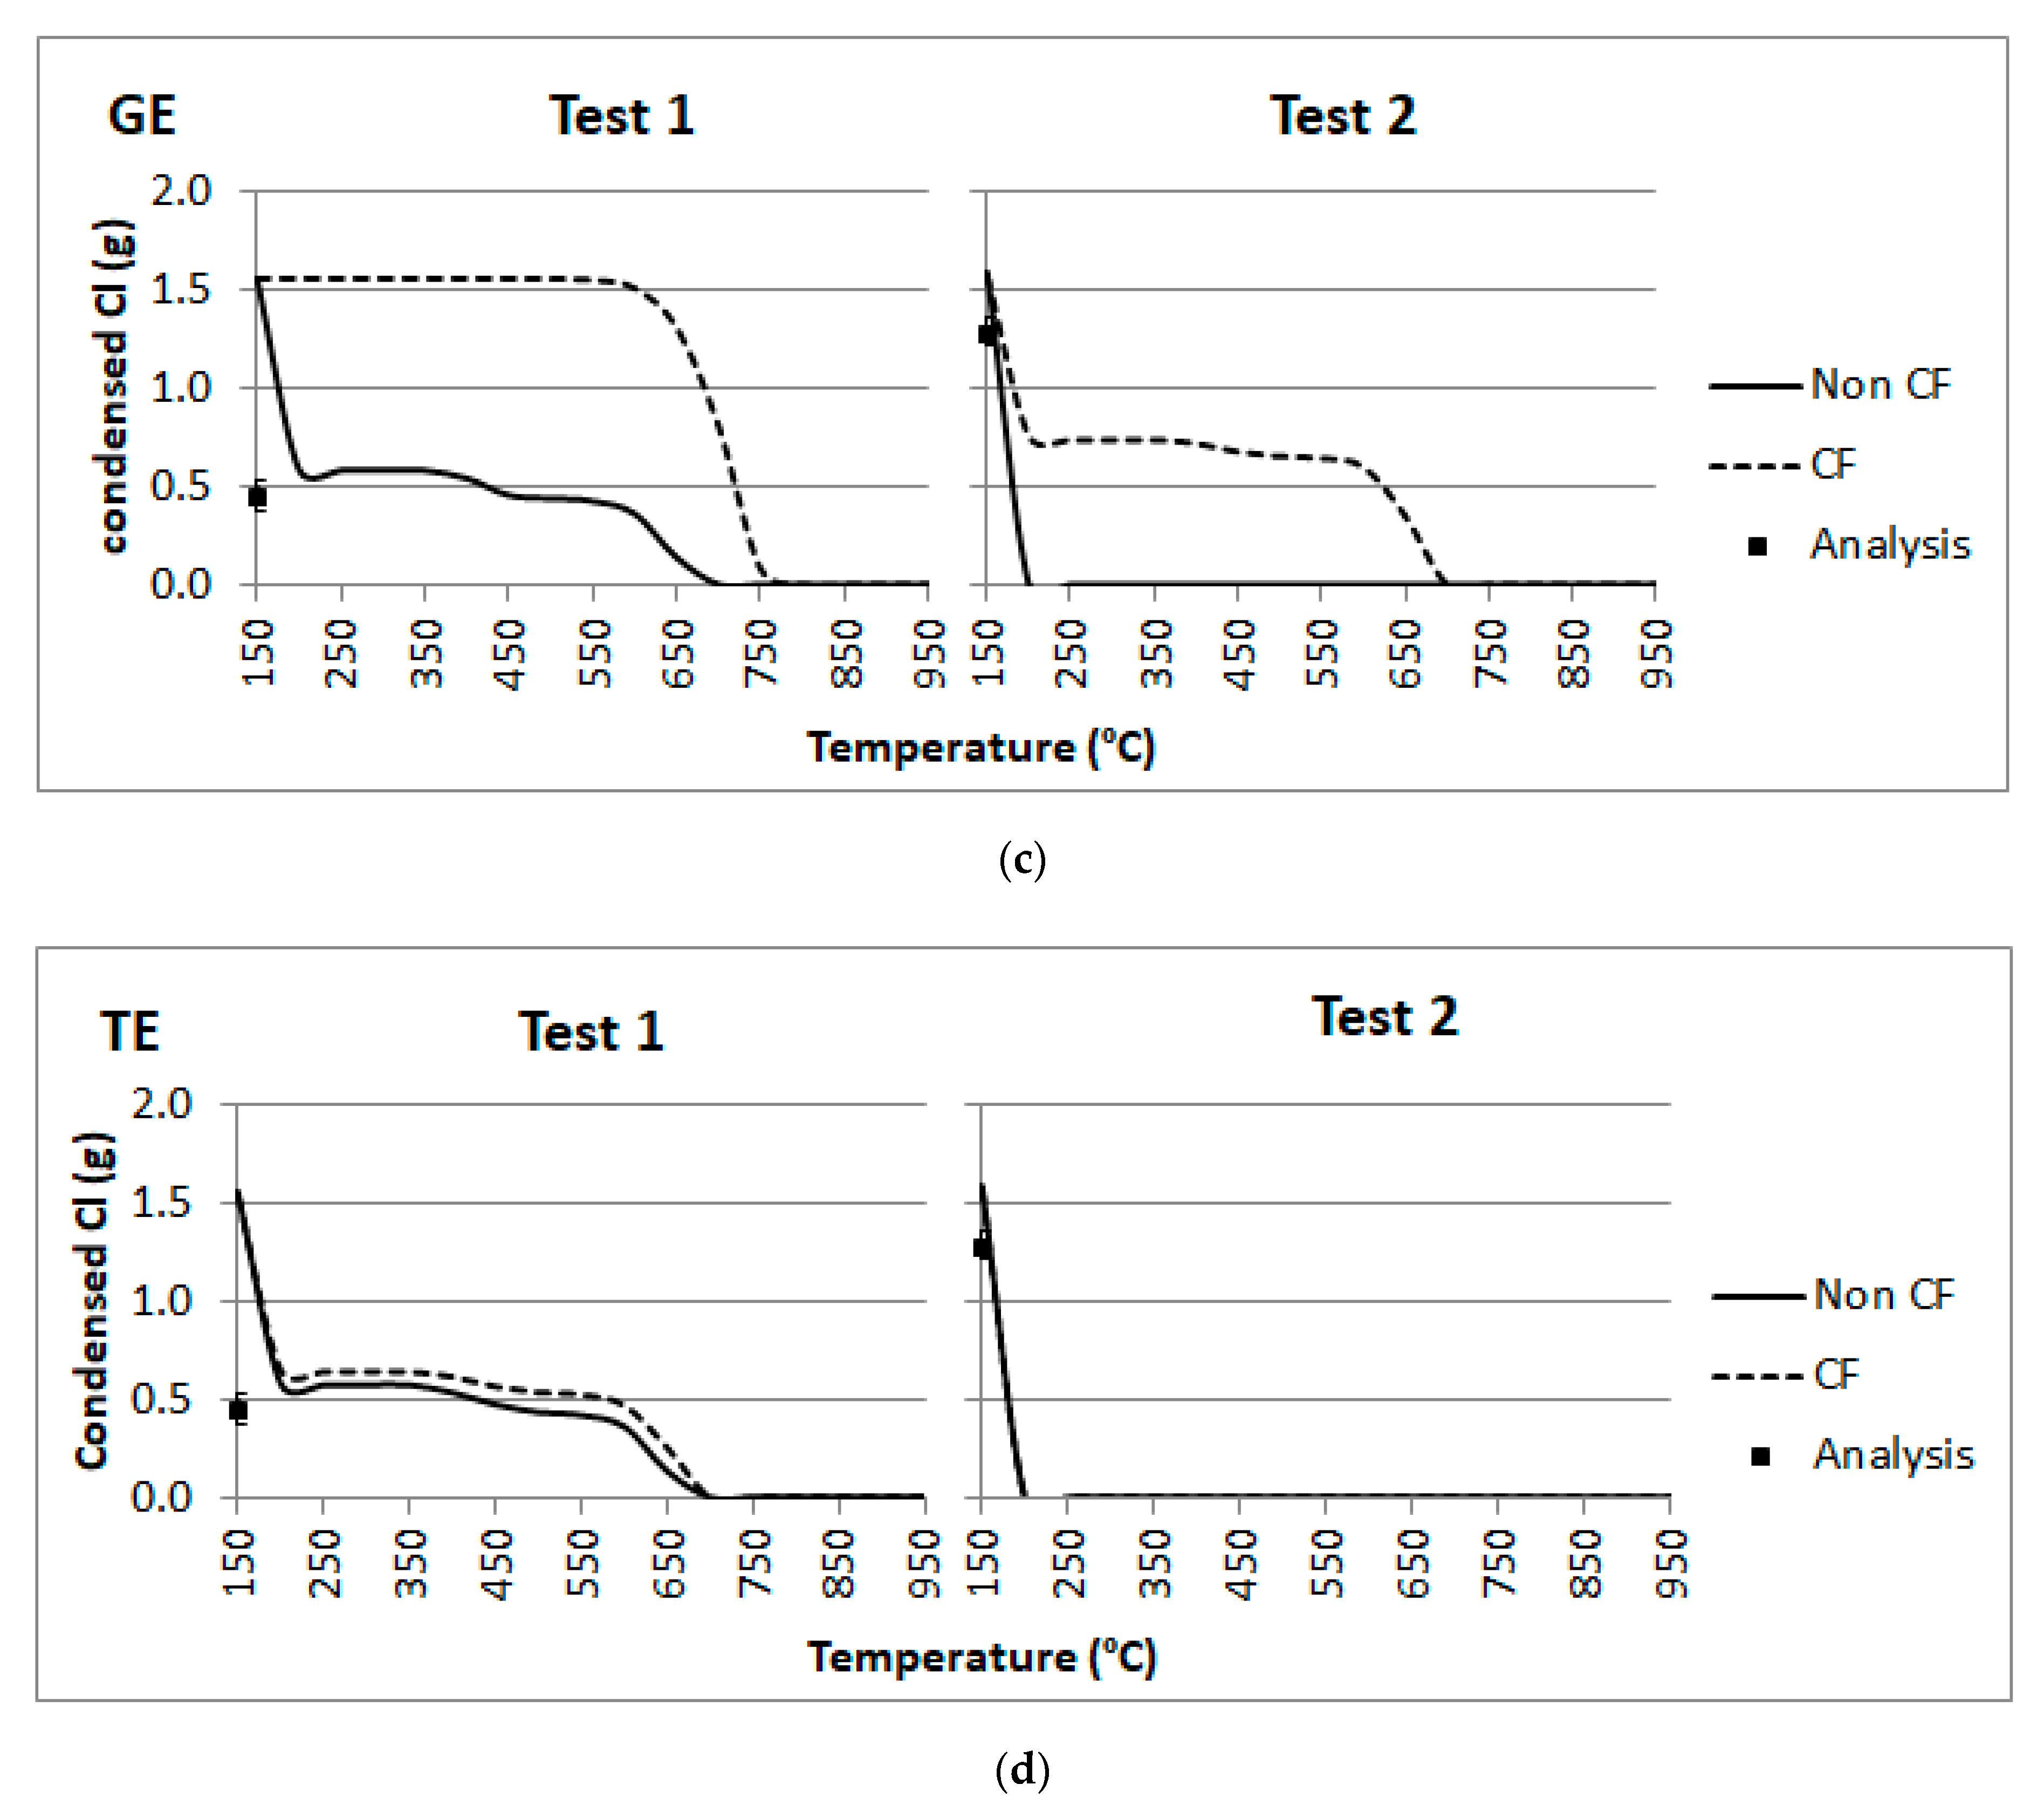
4.3. Fly Ashes Composition: K, S and Cl Behavior

Figure 6 shows the evolution with temperatures of condensed K, S, and Cl, as predicted by the GE model. It must be said that the IE model gave nearly identical results to the GE one, whereas the TE model yielded K contents systematically lower than the actual contents of the samples, owing to the lesser volatilization predicted for K in the simulation stage for the grate (EQ1).
Both Cl and K show similar behaviors in Test 1. However, the values predicted for Test 2 are in general well below the analytical results, even in the best case, obtained in the 200–600 °C temperature range using either GE or IE models and CF100 chemical fractionation. Cl predicted values using the TE model are affected by the lower temperatures applied on the grate, not showing differences between the different chemical fractionation cases considered.
As for S, the theoretical SO2 concentration has been calculated from the S content results obtained after solving the EQ3 stage over the gas volume resulting from the calculation of the EQ4 stage. Condensations of inorganic elements are considered negligible in comparison to the total volumetric flow rate of the flue gas in the different stages. These values have been compared to the empirical measurements obtained onsite in Figure 7. The 100% value represents the average of the on-site measurement at the stack for each campaign, while dotted lines represent the minimum and the maximum values obtained from the chemical analyses. Again, the results provided by the GE and IE models are, in general, similar. However, when the No-CF and CF110 cases are considered, notable differences arise that are in the order of the analytical uncertainty. As for the TE model (not shown), once again, no differences between case studies are found, showing results that match those of the GE and IE models when no chemical fractionation is applied.
It can be seen that the SO2 contents measured in the flue gas match those obtained in the simulations at temperatures ranging from 1000 to 1200 °C for Test 1 and from 950 to 1150 °C for Test 2, in accordance with the temperature intervals identified from the S contents detected in the fly ash samples. In fact, the temperatures at which the composition of the fly ash samples match the predicted values in the simulations with the analytical ones have been listed in Table 2. For Cl, only the values corresponding to Test 1 are presented.
The analysis of the simulation results, according to the S contents from the fly ash samples and to the SO2 emissions measured onsite, shows that the formation of H2SO4(H2O)6,liq, predicted by some of the models and chemical fractionation cases, is not justified. Furthermore, the S levels found in the fly ash analyses of the samples seemingly match those values obtained in the simulations of the EQ3 stage at high temperatures (1050–1100 °C).
The analyses of S and Cl compounds, including the SO2 emissions discussed above, reveal that the excess of S precipitated predicted in the 450–950 °C interval by the simulations performed with the GE and IE models, could be affecting the Cl behavior underneath those temperatures. This would result in a lack of Cl precipitation in the simulations, resulting in the alleged formation of H2SO4(H2O)6,liq at temperatures below 200 °C. Consequently, the condensation of Cl together with K in the form of KCl could take place at temperatures lower than 200 °C.
In conclusion, the results obtained regarding the S and Cl contents indicate that three condensing phenomena take place in the flue gas, which coincide with the cooling stages in the heat exchangers: SH2 (1050–1100 °C), SH3 (850 °C) and SH1 (600 °C). In addition, an entrainment phenomenon is observed: the S content in the analyses of the fly ashes would coincide with the condensate in SH2 and simulated in the 1050-1100 °C interval, while the experimental Cl content would match the condensations predicted in the SH3 and SH1 stages at temperatures of 850 and 600 °C, respectively. The behavior observed for K could be a result of the combination of the behaviors found for S and Cl. This phenomenon could be affecting the results of the Cl content simulations from Test 2, in which the experimental Cl contents of the fly ashes are not reached until the temperature of the EQ4 stage (150 °C) is reached. The excess of S, condensed as K2SO4, as predicted in the simulations of Test 2, would impede Cl condensation as KCl, which would in turn sequester K. Furthermore, at temperatures above 1000 °C, K in gas the phase would mainly be present as KCl and KOH, while S and Cl would be in the form of SO2 and HCl, respectively. At lower temperatures, the formation of K2SO4 and the ensuing formation of aerosols could take place, either in the gas or in the condensed-solid phases. Such formation could occur both homogeneously (by nucleation or coalescence in the gas phase) or via a heterogeneous gas-solid phase reaction [35,36,37,38]. The chemical reactions, which would be taking place, are the following:
2 KCl ( g ) + H 2 O ( g ) + SO 2 ( g ) +   1 2 O 2 ( g ) K 2 SO 4   ( g ) + 2 HCl ( g )
2 KCl ( g ) + SO 2 ( g ) +   1 2 O 2 ( g ) K 2 SO 4   ( g ) + Cl 2   ( g )
2 KOH ( g ) + SO 2 ( g ) +   1 2 O 2 ( g ) K 2 SO 4   ( g ) + H 2 O ( g )
2 KCl ( s , l ) + H 2 O ( g ) + SO 2 ( g ) +   1 2 O 2 ( g ) K 2 SO 4   ( s , l ) + 2 HCl ( g )
Nonetheless, the actual reaction mechanisms are not clear yet, since the sulfates formation reaction requires the presence of O2 and SO2, but it could also be derived from the direct reaction with SO3 once it has been formed [36,39,40]. This process could take place via reactions 7 and 8.
SO 2 ( g ) + 1 2 O 2 ( g ) SO 3 ( g )
Since the equilibrium vapor pressure for K2SO4, 0.03 mbar at 1000 °C, is much lower than that of KCl [38], the reactions leading to the formation of potassium sulfate together with the gas cooling process cause the condensation of K2SO4, being the cooling rate highly influential in the process [41]. The condensation begins around 980 °C on the particles initially present in the gas. As the cooling down proceeds, the saturation ration exceeds the critical level and the homogeneous nucleation of K2SO4, taking place between 820 °C and 750 °C, leads to the formation of high concentrations of nanometric sized particles [42,43,44,45]. These new particles provoke a rapid heterogeneous condensation of K2SO4, KCl, and (KCl)2, thus increasing the K, S, and Cl concentrations in the sub-micrometric particles [36,46,47].
Various studies have been devoted to the SO2 oxidation reaction, both in the homogeneous gas phase and in the heterogeneous solid–gas phase. The proposed mechanisms do not elucidate whether the kinetically limiting stage is the actual sulphate formation reaction itself via reaction with SO2 and further nucleation of K2SO4 [19,40,45] or the previous oxidation of SO2 into SO3 [36,43,46]. Below 900 °C, K2SO4 does not reach the equilibrium condition, and more KCl is formed owing to its higher reaction rates [48]. KCl precipitation can lead to an increase of its residence time, which would favor its heterogeneous reaction with SO2 or SO3 as the flue gas flows by. In any case, the formation of S-containing compounds is kinetically limited at temperatures below 800–820 °C [43,49,50].

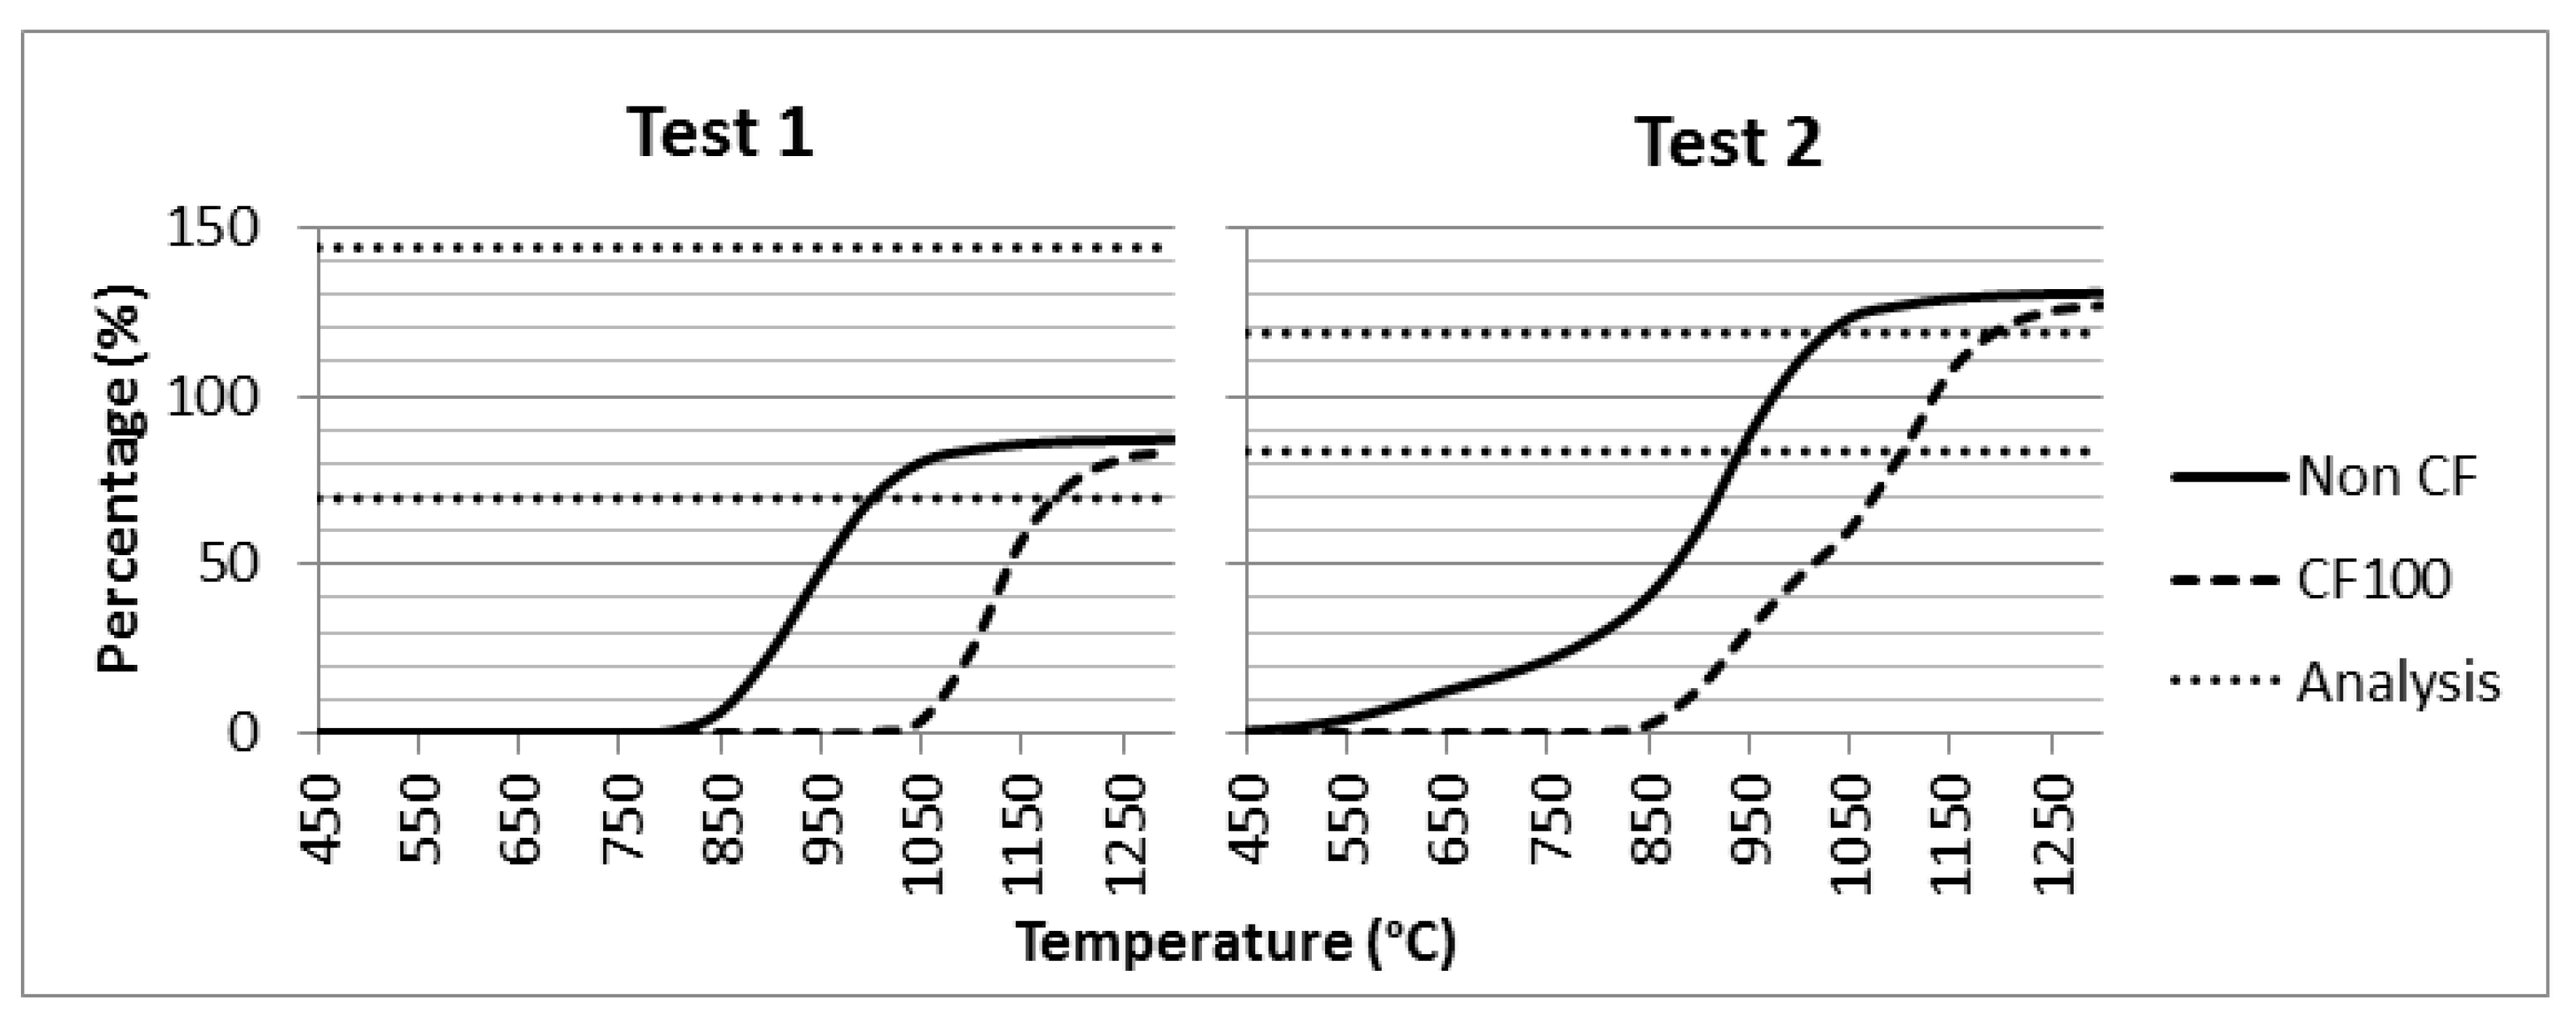
4.4. Ash Melting Curves

Ash melting curves (AMCs) were obtained from the simulations carried out using the different models. The results were obtained by calculating the percentage of solids in smelted state with respect to the total solid content in the flue gas stream at different temperatures. There are noteworthy differences in the calculations between tests. The results obtained (see Figure 8) for ash compositions show that, in the case of Test 1, even at 450 °C, liquid chloride salts and K2SO4 are formed, as well as oxides in smelted state.
In view of these results, it can be concluded that fly ashes collected in the bag filter have a composition that matches those simulated at temperatures around 650 °C (EQ3 stage). Owing to this, the AMCs obtained in the simulations could be valid until 650–700 °C, considering the CF100 case in the GE model (and also with the CF02 case, not shown). The IE model provides similar results, but using the CF02 case. The fact that the AMCs obtained from the composition of fly ash in Test 1 does not descend below 30% and could be due to an underestimation of the S and Cl contents.
As concerns T15 and T70 values, both GE and IE models considering CF100 and CF102 evolve from T15 to T70 above 1050 °C at a very narrow temperature interval, thus meaning that smelted solids would downflow from the wall after the post-combustion stage. The peaks observed in the AMCs at 1050–1100 °C in Test 1 and in the case of the IE model using CF100 in Test 2 are due to the formation of liquid K2SO4. These results contrast somewhat with previous findings in the literature. Some authors discarded the use of the SALT_F solution above 850 °C to avoid an overestimation of the formation of smelted salts [51]. In this way, the calculations carried out in the simulations promote the formation of these salts in their solid state. However, the smelting phases detected in the present study by means of DTA analysis, together with the SO2 release detected by TGA-MS evidence the presence of K2SO4 (l) in the samples. In a subsequent study [52], the SALT_F solution was eliminated from the thermodynamic equilibrium calculations in cases where the K/(Si+P) molar ratio in the raw biomass was higher than 1. In that way, it was intended to avoid an overestimation in the precipitation of K salts (carbonates and sulfates), which in turn would yield an unrealistic decay in the AMCs. In the present work, the values for the K/(Si+P) ratio were around 0.6 (mol/mol). Therefore, the different composition of the wheat straw could explain the discrepancies found between the previous works and the present study.
It can be observed that a decrease in the AMCs of those simulation models in which the formation of liquid salts ends up above 1050–1100 °C. Such decay is not caused by the formation of solids or solid solutions, but due to the change in the type of compounds obtained as a consequence of the K2SO4 volatilization. In the case of the GE model applied on Test 2, both with CF00 and CF02 and despite not having the formation of liquid salts at 1100 °C, have the same decay that can be observed in the AMC at higher temperatures, owing to K2O decomposition. In contrast, in the simulation models where K2SO4 (l) formation is predicted, the decay in the AMC is more acute.
At lower temperatures (650–750 °C), the same decay phenomenon caused by the formation of liquid salts can be observed in the simulations carried out with Test 1 using GE and IE models, both with CF100 and CF102 cases. The phenomenon is somewhat more accused in the case of CF100, owing to the formation of liquid salts, especially chlorides, and to a lesser extent, carbonates.
As for the TE model, as in previous results, the AMC obtained do not show differences between the chemical fractionation cases applied. In the case of Test 1, the results of the AMC revealed that T70 is not reached above 1050 °C, whilst in Test 2, T70 is surpassed in all cases above that temperature.

5. Conclusions

In this work, three different predictive models were considered to predict fly ash behavior from the experimental data taken in a 16 MWth biomass vibrating-grate firing boiler. The main conclusions are:
  • The calculations for equilibrium compositions in the simulations are somewhat unrealistic as concerns S and Cl contents, which in turn affect the predicted species formed, and in particular, the distribution of those containing K.
  • The differences found in the various simulations carried out to establish fly ashes flow rate reveal that simulations are highly affected by the type of chemical fractionation considered, except for the Temperature Effect (TE) model, in which the grate temperatures considered are so low that they impede the volatilization of elements that would further generate condensates downstream. The Global Entrainment (GE) and Individual Entrainment (IE) models provide very similar results, showing, in general, good predictions for the annual average fly ash flow rates (between 92–98% and 112–125% depending on the chemical fractionation considered). In contrast, the TE model predicts a much lower value in comparison to the actual values obtained from the onsite measurements (around 65% below).
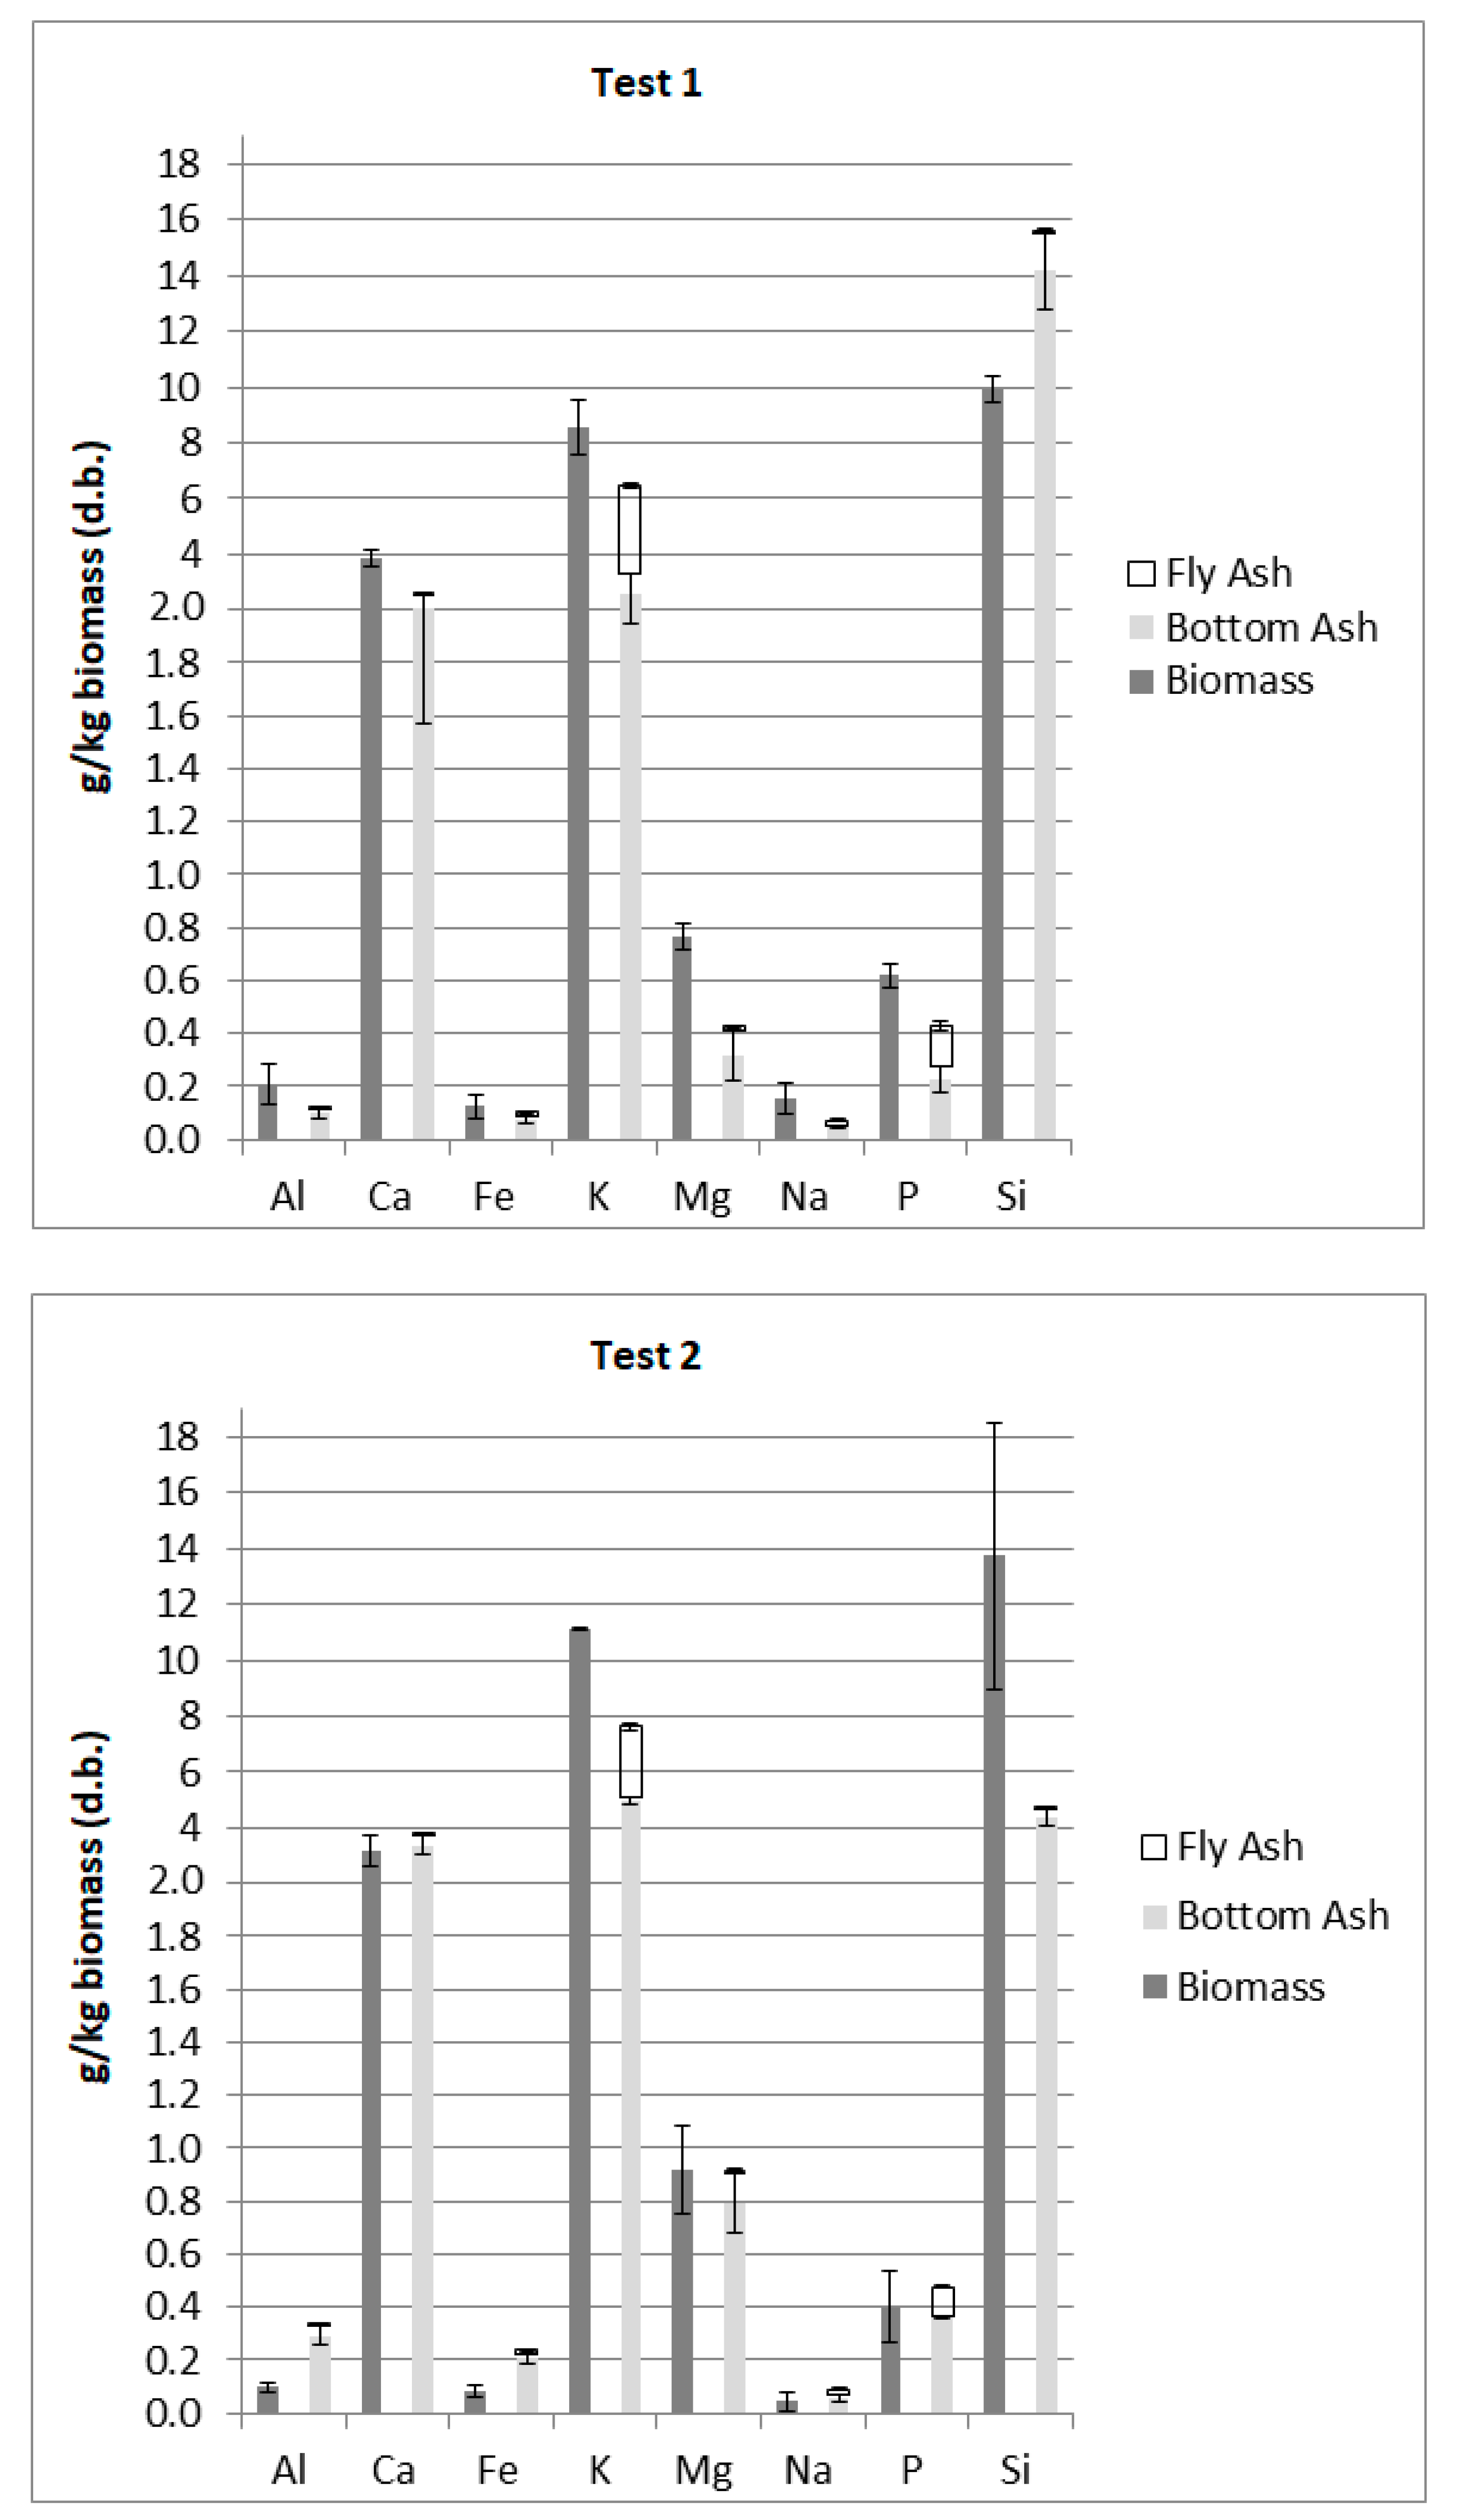
  • Regarding fly ashes composition and formation of smelted phases, the best models for the gas cooling stages are both GE and IE when considering chemical fractionation cases CF100 and CF102. Overall, the compositions obtained in the equilibria calculations for the major elements in ash show good agreement with the analytical values obtained in the analyses of fly ash samples, except for K and Na. Below 950–1000 °C, all the models predict values that match closely the analytical ones. In the case of Si, the IE model allows for slightly better predictions owing to the entrained streams applied in that model.
  • Calculations carried out for the composition of fly ash in terms of K, S and Cl revealed a match with the gas cooling effects in the superheater sections SH2 (1050–1100 °C), SH3 (850 °C) and SH1 (600 °C). In addition, there seems to be an entrainment effect: S content in fly ash would coincide with the condensate in SH2, whilst Cl would match that of SH3-SH1.
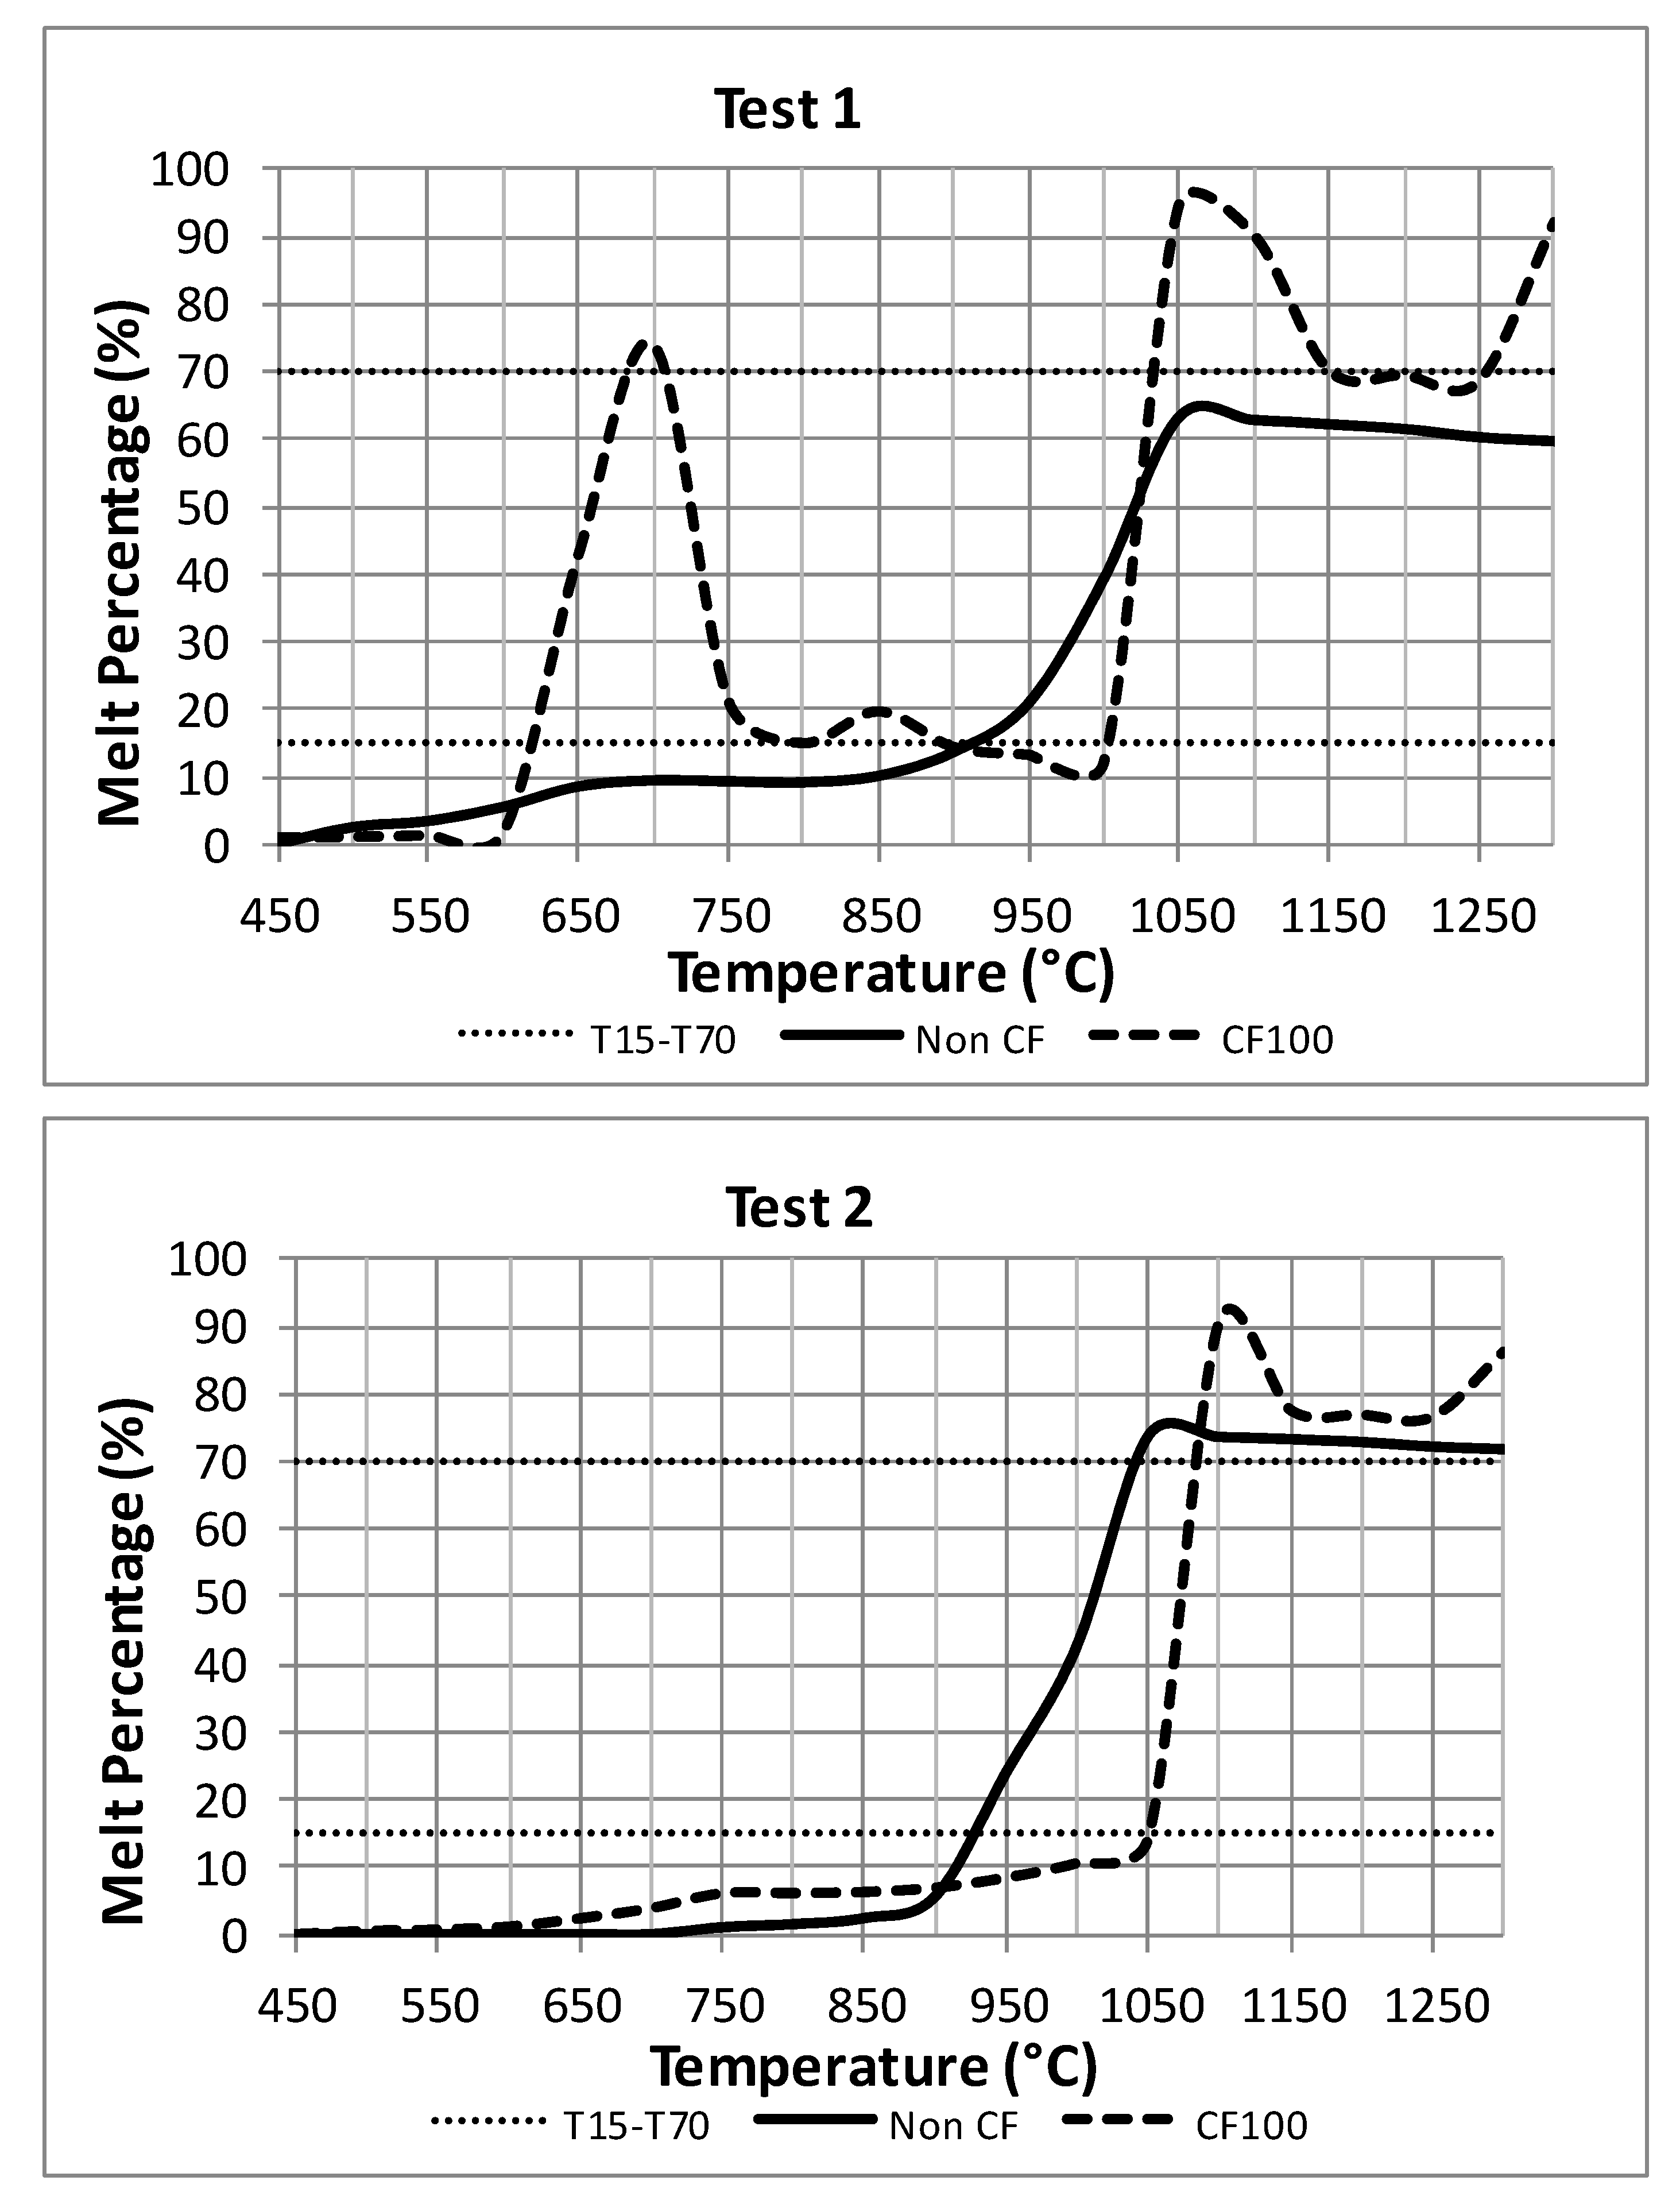
  • As concerns the Ash Melting Curves (AMCs), the thermodynamic simulation of the chemical equilibrium at the characteristic temperatures found in different sections of the boiler allowed for the calculation of T15 and the corresponding condensed fractions. It could be established that the transition from T15 to T70 above 1050 °C is fast. This would cause smelted species to downflow on the wall after the post-combustion stage without causing fouling. However, at the outlet gas temperature in the SH3 heat exchanger (700 °C), the values of smelted solid percentage may fall within the T15 and T70 values, thus indicating a high risk of particles adhesion. This fact, combined with the presence of KCl and K2SO4 condensates, would point out at possible corrosion phenomena in the SH3 heat exchange at temperatures around 700–750 °C.

Author Contributions

All the authors participated actively in the writing and editing of the manuscript. Furthermore: conceptualization, I.F. and J.G.; methodology, I.F.; results interpretation and discussion, all the authors; literature review, I.F., F.B. and L.M.G.; writing—original draft preparation, F.B. and L.M.G.; project administration and funding acquisition, J.G. All authors have read and agreed to the published version of the manuscript.

Funding

This research was funded by the Spanish Ministerio de Economía y Competitividad (MINECO), in accordance with the provisions of article 31 Regulation of Law 38/2003, of November 17, General Subsidies, approved by Royal Decree 887/2006, of July 21. Funding was received within the framework of the MULTIBOM (Development of Multi-fuel Biomass Combustion Technology for High-Power Electrical Production) project, which has received public funding from the INNPACTO subprogramme (Prj. Re. num. IPT-2012-0155-120000)

Acknowledgments

Luis M. Gandía thanks Banco de Santander and Universidad Pública de Navarra for their financial support under “Programa de Intensificación de la Investigación 2018” initiative, as well as Spanish Ministerio de Ciencia, Innovación y Universidades and the European Regional Development Fund (ERDF/FEDER) (grant RTI2018-096294-B-C31).

Conflicts of Interest

The authors declare no conflict of interest.

References

  1. IRENA. Renewable Energy Prospects for the European Union; Remap 2030. 2018. Available online: https://www.irena.org/-/media/Files/IRENA/Agency/Publication/2018/Feb/IRENA_REmap_EU_2018.pdf (accessed on 15 September 2020).
  2. Yin, C.; Li, S. Advancing Grate-Firing for Greater Environmental Impacts and Efficiency for Decentralized Biomass/Wastes Combustion. Energy Procedia 2017, 120, 373–379. [Google Scholar] [CrossRef]
  3. Yin, C.; Rosendahl, L.A.; Kær, S.K. Grate-Firing of Biomass for Heat and Power Production. Prog. Energy Combust. Sci. 2008, 34, 725–754. [Google Scholar] [CrossRef]
  4. Dodson, J.R.; Hunt, A.J.; Budarin, V.L.; Matharu, A.S.; Clark, J.H. The Chemical Value of Wheat Straw Combustion Residues. RSC Adv. 2011, 1, 523–530. [Google Scholar] [CrossRef]
  5. Shao, Y.; Wang, J.; Preto, F.; Zhu, J.; Xu, C. Ash Deposition in Biomass Combustion or Co-Firing for Power/Heat Generation. Energies 2012, 5, 5171–5189. [Google Scholar] [CrossRef]
  6. Vassilev, S.V.; Vassileva, C.G.; Vassilev, V.S. Advantages and Disadvantages of Composition and Properties of Biomass in Comparison with Coal: An Overview. Fuel 2015, 158, 330–350. [Google Scholar] [CrossRef]
  7. Nunes, L.J.R.; Matias, J.C.O.; Catalão, J.P.S. Biomass Combustion Systems: A Review on the Physical and Chemical Properties of the Ashes. Renew. Sustain. Energy Rev. 2016, 53, 235–242. [Google Scholar] [CrossRef]
  8. Garcia-Maraver, A.; Mata-Sanchez, J.; Carpio, M.; Perez-Jimenez, J.A. Critical Review of Predictive Coefficients for Biomass Ash Deposition Tendency. J. Energy Inst. 2017, 90, 214–228. [Google Scholar] [CrossRef]
  9. Khodaei, H.; Al-Abdeli, Y.M.; Guzzomi, F.; Yeoh, G.H. An Overview of Processes and Considerations in the Modelling of Fixed-Bed Biomass Combustion. Energy 2015, 88, 946–972. [Google Scholar] [CrossRef]
  10. Vassilev, S.V.; Baxter, D.; Vassileva, C.G. An Overview of the Behaviour of Biomass during Combustion: Part I. Phase-Mineral Transformations of Organic and Inorganic Matter. Fuel 2013, 112, 391–449. [Google Scholar] [CrossRef]
  11. Forstner, M.; Hofmeister, G.; Joller, M.; Dahl, J.; Braun, M.; Kleditzsch, S.; Scharler, R.; Obernberger, I. CFD Simulation of Ash Deposit Formation in Fixed Bed Biomass Furnaces and Boilers. Prog. Comput. Fluid Dyn. Int. J. 2006, 6, 248–261. [Google Scholar] [CrossRef]
  12. Frandsen, F.J.; van Lith, S.C.; Korbee, R.; Yrjas, P.; Backman, R.; Obernberger, I.; Brunner, T.; Jöller, M. Quantification of the Release of Inorganic Elements from Biofuels. Fuel Process. Technol. 2007, 88, 1118–1128. [Google Scholar] [CrossRef]
  13. Yin, C.; Rosendahl, L.; Kær, S.K.; Clausen, S.; Hvid, S.L.; Hille, T. Mathematical Modeling and Experimental Study of Biomass Combustion in a Thermal 108 MW Grate-Fired Boiler. Energy Fuels 2008, 22, 1380–1390. [Google Scholar] [CrossRef] [Green Version]
  14. Yin, C.; Rosendahl, L.; Clausen, S.; Hvid, S.L. Characterizing and Modeling of an 88 MW Grate-Fired Boiler Burning Wheat Straw: Experience and Lessons. Energy 2012, 41, 473–482. [Google Scholar] [CrossRef]
  15. Yu, Z.; Ma, X.; Liao, Y. Mathematical Modeling of Combustion in a Grate-Fired Boiler Burning Straw and Effect of Operating Conditions Under Air- and Oxygen-Enriched Atmospheres. Renew. Energy 2010, 35, 895–903. [Google Scholar] [CrossRef]
  16. Kaer, S.; Rosendahl, L.; Baxter, L. Towards a CFD-Based Mechanistic Deposit Formation Model for Straw-Fired Boilers. Fuel 2006, 85, 833–848. [Google Scholar] [CrossRef]
  17. Garba, M.U.; Ingham, D.B.; Ma, L.; Porter, R.T.J.; Pourkashnian, M.; Tan, H.Z.; Williams, A. Prediction of Potassium Chloride Sulfation and Its Effect on Deposition in Biomass-Fired Boilers. Energy Fuels 2012, 26, 6501–6508. [Google Scholar] [CrossRef]
  18. Zhou, H.; Jensen, P.A.; Frandsen, F.J. Dynamic Mechanistic Model of Superheater Deposit Growth and Shedding in a Biomass Fired Grate Boiler. Fuel 2007, 86, 1519–1533. [Google Scholar] [CrossRef]
  19. Zbogar, A.; Frandsen, F.J.; Jensen, P.A.; Glarborg, P. Heat Transfer in Ash Deposits: A Modelling Tool-Box. Prog. Energy Combust. Sci. 2005, 31, 371–421. [Google Scholar] [CrossRef]
  20. Zbogar, A.; Frandsen, F.; Jensen, P.A.; Glarborg, P. Shedding of Ash Deposits. Prog. Energy Combust. Sci. 2009, 35, 31–56. [Google Scholar] [CrossRef]
  21. Hansen, S.B.; Jensen, P.A.; Frandsen, F.J.; Wu, H.; Bashir, M.S.; Wadenbäck, J.; Sander, B.; Glarborg, P. Deposit Probe Measurements in Large Biomass-Fired Grate Boilers and Pulverized-Fuel Boilers. Energy Fuels 2014, 28, 3539–3555. [Google Scholar] [CrossRef]
  22. Bashir, M.S.; Jensen, P.A.; Frandsen, F.; Wedel, S.; Dam-Johansen, K.; Wadenbäck, J.; Pedersen, S.T. Ash Transformation and Deposit Build-Up during Biomass Suspension and Grate Firing: Full-Scale Experimental Studies. Fuel Process. Technol. 2012, 97, 93–106. [Google Scholar] [CrossRef]
  23. Žbogar, A.; Jensen, P.A.; Frandsen, F.J.; Hansen, J.; Glarborg, P. Experimental Investigation of Ash Deposit Shedding in a Straw-Fired Boiler. Energy Fuels 2006, 20, 512–519. [Google Scholar] [CrossRef]
  24. Lindberg, D.; Backman, R.; Chartrand, P.; Hupa, M. Towards a Comprehensive Thermodynamic Database for Ash-Forming Elements in Biomass and Waste Combustion—Current Situation and Future Developments. Fuel Process. Technol. 2013, 105, 129–141. [Google Scholar] [CrossRef]
  25. Vassilev, S.V.; Baxter, D.; Vassileva, C.G. An Overview of the Behaviour of Biomass during Combustion: Part II. Ash Fusion and Ash Formation Mechanisms of Biomass Types. Fuel 2014, 117, 152–183. [Google Scholar] [CrossRef]
  26. Hansen, L.A.; Nielsen, H.P.; Frandsen, F.J.; Dam-Johansen, K.; Hørlyck, S.; Karlsson, A. Influence of Deposit Formation on Corrosion at a Straw-Fired Boiler. Fuel Process. Technol. 2000, 64, 189–209. [Google Scholar] [CrossRef]
  27. Teixeira, P.; Lopes, H.; Gulyurtlu, I.; Lapa, N. Use of Chemical Fractionation to Understand Partitioning of Biomass Ash Constituents during Co-Firing in Fluidized Bed Combustion. Fuel 2012, 101, 215–227. [Google Scholar] [CrossRef] [Green Version]
  28. Skrifvars, B.-J.; Hupa, M.; Moilanen, A.; Lundqvist, R. Applications of Advanced Technology to Ash-Related Problems in Boilers; Baxter, L., DeSollar, R., Eds.; Springer US: Boston, MA, USA, 1996; pp. 383–398. ISBN 978-1-4757-9223-2. [Google Scholar]
  29. Hansen, L.A.; Frandsen, F.J.; Dam-Johansen, K. Quantification of Fusion in Ashes from Solid Fuel Combustion. Thermochim. Acta 1999, 326, 105–117. [Google Scholar] [CrossRef]
  30. Vainikka, P.; Lindberg, D.; Moilanen, A.; Ollila, H.; Tiainen, M.; Silvennoinen, J.; Hupa, M. Trace Elements Found in the Fuel and in-Furnace Fine Particles Collected from 80MW BFB Combusting Solid Recovered Fuel. Fuel Process. Technol. 2013, 105, 202–211. [Google Scholar] [CrossRef]
  31. Jung, C.H.; Matsuto, T.; Tanaka, N.; Okada, T. Metal Distribution in Incineration Residues of Municipal Solid Waste (MSW) in Japan. Waste Manag. 2004, 24, 381–391. [Google Scholar] [CrossRef] [Green Version]
  32. Coda, B.; Jacobs, J.M.; Kiel, J.H.A. Impact of Biomass Co-Firing on Ash Formation and Ash Behaviour in IGCC Plants. ECN Rep. 2005. Available online: https://www.researchgate.net/profile/J_Kiel/publication/265008208_IMPACT_OF_BIOMASS_CO-FIRING_ON_ASH_FORMATION_AND_ASH_BEHAVIOUR_IN_IGCC_PLANTS/links/5493307d0cf22d7925da1df9.pdf (accessed on 15 September 2020).
  33. Jenkins, B.M.; Miles, T.R.J.; Miles, T.R.; Baxter, L.L. Combustion Properties of Biomass. Fuel Process. Technol. 1998, 54, 17–46. [Google Scholar] [CrossRef]
  34. Teixeira, P.; Lopes, H.; Gulyurtlu, I.; Lapa, N. Uncertainty Estimation to Evaluate Mass Balances on a Combustion System. Accredit. Qual. Assur. 2012, 17, 159–166. [Google Scholar] [CrossRef] [Green Version]
  35. Nielsen, H.P.; Frandsen, F.J.; Dam-Johansen, K.; Baxter, L.L. Implications of Chlorine-Associated Corrosion on the Operation of Biomass-Fired Boilers. Prog. Energy Combust. Sci. 2000, 26, 283–298. [Google Scholar] [CrossRef]
  36. Iisa, K.; Lu, Y.; Salmenoja, K. Sulfation of Potassium Chloride at Combustion Conditions. Energy Fuels 1999, 13, 1184–1190. [Google Scholar] [CrossRef]
  37. Henriksson, M.; Warnqvist, B. Kinetics of Formation of HCI(g) by the Reaction between NaCl(s) and SO2, O2, and H2O(g). Ind. Eng. Chem. Process Des. Dev. 1979, 18, 249–254. [Google Scholar] [CrossRef]
  38. Blomberg, T. A Thermodynamic Study of the Gaseous Potassium Chemistry in the Convection Sections of Biomass Fired Boilers. Mater. Corros. 2011, 62, 635–641. [Google Scholar] [CrossRef]
  39. Sengeløv, L.W.; Hansen, T.B.; Bartolomé, C.; Wu, H.; Pedersen, K.H.; Frandsen, F.J.; Jensen, A.D.; Glarborg, P. Sulfation of Condensed Potassium Chloride by SO2. Energy Fuels 2013, 27, 3283–3289. [Google Scholar] [CrossRef] [Green Version]
  40. Li, B.; Sun, Z.; Li, Z.; Aldén, M.; Jakobsen, J.G.; Hansen, S.; Glarborg, P. Post-Flame Gas-Phase Sulfation of Potassium Chloride. Combust. Flame 2013, 160, 959–969. [Google Scholar] [CrossRef]
  41. Jiménez, S.; Ballester, J. Formation of Alkali Sulphate Aerosols in Biomass Combustion. Fuel 2007, 86, 486–493. [Google Scholar] [CrossRef]
  42. Nielsen, H.P.; Baxter, L.L.; Sclippab, G.; Morey, C.; Frandsen, F.J.; Dam-Johansen, K. Deposition of Potassium Salts on Heat Transfer Surfaces in Straw-Fired Boilers: A Pilot-Scale Study. Fuel 2000, 79, 131–139. [Google Scholar] [CrossRef]
  43. Christensen, K.A.; Stenholm, M.; Livbjerg, H. The Formation of Submicron Aerosol Particles, HCl and SO2 in Straw-Fired Boilers. J. Aerosol Sci. 1998, 29, 421–444. [Google Scholar] [CrossRef]
  44. Christensen, K.A.; Livbjerg, H. A Field Study of Submicron Particles from the Combustion of Straw. Aerosol Sci. Technol. 1996, 25, 185–199. [Google Scholar] [CrossRef]
  45. Wang, X.; Liu, Y.; Tan, H.; Ma, L.; Xu, T. Mechanism Research on the Development of Ash Deposits on the Heating Surface of Biomass Furnaces. Ind. Eng. Chem. Res. 2012, 51, 12984–12992. [Google Scholar] [CrossRef]
  46. Hindiyarti, L.; Livbjerg, H.; Glarborg, P.; Marshall, P.; Frandsen, F. An Exploratory Study of Alkali Sulfate Aerosol Formation during Biomass Combustion. Fuel 2008, 87, 1591–1600. [Google Scholar] [CrossRef] [Green Version]
  47. Glarborg, P.; Marshall, P. Mechanism and Modeling of the Formation of Gaseous Alkali Sulfates. Combust. Flame 2005, 141, 22–39. [Google Scholar] [CrossRef] [Green Version]
  48. Baxter, L.L.; Miles, T.R.; Miles, T.R., Jr.; Jenkins, B.M.; Dayton, D.C.; Milne, T.A.; Bryers, R.W.; Oden, L.L. Alkali Deposits Found in Biomass Boilers. The Behavior of Inorganic Material in Biomass—Fired Power Boilers—Field and Laboratory Experiences; NREL: Golden, CO, USA, 1996; Volume I. [Google Scholar]
  49. Jöller, M.; Brunner, T.; Obernberger, I. Modeling of Aerosol Formation during Biomass Combustion for Various Furnace and Boiler Types. Fuel Process. Technol. 2007, 88, 1136–1147. [Google Scholar] [CrossRef]
  50. Glazer, M.P.; Khan, N.A.; de Jong, W.; Spliethoff, H.; Schürmann, H.; Monkhouse, P. Alkali Metals in Circulating Fluidized Bed Combustion of Biomass and Coal: Measurements and Chemical Equilibrium Analysis. Energy Fuels 2005, 19, 1889–1897. [Google Scholar] [CrossRef]
  51. Evic, N.; Brunner, T.; Obernberger, I. Prediction of Biomass Ash Melting Behaviour—Correlation Between the Data Obtained from Thermodynamic Equilibrium Calculations and Simultaneous Thermal Analysis (STA). In Proceedings of the 20th European Biomass Conference and Exibition, Milan, Italy, 18–22 June 2012; pp. 807–813. [Google Scholar]
  52. Sommersacher, P.; Brunner, T.; Obernberger, I.; Kienzl, N.; Kanzian, W. Application of Novel and Advanced Fuel Characterization Tools for the Combustion Related Characterization of Different Wood/Kaolin and Straw/Kaolin Mixtures. Energy Fuels 2013, 27, 5192–5206. [Google Scholar] [CrossRef]
Figure 1. Schematic diagram of the 16 MWth biomass firing power plant owned by Acciona Energía in Briviesca (Burgos, Spain). See the text (previous paragraph) for descriptions of the acronyms.
Processes 08 01510 g001
Figure 2. Scheme of the model representing the power plant by means of the main stages and streams involved.
Processes 08 01510 g002
Figure 3. Total entrainment coefficients (XT) calculated on mass percentage of Al, Ca, Fe, Mg and Si measured in the fly ashes of the power plant by means of the main stages and streams involved.
Processes 08 01510 g003
Figure 4. Main elements content of the biomass, and fly and bottom (slag) ashes per kg of fed biomass (dry basis).
Processes 08 01510 g004
Figure 5. Results of the simulations for the fly ash flow rates in stages EQ3 and EQ4 according to the entrainment models GE (top), IE (middle), and TE (bottom). For each model, the four cases considered, as concerns chemical fractionation (CF100, CF102, CF110, and N°CF), are included. Black squares on the vertical axis correspond to the values measured onsite at the plant.
Processes 08 01510 g005
Figure 6. Evolution with temperatures of condensed K (a), S (b), and Cl (c), as predicted by the GE entrainment model, and condensed Cl according to the TE model (d), considering (CF100) and disregarding (Non CF) chemical fractionation. Black squares correspond to the g of the element per kg of biomass obtained from the elemental analyses of fly ash samples taken onsite at the plant.
Processes 08 01510 g006aProcesses 08 01510 g006b
Figure 7. Comparison between the predicted SO2 concentrations in the flue gas from the simulations carried out using the GE and IE models and the experimental ones obtained onsite.
Processes 08 01510 g007
Figure 8. Ash melting curves obtained for Test 1 (top) and Test 2 (bottom) disregarding (solid line) and considering (dashed line) chemical fractionation (CF100 case, GE model). Horizontal lines indicate the T15 and T70 values, respectively.
Processes 08 01510 g008
Table 1. Biomass and air flow rates (kg/h) and biomass moisture (wt.%) during the experimental campaigns performed.
TestValueBiomassMoisturePrimary AirSecondary Air
1Average13,07313.932,28954,280
Maximum12,88815.933,39456,054
Minimum13,28411.630,69951,862
RSD (%) 11.413.53.33.4
2Average13,3729.332,76250,622
Maximum13,5369.834,03651,306
Minimum13,1828.631,72049,838
RSD (%) 11.36.43.61.5
1 Relative standard deviation.
Table 2. Matching temperatures (°C) for the predicted and analytical Cl and S compositions in fly ashes. 1.
Chemical FractionationGE ModelIE ModelTE Model
ClNo CF600600600
CF 110650650600
CF 102700700600
CF 100700700600
SNo CF900–1000900–1000950–1000
CF 110950–1050900–1050950–1000
CF 1021000–11001000–1100950–1000
CF 1001050–10501050–1050950–1000
1 The first value corresponds to Test 1, which is separated from that of Test 2 by a hyphen.
Publisher’s Note: MDPI stays neutral with regard to jurisdictional claims in published maps and institutional affiliations.

