Article

Use of Gasoline, LPG and LPG-HHO Blend in SI Engine: A Comparative Performance for Emission Control and Sustainable Environment

1
Mechanical Engineering Department, University of Engineering and Technology, Lahore 54890, Pakistan
2
Department of Engineering and Chemical Sciences, Karlstad University, 65188 Karlstad, Sweden
3
School of Chemical and Materials Engineering, National University of Sciences and Technology, Islamabad 44000, Pakistan
*
Author to whom correspondence should be addressed.
Processes 2020, 8(1), 74; https://doi.org/10.3390/pr8010074
Submission received: 11 December 2019 / Revised: 2 January 2020 / Accepted: 3 January 2020 / Published: 6 January 2020
(This article belongs to the Special Issue Progress in Energy Conversion Systems and Emission Control)

Abstract

:
The rising global warming concerns and explosive degradation of the environment requires the mainstream utilization of alternative fuels, such as hydroxy gas (HHO) which presents itself as a viable substitute for extracting the benefits of hydrogen. Therefore, an experimental study of the performance and emission characteristics of alternative fuels in contrast to conventional gasoline was undertaken. For experimentation, a spark ignition engine was run on a multitude of fuels comprising of gasoline, Liquefied petroleum gas (LPG) and hybrid blend of HHO with LPG. The engine was operated at 60% open throttle with engine speed ranging from 1600 rpm to 3400 rpm. Simultaneously, the corresponding performance parameters including brake specific fuel consumption, brake power and brake thermal efficiency were investigated. Emission levels of CO, CO2, HC and NOx were quantified in the specified speed range. To check the suitability of the acquired experimental data, it was subjected to a Weibull distribution fit. Enhanced performance efficiency and reduced emissions were observed with the combustion of the hybrid mixture of LPG with HHO in comparison to LPG: on average, brake power increased by 7% while the brake specific fuel consumption reduced by 15%. On the other hand, emissions relative to LPG decreased by 21%, 9% and 21.8% in cases of CO, CO2, and unburned hydrocarbons respectively. Incorporating alternative fuels would not only imply reduced dependency on conventional fuels but would also contribute to their sustainability for future generations. Simultaneously, the decrease in harmful environmental pollutants would help to mitigate and combat the threats of climate change.

1. Introduction

Since the start of the 21st century, the world has seen an exponential interest growth in the oil sector and its derivatives, to fuel the unquenchable industrial expansion. This implied inevitable shortages of raw petroleum factions and increasing threats to the environment [1,2,3,4]. Combustion of fossil fuels yield a multitude of harmful exhaust gases, contingent on the kind of fuel and engine conditions. Increasing global warming affirmations and air contamination are of rising concern to environmental scientists and organizations around the world. A major consumer of conventional fuels, the automotive sector, essentially plays a significant role towards exhaust emissions that pollute nature. These emissions comprise of oxides of nitrogen, carbon monoxide and unburnt hydrocarbons. Modifications to engine design, air and fuel mixture settings and the quality of fuel being combusted can remarkably affect the amount and nature of ignition emissions [5,6,7,8].
Likewise, LPG utilization has soared in the previous decade and is in widespread use, even today. This may be in part due to its productive ignition attributes combined with moderately lower emissions. Higher octane properties, superior auto-ignition temperatures, more prominent combustibility and faster flame propagation capacities, present LPG driven motors as a profitable opportunity [9,10,11,12,13,14]. In nature, it is a high purity, non-harmful blend of hydrocarbons, primarily comprising of propane (C3H8) and butane (C4H10). Subsequently, a lower carbon-hydrogen composite mitigates destructive damage to the car engine as well as to the exhaust [15,16]. Lower carbon presence implies decreased carbon outflows, unsafe to human and environmental health while leading to better combustion and thermal efficiency of the engine. However, a noticeable decrease in engine performance was observed for LPG in comparison to gasoline [17,18,19,20]. In this regard, LPG was blended with a substitute fuel (hydrogen), to reduce the performance gap when compared to gasoline. Experimentation on the usefulness of hydrogen, as a fuel, began as early as the 1800’s. The advantages of utilizing hydrogen as far as low start temperatures were extensively discussed [21,22,23]. Hydrogen due to its low viscosity, wide ignitability range and high flame and dispersion rates, emerged as a sensible choice [15,24,25,26]. It was found that the CO emissions decreased as a function of hydrogen percentage addition and the air-fuel proportion [27]. Moreover, the total hydro-carbons (THC), dropped with greater hydrogen percentages. This implied that the thermal efficiency of the experimentation engine upgraded with hydrogen supplementation. A four stroke, single cylinder, spark ignition (SI) engine was also operated with a dual fuel mix of LPG, hydrogen and methane blend in the proportion of 70:30 [16,26,28,29]. Contrasted with other conventional fuels, for example, methane, propane and iso-octane, hydrogen displays a more broader scope of combustibility and has an ignition temperature which is impressively lower than that of its counterparts [17,30,31]. This has been extensively reiterated [21,32,33]. To handle the issues related with the gaseous form of hydrogen and the security concerns related with a hydrogen storage tank, it appears to be sensible to produce and utilize hydrogen as hydroxy gas (HHO) through the HHO generation unit [34,35,36]. Several studies concluded that poor burning and lower thermal efficiencies obtained through conventional fuels could be improved when a blend of hydrogen and LPG were utilized as an auxiliary fuel [37,38]. An alternative to utilizing hydrogen exists as Brown’s gas, commonly known as Oxy hydrogen gas or simply hydroxy gas. This gas is an improved mix of oxygen and hydrogen, combined together artificially and chemically. Consequently, hydrogen fractions from this arrangement can be effectively transported, stored away and utilized according to necessity [27,29].
In light of the previous researches, it is evident that a void for further investigation and experimentation exists primarily in the domain of using hydroxy gas with LPG due to the scarce availability of related literature. Therefore, the current study undertakes the setting up of an experimental system to study the performance parameters of test engine when fueled with gasoline, LPG and LPG-HHO blend combustion in SI engines. Secondly, considering environmental perspective, the test engine is operated to quantify HC, CO, NOx and CO2 emissions over the range of engine rpm for the test fuels. Then, Weibull distribution is employed to determine the accuracy of emission data. Considerable relative improvements have been acquired via LPG-HHO blend in comparison to gasoline and LPG fuels.

2. Experimental Set-Up

A 4-stroke, single cylinder, water-cooled, 219 cc SI engine was coupled with the 7-inch kart dynamometer (DYNOMITE) as shown in Figure 1. Three different fuels of varying properties, as shown in Table 1, were employed for combustion in the test engine: gasoline, LPG and LPG-HHO blend. The methods to obtain the fuel consumption for these fuels varied. A 1000 mL, graduated fuel cylinder measured gasoline consumption, a digital weight machine helped record the LPG usage while a gas rotameter identified HHO consumption in standard cubic feet per hour (scfh) units. In addition, HHO was continuously supplied to the test engine at a flow rate of 10 scfh for LPG-HHO mixture.
Owing to the inherent risk and danger of using HHO, suitable precautions were suggested and undertaken. The exhaust and air inlet ducts of the experimenting lab provided sufficient ventilation to prevent any HHO from concentrating at a single point. Moreover, a hydrogen alarm was installed in the laboratory for the express purpose of being timely cautioned in case of any HHO leakage. Furthermore, a 0.25′ plastic, Viton mini check valve with a back-pressure capacity of greater than 0.3 MPa was used to prevent any back flow of the HHO which may become a source of harm. Other necessary precautions included using rubber gloves and strategically placing several fire extinguishers around the place of experimentation. The HHO generation unit used, consisted of basic stainless-steel plates (316 L) and an electrolytic salt of KOH in the concentration of 6 g/L. Further specifications of the unit are given in Table 2. Reactions on anode and cathode with proper usage of catalysts produced hydrogen at the cathode and oxygen at the anode.
The sample probe of the exhaust gas analyzer (TESTO 350) was inserted in the tail pipe of the engine for gas sampling quantification of the combustion products which included CO, CO2, HC and NOx. Furthermore, to maintain a steady state condition of the test engine, a total of five K-type thermocouples were strategically placed. Two of these recorded the temperature of the cooling water before and after circulation through the water body, one recorded the temperature of the exhaust gases at the muffler, one recorded the exhaust manifold temperature while the remaining thermocouple recorded the lube oil temperature.

3. Test Plan

A series of experiments were conducted utilizing different fuels and their hybrids. The engine was operated on these fuels with a 60% open throttle (OT). Observations at different RPMs with successive increments in between, were made. While running at specified RPM, the engine performance parameters as well as the emission gases percentages were observed for further analysis.
Once the RPM had been maintained, the sampling probe of the TESTO 350 was inserted into the exhaust manifold and maintained for a minute in order for steady state emissions. Then, emission level data of the exhaust gases i.e., CO, CO2, HC and NOx were subjected to the Weibull distribution fit for two confidence intervals (50% and 95%) to check the adequacy of data. Simultaneously, the dynamometer, attached to the drive shaft, recorded engine performance parameters which were translated via the data box into the processing software, DYNOMAX 2010 (10.23, Land & Sea, Inc., 25 Henniker St Concord, USA). Once steady state data recording had been performed, the RPMs of the engine were increased to the next level.

4. Results and Discussion

The control experimentation comprised of combusting three fuels i.e., gasoline, LPG and the mixture of LPG with HHO. The performance parameters of brake power and brake specific fuel consumption were observed for gasoline, LPG and LPG-HHO blend. Simultaneously, the emission characteristics were compared for the fuels utilized. The reliability of the experimentation could be appreciated by the obtained results which showed that the brake power increased by 7% and emissions of CO decreased by 21% on average.

4.1. Engine Performance

Brake power analysis with the engine operating with three different fuels i.e., gasoline, LPG and LPG combined with HHO are observable in Figure 2. The graphical trends depict that brake power increases with increasing revolutions per minute of the drive shaft. Empirical and experimental relations confirm and verify the linear correlation between higher RPM’s of the engine and corresponding greater brake power. This development can be credited to the fact that more combustion energy is available at higher RPM’s and consequently the brake power increases. Experimental results showed that the blend mixture provided an increased brake power output by nearly 11% in comparison to LPG. Gasoline still emerged on top with 23% more power than the fuel blend of LPG and HHO. Despite gasoline combustion claiming to produce the greatest brake power, it can be observed that the gap in contrast to LPG has been bridged by the supplementation of HHO which can be reduced further with greater percentage of hydrogen fraction in the blend.
The trends in the brake specific fuel consumption (BSFC) of the engine pertaining to the three different fuels, are shown in Figure 3. Yet again, a similar trend as in case of brake power, the graphical plot shows that the hybrid mixture of HHO and LPG offers better fuel economy than its LPG counterpart leading to better efficiency of the engine. It was observed that BSFC of LPG-HHO blend reduced in comparison to gasoline and LPG in percentages of 42 and 17 respectively. The brake specific fuel consumption curves contrast sharply with those of the experimental outcomes previously established [39,40,41,42]. This can be explained by the higher heating value of hydrogen as compared to other two fuels. The similar BSFC trend was observed for all of the fuels employed i.e., first decrease to an optimal engine speed and then, rise as a consequence of the lower breathing time available to the engine. Furthermore, the increase in the internal friction of the reciprocating parts at higher speed implies that more fuel per power output is required which in turn increases the brake specific fuel consumption. Moreover, the fuel being consumed also varies as a function of the hydrogen to carbon ratio (H/C). With increasing H/C ratio of the fuels, the specific fuel consumption decreases and vice versa which thus implies that HHO leads all other fuels employed in the current study.
Another parameter of value is the brake thermal efficiency as shown in Figure 4a. The brake thermal efficiency denotes the percentage of brake power produced by the engine per unit input energy of a fuel.
It can be observed that LPG-HHO blend develops the highest brake thermal efficiency leading its counterparts of LPG and gasoline in percentages of 28.9 and 40, respectively. This is due to the cleaner and more rapid combustion of the hydrogen fraction in the LPG mixture which transfers its energy to the mechanical power producing systems without excessive loss to the surroundings [43,44,45]. This higher brake thermal efficiency in case of LPG-HHO blend implies the superior usability of HHO with LPG [15]. Figure 4b displays the variations in lambda value in comparison to the engine speed for gasoline, LPG and LPG-HHO fuels. The lambda reveals the lean mixing in the minimum BSFC range. After the minimum BSFC range, the nature of the incoming air-fuel blend is fuel enriched for rise in engine speed employing liquid and gaseous fuels.

4.2. Emissions

Combustion of fuels is associated with several emissions, the principle of which are CO, CO2, HC and NOx. Carbon monoxide emissions originate as a consequence of the incomplete combustion of fuels which does not permit the nascent carbon atoms to completely combine with oxygen. Carbon dioxide forms due to the complete disintegration of the hydrocarbons into their passive forms. Some levels of hydrocarbon also persist in the combustion products and occur as a result of the fuel escaping unreacted from the combustion chamber [46]. NOx emissions form as a function of the high combustion chamber temperatures and are thus dependent on the type of fuel being used [47].

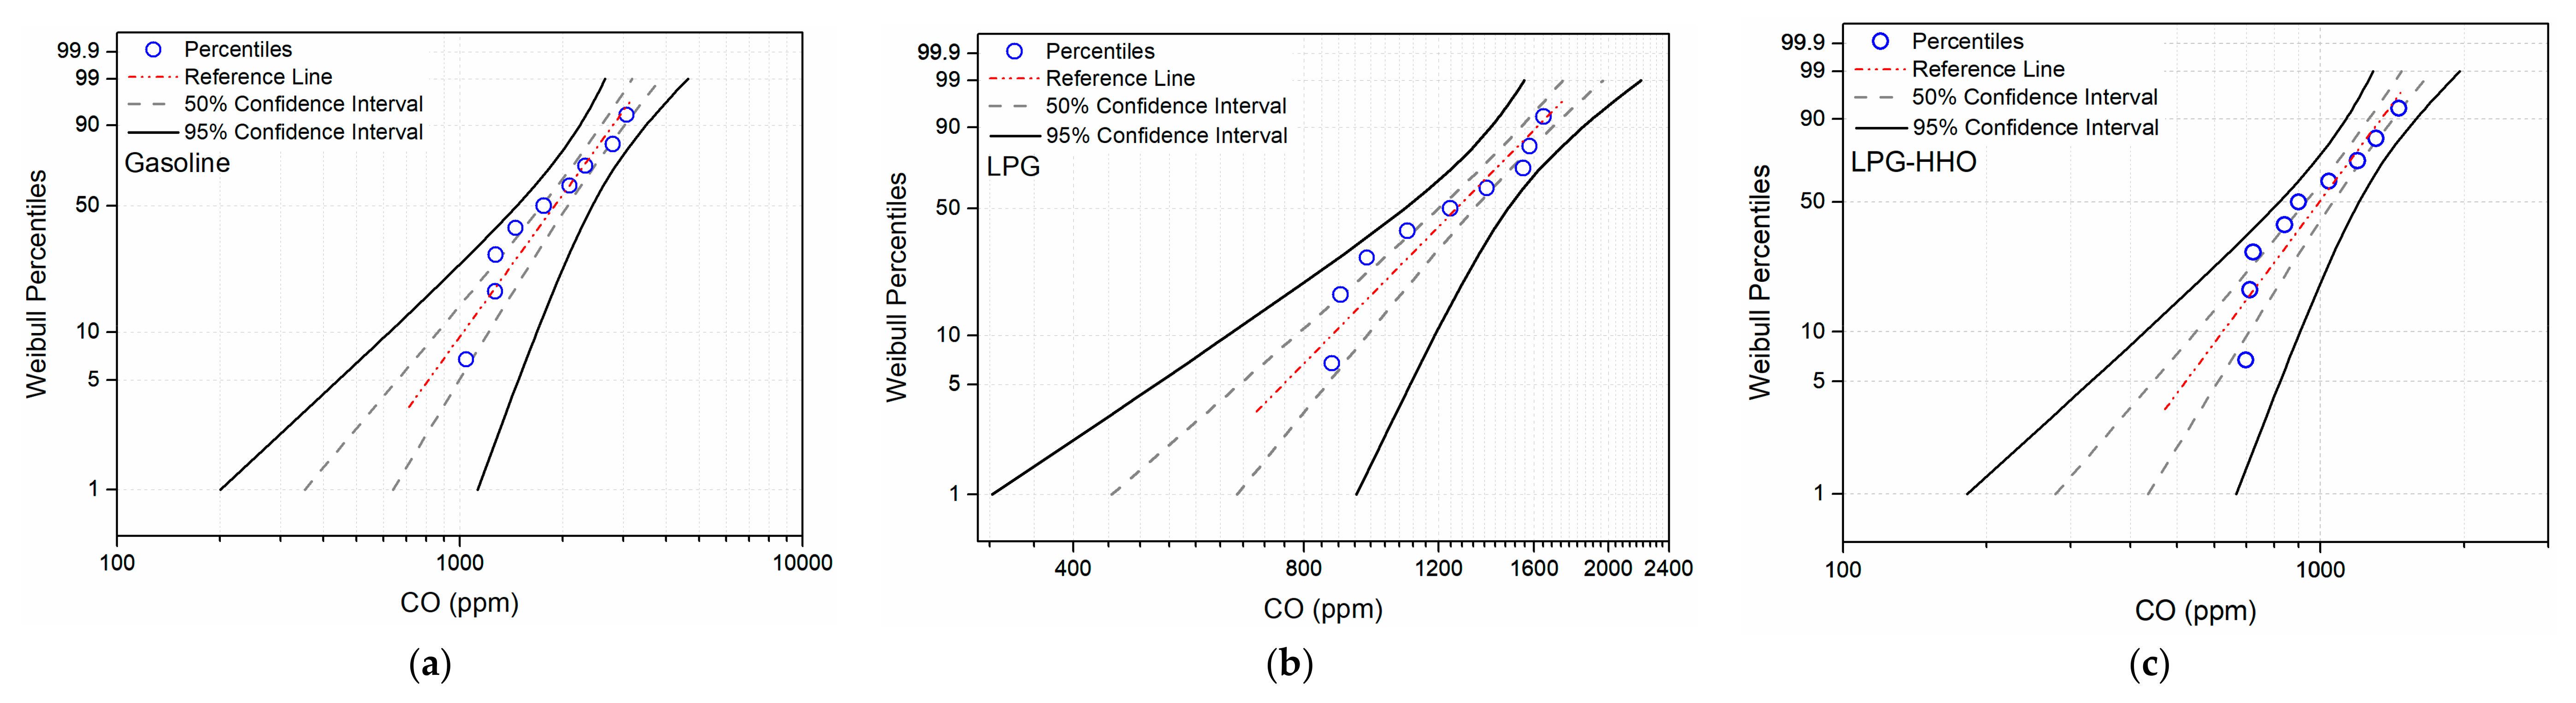
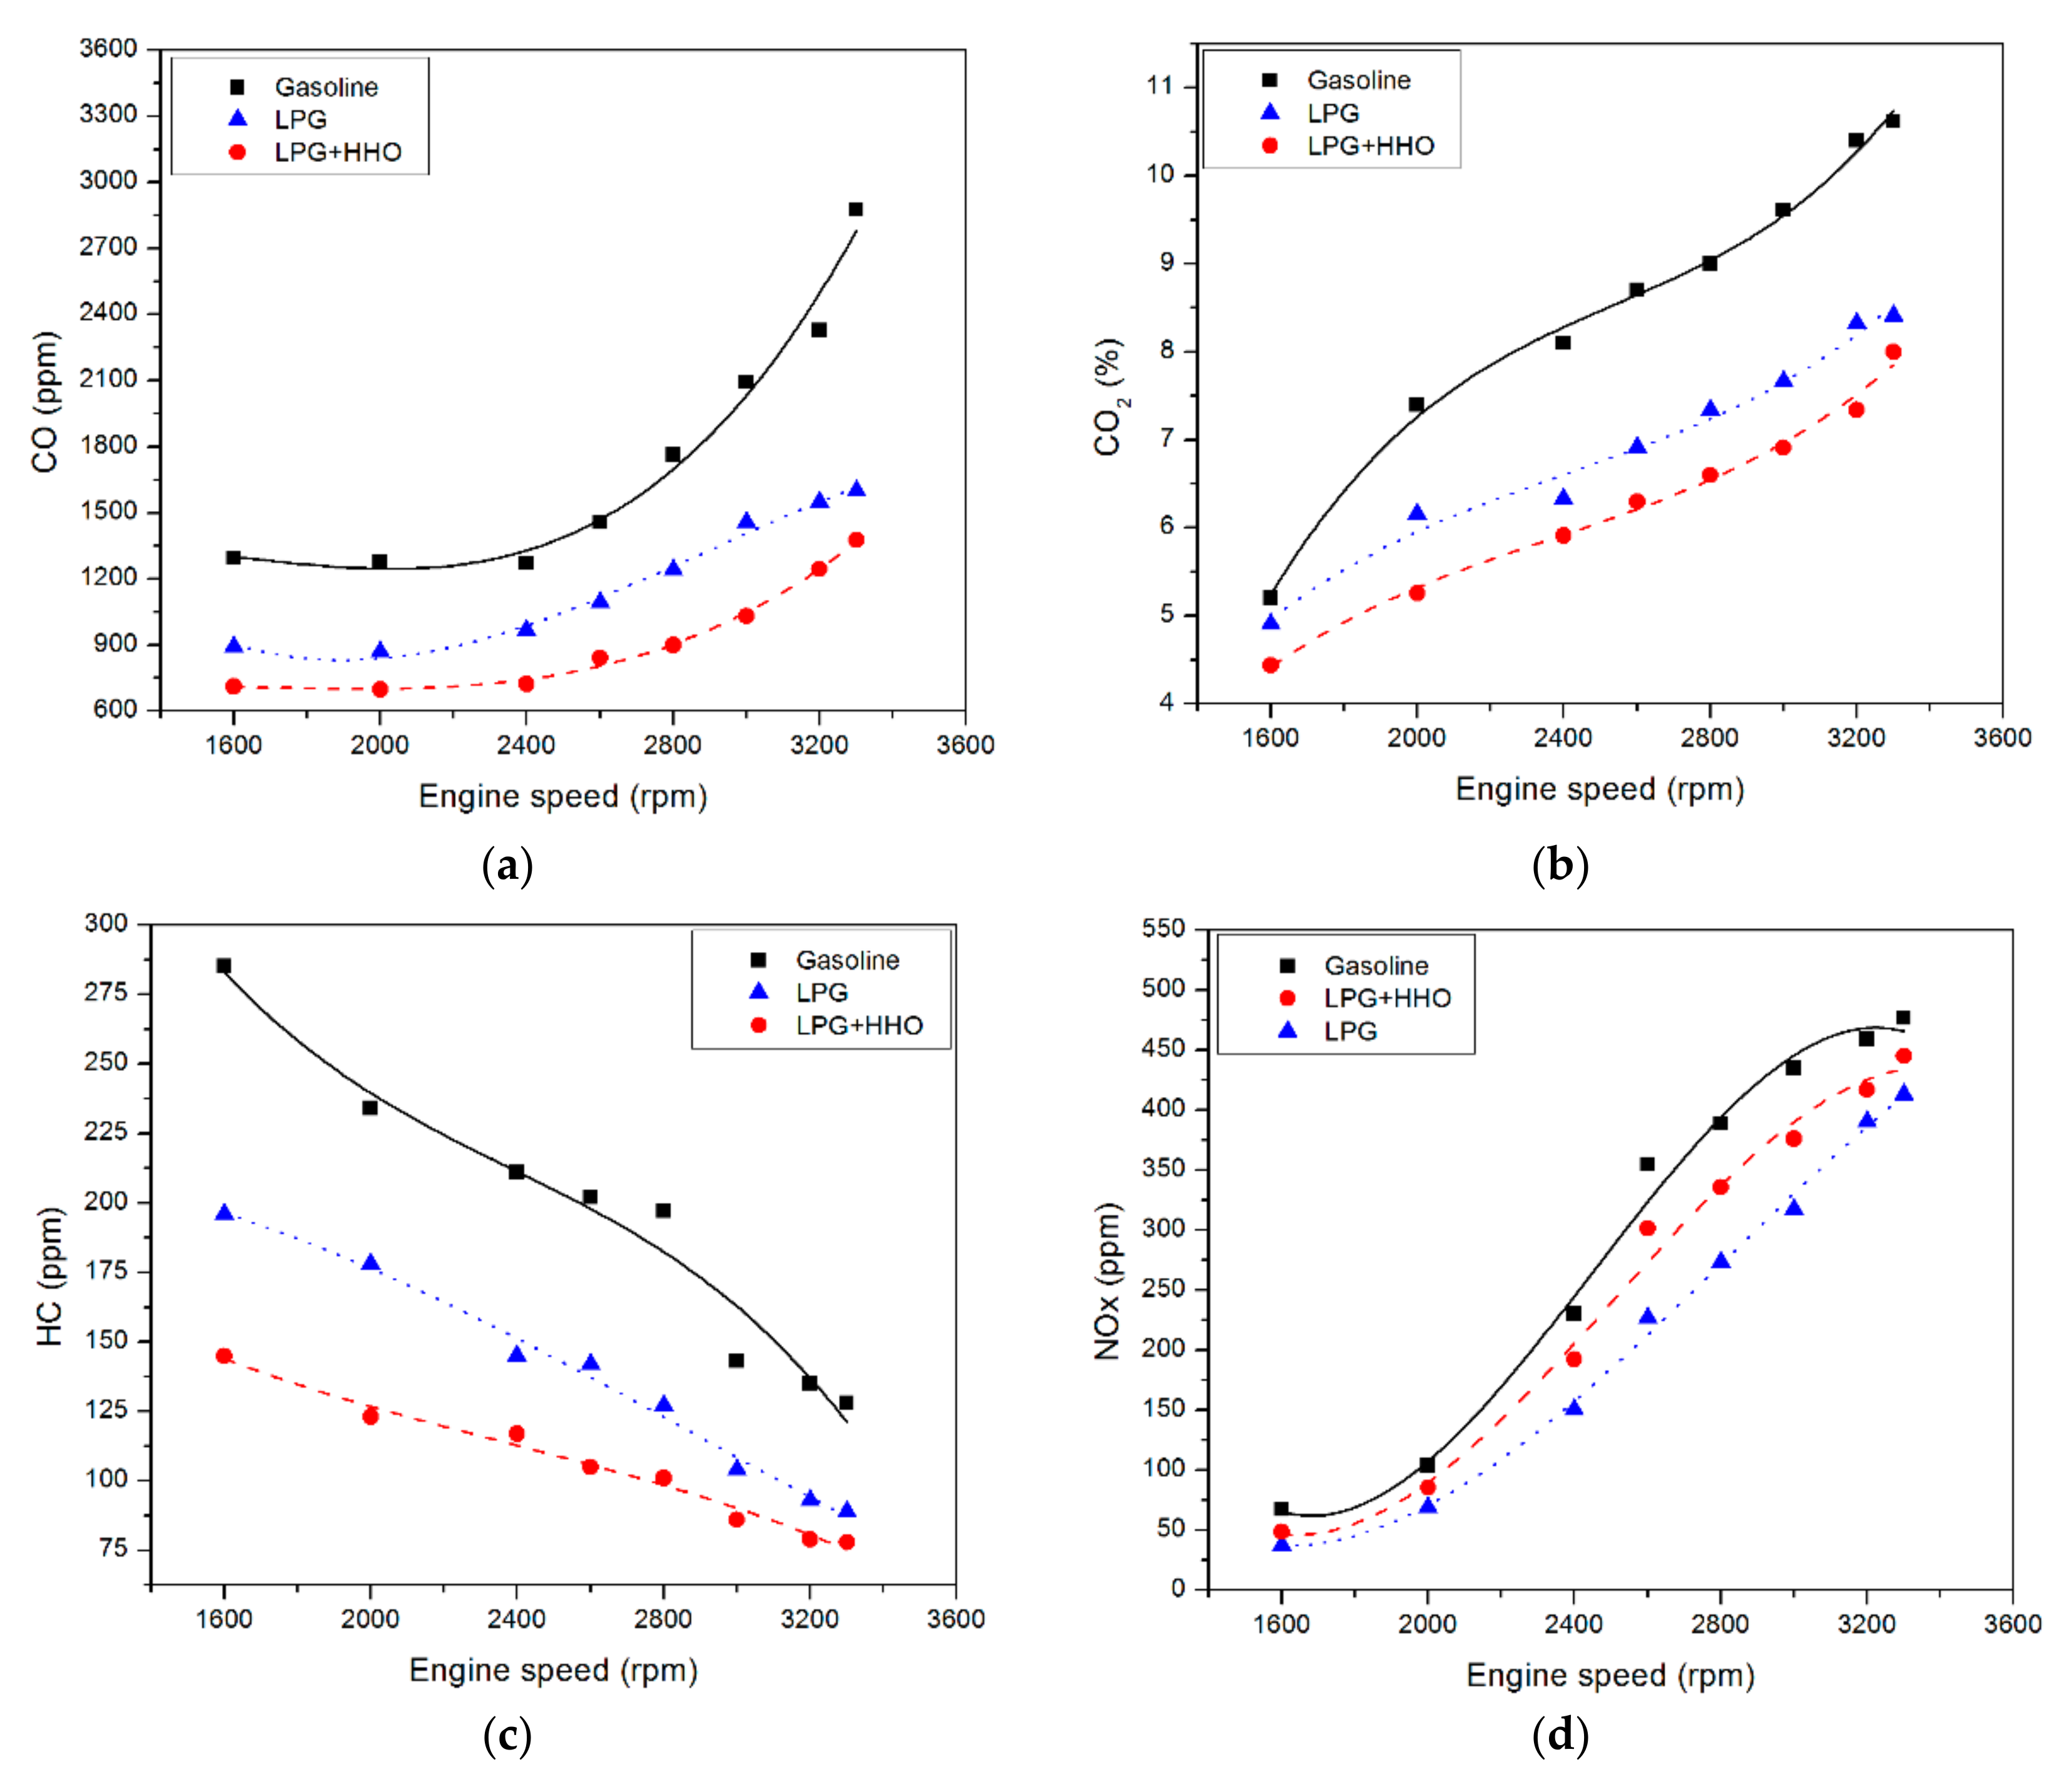
4.2.1. Carbon Monoxide (CO)

Table 3 depicts the emission data of carbon monoxide for the three fuels. Containing the highest percentage of hydrocarbons in contrast to LPG, it comes as no surprise that the carbon monoxide emissions are the highest for gasoline combustion [48,49,50]. However, CO contents are observed to be the relatively lowest in the combustion analysis of LPG and HHO hybrid fuel, with a percentage decrease of 48.1% and 19.2% when compared to gasoline and LPG respectively, since, the high flame rate of hydrogen ensures better combustion of the fuel contents [51,52,53].

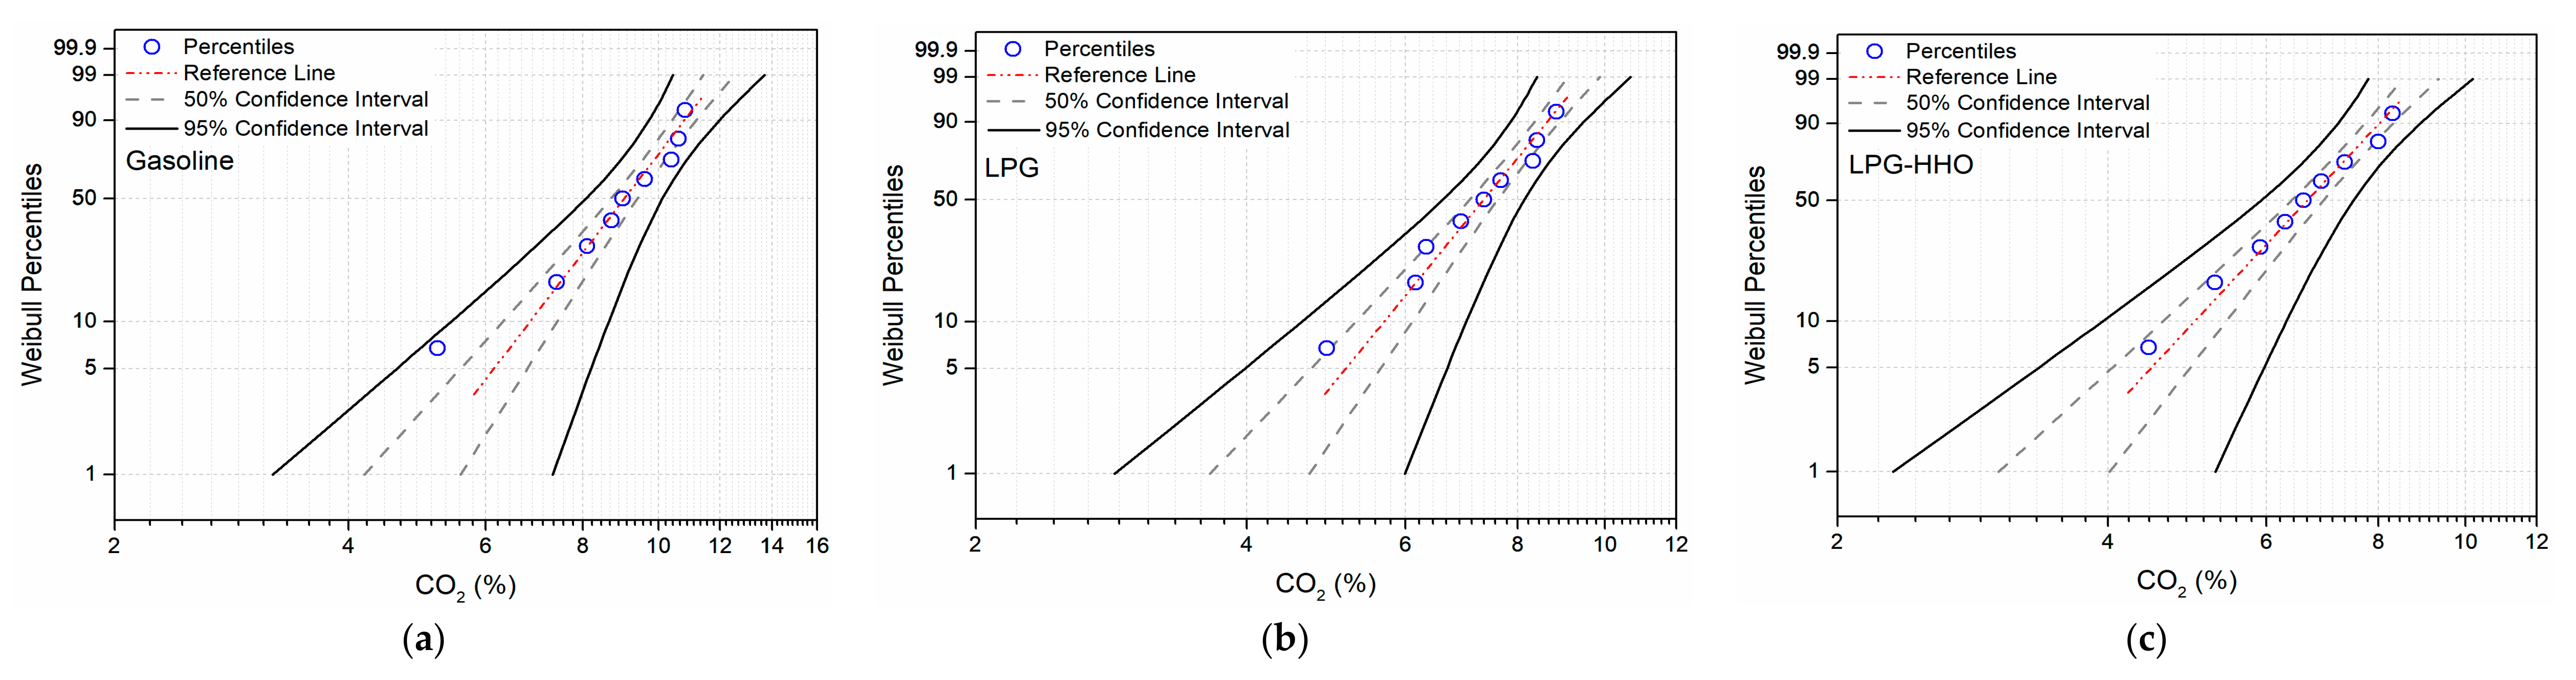
4.2.2. Carbon Dioxide (CO2)

Contrary to the reason of carbon monoxide generation, the emissions of carbon dioxide, as tabulated in Table 4, are produced as an outcome of complete combustion. The percentage of CO2 emission in case of gasoline supersedes that of LPG by 23% and yet again it is due to the higher hydrocarbon content of gasoline fuel. Interestingly enough, the supplementation of LPG with HHO yields lower average percentage of carbon dioxide since the fuel now also consists of non-hydrocarbon element, mainly hydrogen. This is evident from the 9% reduction of CO2 offered by the hybrid blend in relation to LPG [54]. Carbon dioxide is emitted as a byproduct of the chemical disintegration of carbon compounds present in the fuel mix.

4.2.3. Hydrocarbons (HC)

The data of hydrocarbon emissions is epitomized in Table 5. Compared to LPG, the percentage of hydrocarbons which make up a unit of petrol is exorbitantly higher [55]. Like CO and CO2 emissions, experimentation again favors the hybrid blend of LPG and HHO as a viable option, offering a relatively lower quantity of unburnt hydrocarbons which when compared to LPG is 21.8% lower. HC falls considerably when compared to gasoline with a decrement of 44.9%, owing to the rapid ignitability and diffusivity of the LPG-HHO blend [22,29].

4.2.4. Nitrogen Oxides (NOX)

NOx generally comprises of nitrogen dioxide (NO2) and nitric oxide (NO). Table 6 presents an insight into the NOx emissions of the three fuels. NOx formation takes place when an ample supply of air (N2, O2) is combusted at exceedingly high cylinder temperatures. Owing to the shorter combustion durations and liquid nature of gasoline, the average NOx formation is the highest and exceeds emissions of LPG-HHO blend by 11.5%. However, employing LPG-HHO blend in SI engine, produced higher NOx emission (16.1%) in contrast to LPG alone. The formation of NOx is largely governed by three parameters; duration available for combustion, physical state of fuel, oxygen and nitrogen availability and cylinder temperature [37]. The high NOx emissions via the blend is due to the substantially high temperatures of combustion occurring in the cylinders with the combustion of the hydrogen fractions [43,56].

4.3. Weibull Distribution for Exhaust Emissions

The authenticity of statistically plotted data can be verified by calculating the proportion of data lying within specified confidence intervals (CIs). As a rule of thumb, a good fit corresponds to 50% of the data being contained within the 50% CI and 95% of the observations being within the limits of the 95% CI.
Weibull distribution was applied to develop the probability plots for CO, CO2, HC and NOx for the three fuels and are represented by the Figure 5, Figure 6, Figure 7, Figure 8 respectively. The data points for these plots were then checked for 50% and 95% CIs. The fitted distributions were found to be well within the limits set by the mentioned CIs. Furthermore, the Weibull fits did not portray any heavy tails at the distributions’ upper section, again supportive about the good quality of the fit. It can be seen from Figure 5a–c that the CO emissions for gasoline, LPG and LPG-HHO lie adequately within the 95% and 50% CIs bands. Likewise, Figure 6a–c show that the CO2 emissions of gasoline, LPG and LPG-HHO, respectively, resemble that of CO by lying inside the selected CIs. The agreement to the 95% and 50% CIs shown by the Weibull distribution plots as given by Figure 7 of HC is again commendable. While the NOx distribution fits are no exception to the above (see Figure 8).
With a total of nine data points, relatively narrower confidence intervals were observed. The 50% CI for the 50th percentile in case of CO2 emissions is observed as being from 8.7% to 9.39% with a range between minus 3.5% to plus 4.4% (Figure 6a). Likewise, using LPG as a fuel, it was seen that the 50% CI for the average of CO2 lies between 7.1% to 7.6%, with an even narrower range of minus 3.7% to plus 3.5% (Figure 6b). The emissions for LPG-HHO when plotted within the 50% CI for the 50th percentile of CO2 resonated from 6.4% to 6.9% with a corresponding range interval of minus 3.1% to plus 5.2% (Figure 6c).
For gasoline fuel, 95% CI for 50th percentile of CO2 emission distribution is from 8.1% to 10.1%, which corresponds to the range of minus 11.5% to plus 12.4% (Figure 6a). Similarly, the 95% CI for the mean of CO2 emission distribution, using LPG as a fuel, is from 6.6% to 8.13%, corresponding to narrower range of minus 11.1% to plus 10.8% (Figure 6b). As an extension to the above, the 95% CI for the mean CO2 emission distribution for combustion of LPG-HHO as a fuel, is from 5.9% to 7.5%, corresponding to narrower range of minus 11.4% to plus 13.6% (Figure 6c).
An important characteristic of the CIs is that the mean data points need not necessarily be symmetric in nature. This is evident in the nine-point data set cases of CO, CO2, HC and NOx which are all positively skewed. In general, the distributions showed moderate skewness except in case of HC emissions of LPG, which was seen to be more heavily skewed as shown in Figure 7b. Moreover, the CIs about the mean were observed to be positively skewed which led to the CIs adopting an asymmetric nature.
Figure 9 describes the variation of emission contents with the increase in engine speed. It can be seen from Figure 9a that level of CO emission gradually increases with the rise in rpm. Figure 9b,d also depict raise in CO2 and NOx emission concentrations with the increase in rpm respectively. However, HC decreased with increase in engine speed for the employed fuels.

5. Conclusions

The study was carried out to analyze the performance and emission characteristics of alternative fuels which helped to bridge the power gap of gasoline and alternative fuels. The analyses of the experimental data coincided closely with current study objectives (safe environment and better performance) and can be summarized as follows:
  • LPG-HHO blend produced an average of 7% more brake power than LPG alone and the brake specific fuel consumption of LPG was on average 15% more than that of the blended fuel.
  • The average CO emissions decreased by 21% and 48.1% for LPG-HHO blend in comparison to LPG and gasoline fuel respectively.
  • The mean CO2 production was 9% lower in case of LPG-HHO blend as compared to LPG. Furthermore, the average fractions of unburnt hydrocarbon in the exhaust decreased by 21.8% in case of LPG-HHO blend when compared with LPG. However, average NOx emissions were 16.1% higher for LPG-HHO blend than that of LPG counterpart.
  • The CO, CO2, HC and NOX emission level data showed good agreement with 50% and 95% CIs using Weibull distribution.
  • Taking a holistic view on the performance and emission analysis and weighing the strengths and weaknesses of LPG-HHO blend, it can be said with considerable confidence that this fuel mixture can be utilized for extracting its inherent benefits.
  • Figure 10 compares the experimental observations subjected to an appropriate scale. It can be seen that LPG-HHO fuel mixture is advantageous over sole LPG combustion in terms of greater brake power, better specific fuel consumption, higher brake thermal efficiency, reduced carbon monoxide emissions, lower greenhouse gas byproduct formation and even lower presence of unburnt hydrocarbons in the exhaust pipe. These characteristics therefore present this alternative fuel mix as a viable source of energy, capable of competing with the traditional gasoline fractions. However, NOx emissions have undoubtedly increased in comparison to LPG only as a result of the high combustion chamber temperatures due to hydrogen fractions which can be reduced using exhaust gas recirculation technology.

Author Contributions

M.U. and M.F. designed the study, conducted parts of the experiments and write the initial draft of the paper. M.N., M.W.S., J.H. and S.J. conducted some experiments and completed the data analysis and proof read the manuscript. M.S.N., H.M.J.U. and S.I. helped to revise the manuscript and add references. A.A. proof read and edited the final manuscript. All authors have read and agreed to the published version of the manuscript.

Funding

This research received no external funding.

Conflicts of Interest

There is no conflict of interest among any author for this manuscript.

Nomenclature

A.Ampere
BSFCbrake specific fuel consumption
bTDCbefore top dead center
BTEbrake thermal efficiency
CO2carbon dioxide
COcarbon monoxide
Cisconfidence intervals
HCHydrocarbon
HHOhydroxy gas
KOHpotassium hydroxide
LPGliquefied petroleum gas
SIspark ignition
SSstainless steel
Stdevstandard deviation
VVolt
NOxoxides of nitrogen
OTopen throttle
Rpmrevolution per minute

References

  1. Klepeis, N.E.; Nelson, W.C.; Ott, W.R.; Robinson, J.P.; Tsang, A.M.; Switzer, P.; Behar, J.V.; Hern, S.C.; Engelmann, W.H. The National Human Activity Pattern Survey (NHAPS): A resource for assessing exposure to environmental pollutants. J. Expo. Sci. Environ. Epidemiol. 2001, 11, 231. [Google Scholar] [CrossRef] [PubMed] [Green Version]
  2. Farooq, M.; Saeed, M.A.; Imran, M.; Uddin, G.M.; Asim, M.; Bilal, H.; Younas, M.R.; Andresen, J.M. CO2 capture through electro-conductive adsorbent using physical adsorption system for sustainable development. Environ. Geochem. Health 2019. [Google Scholar] [CrossRef] [PubMed]
  3. Farooq, M.; Almustapha, M.N.; Imran, M.; Saeed, M.A.; Andresen, J.M. In-situ regeneration of activated carbon with electric potential swing desorption (EPSD) for the H2S removal from biogas. Bioresour. Technol. 2018, 249, 125–131. [Google Scholar] [CrossRef] [PubMed] [Green Version]
  4. Kashif, M.; Awan, M.B.; Nawaz, S.; Amjad, M.; Talib, B.; Farooq, M.; Nizami, A.S.; Rehan, M. Untapped renewable energy potential of crop residues in Pakistan: Challenges and future directions. J. Environ. Manag. 2020, 256, 109924. [Google Scholar] [CrossRef]
  5. Wang, T.; Yu, W.; Liu, F.; Fang, M.; Farooq, M.; Luo, Z. Enhanced CO2 Absorption and Desorption by Monoethanolamine (MEA)-Based Nanoparticle Suspensions. Ind. Eng. Chem. Res. 2016, 55, 7830–7838. [Google Scholar] [CrossRef]
  6. Saeed, M.A.; Farooq, M.; Andrews, G.E.; Phylaktou, H.N.; Gibbs, B.M. Ignition sensitivity of different compositional wood pellets and particle size dependence. J. Environ. Manag. 2019, 232, 789–795. [Google Scholar] [CrossRef]
  7. Landrigan, P.J.; Fuller, R.; Acosta, N.J.R.; Adeyi, O.; Arnold, R.; Baldé, A.B.; Bertollini, R.; Bose-O’Reilly, S.; Boufford, J.I.; Breysse, P.N.; et al. The Lancet Commission on pollution and health. Lancet 2018, 391, 462–512. [Google Scholar] [CrossRef] [Green Version]
  8. Marshall, J.D.; Behrentz, E. Vehicle self-pollution intake fraction: Children’s exposure to school bus emissions. Environ. Sci. Technol. 2005, 39, 2559–2563. [Google Scholar] [CrossRef]
  9. Almustapha, M.N.; Farooq, M.; Mohammed, M.L.; Farhan, M.; Imran, M.; Andresen, J.M. Modification of acidic and textural properties of a sulphated zirconia catalyst for efficient conversion of high-density polyethylene into liquid fuel. Environ. Sci. Pollut. Res. 2019. [Google Scholar] [CrossRef]
  10. Younis, M.R.; Farooq, M.; Imran, M.; Kazim, A.H.; Shabbir, A. Characterization of the viscosity of bio-oil produced by fast pyrolysis of the wheat straw. Energy Sources 2019. [Google Scholar] [CrossRef]
  11. Almustapha, M.N.; Farooq, M.; Andresen, J.M. Sulphated zirconia catalysed conversion of high density polyethylene to value-added products using a fixed-bed reactor. J. Anal. Appl. Pyrolysis 2017, 125, 296–303. [Google Scholar] [CrossRef]
  12. Imran, S.; Korakianitis, T.; Shaukat, R.; Farooq, M.; Condoor, S.; Jayaram, S. Experimentally tested performance and emissions advantages of using natural-gas and hydrogen fuel mixture with diesel and rapeseed methyl ester as pilot fuels. Appl. Energy 2018, 229, 1260–1268. [Google Scholar] [CrossRef]
  13. Ceviz, M.A.; Yüksel, F. Cyclic variations on LPG and gasoline-fuelled lean burn SI engine. Renew. Energy 2006, 31, 1950–1960. [Google Scholar] [CrossRef]
  14. Erkuş, B.; Sürmen, A.; Karamangil, M.I. A comparative study of carburation and injection fuel supply methods in an LPG-fuelled SI engine. Fuel 2013, 107, 511–517. [Google Scholar] [CrossRef]
  15. Rahman, M.A. Induction of hydrogen, hydroxy, and LPG with ethanol in a common SI engine: A comparison of performance and emission characteristics. Environ. Sci. Pollut. Res. 2019, 26, 3033–3040. [Google Scholar] [CrossRef] [PubMed]
  16. Rahman, M.A. Effect of induction hydroxy and hydrogen along with algal biodiesel blend in a CI engine: A comparison of performance and emission characteristics. Environ. Sci. Pollut. Res. 2019, 26, 9552–9560. [Google Scholar] [CrossRef] [PubMed]
  17. Gerini, A.; Monnier, G.; Bonetto, R. Ultra Low Emissions Vehicle Using LPG Engine Fuel; SAE Technical Paper; SAE Mobilus: Warrendale, PA, USA, 1996. [Google Scholar]
  18. Al-Baghdadi, M.A.S. A simulation model for a single cylinder four-stroke spark ignition engine fueled with alternative fuels. Turk. J. Eng. Environ. Sci. 2007, 30, 331–350. [Google Scholar]
  19. Bakar, R.A.; Ismail, A.R. Green engines development using compressed natural gas as an alternative fuel: A review. Am. J. Environ. Sci. 2009, 5, 1–11. [Google Scholar]
  20. Ouellette, P.; Douville, B.; Hill, P.G.; Ursu, B. NOx reduction in a directly injected natural gas engine. Gas Engines Altern. Fuels 1998, 31, 3. [Google Scholar]
  21. Shirwani, R.; Gulzar, S.; Asim, M.; Umair, M.; Al-Rashid, M.A. Control of vehicular emission using innovative energy solutions comprising of hydrogen for transportation sector in Pakistan: A case study of Lahore City. Int. J. Hydrogen Energy 2019. [Google Scholar] [CrossRef]
  22. Babariya, D.; Oza, J.; Hirani, B.; Akbari, G. An experimental analysis of SI engine performance with HHO as a fuel. Int. J. Res. Eng. Technol. 2015, 4, 12. [Google Scholar]
  23. Thanga, H.H.; Lalnunthari, J. A review on the application of hydrogen rich gas as fuel supplement in CI and SI internal combustion engine. Res. J. Eng. Sci. 2016, 2278, 9472. [Google Scholar]
  24. Plass, H.J., Jr.; Barbir, F.; Miller, H.P.; Veziroğlu, T.N. Economics of hydrogen as a fuel for surface transportation. Int. J. Hydrogen Energy 1990, 15, 663–668. [Google Scholar] [CrossRef]
  25. Kale, K.A.; Dahake, M.R. The effect of HHO and biodiesel blends on performance and emission of diesel engine—A review. Int. J. Curr. Eng. Technol. 2016. [Google Scholar] [CrossRef]
  26. Gopidesi, R.K.; Premkartikkumar, S.R. Abating environmental pollutants of a diesel engine by using emulsified fuel. Int. J. Ambient Energy 2019. [Google Scholar] [CrossRef]
  27. Nabil, T.; Dawood, M.M.K. Enabling efficient use of oxy-hydrogen gas (HHO) in selected engineering applications; transportation and sustainable power generation. J. Clean. Prod. 2019, 237, 117798. [Google Scholar] [CrossRef]
  28. Arat, H.T. Alternative fuelled hybrid electric vehicle (AF-HEV) with hydrogen enriched internal combustion engine. Int. J. Hydrogen Energy 2019, 44, 19005–19016. [Google Scholar] [CrossRef]
  29. Thangaraj, S.; Govindan, N. Investigating the pros and cons of browns gas and varying EGR on combustion, performance, and emission characteristics of diesel engine. Environ. Sci. Pollut. Res. 2018, 25, 422–435. [Google Scholar] [CrossRef]
  30. Cracknell, R.F.; Alcock, J.L.; Rowson, J.J.; Shirvill, L.C.; Üngüt, A. Safety considerations in retailing hydrogen. SAE Trans. 2002, 111, 922–926. [Google Scholar]
  31. Ma, J.; Su, Y.; Zhou, Y.; Zhang, Z. Simulation and prediction on the performance of a vehicle’s hydrogen engine. Int. J. Hydrogen Energy 2003, 28, 77–83. [Google Scholar] [CrossRef]
  32. Myung, C.-L.; Ko, A.; Lim, Y.; Kim, S.; Lee, J.; Choi, K.; Park, S. Mobile source air toxic emissions from direct injection spark ignition gasoline and LPG passenger car under various in-use vehicle driving modes in Korea. Fuel Process. Technol. 2014, 119, 19–31. [Google Scholar] [CrossRef]
  33. Al-Rousan, A.A.; Alkheder, S.; Sa’ed, A.; Al-Dabbas, M.A. Green transportation: Increasing fuel consumption efficiency through HHO gas injection in diesel vehicles. Int. J. Glob. Warm. 2018, 14, 372–384. [Google Scholar] [CrossRef]
  34. Fontana, G.; Galloni, E.; Jannelli, E.; Minutillo, M. Performance and Fuel Consumption Estimation of a Hydrogen Enriched Gasoline Engine at Part-Load Operation; SAE Technical Paper; SAE Mobilus: Warrendale, PA, USA, 2002. [Google Scholar]
  35. White, C.M.; Steeper, R.R.; Lutz, A.E. The hydrogen-fueled internal combustion engine: A technical review. Int. J. Hydrogen Energy 2006, 31, 1292–1305. [Google Scholar] [CrossRef]
  36. Wang, Y.; Kannan, P.; Halden, R.U.; Kannan, K. A nationwide survey of 31 organophosphate esters in sewage sludge from the United States. Sci. Total Environ. 2019, 655, 446–453. [Google Scholar] [CrossRef]
  37. Lata, D.B.; Misra, A.; Medhekar, S. Effect of hydrogen and LPG addition on the efficiency and emissions of a dual fuel diesel engine. Int. J. Hydrogen Energy 2012, 37, 6084–6096. [Google Scholar] [CrossRef]
  38. Subramanian, B.; Ismail, S. Production and use of HHO gas in IC engines. Int. J. Hydrogen Energy 2018, 43, 7140–7154. [Google Scholar] [CrossRef]
  39. Mistry, C.S. Comparative assessment on performance of multi cylinder engine using, C.N.G.; LPG and Petrol as a fuel. SAE Trans. 2005, 114, 222–226. [Google Scholar]
  40. Choodum, N. A Study of the Optimized Conditions for a Closed-Loop HHO Production System Using A/C Power Supply; Allen Institute Al: Seattle, WA, USA, 2017. [Google Scholar]
  41. Ozcanli, M.; Bas, O.; Akar, M.A.; Yildizhan, S.; Serin, H. Recent studies on hydrogen usage in Wankel SI engine. Int. J. Hydrogen Energy 2018, 43, 18037–18045. [Google Scholar] [CrossRef]
  42. Togun, N.K.; Baysec, S. Prediction of torque and specific fuel consumption of a gasoline engine by using artificial neural networks. Appl. Energy 2010, 87, 349–355. [Google Scholar] [CrossRef]
  43. Niculae, G.; Chiriac, R.; Apostolescu, N. Effects of HRG Gas Addition on Performance and Emissions of a SI Engine Fuelled with Liquefied Petroleum Gas. Rev. Chim. 2013, 64, 574. [Google Scholar]
  44. Jambukiya, B.K.; Patel, K.B.; Rathod, G.; Patel, T.M. Effect of HHO gas on fuel consumption and brake thermal efficiency of four stroke spark ignition engine with variable compression ratio. IOSR J. Mech. Civ. Eng. 2016, 13, 74–80. [Google Scholar]
  45. Reddy, A.V.K.; Kumar, T.S.; Kumar, D.K.T.; Dinesh, B.; Saisantosh, Y.V.S. Improving the efficiency of IC engine using secondary fuel. Int. J. Technol. Enhanc. Emerg. Eng. Res. 2014, 2, 52–64. [Google Scholar]
  46. Cheng, W.K.; Hamrin, D.; Heywood, J.B.; Hochgreb, S.; Min, K.; Norris, M. An Overview of Hydrocarbon Emissions Mechanisms in Spark-Ignition Engines; SAE Technical Paper; SAE Mobilus: Warrendale, PA, USA, 1993. [Google Scholar]
  47. Dec, J.E.; Yang, Y. Boosted HCCI for high power without engine knock and with ultra-low NOx emissions-using conventional gasoline. SAE Int. J. Engines 2010, 3, 750–767. [Google Scholar] [CrossRef]
  48. Ji, C.; Wang, S. Experimental study on combustion and emissions performance of a hybrid hydrogen–gasoline engine at lean burn limits. Int. J. Hydrogen Energy 2010, 35, 1453–1462. [Google Scholar] [CrossRef]
  49. Dhariwal, A.K.; Nayyar, A. Utilization of HHO gas with Diesel fuel in stationary compression Ignition Engine. Ski. Res. J. 2018, 8, 52–59. [Google Scholar]
  50. Pandhurnekar, C.P.; Zodape, S.P. Santilli’s Magnecules and Their Applications. Am. J. Mod. Phys. 2017, 6, 64–77. [Google Scholar]
  51. Ramanjaneyulua, B.; NarayanaReddyb, S.L.; NarasaRajua, G.; VidyaSagarRajua, R. Performance Analysis on 4-S Si Engine Fueled With HHO Gas and LPG Enriched Gasoline. Int. J. Eng. Res. Technol. 2013, 2. [Google Scholar] [CrossRef]
  52. Ozcan, H.; Yamin, J.A.A. Performance and emission characteristics of LPG powered four stroke SI engine under variable stroke length and compression ratio. Energy Convers. Manag. 2008, 49, 1193–1201. [Google Scholar] [CrossRef]
  53. Park, C.; Kim, C.; Choi, Y.; Won, S.; Moriyoshi, Y. The influences of hydrogen on the performance and emission characteristics of a heavy duty natural gas engine. Int. J. Hydrogen Energy 2011, 36, 3739–3745. [Google Scholar] [CrossRef]
  54. De Morais, A.M.; Justino, M.A.M.; Valente, O.S.; de Morais Hanriot, S.; Sodré, J.R. Hydrogen impacts on performance and CO2 emissions from a diesel power generator. Int. J. Hydrogen Energy 2013, 38, 6857–6864. [Google Scholar] [CrossRef]
  55. Demirbas, A. Fuel properties of hydrogen, liquefied petroleum gas (LPG), and compressed natural gas (CNG) for transportation. Energy Sources 2002, 24, 601–610. [Google Scholar] [CrossRef]
  56. Jeffrey, J.A.; Subramanian, M. Experimental Analysis of Performance and Emission Parameters of Neem Oil Ethyl Ester and HHO Gas Addition with Neem Oil Ethyl Ester in a Single Cylinder Four Stroke Compression Ignition Engine. Int. J. Eng. Res. Appl. 2014, 4, 23–28. [Google Scholar]
Figure 1. Schematic of experimental set-up.
Processes 08 00074 g001
Figure 2. Comparisons of brake power at various engine speed for gasoline, LPG and LPG-HHO blend.
Processes 08 00074 g002
Figure 3. Comparisons of brake specific fuel consumption (BSFC) and engine speed for gasoline, LPG and LPG-HHO blend.
Processes 08 00074 g003
Figure 4. (a,b) Comparisons of brake thermal efficiency and lambda for gasoline, LPG and LPG-HHO blend.
Processes 08 00074 g004
Figure 5. (ac) Weibull probability plot of CO for 50% and 95% CI using gasoline, LPG and LPG-HHO respectively.
Processes 08 00074 g005
Figure 6. (ac) Weibull probability plot of CO2 for 50% and 95% CI using gasoline, LPG and LPG-HHO respectively.
Processes 08 00074 g006
Figure 7. (ac) Weibull probability plot of HC for 50% and 95% CI using gasoline, LPG and LPG-HHO respectively.
Processes 08 00074 g007
Figure 8. (ac) Weibull probability plot of NOX for 50% and 95% CI using gasoline, LPG and LPG-HHO respectively.
Processes 08 00074 g008
Figure 9. (ad) Comparison of CO, CO2, HC and NOx for gasoline, LPG and LPG-HHO.
Processes 08 00074 g009
Figure 10. Graphical summary of the operational and emission parameters for gasoline, LPG and LPG-HHO blend.
Processes 08 00074 g010
Table 1. Test fuels properties a employed in study.
PropertiesGasolineLPGH2
Physical stateLiquidGasGas
Research octane number97103>130
Calorific value (MJ/kg)4646.1120
A/F14.717.234
Density (kg/liter at 15.48 °C)0.730.001898.27 × 10−5
Abbreviations. A/F: Air to fuel ratio. a PSO: Pakistan State Oil.
Table 2. HHO Unit Details.
Plate MaterialDimensionsNo. of PlatesElectrodesPlates GapInputCatalystHHO Production
SS (316-L)16.5 × 16.5 × 0.1 cm24Two anode plates at center separated with seal, while two cathode plates on both ends of reactor2 mm0–60 A
35 V
KOH in distilled water0–10 (scfh)
Table 3. 50% and 95% confidence intervals for mean CO emissions.
FuelCarbon Monoxide (CO%)
Mean ± StdevMean ± 50% CIMean ± 95% CI
Gasoline0.189 ± 0.0720.189 ± 0.0170.189 ± 0.055
LPG0.125 ± 0.0310.125 ± 0.0070.125 ± 0.023
LPG-HHO0.098 ± 0.0280.098 ± 0.0060.098 ± 0.021
Abbreviations. Stdev: Standard deviation, CI: Confidence interval.
Table 4. 50% and 95% confidence intervals for mean CO2 emissions.
FuelCarbon Dioxide (CO2%)
Mean ± StdevMean ± 50% CIMean ± 95% CI
Gasoline8.87 ±1.818.87 ± 0.428.87 ± 1.39
LPG7.21 ± 1.267.21 ± 0.297.21 ± 0.97
LPG-HHO6.56 ± 1.256.56 ± 0.296.56 ± 0.96
Table 5. 50% and 95% confidence intervals for mean HC emissions.
FuelHydrocarbon (HC%)
Mean ± StdevMean ± 50% CIMean ± 95% CI
Gasoline0.018 ± 0.0060.018 ± 0.0010.018 ± 0.004
LPG0.013 ± 0.0040.013 ± 0.0090.013 ± 0.003
LPG-HHO0.010 ± 0.0020.010 ± 0.0060.010 ± 0.002
Table 6. 50% and 95% confidence intervals for mean NOX emissions.
FuelOxides of Nitrogen (NOX%)
Mean ± StdevMean ± 50% CIMean ± 95% CI
Gasoline0.033 ± 0.0140.033 ± 0.0030.033 ± 0.011
LPG0.026 ± 0.0130.026 ± 0.0030.026 ± 0.010
LPG-HHO0.029 ± 0.0140.029 ± 0.0030.029 ± 0.011

