1. Introduction
Microwave (MW) heating is widely employed in high-temperature processes such as fly ash sintering [
1], asbestos detoxification [
2], and other functional material synthesis [
3,
4]. Huang and Hwang [
5] reported its use in iron making; they were able to obtain sponge iron using MWs with a frequency of 915 MHz. Voiry et al. [
6] developed a simple, rapid method to reduce graphene oxide into pristine graphene using MW pulses with a duration of 1–2 s. Louzguine-Luzgin et al. [
7] employed MWs to heat and sinter metallic glass to obtain Ni
60Nb
20Ti
15Zr
5 porous samples with a diameter of 20 mm. The fields of these studies differ greatly (environmental, chemical, and metallurgical processes); nevertheless, all required temperatures of 1000 °C or more, making MW heating ideal for these processes.
To efficiently maintain a high temperature in a sample during MW heating, the sample material must be able to convert MW energy into thermal energy. Many researchers have attempted to improve MW absorption by controlling the shapes and composite structures of nanocomposites. In particular, many slurries and powders with good MW absorption have been developed [
8,
9,
10], as these forms make it convenient to transfer MW energy into the material. Zhu et al. [
8] synthesized carbon nanotube (CNT)/SiC porous nanocomposites via the in situ reaction of multi-walled CNTs and Si powder induced by the reaction of Na and I
2 under MW heating. They reported that their nanocomposites exhibited excellent MW absorption properties, were lightweight, and showed promise for utilization as structural materials in aerospace applications. Yang et al. [
10] used a facile two-step approach to fabricate NiO nanorings on SiC with a novel hierarchical architecture.
The relationship between the powder (or slurry) density and its MW heating behavior is an important issue. Wang et al. [
11] investigated graphene platelets to develop TiBaO
3 fibers and concluded that the loss of graphene platelets increased dramatically when the loading reached the percolation threshold. Yoshikawa et al. [
12] measured the complex permittivity and direct current (DC) conductivity of FeO(OH)/C and trichloropropane/C mixtures, and analyzed the measured data using the percolation theory. They analyzed the DC conductivity and permittivity using a mixing rule based on effective medium approximation. In this procedure, the permittivity of carbon was estimated by fitting the measured average permittivity data. These studies indicate that MW heating has a positive effect on processing. However, many aspects of the heating behavior of powders in MW fields remain unknown. Therefore, it is difficult to predict heating behavior to achieve high-temperature processing efficiently.
The Maxwell Garnett equation has been somewhat successful in predicting the MW heating behavior of mixed powders. This is because heating prediction using the first law of thermodynamics becomes possible by improving the MW absorption of the powder. Wang et al. [
11] reported that the heating behavior of mixed powders of BaTiO
3 fibers and graphene is consistent with the Maxwell–Garnett rule at low densities. They predicted the heating behavior of the fiber using the shape factor of the Maxwell–Garnett rule derived from an elliptic model. Yoshikawa et al. [
12] employed the Maxwell–Garnett rule as an important index to calculate the penetration depth and dielectric constant of a mixture. However, mixed powders with dielectric loss differences typically exhibit high-absorption characteristics at a certain density, which is not expressed by the Maxwell–Garnett prediction. We previously reported [
13,
14,
15] that SiC fiber-γAl
2O
3 mixtures display anomalous absorption at a weight ratio of
WSiC/Wtotal = 0.6. Interestingly, the expanded Clausius–Mossotti formula, which is based on the Maxwell–Garnett prediction, does suggest this special MW absorption. [
15] However, following derivation, the suggested mechanism seems to be different from the phenomenon. In this study, mixtures of SiC fiber-
MO
2 (
M = Ce, Zr) with various compositions were heated by an MW electrical field, which was separated from the MWs using a TE103 cavity. The heating rate and maximum temperature were investigated using time-temperature plots, and the corresponding dielectric properties were measured by cavity perturbation methods. Furthermore, the thermal distribution was investigated at the microlevel by employing two-color thermometry.
2. Experimental Methods
SiC fibers were obtained via granularity control of SiC wires (ZMI-S1E08PX, Ube Industry Co., Ltd.; wire diameter: 11 μm, resistivity: 100 Ω⋅cm, density: 2.51 g⋅cm−3, and thermal conductivity: 2.5 W∙m−1∙K−1). The SiC wires were pulverized in a blender (WB-1, Osaka Chemical Co., Ltd.) for 1.5 min. The obtained fibers were analyzed by scanning electron microscopy (SEM; TM3000, Hitachi High-Technologies, Co., Ltd., Minatoku, Tokyo, Japan) and laser diffractometry (MT3300EXII, Microtrac Bel. Co., Ltd., Oosakashi, Oosaka, Japan). The particle size distributions of the CeO2 (Kojundo Chem. Ltd., CEO03PB, density: 7.65 g·cm−3) and ZrO2 powders (Kojundo Chem. Ltd., ZR007PB, density: 3.21 g·cm−3) were also analyzed by laser diffractometry. Sample mixtures comprising SiC fiber with CeO2 or ZrO2 were prepared with various mass ratios by adding CeO2 or ZrO2 to the SiC fibers. The mixtures were then analyzed by SEM and energy-dispersive X-ray spectrometry (EDX).
To investigate their MW heating behavior, the sample mixtures were heated by 2.45 GHz MW irradiation from a semiconductor amplifier. The heating system consisted of rectangular waveguides (WRJ-2, 109.1 × 56.4 × 149.3 ± 5 mm) with a signal generator, a semiconductor amplifier, an E-H tuner, a plunger, and an isolator. The MWs were focused on an iris to form a
TE103 wave in a cavity. The iris had a 28.5 mm-wide slit that was parallel to the direction of the electric field. The plunger was placed at the end of the waveguide. This system enabled us to separate the electric and magnetic fields of the MWs spatially. [
16,
17] The SiC fiber and metal oxide were stirred with a spatula for 5 min. Mortar was not used for mixing so as to prevent the fibers from being destroyed in the mixing step. Subsequently, 1.0 g of the obtained mixture was loaded into a quartz holder (φ13 × 15 × 40), naturally tapped, and placed at an electric field node of the cavity (denoted by
Emax, where the magnetic field is zero). The temperature was monitored using a two-color thermometer (Chino Ltd., R-FAQINL, IR-FL5NN02). The forward power was fixed at 80 W, and the reflected power was controlled to be under 1 W. The atmosphere was controlled with Ar gas (6 N) at a flow rate of 0.15 L·min
−1 to prevent the SiC fibers from burning. In these experiments, the heating rate (K·s
−1) between 300 and 320 °C, and the maximum temperature were evaluated as absorption properties. All experiments were repeated three times to eliminate uncertainties from the results (
N = 3).
In order to analyze the heating mechanisms of the mixtures, the real and imaginary parts of their relative permittivities were measured using the cavity perturbation method. [
18] As the absorption amount of MW energy is linearly proportional to the imaginary parts of the relative permittivities, the MW absorption can be estimated by measuring the imaginary parts of the relative permittivities in a material. The cavity perturbation method calculates the dielectric constant of a substance by measuring the change in both the resonance frequency and
Q factor generated when a sample is inserted into a container in which the TM mode resonance exists, with a network analyzer. Here, the influence of the quartz holder was eliminated by setting the state comprising the container and quartz holder as the initial state. The measurement system consisted of a cylindrical cavity (⌀90 × 25 mm) and a network analyzer (ADVANTEST R3767CG). Silica tubes were used as sample holders as they have a negligible effect on the MW distribution. Placing the sample in the cavity disturbs the
Q factor and resonance frequency of the cavity, depending on the sample properties. The network analyzer monitored the
Q factor and resonance frequency of the system, and the real and imaginary parts of the relative permittivity (
εr’ and loss tangent (tan
δ)) were calculated based on these values. The cavity exhibited the TM
010 mode (where the Poynting vectors of the electromagnetic field are vertically controlled by the magnetic field), and a perturbation coefficient of 1.848 was employed. The resonance frequency was 2551 MHz.
The Thermera-NIR2 system (Mitsui Photonics Ltd.) was employed to measure the temperature distribution above 800 °C using two wavelengths (800 nm and 975 nm). This system enable us to measure the temperature of a particle in the mixture, [
19] with a spatial resolution of 2.2 μm/pixel. The accuracy of the analyzed temperature was ±1%.
3. Results
Figure 1 shows the particle size distribution of the pure SiC fibers and CeO
2 and ZrO
2 powders, along with Scanning Electron Microscope (SEM) images (×900, 15 kV) of the SiC fiber-CeO
2 and SiC fiber-ZrO
2 mixtures. The average particle sizes of the SiC fiber, CeO
2 powder, and ZrO
2 powder were 34.7 μm (standard deviation (SD): 0.3 μm), 0.3 μm (SD: 0.3 μm), and 10.2 μm (SD: 0.1 μm), respectively. Although a spherical shape was assumed for the measurements, the average particle diameters obtained by laser diffractometry were comparable to those observed in the SEM images. The SEM images also depict the mixed powder morphologies; in the SiC fiber-CeO
2 mixture, the CeO
2 particles are positioned around the SiC fibers, whereas in the SiC fiber-ZrO
2 mixture, the ZrO
2 powder has agglomerated to form secondary particles.
Figure 2 shows the dependence of the heating rate, maximum temperature, electrical permittivity (
ε′), and dielectric loss tangent (tan
δ) on the CeO
2 composition in the SiC fiber-CeO
2 mixture. Both the heating rate (K⋅s
−1) between 300 and 320 °C, and the maximum temperature decreased as the CeO
2 content increased (
Figure 2a). This tendency was also observed for the electrical permittivity and loss tangent, as shown in
Figure 2b. This decrease in the loss tangent (tan
δ) suggests that the MW absorption of the mixture decreases as the CeO
2 content increases. Hence, the SiC fiber contributes to better MW absorption.
The SiC fiber-ZrO
2 mixture showed different characteristics (
Figure 3). The heating rate, maximum temperature, and dielectric loss tangent all exhibited a maximum value at
WZrO2/Wtotal = 0.3. The heating rate and maximum temperature increased with the ZrO
2 content at weight ratios of ≤0.3, while they decreased at weight ratios of ≥0.3 (
Figure 3a). A similar tendency was observed for the dielectric loss tangent, as shown in
Figure 3b. As the weight ratio of ZrO
2 increases from 0 to 0.3, the amount of SiC fiber in the sample decreases. However, at these low ZrO
2 contents, the loss tangent, which represents the MW absorption behavior of the mixed powder, increases with the amount of ZrO
2. We surmise that this increase arises from the effects of small plasma generation on the contact surface or heat conduction. However, this hypothesis cannot explain the fact that both, the loss tangent and heating rate, exhibit a maximum value at the weight ratio of 0.3 because the MWs in the cavity perturbation method for the loss tangent is too weak to generate the plasma.
The addition of ZrO
2 introduces hot spots to the mixed powder upon MW heating.
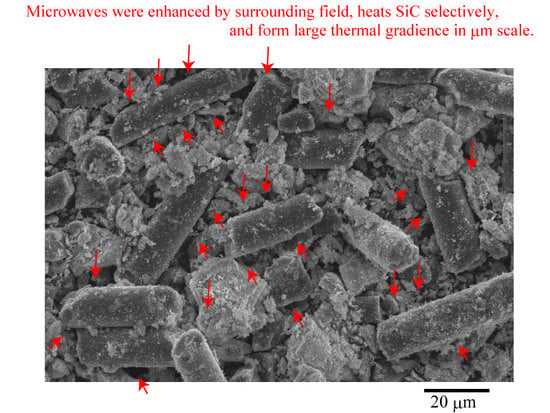
Figure 4 shows the thermal distribution in the SiC fiber-ZrO
2 mixtures with different compositions. First, we observed that the mixture has large thermal gradients at the microlevel. Many researchers have suggested that MW heating forms large thermal gradients at the micro- or nanoscale; [
20,
21,
22] his study demonstrates this in detail. At weight ratios of
WZrO2/Wtotal ≤ 0.3, the number of hot spots and their temperature increase as the ZrO
2 content increases. The areas of low-temperature decrease with increasing ZrO
2 content, as shown in blue in the figure. It can be inferred that the SiC fibers are responsible for the hot spots because the regions behind these hot spots are rod shapes, as shown in
Figure 4. The hot spots themselves are spherical and appear to be positioned along the fibers. At weight ratios of
WZrO2/Wtotal > 0.3, the number of hot spots and their temperature decrease as the mass of ZrO
2 increases, which is due to the decrease in the SiC content (a good MW absorber). Notably, the number of hot spots and their maximum temperature were greatest at the weight ratio of
WZrO2/Wtotal = 0.3.
4. Discussion
In this section, we will discuss the possible reasons why the absorption rate of SiC was improved by the addition of a small amount of ZrO
2 powder. We can rule out the effect of polarizability, as the polarizability of SiC fibers is not improved upon surrounding them with ZrO
2 particles. The absorption properties of a particle in an electromagnetic field are well known, and are determined by [
23,
24]:
where
α is the polarizability of a particle,
ε1 is the permittivity of the particle medium,
ε2 is the permittivity of the surrounding medium,
V is the volume of single particles,
L is the shape factor of the particles, and the absorption cross-section is the imaginary part of
α (Im[
α]). In this case, the term
can be expanded to the term
. From this equation, the difference between the second term and the first term is the particle polarizability. Hence, the MW absorption of a SiC fiber, which is the imaginary part of
α (Im [
α]), is always increased by surrounding it with a medium that has a negative complex permittivity.
We also note that thermal conduction and optically thin plasma do not contribute to MW absorption, although they may contribute to MW heating. From the results of the cavity perturbation tests, the electrical loss tangent was observed to increase for the 70% SiC fiber-ZrO2 mixture. As this measurement was carried out with a weak MW output without heating or plasma, MW absorption was improved in the corresponding composition even if there was no plasma or heat conduction.
There are two conceivable hypotheses regarding the cause of this anomalous heating behavior. The first is related to the fact that the distance between SiC fibers is controlled by the additive. The conventional theory suggests that the electric field intensity between two fibers should increase as the distance between them decreases (
Figure S1 in the Supplementary Materials). However, some researchers have reported that anomalous electrical absorptions can occur when fibers are at appropriate distances without additives. [
14,
15]. If this special distance is achieved when ZrO
2 is added, this could explain the anomalous behavior we observed. The second hypothesis is based on the existence of an interface state formed by additives and SiC fibers. The interface responds sensitively to electrical energy. If the electric field is concentrated on SiC due to the surrounding ZrO
2, which significantly contributes to the MW absorption, it could also explain the fact that the MW absorption of SiC with a low amount of ZrO
2 is higher than that of pure SiC.
Unfortunately, the first hypothesis cannot fully explain the phenomena, and the second hypothesis is contradicted by the fact that there was no significant difference between the distributions of the ZrO
2 and CeO
2 additives in the mixtures (measured by SEM-EDX, refer to
Figure S2 in the Supplementary Materials). To help determine the exact mechanisms involved, future research would involve investigating the heating behavior of additives with various radii.
5. Conclusions
SiC fiber-MO2 (M = Ce, Zr) mixtures were heated by an 80 W MW electrical field to investigate their heating rate and maximum temperature. The heating rate, maximum temperature, and dielectric constant of the SiC fiber-CeO2 mixture increased as the SiC fiber content increased, while a maximum was noted at a weight ratio of WZrO2/Wtotal = 0.3 in the SiC fiber-ZrO2 mixture. Considering that the electrical loss agreed with the heating behavior, this anomalous behavior was assigned to an increase of MW absorption. As ZrO2 was added to the SiC fiber up to this weight ratio, the number of hot spots observed at the microlevel increased with the increase of ZrO2. Above this ratio, the hot spot number and maximum temperature decreased. This phenomenon could be related to the distance between SiC fibers or their interfaces.
As well as new engineering applications for microwave processing, this research also highlighted a new phenomenon in microwave processing with regard to large temperature gradients on the order of micrometers. In order to describe a temperature gradient of such magnitude, numerical simulations should be performed with the assumption that the particle–air interfaces have thermal resistance about 103 times larger than in air. The interface heating mechanism under an electromagnetic field should be analyzed. The results indicate that various interfacial reactions can be accelerated by increasing such temperature gradients. The promotion of chemical reactions under MW heating reported by many chemists is, therefore, likely to be a consequence of these large temperature gradients in the sub-micrometer range. This study provides important evidence to explain the acceleration of chemical reactions.

 ,
, 


