Review

Review and Modeling of Crystal Growth of Atropisomers from Solutions

1
GlaxoSmithKline, Chemical Development, 1250 S. Collegeville Road, Collegeville, PA 19426, USA
2
Department of Chemistry, New York University, New York, NY 10003, USA
3
Bristol-Myers Squibb Co. Chemical and Synthetic Development, 1 Squibb dr, New Brunswick, NJ 08901, USA
*
Author to whom correspondence should be addressed.
Processes 2019, 7(9), 611; https://doi.org/10.3390/pr7090611
Submission received: 30 July 2019 / Revised: 16 August 2019 / Accepted: 29 August 2019 / Published: 10 September 2019
(This article belongs to the Special Issue Modeling and Control of Crystallization)

Abstract

:
In this paper, theories on anisotropic crystal growth and crystallization of atropisomers are reviewed and a model for anisotropic crystal growth from solution containing slow inter-converting conformers is presented. The model applies to systems with growth-dominated crystallization from solutions and assumes that only one conformation participates in the solute integration step and is present in the crystal lattice. Other conformers, defined as the wrong conformers, must convert to the right conformer before they can assemble to the crystal lattice. The model presents a simple implicit method for evaluating the growth inhibition effect by the wrong conformers. The crystal growth model applies to anisotropic growth in two main directions, namely a slow-growing face and a fast-growing face and requires the knowledge of solute crystal face integration coefficients in both directions. A parameter estimation algorithm was derived to extract those coefficients from data about temporal concentration and crystal size during crystallization and was designed to have a short run time, while providing a high-resolution estimation. The model predicts a size-dependent growth rate and simulations indicated that for a given seed size and solvent system and for an isothermal anti-solvent addition crystallization, the seed loading and the supersaturation at seeding are the main factors impacting the final aspect ratio. The model predicts a decrease of the growth inhibition effect by the wrong conformer with increasing temperature, likely due to faster equilibration between conformers and/or a decrease of the population of the wrong conformer, if of low energy, at elevated temperatures. Finally, the model predicts that solute surface integration becomes the rate-limiting mechanism for high solute integration activation energies, resulting in no impact of the WC on the overall crystal growth process.

1. Introduction

The manufacture of small organic molecules with therapeutic values relies heavily on crystallization from solution. Crystallization, which is a purification and a separation step, is often the final step of drug substance manufacture. The product of crystallization is typically a population of individual crystals with distributed sizes and satisfying target quality attributes in terms of chemical and physical purity. In addition, physical properties such as Particle Size Distribution (PSD) and flowability are becoming part of the product quality attributes as both affect the end use of crystalline drug substances, i.e., drug product manufacturing.
Most organic crystals are anisotropic and the aspect ratio (or elongation factor) is often utilized as a descriptor of anisotropicity. Typically, two dimensions are sufficient to describe anisotropicity since these parameters were found to correlate well with powder flowability, which is one of the main the properties affecting drug product manufacturing. Crystal anisotropicity implies that at least two crystal faces grow at different rates. Hence, the determination of the aspect ratio requires the computation of crystal growth rate in two directions, namely, fast-growing faces and slow-growing faces, for simplicity. A peculiarity of organic molecules is their ability to adopt multiple conformations due to their inherent flexibility. It is intuitive to expect that molecular flexibility can affect crystal growth kinetics of organic molecules, which ultimately, can impact crystals’ final size and aspect ratio distributions.

2. Literature

In this section, we present a brief chronological evolution of the accounts of the literature dedicated to understanding and modelling crystal growth, in general, and crystallization of atropisomers, in particular. A pioneering work on predicting crystal habit was put forward by Häuy [1], who postulated that crystals’ faces would naturally have simple intercepts with crystal axes. As a result, the faces with the lowest indices would be the dominant faces in the final crystal. In the early 1900s, Wulf [2] and Gibbs [3] proposed that crystal shape is dictated by energetics and postulated that the final crystal shape is that which results in the minimum free energy. This idea is based on the 2nd law of thermodynamics, which stipulates that everything being equal, a closed system outside equilibrium has a tendency to minimize its overall energy on its way to equilibrium. Several years later, Donnay and Harker [4] reported that the internal crystal structure should have an effect on the growth of individual faces, with the fast-growing faces being formed from the shortest interplanar distances. They based their theory on the work of Bravais [5] on the geometry of crystals and on the postulate of Friedel [6], who proposed that crystals should have a triple periodicity and orientations. Several years after the publication of this theory now known as the BFDH law, Hartman and Perdock [7,8,9] introduced the concept of the Periodic Bond Chain (PBC), which categorizes crystal faces based on their locations with respect to PBC vectors, namely: Kinked (K), Stepped (S) and Flat (F). This theory, which later on came to be known as the attachment energy (AE) theory, is based on energetics and predicts that the fastest growing faces correspond to the largest energy release upon layer (slice) attachment to the crystal surface. BFDH and the AE theories are very useful tools in obtaining ab initio estimates of crystal habit based on crystal lattice data and a variety of software, such as HABIT [10,11,12], SHAPE [13], Cerius [14], MORANG [15], POLYPACK [16] and COMPASS [17], was developed based on these theories. However, a major drawback of these theories comes from the fact that they neglect the effect of the media and environment of the growing crystals on crystal habit and/or predict the shape of a single crystal rather than a distribution of shapes as often encountered in practice. It is well known that solvents, impurities and additives can have a dramatic effect on crystal habit and morphology [18]. Recently, a large body of work has contributed to the understanding and prediction of crystal habit from solutions: Doherty’s group relied on the BCF spiral growth theory [19] to develop modelling tools for predicting crystal shape, taking into consideration crystal growth media (i.e., solvent, additives and imposters effects on crystal habit) [20,21,22,23,24,25,26,27,28]. The group of Roberts developed a general framework for Morphological Population Balances (MPBs) based on size-independent growth of single phases [29,30,31,32,33,34]. Recently, Chan et al. [35] introduced the concept of Relative Growth Effect Curvature (RGEC), which is a simple and rapid method based on binding energy calculations to estimate solvent effects on growth rates of individual faces. The theories listed above are very useful in obtaining a prediction of crystal habit but they still have few major drawbacks when applied to industrial crystallization;
  • They usually require the knowledge of crystal structure data, which is usually not available for substances in early stage of development.
  • They are often valid under idealized conditions, often neglecting the effect of crystallization media and mixing (BFDH and AE theories) or assuming low supersaturation (models based on BCF theory).
  • They often assume a size-independent growth rate (MPB models, RGEC).
As mentioned above, the aspect ratio is typically used as a habit descriptor. It requires the measurement of the PSD in two dimensions, i.e., large and small sizes. This approach allows simple determination of two characteristic sizes, typically via image analysis. However, since crystals are 3D objects, measurement of only two dimensions may seem intuitively insufficient. In practice, 2D PSD measurements were found to be sufficient to describe 2D sizes of crystals when the following approaches/assumptions are valid:
  • Symmetry in the 3rd dimension (i.e., width equals to depth) [36,37,38,39,40,41].
  • Neglecting the growth in the 3rd dimension because of negligible growth rate compared to the growth in the other two dimensions [42,43].
If the 3rd dimension is not reflected by the aspect ratio approach, the results deviate significantly from the actual crystal shape as reported by Patience and Rawlings [44]. If applicable, the approach of modeling crystal shape via only two characteristic crystal sizes offered simplicity so that other phenomena often occurring during industrial crystallization, such as nucleation, agglomeration and breakage, can be included in models for predicting crystal size and habit.
Models utilizing the aspect ratio approach to describe crystal habit are typically semi-empirical and require estimating kinetic parameters needed for the computation from experimental data. Hence, these models always require parameter estimation algorithms to extract kinetic parameters from experiment data. These models are usually based on the resolution of two-dimensional Population Balance Equations (2D-PBEs), along with mass and heat balances. Several 2D-PBEs models were presented in the last two decades with an approximately chronological increasing level of complexity. Puel et al. [45] proposed a two-dimensional PBE including nucleation and assuming size-independent growth rates and, later on, expanded it to include size-dependent growth rates through crystal size dependence of diffusion [46]. Mattews and Rawlings [47] presented a PBE-based model with size-independent crystal growth in which crystal shape was variable only due to breakage. 2D-PBE models including crystal breakage were also reported elsewhere [38,39]. Briesens [40] presented a reduced system of PBEs considering a size-independent crystal growth and nucleation. Oullion et al. [43] reported a size-independent 2D-PBE, which includes secondary surface nucleation and contact nucleation to predict the sizes of the two main faces of plate-like crystals. Shoji and Takiyama [48] presented a 2D-PBE which includes the effect of temperature on crystal growth rate, allowing for the prediction of temperature profiles, resulting in improved aspect ratios. More complex MPBs for size-independent growth rate systems were developed by the group of Roberts [29,30,31,32,33,34].
An additional complexity related to the crystallization of organic molecules is their ability to adopt multiple conformations due to rotation around σ-bonds which typically require energy barriers, E b , of less than 2 kcal/mol [49], resulting in a large number of short-lived conformers. As a result, kinetics of conformation inter-conversion are typically fast compared to other phenomena occurring during nucleation and growth of organic molecules such as dessolvation, diffusion and surface integration. Therefore, historically, equilibration between conformers was rarely considered as impacting nucleation and crystallization kinetics [50]. However, there is steady growing evidence that improved potency of specific conformers under physiological conditions led to an increase in the focus on relatively stable conformers, as evidenced by recent reports [51,52,53,54,55,56,57,58,59,60,61,62,63,64,65,66,67,68]. Since crystallization is the main purification and separation unit operation in the development of new medicines, studies about molecular flexibility and the effect of the presence of conformation stability and conversion in solution on nucleation, crystal growth and polymorphism has also been steadily increasing [50,69,70,71,72,73,74,75,76,77,78,79,80,81,82].
If conformers in solution are relatively stable, resulting in a half-life that is sufficiently long compared to the NMR, solution NMR analysis can be utilized to detect and quantify conformations in solution [50,83,84,85].
Slow inter-converting conformers were first coined “atropisomers” by Kuhn [86], who defined them as conformations in which free rotations are “frozen” or temporarily prevented by steric hinderance and/or intra-molecular interactions such as H-bonds. Oki [84] further refined the term “atropisomers” as conformers with a half-life of 1000 s or more. In practice, if different atropisomers result in different potencies and physiological responses, the long half-lives can result in atropisomers acting as de facto isomers within the timeframe of their ADME. Indeed, Laplante et al. [59,60] classified atropisomers based on the effect of the species’ half-life on drug developability: atropisomers with a long half-life and better drug/target specificity are more prone to development as they can provide targeted action before converting to less active atropisomers. On the other hand, developability is compromised for atropisomers with good activity but short half-life as they can convert to less active atropisomer (and possibly be eliminated) before reaching their target.
As mentioned above, in most cases, E b for conformational change is sufficiently low (Approximately ≤ 2 kcal/mol) to result in fast kinetics. As a result, molecules can easily adopt the conformation that crystallizes before integrating a crystal surface [80,87,88,89,90,91,92,93]. Solute conformation is often changed during its transit from the bulk solution to the crystal surface integration sites, which can explain the occurrence of conformational polymorphism [70,87,90,94,95,96,97,98,99,100]. It is generally accepted that the conformational change is affected by crystal surface forces which modify the conformation of the integrating species into the conformation that favors crystal packing [86,87,90,94,95,96,97,98,99,100,101,102]. It was reported that in the absence of intramolecular H-bonds, crystal forces can distort molecules by up to 4.8 kcal/mol [79]. As a result, the presence of multiple conformers in solution is not expected to have an effect on crystal growth if the energy difference between conformers is low and in the range of 2 kcal/mol [49]. The formation of crystals with conformations present in low populations in solution was attributed to the effect of crystal forces on the solute conformation [79]. High-energy conformers often favor crystal packing due to their expected higher molecular surface area and, as such, their formation is facilitated by crystal forces [79]. Yu et al. [69] reported that the effect of crystal forces on conformational change diminishes for crystal lattices involving inter-molecular H-bonds. Crystal surface forces affecting the conformation of crystallizing solute were also reported for the crystallization of macromolecules [102]. Based on ab initio calculations, Allan et al. [103] reported that crystal packing may have moderate to low effect on solute conformation. However, results from ab initio calculation should be considered with cause as they depend upon on the computational approach and degrees of freedom considered [104]. Without reporting the E b , Bras et al. [105] reported that the conformation contained in the main polymorph of thioimidazole disulfide reported elsewhere [106] is present as a minor conformer in solution, suggesting the likelihood of the crystal surface affecting its conformation before crystallization.
Solvents can affect conformation de-solvation energies, which can impact growth rates [107]. In addition, solvents can affect E b , which affects the kinetics of conversion and the population of dissolved conformers [108]. Solvents can also stabilize conformers by dimerization [80,81,82,109,110,111], in particular, at elevated concentrations [112] and for molecules of low molecular weight [80]. Recently, it was reported that for Fenoxycarb, which exhibits several conformers with calculated E b ranging from 1.2 to 7.2 kcal/mol, solutions conformers were all different from four crystal conformers [113]. This result implicitly indicates a negligible effect of crystal surface on modifying the conformation upon crystallization when E b is below 10 kcal/mol.
For slow inter-converting conformers in solution, Petit et al. [114] reported that crystallization rates are enhanced if the dominant conformation in solution is the same as the crystal conformation. A recent account reported a decrease of three fold in crystal growth of an acetanilide derivative due to the presence of two distinct conformations in solution, indicating an effect of slow-interconverting conformers on crystal growth rates [115]. Recently, it was reported that weak solvent–solute can favor the presence of low-energy conformers in solution: The low-energy conformer of tolbutamide is stabilized in toluene by intramolecular H-bonds and dimerization, resulting in an increased challenge to crystallization, due an E b of ca. 14.3 kcal/mol was required to convert to more crystallizable conformers [111].
The analysis of the prior art suggests that for relatively rigid molecules where a conformational change requires relatively high E b (>8–10 kcal/mol), the effect of crystal surface forces on the conformation of the integrating species is significantly decreased [50,71,90,111]. In this situation, the solute must have the right conformation at the integration site and the conformation that crystallizes is expected to be present in solution for crystallization to occur in acceptable durations.
Table 1 summarizes literature accounts of the crystallization of atropisomers with E b 10   kcal / mol . This data shows the presence of the same atropisomers in both solution and solids and supports the assumption that for systems with high E b , crystal forces have negligible effect on the conformation of the crystallizing species.

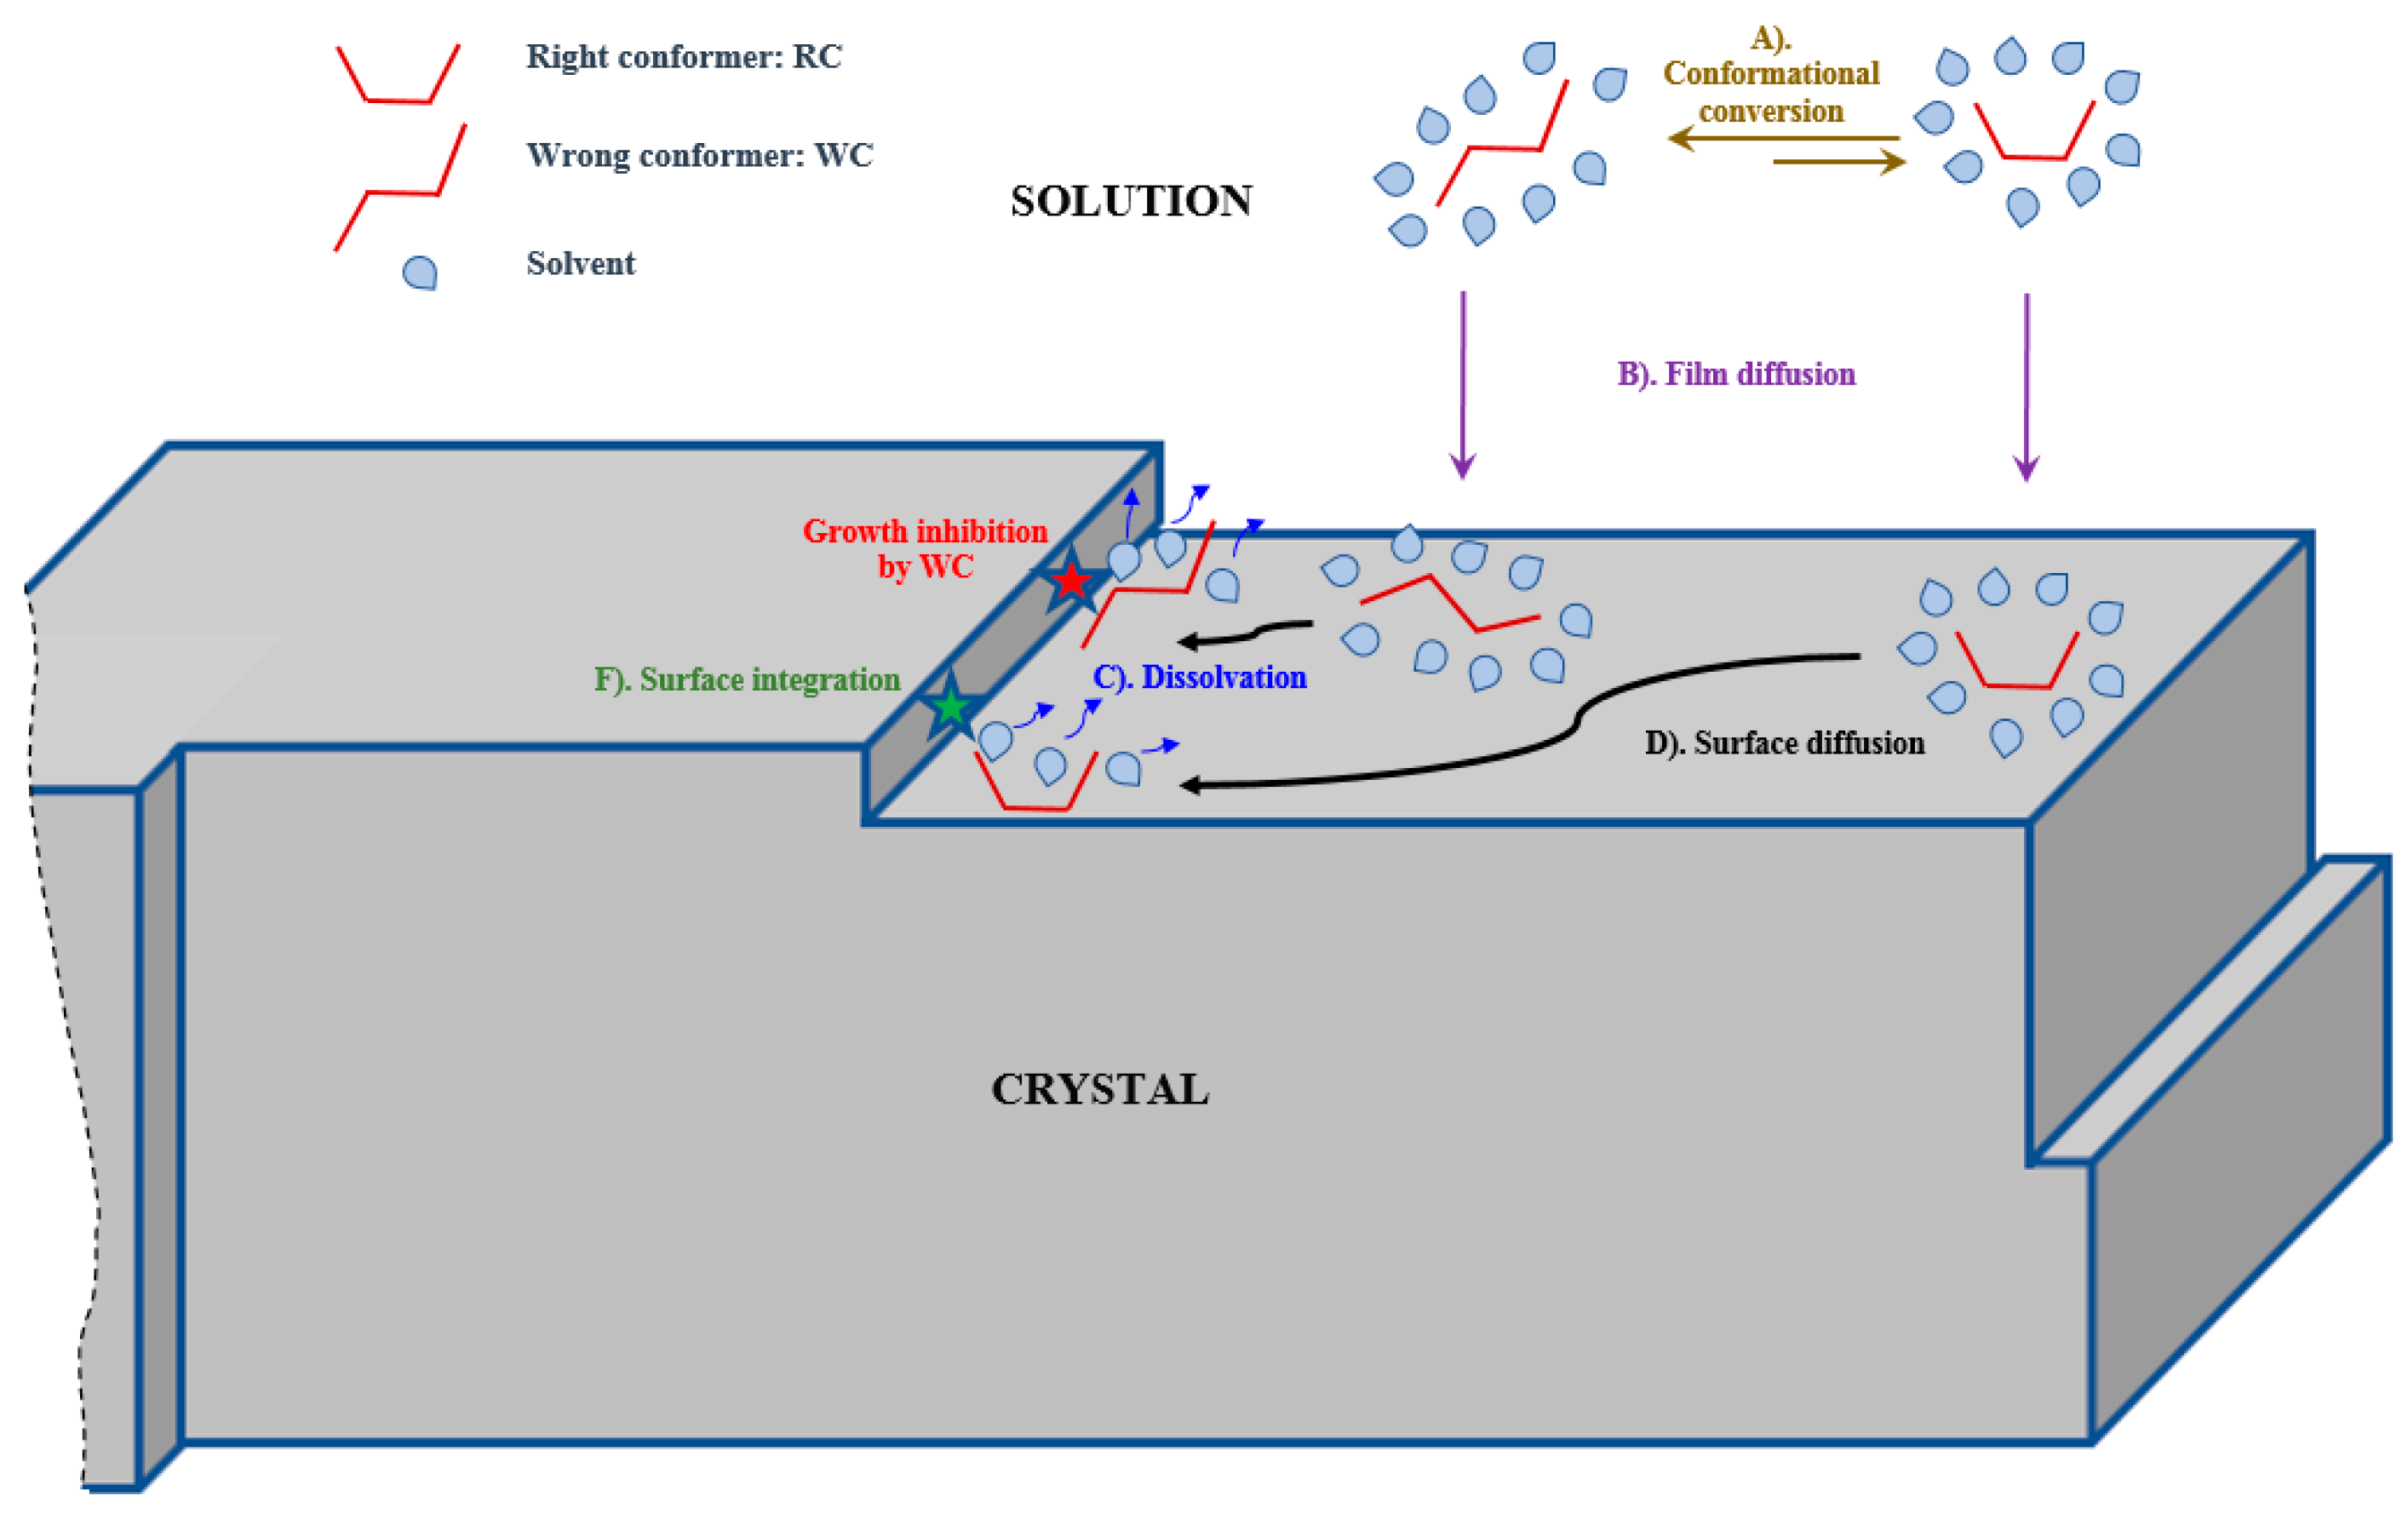
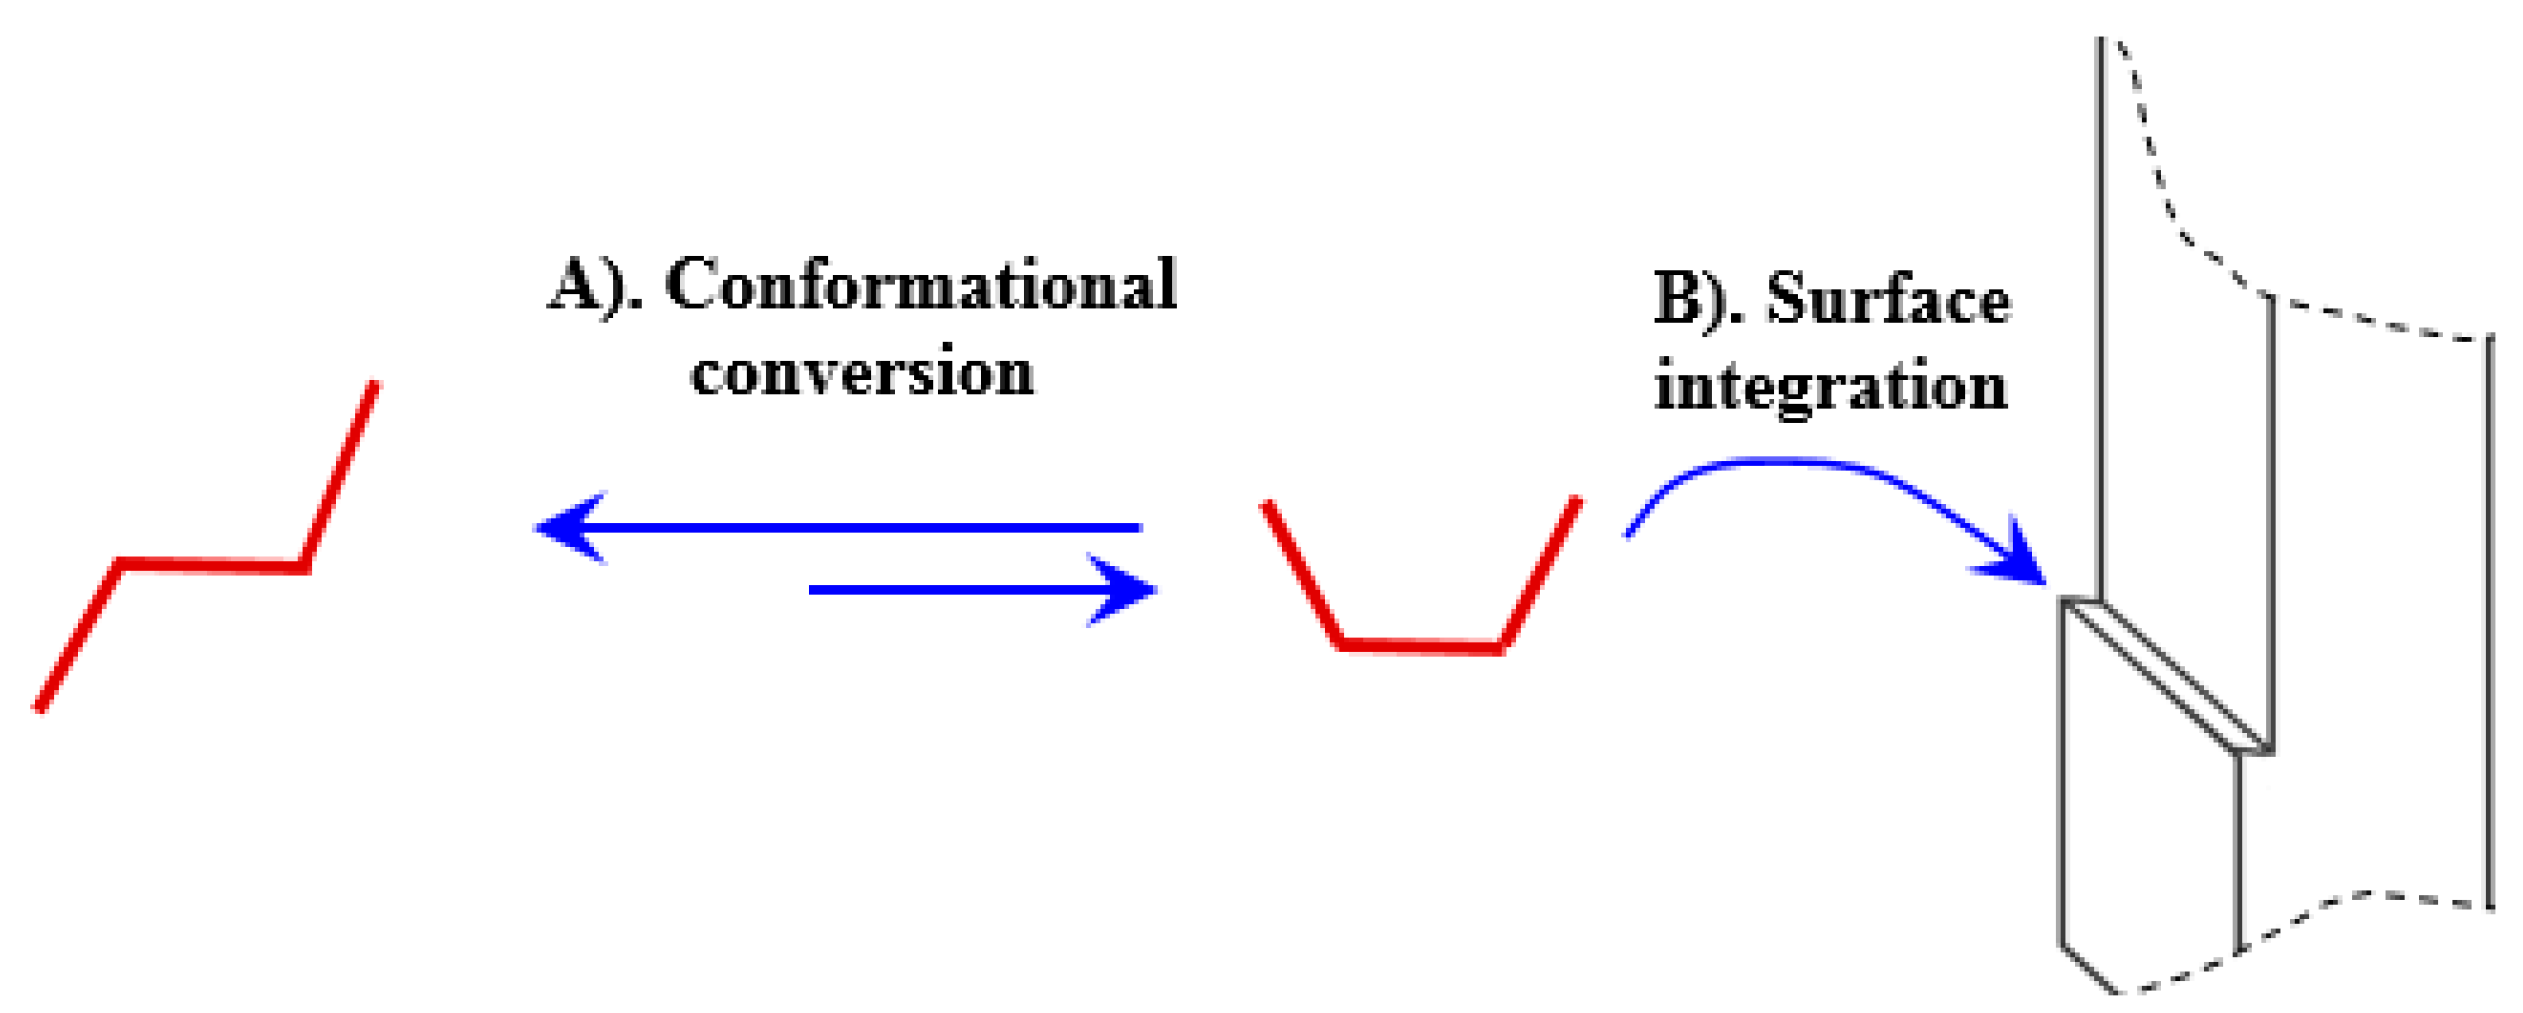
3. Mathematical Modeling

In this paper, we consider the crystal growth from solution containing two slow-interconverting conformers for simplicity. Only the conformation that is present in the crystal lattice, hereafter referred to as the “right conformer” (RC) is assumed to be involved in the solute integration step. The other conformation, defined as the “wrong conformer” (WC) must convert to the RC before it can be integrated on a growing crystal face. As a result, the overall process of crystal growth is assumed to follow four elementary steps in sequence, as shown in Figure 1: (A) conformation conversion, (B) diffusion across crystal/solution film, (C) dessolvation, (D) surface diffusion and (F) surface integration at a crystal kink on a step.
For well mixed solutions containing slow inter-converting conformers, surface diffusion was found to not limit the process [71]. Surface diffusion can be neglected because of the typical low E b required to achieve this step, found to be in the range of 1 to 2 kcal/mol [127]. In addition, solute dessolvation involves minimum enthalpy variation and hence, can also be neglected [128]. In contrast, E b for a conformational change in the case of atropisomers are typically higher than 10 kcal/mol [50,84] and activation energies for solute integration typically lie in the range 5 to 25 kcal/mol [128,129,130]. Hence, film and surface diffusions and dessolvation can be neglected and the simplified overall process of crystal growth from solutions containing atropisomers can be described by the sequence of elementary processes shown in Figure 2.
In the present work, we present a simplified model for anisotropic crystal growth from solutions containing slow inter-converting conformers and, in particular, atropisomers. The semi-theoretical model presented herein is concerned with systems where the main phenomena affecting overall crystal growth are equilibrium between conformers in solution and solute integration on crystal faces. Crystal habit is characterized by two main characteristic dimensions (i.e., length and width) and the growth of each face is dependent of the step advance velocity on the adjacent phase resulting in size-dependent growth.
Conformational interconversion typically follows first-order kinetics and is usually described by the constant of equilibrium between conformers (keq). As crystallization progresses, the concentration of the right conformer is depleted, forcing the equilibrium (A) to shift towards converting the WC to the RC, making it available for crystallization. As conformation inter-conversion and solute integration occur in sequence, the slowest step will dictate the kinetics to the overall process.
Since step A is an equilibrium, increasing the temperature should result in faster equilibration between conformers, which should decrease limitations that can be caused by conformational interconversion, resulting in this step being likely not limiting at elevated temperatures. Solution NMR’s rotamers’ coalescence (TRC) is indicative of faster equilibration between conformers and operating above TRC was found to be useful in achieving crystallization from solutions containing relatively rigid molecules [50].
However, high temperatures typically result in higher solubilities, leading to lower supersaturation or even undersaturation, which prevents crystallization. Therefore, the temperature of crystallization should be carefully selected to minimize crystal growth limitation by conformation interconversion and to provide sufficient supersaturation to drive crystallization.
An additional (negative) effect of the presence of slow-interconverting conformers in solution on crystal growth is the possible growth inhibition by the WC. Indeed, and due to molecular similarity, wrong conformers can compete with the right conformers for active solute integration sites on crystal surfaces (kinks and steps), essentially acting as impurities or growth impostors. The adsorption of WC on integration sites can result in growth inhibition by the wrong conformers, leading to an overall decrease of growth rate (cf. Figure 1).
The crystal growth model presented hereafter is based on Kossel’s formalism [131] for crystal growth mechanisms where crystals are faceted and grow via step propagation on each face. The model is concerned with slow crystal growth under low supersaturation conditions, where surface nucleation is not significant. Under these conditions, new steps are created preferentially at the surface edges once the step has completed the attachment of one layer of solute on the face [131,132]. This approach is one of the foundations of the one-step per face approximation utilized in the following model formulation. The other main assumptions of the following formulation are:
  • Low supersaturation is maintained during crystallization.
  • Crystal growth is the main phenomenon occurring (nucleation, agglomeration and breakage can be neglected).
  • Concentration is uniform in the crystallizer.
For growth-dominated processes, Bennema and Gilmer [133] established the following relationship for the step propagation velocity on a given face f:
v sa _ F = [ ( V m L m 2   υ m )   e ( E aF RT ) λ oF ] ( C int C * )
where,
-
C int is the concentration at the interface film/surface;
-
Vm is the solute molecular volume;
-
Lm is the molecular length;
-
E aF is the activation energy for solute integration on face F;
-
λ oF is the distance between kinks on face F;
-
υ m is the molecular vibration frequency.
E af and λ of can be face-dependent, which translates into different step advance velocities on different faces and different face linear growth rates [25,133].
For systems characterized by a slow solute integration step, solute diffusion between bulk solution and the crystal surface is not limiting in the overall kinetics and the solute concentration at the interface film/surface can be approximated to the bulk solute concentration. For crystal growth from solution containing slow-interconverting conformers, Equation (1) can be modified as follows to account for the equilibrium between conformers in solution and the growth inhibition affected by the wrong conformer [72].
v sa f = Ψ   K   [   C m   λ of 1   e ( E af RT ) ] ( C C * )
where
-
Ψ is the WC growth inhibition term (-);
-
K = k eq k eq + 1 is the is a parameter dependent on the equilibrium between conformers (-);
-
C m = V m L m 2   υ m is a parameter dependent on the solute.
In the case of the growth of the two main characteristic faces of a growing crystal, the size of a given face is dependent of the step propagation velocity of the adjacent face (cf. Figure 2). Assuming that the growth inhibition factor ( Ψ ) is independent of crystal faces, Equation (2) can be simplified for steps propagating on faces L and faces W as follows:
v saL =   K   Ψ   C m   λ oL 1   e ( E aL RT ) S
and
v saW = K   Ψ   C m   λ oW 1   e ( E aW RT ) S
where S is the absolute supersaturation.
For the case of crystals with a rectangular shape and having a size distribution discretized in N classes, the increase of the length of faces L of crystals of class i (i varying between 1 and N) is a result of solute integration on the two faces W at the extremities of faces L. The completion of two layers of growth units on faces W results in the following increase in the length of face L (cf. Figure 3):
L i ( t h ) L i ( t h 1 ) = 2 σ s
where σ s is the step thickness assumed to be independent on crystal faces.
The time required to complete one layer of solute integration on face W, resulting in an increase of 2 σ s in length (L) can be expressed by:
Δ t = t h t h 1 = W i v saW
where vsaW is the step propagation velocity on face Wi
The time required for a step to cover a face and the step thickness can be considered as very short [30]. Hence, Equations (5) and (6) can be combined to yield:
dL i dt = 2 σ s v saW W i
Substitution of Equation (4) into Equation (7) yields the expression of the growth rate of face L of crystals of class i:
G Li = dL i dt = k W S W i
where kW is defined as the solute integration coefficient of faces W (i.e., fast-growing faces):
k W = 2 σ s C m K   Ψ W   λ oW 1   e ( E aW RT )
kW can be assumed constant for a given face and temperature if the distance between kinks ( λ o ) is constant.
Similar reasoning applies to the increase of the thickness of crystals of class i. The resulting equation relating crystal growth rate of face W can be found to be:
G Wi = dW i dt = k L   S L i
Similarly, kL is defined as the solute integration coefficient of faces L (i.e., slow-growing faces):
k L = 2 σ s C m   K   Ψ L   λ oL 1   e ( E aL RT )
Combination of Equations (8) and (10) yields:
dL i L i = k W k L dW i W i
Integration of Equation (12) between the limits Li0 to Li and Wi0 to Wi provides the relationship between the length and the width of crystals of class i:
L i = ( L io W io k e ) W i k e
where k e is the ratio of solute integration coefficients:
k e = k W / k L
Substitution of Equation (13) in Equation (10) yields the expression for the width during crystallization:
W i ( t H ) = [ W io k e + 1 + ( k W + k L ) ( W io k e L io ) 0 t S ( t ) dt ] 1 k e + 1
Which, in discretized form, is written as follows:
W i ( t H ) = [ W io k e + 1 + ( k W + k L ) ( W io k e L io ) h = 1 H S ( t h ) Δ t ] 1 k e + 1
For growth-dominated processes assuming symmetry in the 3rd direction (i.e., width = depth), the mass of solute crystallized at time t writes:
m cr = ρ cr i = 1 Nc N i ( L i W i 2 L i 0 W i 0 2 )
where Ni is the number of crystals in class i and Nc is the number of size classes. Hence, the mass of solute still dissolved in solution is given as follows:
m solute = m o ρ cr i = 1 Nc N i ( L i W i 2 L i 0 W i 0 2 )
Consequently, the expression of the absolute supersaturation during crystallization is expressed by the following equation (in mol/m3):
S = m o ρ cr i = 1 Nc N i ( L i W i 2 L i 0 W i 0 2 ) Mw slt   V solution C * ( t )
which, in the case of an isothermal anti-solvent crystallization is given as follows:
S = m o ρ cr i = 1 Nc N i ( L i W i 2 L i 0 W i 0 2 ) Mw slt ( ( V solv ) 0 + ARm o t ) C * ( x AS )
where AR is the anti-solvent addition rate defined as follows:
AR = ( V AS t ) m o
and x AS is the mass fraction of the anti-solvent in the solvent system.
Resolution of Equations (8), (10), (13), (16) and (20) requires the estimation of growth parameters kL and kW, which are determined from experimental data at different temperatures.
For systems where the crystallizing conformer is a high-energy species, with increasing temperature, the population of the wrong conformer is expected to decrease and the equilibration rate between conformers is expected to increase. As a result, the growth inhibition effect and the effect of the equilibration between conformers on the overall growth rate should decrease with temperature.
Hence, higher values of Ψ are expected at higher temperature. Assuming that growth inhibition by the wrong conformer is independent of crystal faces, the ratio of WC inhibition factor between two temperatures T 1 and T 2 can be easily found to be the following:
Θ RF   = Ψ FR | T 1 T 2   =     k FR | T 1 T 2   K R | T 1 T 2   e E aF R ( 1 T 2 1 T 1 )
where:
-
F is an index referring to the face F (L or W);
-
k RF | T 1 T 2 is the ratio of solute integration coefficients of face F between temperatures T 1 and T 2 ;
-
K R | T 1 T 2 is the ratio related to constant of equilibrium K between temperatures T 1 and T 2 .
Crystal growth inhibition due to integration of the WC, ΘRF, can be computed using Equation (22) at different temperatures, T1 and T2. kF is expected to vary NLT 1 and the experimental measurement of kF at two temperatures is sufficient to extrapolate a trend in the typical temperature range for crystallization of organic substances from solution [73]. The activation energy for solute integration, Ea, is expected to vary in the typical range for small organic molecules: 5 to 25 kcal/mol [128,129,130] and KR can be determined from solubility measurements and/or NMR analysis [50]. For systems where the WC is the low-energy conformer, a decrease of Θf with temperature would indicate the likelihood of crystal growth inhibition by the WC.

Parameter Estimation

A parameter estimation algorithm to determine solute integration coefficients for crystal growth in two directions is presented. The algorithm requires that experimental data about temporal evolution of concentration (or supersaturation) and the aspect ratio at the end of the seed age and the final aspect ratio are available from a few experiments. We propose a parameter estimation algorithm based on minimizing the total error between computed and experimental concentrations during crystallization and aspect, which translates into the minimization of the following objective function:
E = h = 1 h final abs [ C comp ( t h ) C e x p ( t h ) ] + s = 1 s final abs [ Ar comp ( t s ) Ar exp ( t s ) ]
where hfinal and sfinal correspond to the total number of experimental acquisition points for solute concentration and aspect ratio, respectively.
Simplex refinement methods were fast to execute but often resulted in local minima for the objective function. This limitation is possibly due to the inherent local and sequential calculation principles of simplex methods.
Hence, we opted for an algorithm that scans the entire range of possible values of kL and kW in order to identify the global minima of the objective function. In order to improve resolution and shorten computation time, the following features were implemented within the parameter identification algorithm:
  • Limit the scanning of kL to lower in the range of kW/3 to kW since kL must be lower than kW and computation results that returned unrealistically high aspect ratios for ratios kW/kL > 3.
  • Utilize a two-tier estimation algorithm with a 1st low-resolution estimation to narrow the location of the global minima followed by a high-resolution scan to identify the minima of the objective function.
These modifications resulted in major improvement of the parameter estimation algorithm with execution times shortened from several hours to ca. 5 to 20 min, depending on the length of the experiment utilized for the estimation. The parameter estimation algorithm flow chart is shown on Figure 4. Both algorithms for parameter estimation and resolution of the model were coded in MATLAB®. An example of the variation of the objective function with the solute integration coefficients and localization of the global minima of the total error is shown on Figure 5.

4. Simulation

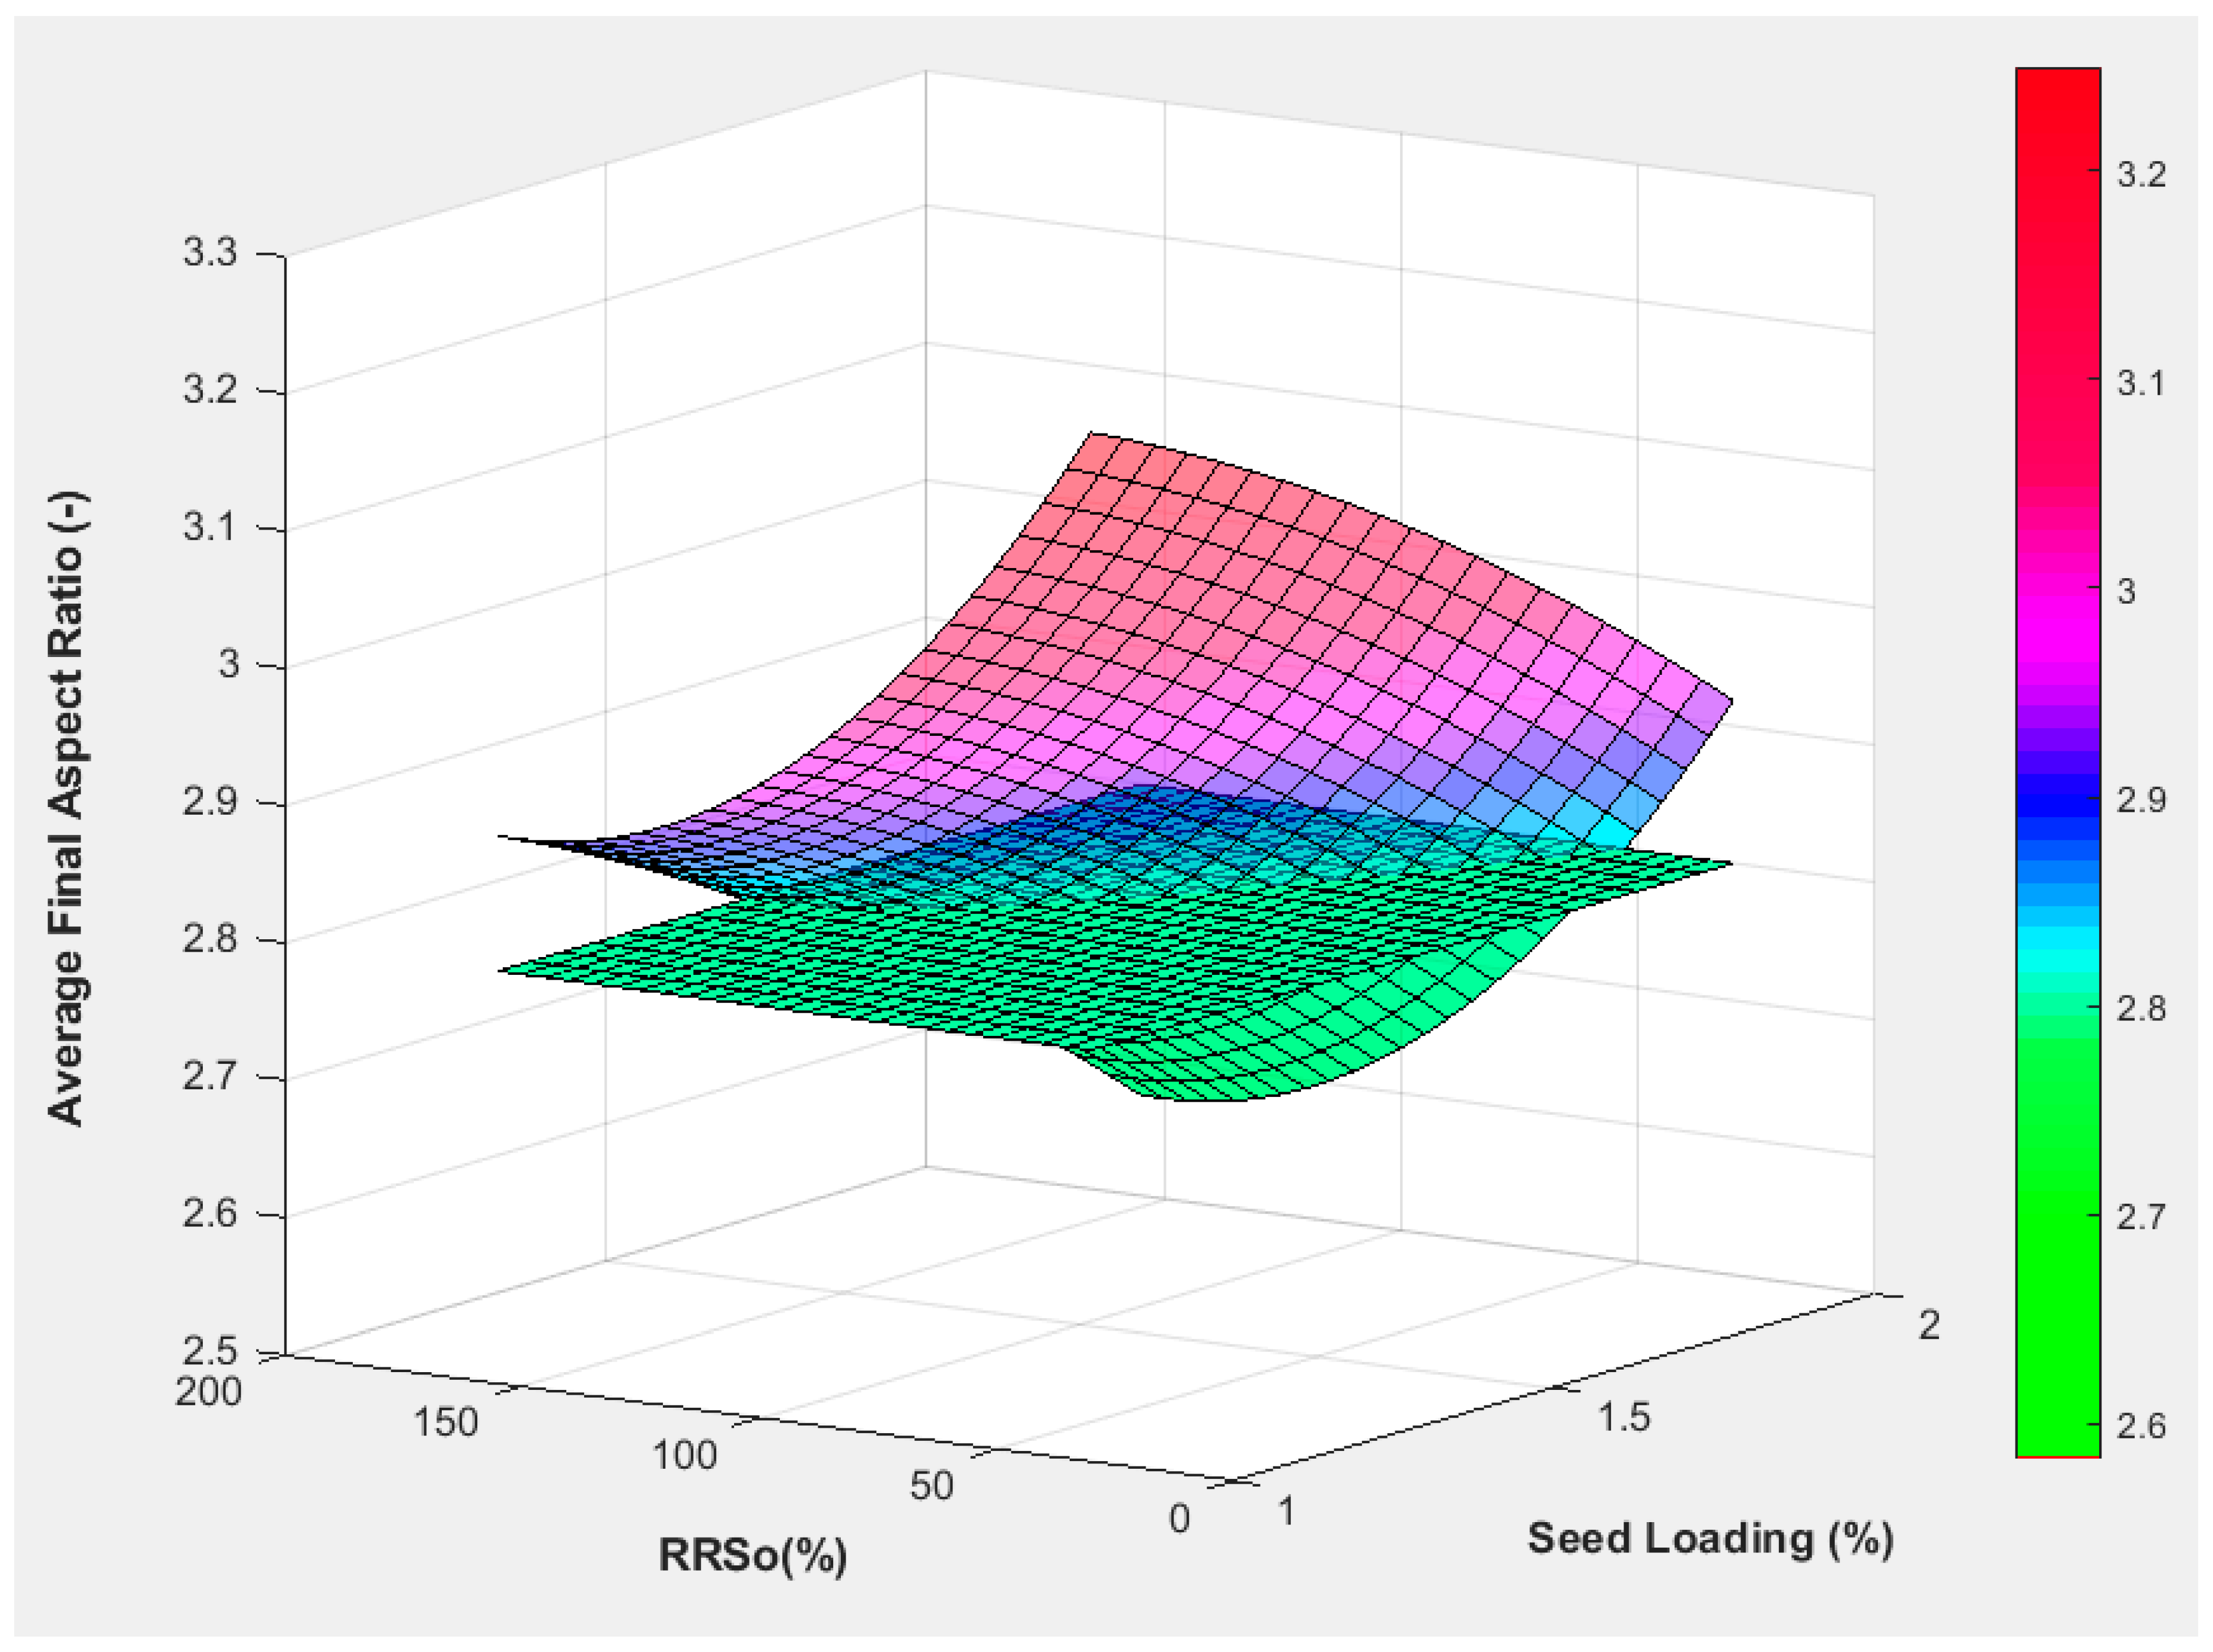
4.1. Supersaturation, Crystal Size and Aspect Ratio

Estimated values of kL and kW are used in the resolution of Equations (8), (10), (13) and (15), which can be solved numerically for any given condition to provide the variation of the 2D PSD and aspect ratio during crystallization. Process simulation was performed for different case scenarios in order to evaluate the impact of different crystallization parameters on the aspect ratio. The model was utilized to predict the evolution of the aspect ratio during crystallization and the final aspect ratio. It was applied to anti-solvent addition crystallization, comprising the following main steps:
  • Dissolution of the solute in an appropriate solvent.
  • Addition of a given amount of anti-solvent to generate supersaturation.
  • Addition of seeds.
  • Aging of the seeds to consume supersaturation and increase the seed surface available for growth.
  • Addition of anti-solvent at given rate to drive crystallization to completion.
Table 2 summarizes the crystallization conditions that are part of the possible design space of crystallization and which were used for the simulation. The results of the simulations are reported on Figure 6a,b. The initial seed distribution utilized in the simulation had an aspect ratio of 1, i.e., Li0 = Wi0.
As shown in Figure 6a,b, for all conditions selected, the model predicts that the supersaturation if fully consumed at the end of the seed age period. This corresponds to a leveling of the aspect ratio by the end of this period. On the other hand, as the 2nd addition of anti-solvent starts, supersaturation is created and growth is restarted, resulting in an increase in the aspect ratio. Simulations were performed utilizing the same seed PSD and the predicted curves of the evolution of aspect ratio during crystallization are shown in Figure 7. The results indicate that for growth-dominated isothermal anti-solvent addition crystallization, the final aspect ratio is mostly impact by the seed loading and the supersaturation at seeding. The anti-solvent addition rate affects the evolution of the aspect ratio throughout the process but its effect on its final value is marginal. The effect of seed loading on the final aspect ratio is likely a reflection of the final crystal sizes (L and W). For low seed loading, single seed crystals grow to larger sizes compared to larger seed loading. The more the crystal grows, the higher the difference between the final length and width that is obtained. This translates into larger aspect ratios obtained for lower seed loadings. On the other hand, higher supersaturation at seeding results in larger differences between width and length of the crystal at the end of the seed age period, which in turn, results in a higher final aspect ratio. The computation can inform about ranges of RRSo and SL that would result in an Ar less than a given value, which would result in poor flowability.
For example, if poor powder flow was found to be related to an aspect ratio above 2.8, the model’s computation indicates that operating with a seed loading lower than 1.5% and a supersaturation at seeding above 100% are likely to result in final aspect ratios lower than 2.8, which, in turn, would result in acceptable powder flow and improved manufacturability of the drug product.

4.2. Crystal Growth Inhibition by the Wrong Conformer

Computation was performed for an isothermal anti-solvent crystallization of a substance, hereafter denoted A, which is present as two main conformations in solution. The constant of equilibrium between conformers at different temperatures for A was reported in a previous study [71] and solute integration factor for same substance was reported in [73]. The corresponding reduced constants, KR, and kRF are calculated and reported here in Figure 8.
Reduced growth inhibition factor by WC, Θ R , is computed by scanning the activation energy for solute integration in the typical range expected for small organic molecules, 5 to 25 kcal/mol. Figure 9 summarizes the results of the computation of Θ R for A, covering the expected range for Ea in the temperature range 20 to 50 °C, with the later considered as a reference temperature.
The computation shows that Θ R decreases with decreasing temperature for low activation energies. However, for high activation energies the model predicts that Θ R , is practically independent of temperature and equaling unity in the entire range of temperature. This result can be explained by the expectation that for high-energy activations, solute integration becomes the growth-rate-limiting mechanism, resulting in no impact of growth inhibition by WC on the overall process. In addition, the model predicts that for low temperatures, the effect of growth inhibition decreases as the activation energy increases and here again the explanation described above applies. The model presented here can provide a rapid assessment of the possible inhibition effect by the wrong conformer once solute integration coefficients (kF) are determined from few experiments. Knowledge of Θ R , is very useful in designing crystallization scaleable processes for relatively rigid molecules. For example, if Θ R , is found to decrease significantly with temperature, cooling crystallization should be avoided or crystallization solvent(s) can be revisited to identify a solvent system that stabilizes the RC, hence increasing its population in solution and favoring its crystallization.

5. Conclusions

The literature review indicates that crystallization of relatively rigid molecules has gained increased interest in recent years due to accumulation of evidence of improved potencies of given atropisomers. However, there is still a lack of models describing crystal growth of slow inter-converting conformers from solution. In this paper, a model for anisotropic crystal growth from solutions containing atropisomers is presented. The approach considers a crystal-size-dependent growth rate and simplifies the overall crystal growth into two main sequential steps: Conversion of the wrong conformer to the right conformer followed by surface integration. The model computes crystal growth, supersaturation and aspect ratio and estimates the inhibition effect of wrong conformers on crystal growth. The resolution requires the knowledge of solute integration coefficients of the two main crystal faces, namely fast-growing and slow-growing faces. A parameter estimation algorithm was derived to determine those coefficients from experimental data regarding transient concentration and aspect ratio. Model computations showed that for isothermal anti-solvent crystallization and for a given seed size, seed loading and supersaturation at seeding are the main factors affecting the final aspect ratio. Computation showed that increasing the temperature leads to decrease of the growth inhibition effect by the wrong conformer. This is possibly due to the combination of two effects: (a) Fast equilibration between conformers at elevated temperatures, (b) decrease of the population of low energy wrong conformer at high temperature.

Author Contributions

Conceptualization, Methodology, Software, Validation, Formal Analysis, L.D.; Investigation, L.D., E.J.C. and D.S.; Resources, L.D.; Data Curation, L.D., E.J.C. and D.S.; Writing—Original Draft Preparation, Writing—Review & Editing; Visualization; Supervision, L.D.; Project Administration, NA; Funding Acquisition, NA.

Funding

This research received no external funding.

Conflicts of Interest

The authors proclaim no conflict of interest.

Nomenclature

ArAspect ratio(-)
ARAnti-solvent addition rate (m3/(s kg))
CConcentration(mol/L)
CintConcentration at the interface film/surface(mol/L)
C*Solubility(mol/m3)
CmConstant related to the solute(m5s−1)
EObjective function: Sum of error between experimental and computed data(mol/L)
Ea Activation energy for solute integration (kcal/mol)
Eb Energy barrier to conformational change(kcal/mol)
hfinal Total number of experimental acquisition of concentration(-)
keqConstant of equilibrium between conformers(-)
KConstant related to constant of equilibrium(-)
kSolute integration coefficient(mol/m3/((mol/L) s))
keRatio of solute integration coefficients(-)
KR Reduced constant of equilibrium
kR Reduced solute integration coefficient(-)
LmMolecular length(m)
LLength(m)
mcrMass of crystals(kg)
NcNumber of classes of particles(-)
RUniversal gas constant(kcal/(mol K))
RSSRelative supersaturation(%)
SAbsolute supersaturation (mol/L)
SLSeed loading (%)
sfinalTotal number of experimental acquisition of aspect ratio(-)
TTemperature(K, °C)
ttime(s)
TRC Temperature of rotamers’ coalescence(K, °C)
VVolume(m3)
Vm Solute molecular volume(m3/mol)
vsaStep advance velocity(m/s)
WWidth(m)
xMass fraction(-)
Greek letters
ρcr Density of crystals(kg/m3)
ΨWC-induced growth inhibition coefficient(-)
ΘRReduced WC-induced growth inhibition coefficient(-)
λo Distance between kinks on face F(m)
υm Molecular vibration frequency(s−1)
σsThickness of step(m)
Subscripts
ASRelated to anti-solvent
expRelated to experimental value
compRelated to computed value
FRelated to face F (L or W)
hRelated to increment of experimental measurement of concentration
iIndex for class of particles
oRelated to initial state
LRefers to faces L
sRelated to increment of experimental measurement of aspect ratio
SltRelated to solute
SoluRelated to solution
SolvRelated to solvent
WRefers to faces W

References

  1. Häuy, A. Essai d’une Théorie sur la Structure des Cristaux Appliquée à Plusieurs Genres de Substances Cristallisées; Chez Gogné: Paris, France, 1783. [Google Scholar]
  2. Wulff, G.Z. Zur Frage der Geschwindigkeit des Wachstums und der Auflösung der Kristallflächen. Krist. Min. 1901, 34, 499–530. [Google Scholar]
  3. Gibbs, J.W. Collected Works; Longmans Green: New York, NY, USA, 1906. [Google Scholar]
  4. Donnay, J.D.H.; Harker, D. A new law of crystal morphology, extending the law of Bravais. Am. Min. 1937, 22, 151–155. [Google Scholar]
  5. Bravais, A. Etudes Cristallographiques; Gauthier-Villar: Paris, France, 1866. [Google Scholar]
  6. Friedel, M.G. Etudes sur les lois de Bravais. Bull. Soc. Fr. Miner. 1907, 30, 326–455. [Google Scholar]
  7. Hartman, P.; Perdok, W.G. On the relations between structure and morphology of crystals. I. Acta Crystallogr. 1955, 8, 49–52. [Google Scholar] [CrossRef]
  8. Hartman, P.; Perdok, W.G. On the relations between structure and morphology of crystals. II. Acta Crystallogr. 1955, 8, 521–524. [Google Scholar] [CrossRef]
  9. Hartman, P.; Perdok, W.G. On the relations between structure and morphology of crystals. III. Acta Crystallogr. 1955, 8, 525–529. [Google Scholar] [CrossRef]
  10. Clydesdale, G.; Roberts, K.J.; Docherty, R. HABIT95—A program for predicting the morphology of molecular crystals as a function of the growth environment. J. Cryst. Growth 1996, 166, 78–83. [Google Scholar] [CrossRef]
  11. Clydesdale, G.; Roberts, K.J.; Docherty, R. HABIT95, Quantum Chemistry Program Exchange. Program No. 670; QC Plumbing & Electrical: Bloomington, IN, USA, 1996. [Google Scholar]
  12. Clydesdale, G.; Roberts, K.J.; Docherty, R. HABIT—A program for predicting the morphology of molecular crystals. Comput. Phys. Commun. 1991, 64, 311–328. [Google Scholar] [CrossRef]
  13. SHAPE for Windows 7.1. 2006. Available online: www.shapesoftware.com (accessed on 25 April 2019).
  14. Accelrys. Available online: http://www.accelrys.com/cerius2/ (accessed on 25 April 2019).
  15. Docherty, R.; Roberts, K.J.; Dowty, E. Morang—A computer-program designed to aid in the determinations of crystal morphology. Comput. Phys. Commun. 1988, 51, 423–430. [Google Scholar] [CrossRef]
  16. Hammond, R.B.; Pencheva, K.; Roberts, K.J. A structural-kinetic approach to model face-specific solution/crystal surface energy associated with the crystallization of acetyl salicylic acid from supersaturated aqueous/ethanol solution. Cryst. Growth Des. 2006, 6, 1324–1334. [Google Scholar] [CrossRef]
  17. Sun, H. COMPASS: An ab initio force-field optimized for condensed-phase applications—Overview with details on alkane and benzene compounds. J. Phys. Chem. B 1998, 102, 7338–7364. [Google Scholar] [CrossRef]
  18. Meenan, P.A.; Anderson, S.R.; Klug, D.L. The influence of impurities and solvents on crystallization. In Handbook of Industrial Crystallization; Myerson, A.S., Ed.; Butterworth-Heinemann: Boston, MA, USA, 2001. [Google Scholar]
  19. Burton, W.K.; Cabrera, N.; Frank, F.C. The growth of crystals and the equilibrium structure of their surfaces. Philos. Trans. 1951, 243, 299–358. [Google Scholar] [CrossRef]
  20. Kuvadia, Z.B.; Doherty, M.F. Spiral growth model for faceted crystals of non-centrosymmetric organic molecules grown from solution. Cryst. Growth Des. 2011, 11, 2780–2802. [Google Scholar] [CrossRef]
  21. Kuvadia, Z.B.; Doherty, M.F. Reformulating multidimensional population balances for predicting crystal size and shape. AIChE J. 2013, 59, 3468–3474. [Google Scholar] [CrossRef]
  22. Sizemore, J.P.; Doherty, M.F. An engineering model for predicting the shape of solution-grown organic crystals in the presence of an additive. VDI Berichte 2005, 1901I, 477–480. [Google Scholar]
  23. Sizemore, J.P.; Doherty, M.F. A new model for the effect of molecular imposters on the shape of faceted molecular crystals. Cryst. Growth Des. 2009, 9, 2637–2645. [Google Scholar] [CrossRef]
  24. Winn, D.; Doherty, M.F. A new technique for predicting the shape of solution-grown organic crystals. AIChE J. 1998, 44, 2501–2514. [Google Scholar] [CrossRef]
  25. Winn, D.; Doherty, M.F. Modeling of crystal shape of organic materials grown from solution. AIChE J. 2000, 46, 1348–1367. [Google Scholar] [CrossRef]
  26. Winn, D.; Doherty, M.F. Predicting the shape of organic crystals grown from polar solvents. Chem. Eng. Sci. 2002, 57, 1805–1813. [Google Scholar] [CrossRef]
  27. Snyder, R.C.; Doherty, M.F. Predicting crystal growth by spiral motion. Proc. R. Soc. A Math. Phys. Eng. Sci. 2009, 465, 1145–1171. [Google Scholar] [CrossRef]
  28. Lovette, M.A.; Doherty, M.F. Predictive modeling of supersaturation-dependent crystal shapes. Cryst. Growth Des. 2012, 12, 656–669. [Google Scholar] [CrossRef]
  29. Ma, C.Y.; Wang, X.Z.; Roberts, K.J. Multi-dimensional population balance modeling of the growth of rod-like L-glutamic acid crystals using growth rates estimated from in-process imaging. Adv. Powder Technol. 2007, 18, 707–723. [Google Scholar] [CrossRef]
  30. Ma, C.Y.; Wang, X.Z. Crystal Growth Rate Dispersion Modeling Using Morphological Population Balance. AIChE J. 2008, 54, 2321–2334. [Google Scholar] [CrossRef]
  31. Ma, C.Y.; Wang, X.Z.; Roberts, K.J. Morphological Population Balance for Modeling Crystal Growth in Face Directions. AIChE J. 2008, 54, 209–222. [Google Scholar] [CrossRef]
  32. Wang, X.Z.; Ma, C.Y. Morphological Population Balance Model in Principal Component Space. AIChE J. 2009, 54, 2321–2334. [Google Scholar] [CrossRef]
  33. Ma, C.Y.; Roberts, K.J. Combining Morphological Population Balances with Face-Specific Growth Kinetics Data to Model and Predict the Crystallization Processes for Ibuprofen. Ind. Eng. Chem. Res. 2018, 57, 16379–16394. [Google Scholar] [CrossRef]
  34. Ma, C.Y.; Roberts, K.J. Morphological population balance modelling of the effect of crystallisation environment on the evolution of crystal size and shape of para-aminobenzoic acid. Comput. Chem. Eng. 2019, 126, 356–370. [Google Scholar] [CrossRef]
  35. Chan, E.J.; Tejwani, R.; Derdour, L. Use of Molecular Simulation in Calculating a Characteristic Relative Growth Effect Curvature to Correlate Factors Influencing Crystalline Growth and Other Properties. Cryst. Growth Des. 2015, 15, 5754–5766. [Google Scholar] [CrossRef]
  36. Szilágyi, B.; Nagy, Z.K. Aspect Ratio Distribution and Chord Length Distribution Driven Modeling of Crystallization of Two-Dimensional Crystals for Real-Time Model-Based Applications. Cryst. Growth Des. 2018, 18, 5311–5321. [Google Scholar]
  37. Szilágyi, B.; Agachi, P.S.; Lakatos, B.G. Numerical analysis of crystallization of high aspect ratio crystals with breakage. Powder Technol. 2015, 283, 152–162. [Google Scholar] [CrossRef]
  38. Borsos, A.; Lakatos, B.G. Investigation and simulation of crystallization of high aspect ratio crystals with fragmentation. Chem. Eng. Sci. 2014, 92, 1133–1141. [Google Scholar] [CrossRef]
  39. Sato, K.; Nagai, H.; Hasegawa, K.; Tomori, K.; Kramer, H.J.M.; Jansen, J.P. Two-dimensional population balance model with breakage of high aspect ratio crystals for batch crystallization. Chem. Eng. Sci. 2008, 63, 3271–3278. [Google Scholar] [CrossRef]
  40. Briesens, H. Simulation of crystal size and shape by means of a reduced two-dimensional population balance model. Chem. Eng. Sci. 2006, 61, 104–112. [Google Scholar] [CrossRef]
  41. Gunawan, R.; Fusman, I.; Braatz, R.D. High Resolution Algorithms for Multidimensional Population Balance Equations. AIChE J. 2004, 50, 2738–2749. [Google Scholar] [CrossRef]
  42. Szilágyi, B.; Lakatos, B.G. Batch cooling crystallization of plate-like crystals: A simulation study. Period. Polytech. Chem. Eng. 2015, 59, 151–158. [Google Scholar] [CrossRef]
  43. Oullion, M.; Puel, F.; Févotte, G.; Righini, S.; Carvin, P. Industrial batch crystallization of a plate-like organic product. In situ monitoring and 2D-CSD modeling. Part 2: Kinetic modeling and identification. Chem. Eng. Sci. 2007, 62, 833–845. [Google Scholar] [CrossRef]
  44. Patience, D.B.; Rawlings, J.B. Particle shape monitoring and control in crystallization processes. AIChE J. 2001, 47, 2125–2130. [Google Scholar] [CrossRef]
  45. Puel, F.; Marchal, P.; Klein, J.P. Habit transient analysis in industrial crystallization using two dimensional crystal size technique. Trans. Icheme 1997, 75, 193–205. [Google Scholar] [CrossRef]
  46. Puel, F.; Févotte, G.; Klein, J.P. Simulation and analysis of industrial crystallization processes though multidimensional population equations. Part 1: A resolution algorithm based on the method of classes. Chem. Eng. Sci. 2003, 58, 3715–3727. [Google Scholar] [CrossRef]
  47. Mattews, H.B.; Rawlings, J.B. Batch crystallization of a photochemical: Modeling, control, and filtration. AIChE J. 1998, 44, 1119–1127. [Google Scholar] [CrossRef]
  48. Shoji, M.; Takiyama, H. The Application of Two-Dimensional Population Balance Model to Study the Effect of temperature Profile on the Crystal Size Distribution and Aspect Ratio. Cryst. Growth Des. 2012, 12, 5241–5246. [Google Scholar] [CrossRef]
  49. Kean, E.S.; Fisher, K.; West, R. Molecular conformation and electronic structure. The solid state spectrum of a planar anil. J. Am. Chem. Soc. 1972, 94, 3247–3249. [Google Scholar]
  50. Derdour, L.; Skliar, D. A review of the effect of multiple conformers on crystallization from solution and strategies for crystallizing slow inter-converting conformers. Chem. Eng. Sci. 2014, 106, 275–292. [Google Scholar] [CrossRef]
  51. Fukuyama, Y.; Asakawa, Y. Novel neurotrophic isocuparane-type sesquiterpene dimers, mastigophorenes A, B, c and D, Isolated from the Liverwort Mastigophora didados. J. Chem. Soc. Perkin Trans. 1991, 11, 2737–2741. [Google Scholar] [CrossRef]
  52. Albert, J.S.; Ohnmacht, C.; Bernstein, P.R.; Rumsey, W.L.; Aharony, D.; Alelyunas, Y.; Russell, D.J.; Potts, W.; Sherwood, S.A.; Shen, L.; et al. Structural analysis and optimization of NK1 receptor antagonists through modulation of atropisomer interconversion properties. J. Med. Chem. 2004, 47, 519–529. [Google Scholar] [CrossRef] [PubMed]
  53. Zhou, Y.S.; Tay, L.D.; Hughes, D.; Donahue, S. Simulaiton of the impact of atropisomer interconversion of plasma exposure of atropisomers of an endothelin receptor antagonist. J. Clin. Pharm. 2004, 44, 680–688. [Google Scholar] [CrossRef] [PubMed]
  54. Bringmann, G.; Price-Mortimer, A.J.; Keller, P.A.; Gresser, M.J.; Garner, J.; Breuning, M. Atroposelective synthesis of axially chiral biaryl compounds. Angew. Chem. Int. Ed. 2005, 44, 5384–5427. [Google Scholar] [CrossRef] [PubMed]
  55. Vrudhula, V.M.; Dasgupta, B.; Qian-Cutrone, J.; Kozlowski, E.S.; Boissard, C.G.; Dworetzky, S.I.; Wu, D.; Gao, Q.; Kimura, R.; Gribkoff, V.K.; et al. Atropisomeric 3-(β-hydroxyethyl)-4-arylquinolin-2-ones as Maxi-K Potassium Channel Openers. J. Med. Chem. 2007, 50, 1050–1057. [Google Scholar] [CrossRef]
  56. Xing, L.; Shieh, H.S.; Selness, S.R.; Devraj, R.V.; Walker, J.K.; Devada, B.; Hope, H.R.; Compton, R.P.; Schinlder, J.F.; Hirsch, J.L.; et al. Structural bioinformatics-based prediction of exceptional selectivity of p38 MAP kinase inhibitor PH-797804. Biochemistry 2009, 48, 6402–6411. [Google Scholar] [CrossRef]
  57. Clayden, J.; Moran, W.J.; Edwards, P.J.; LaPlante, S.R. The challenge of atropisomerism in drug discovery. Angew. Chem. Int. Ed. 2009, 48, 6398–6401. [Google Scholar] [CrossRef]
  58. Laplante, S.R.; Fader, L.D.; Fandrick, K.R.; Fandrick, D.R.; Hucke, O.; Kemper, R.; Miller, S.P.F.; Edwards, P.J.J. Assessing atropisomer axial chirality in drug discovery and development. Med. Chem. 2011, 54, 7005–7022. [Google Scholar] [CrossRef] [PubMed]
  59. Laplante, S.E.; Edwards, P.J.; Fader, L.D.; Jakalian, A.; Hucke, O. Revealing atropisomer axial chirality in drug discovery. Chem. Med. Dev. 2011, 6, 505–513. [Google Scholar] [CrossRef] [PubMed]
  60. Yoshida, K.; Itoyama, R.; Yamahira, M.; Tanaka, J.; Loaëc, N.; Lozach, O.; Durieu, E.; Fukuda, T.; Ishibashi, F. Synthesis, resolution, and biological evaluation of atropisomeric (a R)-and (aS)-16-methyllamellarins n: Unique effects of the axial chirality on the selectivity of protein kinases inhibition. J. Med. Chem. 2013, 56, 7289–7301. [Google Scholar] [CrossRef] [PubMed]
  61. Zask, A.; Murphy, J.; Ellestad, G.A. Biological stereoselectivity of atropisomeric natural products and drugs. Chirality 2013, 25, 265–274. [Google Scholar] [CrossRef] [PubMed]
  62. Smith, D.E.; Marquez, I.; Lokensgard, M.E.; Rheingold, A.L.; Hecht, D.A.; Gustafson, J.L. Exploiting atropisomerism to increase the target selectivity of kinase inhibitors. Angew. Chem. Int. Ed. 2015, 54, 11754–11759. [Google Scholar] [CrossRef] [PubMed]
  63. LaPlante, S.R.; Forgione, P.; Boucher, C.; Coulombe, R.; James Gillard, J.; Hucke, O.; Jakalian, A.; Joly, M.A.; Kukolj, G.; Lemke, C.; et al. Enantiomeric atropisomers inhibit HCV polymerase and/or HIV matrix: Characterizing hindered bond rotations and target selectivity. J. Med. Chem. 2014, 57, 1944–1951. [Google Scholar] [CrossRef] [PubMed]
  64. Wang, J.; Zeng, W.; Li, S.; Shen, L.; Gu, Z.; Zhang, Y.; Li, J.; Chen, S.; Jia, X. Discovery and assessment of atropisomers of (±)-lesinurad. ACS Med. Chem. Lett. 2017, 8, 299–303. [Google Scholar] [CrossRef]
  65. Glunz, P.E. Recent encounters with atropisomerism in drug discovery. Bioorg. Med. Chem. Lett. 2018, 8, 53–60. [Google Scholar] [CrossRef]
  66. Wisniewski, S.R.; Carrasquillo-Flores, R.; Gonzalez, F.L.; Ramirez, A.; Casey, M.; Soumeillant, M.; Razler, T.M.; Mack, B. Adventures in Atropisomerism: Development of a Robust, Diastereoselective, Lithium-Catalyzed Atropisomer-Forming Active Pharmaceutical Ingredient Step. Org. Process Res. Dev. 2018, 22, 1426–1431. [Google Scholar] [CrossRef]
  67. Chandrasekhar, J.; Dick, R.; Van Veldhuizen, J.; Koditek, D.; Lepist, E.I.; McGrath, M.E.; Patel, L.; Phillips, G.; Sedillo, K.; Somoza, J.R.; et al. Atropisomerism by Design: Discovery of a Selective and Stable Phosphoinositide 3-Kinase (PI3K) β Inhibitor. J. Med. Chem. 2018, 61, 6858–6868. [Google Scholar] [CrossRef]
  68. Toenjes, S.T.; Gustafson, J.L. Atropisomerism in medicinal chemistry: Challenges and opportunities. Future Med. Chem. 2018, 10, 409–422. [Google Scholar] [CrossRef] [PubMed]
  69. Yu, L.; Reutzel-Edens, S.M.; Mitchell, C.A. Crystallization and polymorphism of conformationally flexible molecules: Problems, patterns and strategies. Org. Proc. Res. Dev. 2000, 4, 396–402. [Google Scholar] [CrossRef]
  70. Nangia, A. Conformational polymorphism in organic molecules. Acc. Chem. Res. 2007, 41, 595–604. [Google Scholar] [CrossRef] [PubMed]
  71. Derdour, L.; Pack, S.K.; Skliar, D.; Lai, C.J.; Kiang, S. Crystallization from solutions containing multiple conformers: A new modeling approach for solubility and supersaturation. Chem. Eng. Sci. 2011, 66, 88–102. [Google Scholar] [CrossRef]
  72. Derdour, L.; Skliar, D. Crystallization from solutions containing multiple conformers. Part I. Modeling of crystal growth and supersaturation. Cryst. Growth Des. 2012, 12, 5180–5187. [Google Scholar] [CrossRef]
  73. Derdour, L.; Sivakumar, C.; Skliar, D.; Pack, S.K.; Lai, C.J.; Vernille, J.P.; Kiang, S. Crystallization from solutions containing multiple conformers. Part II. Experimental study and model validation. Cryst. Growth Des. 2012, 12, 5188–5196. [Google Scholar] [CrossRef]
  74. Back, K.; Davey, R.J.; Grecu, T.; Hunter, C.A.; Taylor, L.S. Molecular Conformation and Crystallization: The Case of Ethenzamide. Cryst. Growth Des. 2012, 12, 6110–6117. [Google Scholar] [CrossRef]
  75. Li, P.; Hwang, J.; Maier, J.M.; Zhao, C.; Kaborda, D.V.; Smith, M.D.; Pellechia, P.J.; Shimizu, K.D. Correlation between Solid-State and Solution Conformational Ratios in a Series of N-(o-Tolyl) Succinimide Molecular Rotors. Cryst. Growth Des. 2015, 15, 3561–3564. [Google Scholar] [CrossRef]
  76. Cesàro, A.; Bellich, B.; Giannini, G.; Maiocchi, A. Conformational Disorder and Atropisomerism in Pharmaceutical Compounds. In Disordered Pharmaceutical Materials; Descamps, M., Ed.; Wiley-VCH: Weinheim, Germany, 2015; pp. 161–181. [Google Scholar]
  77. Wicker, J.G.P.; Cooper, R.I. Beyond Rotatable Bond Counts: Capturing 3D Conformational Flexibility in a Single Descriptor. J. Chem. Inf. Model. 2016, 56, 2347–2352. [Google Scholar] [CrossRef]
  78. Zimmer, G.C.; Pagliari, A.B.; Bender, C.R.; Salbego, P.R.S.; Orlando, T.; Hörner, M.; Zanatta, N.; Bonacorso, H.G.; Martins, M.A.P. Insights on conformation in the solid state: A case study—s-cis and/or s-trans crystallization of 5(3)-aryl-(5)-carboxyethyl-1-tert-butylpyrazoles. Cryst. Eng. Commun. 2018, 20, 5154–5168. [Google Scholar] [CrossRef]
  79. Thompson, H.P.G.; Day, G.M. Which conformations make stable crystal structures? Mapping crystalline molecular geometries to the conformational energy landscape. Chem. Sci. 2014, 5, 3173–3182. [Google Scholar] [CrossRef] [Green Version]
  80. Rosbottom, I.; Toroz, D.; Hammond, R.B.; Roberts, K.J. Conformational and structural stability of the single molecule and hydrogen bonded clusters of para aminobenzoic acid in the gas and solution phases. CrystEngComm 2018, 20, 7543–7555. [Google Scholar] [CrossRef] [Green Version]
  81. Martins, M.A.P.; Pagliari, A.B.; Belladona, A.L.; Tier, A.Z.; Meyer, A.R.; Rodrigues, L.V.; Horner, M.; Frizzo, C.P.; Bonacorso, H.G.; Zanatta, N. Supramolecular self-assembly and thermodynamic properties of 5-aryl-1-(1,1-dimethylethyl)-1H-pyrazoles in the crystalline state. J. Mol. Struct. 2019, 1195, 570–581. [Google Scholar] [CrossRef]
  82. Du, W.; Cruz-Cabeza, A.J.; Woutersen, S.; Davey, R.J.; Yin, Q. Can the study of self-assembly in solution lead to a good model for the nucleation pathway? The case of tolfenamic acid. Chem. Sci. 2015, 6, 3515–3524. [Google Scholar] [CrossRef] [PubMed]
  83. Kessler, H. Detection of hindered rotation and inversion by NMR spectroscopy. Angew. Chem. Int. Ed. 1970, 9, 219–235. [Google Scholar] [CrossRef]
  84. Oki, M. Recent advances in atropisomerism. In Topics in Stereochemistry; Eliel, E.L., Allinger, N.L., Wilen, S.H., Eds.; Wiley Interscience: New York, NY, USA, 1983; pp. 1–81. [Google Scholar]
  85. Binsch, G. Band-shape analysis. In Dynamic Nuclear Magnetic Resonance Spectroscopy; Jackman, L.M., Cotton, F.A., Eds.; Academic Press: New York, NY, USA, 1975; pp. 45–81. [Google Scholar]
  86. Kuhn, R. Molekulare assymmetrie. In Stereochemie; Freudenber, H., Ed.; Franz Deuticke: Leipzig, Germany; Wien, Austria, 1933; pp. 803–824. [Google Scholar]
  87. Bernstein, J.; Hagler, A.T. Conformational polymorphism. The influence of crystal structure on molecular conformation. J. Am. Chem. Soc. 1978, 100, 673–681. [Google Scholar] [CrossRef]
  88. Bernstein, J.; Anderson, R.E.; Eckhardt, C.J. Confomational influences on electronic spectra and structure. Polymorphs of N-(p-Chlorobenzylidene)-p-chloroaniline. J. Am. Chem. Soc. 1978, 101, 551–554. [Google Scholar]
  89. Desiraju, G.R. Supramolecular Synthons in Crystal Engineering-A New Organic Synthesis. Angew. Chem. Int. Ed. 1995, 34, 2311–2327. [Google Scholar] [CrossRef]
  90. Buttar, D.; Charlton, M.H.; Docherty, R.; Starbuck, J.J. Theoretical investigations of conformational aspects of polymorphism. Part 1: O-acetamidobenzamide. Chem. Soc. Perkin Trans. 2 1988, 763–772. [Google Scholar] [CrossRef]
  91. Holman, K.T.; Pivovar, A.M.; Michael, M.D. Engineering crystal symmetry and polar order in molecular host frameworks. Science 2001, 294, 1907–1911. [Google Scholar] [CrossRef]
  92. Steiner. T. The Hydrogen Bond in the Solid State. Angew. Chem. Int. Ed. 2002, 41, 48–76. [Google Scholar] [CrossRef]
  93. Long, S.; Li, T. Controlled Formation of the Acid-Pyridine Heterosynthon over the Acid-Acid Homosynthon in 2-Anilinonicotinic Acids. Cryst. Growth Des. 2009, 9, 4993–4997. [Google Scholar] [CrossRef]
  94. Bar, I.; Bernstein, J. Conformational polymorphism. 5. Crystal energetics of an isomorphic system including disorder. J. Phys. Chem. 1984, 88, 243–248. [Google Scholar] [CrossRef]
  95. Bar, I.; Bernstein, J. Conformational polymorphism VI: The crystal and molecular structures of Form II, Form 111, and Form V of 4-Amino-N-2-pyridinylbenzenesulfonamide (Sulfapyridine). J. Pharm. Sci. 1985, 74, 255–263. [Google Scholar] [CrossRef] [PubMed]
  96. Bernstein, J.; Davey, R.J.; Henck, J.O. Concomitant polymorphs. Angew. Chem. Int. Ed. 1999, 38, 3440–3461. [Google Scholar] [CrossRef]
  97. Bernstein, J.; Davey, R.J.; Henck, J.O. Gleichzeitig auftretende polymorphe modifikationen. Angew. Chem. 1999, 111, 3646–3669. [Google Scholar] [CrossRef]
  98. Starbuck, J.; Docherty, R.; Charlton, M.H.; Buttar, D. Theoretical investigation of conformational aspects of polymorphism. Part 2. Diarylamines. J. Chem. Soc. Perkin Trans. 2 1999, 677–691. [Google Scholar] [CrossRef]
  99. Lewis, T.C.; Derek, A.T.; Price, S.L. An experimental and theoretical search for polymorphs of barbituric acid: The challences of even limited conformational flexibility. Cryst. Growth Des. 2004, 4, 979–987. [Google Scholar] [CrossRef]
  100. Roy, S.; Banerjee, R.; Nangia, A.; Kruger, G.J. Conformational, Concomitant Polymorphs of 4,4-Diphenyl-2,5-cyclohexadienone: Conformation and Lattice Energy Compensation in the Kinetic and Thermodynamic Forms. Chem. Eur. J. 2006, 12, 3777–3788. [Google Scholar] [CrossRef]
  101. Roberts, K.J.; Docherty, R.; Bennema, P.; Jetten, L.A.M. The importance of considering growth-induced conformational change in predicting the morphology of benzophenone. J. Phys. D Appl. Phys. 1993, 26, B7–B21. [Google Scholar] [CrossRef]
  102. Mc Pherson, A. Crystallization of Biological Macromolecules; CSHL Press: New York, NY, USA, 1999. [Google Scholar]
  103. Allen, T. Particle Size Measurement, 4th ed.; Chapman & Hall: New York, NY, USA, 1990. [Google Scholar]
  104. Concistré, M.; De Lorenzo, L.; De Luca, G.; Longeri, M.; Pileio, G.; Raos, G. Conformational analysis of 2,2’-Bithiophene: A 1H liquid crystal NMR study using the 13C satellite spectra. J. Phys. Chem. A 2005, 109, 9953–9963. [Google Scholar] [CrossRef] [PubMed]
  105. Brás, E.M.; Henriques, M.S.C.; Paixão, J.A.; Fausto, R. High Z′ Crystal Structure of a New Polymorph of a Thioimidazole Disulfide: Importance of Conformational Flexibility. Cryst. Growth Des. 2018, 18, 4167–4173. [Google Scholar] [CrossRef]
  106. Bazargani, M.F.; Talavat, L.; Naderi, S.; Khavasi, H.R. 2-[(1H-Imidazol-2-yl)disulfanyl]-1H-2-[(1H-Imidazol-2-yl)disulfanyl]-1H-imidazole. Acta Cryst. 2011, E67, o2585. [Google Scholar]
  107. Kitamura, M.; Furukawa, H.; Asaeda, M. Solvent effect of ethanol on crystallization and growth process of L-histidine polymorphs. J. Cryst. Growth 1994, 141, 193–199. [Google Scholar] [CrossRef]
  108. Kishikawa, K.; Yoshizaki, K.; Kohmoto, S.; Yamamoto, M.; Yamaguchi, K.; Yamada, K. Control of the rotational barrier and spatial disposition of the N-(2’-methylphenyl) group in succinimides by substituent and solvent effects. J. Chem. Soc. Perkin Trans. 1997, 1, 1233–1239. [Google Scholar] [CrossRef]
  109. Hunter, C.A.; McCabe, J.F.; Spitaleri, A. Solvent effects of the structures of pre-nucleation aggregates of carbamazepine. CrystEngComm 2012, 14, 7115–7117. [Google Scholar] [CrossRef]
  110. Spitaleri, A.; Hunter, C.A.; McCabe, J.F.; Packer, M.J.; Cockroft, S.L. A 1H NMR study of crystal nucleation in solution. CrystEngComm 2004, 6, 489–493. [Google Scholar] [CrossRef]
  111. Zeglinski, J.; Kuhs, M.; Khamar, D.; Hegarty, A.C.; Devi, R.K.; Rasmuson, A.C. Crystal nucleation of tolbutamide in solution: Relationship to solvent, solute conformation, and solution structure. Chem. Eur. J. 2018, 24, 4916–4926. [Google Scholar] [CrossRef] [PubMed]
  112. Mattei, M.; Li, T. Polymorph Formation and Nucleation Mechanism of Tolfenamic Acid in Solution: An Investigation of Pre-nucleation Solute Association. Pharm. Res. 2012, 29, 460–470. [Google Scholar] [CrossRef]
  113. Zeglinski, J.; Kuhs, M.; Devi, K.R.; Khamar, D.; Hegarty, A.C.; Thompson, D.; Rasmuson, A.C. Probing Crystal Nucleation of Fenoxycarb from Solution through the Effect of Solvent. Cryst. Growth Des. 2019, 19, 2037–2049. [Google Scholar] [CrossRef]
  114. Petit, S.; Coquerel, G.; Harman, P. Nucleation and crystal growth of molecular solvates with several conformations both in solution and in solid state: Application to some hydrated coper (II) sulfoxinates. J. Cryst. Growth 1994, 137, 585–594. [Google Scholar] [CrossRef]
  115. Hurshouse, M.B.; Huth, L.S.; Threlfall, T.L. Why do organic compounds crystallise well or badly or ever so slowly? Why is crystallisation nevertheless such a good purification technique? Org. Proc. Res. Dev. 2009, 13, 1231–1240. [Google Scholar] [CrossRef]
  116. Walter, W.; Gerhard Maerten, G. Thioformylierung von Aminen und Untersuchungen über die cis-trans-Isomerie an der Thioamidgruppe. Liebigs Ann. Chem. 1963, 669, 66–75. [Google Scholar] [CrossRef]
  117. Walter, W.; Gerhard Maerten, G.; Rose, H. NMR-spektroskopische Untersuchungen an cis- und trans-N-Methyl-N-benzyl-thioformamid. Zuordnung der Konfigurationen und Kinetik der Umwandlung. Liebigs Ann. Chem. 1966, 691, 25–32. [Google Scholar] [CrossRef]
  118. Walter, W.; Becker, R.F. Über die struktur der thioamide und ihrer derivate. XX. Untersuchungen zur behinderten rotation bei ortho-substituierten n-alkyl-thioformaniliden. Tetrahedron 1972, 28, 1705–1720. [Google Scholar] [CrossRef]
  119. Mannschreck, A. Separation of rotational isomers of amides, thioamides, and nitrosamines. Angew. Chem. Int. Ed. 1965, 4, 985. [Google Scholar]
  120. Mannschreck, A. Protonenresonanz-Untersuchungen zur innerbn rotation II. 1. Zur trennung rotationsisomerer amide der mesitylencabonsäure. Tetrahedron Lett. 1965, 19, 1341–1347. [Google Scholar] [CrossRef]
  121. Jaeschke, A.; Muensch, H.; Schmid, H.G.; Friebolin, H.; Mannschreck, A. The conformers of a nitrosamine and a carboxamide: Comparison of NMR line shape and equilibration methods. J. Mol. Spectrosc. 1969, 31, 14–31. [Google Scholar] [CrossRef]
  122. Staab, H.A.; Lauer, D. Stabile rotationisomere von carbonsaureamiden. Tetrahedron Lett. 1966, 38, 4593–4598. [Google Scholar] [CrossRef]
  123. Bungard, C.J.; Morris, J.C. Total synthesis of the 7,3’-linked naphthylisoquinoline alkaloid ancistrocladidine. J. Org. Chem. 2006, 71, 7354–7363. [Google Scholar] [CrossRef]
  124. Mannschreck, A.; Münsch, H.; Mattheus, A. Trennung der konformationsisomeren eines Nitrosamins. Angew. Chem. 1966, 78, 751. [Google Scholar] [CrossRef]
  125. Parker, J.S.; Smith, N.A.; Welham, M.J.; Moss, W.O. A new approach to the rapid parallel development of four neurokinin antagonists. Part 5. preparation of ZM374979 cyanoacid and selective crystallisation of ZM374979 atropisomers. Org. Proc. Res. Dev. 2004, 8, 45–50. [Google Scholar] [CrossRef]
  126. Ischenko, V.; Englert, U.; Jansen, M. Conformational dimorphism of 1,1,3,3,5,5-Hexachloro-1,3,5-trigermacyclohexane: Solvent-induced crystallization of a metastable polymorph containing boat-shaped molecules. Chem. Eur. J. 2005, 11, 1375–1383. [Google Scholar] [CrossRef] [PubMed]
  127. Martínez-Galera, A.J.; Gomez-Rodríguez, J.M. Surface Diffusion of Simple Organic Molecules on Graphene on Pt(111). J. Phys. Chem. C 2011, 115, 23036–23042. [Google Scholar] [CrossRef]
  128. Derdour, L.; Buono, F. An investigation of the applicability of microcalorimetry for the measurement of supersaturation of during batch crystallization from solution. Cryst. Growth Des. 2012, 12, 1899–1912. [Google Scholar] [CrossRef]
  129. Garside, J.; Mersmann, A.; Nyvlt, J. Measurement of Crystal Growth and Nucleation Rates, 2nd ed.; IChemE: Rugby, UK, 2002. [Google Scholar]
  130. Davey, R.J.; Garside, J. From Molecules to Crystallisers—An Introduction to Crystallisation; Oxford University Press: Oxford, UK, 2000. [Google Scholar]
  131. Kossel, W. Zur Energetik von oberflächenvorgängen. Ann. Phys. 1934, 21, 457–480. [Google Scholar] [CrossRef]
  132. Mullin, J.W. Crystallization, 4th ed.; Butterworth Heinemann: Oxford, UK, 2001. [Google Scholar]
  133. Bennema, P.; Gilmer, G.H. Kinetics of crystal growth. In Crystal Growth, an Introduction; Harman, P., Ed.; North-Holland: Amsterdam, The Netherlands, 1973. [Google Scholar]
Figure 1. Elementary processes occurring during crystallization from solution containing slow inter-converting conformers.
Processes 07 00611 g001
Figure 2. Two main steps occurring during crystal growth from solutions containing atropisomers.
Processes 07 00611 g002
Figure 3. Crystals with two characteristic faces and propagating steps on each face.
Processes 07 00611 g003
Figure 4. Parameter Estimation algorithm.
Processes 07 00611 g004
Figure 5. Two-tier parameter estimation. Plot of total error versus kW and kL. ((a) low-resolution scan of entire range of values of kW and kL, (b) high-resolution scan in an area of location of global minima of the total error. Asterix in (b): Location of the global minima of the objective function).
Processes 07 00611 g005
Figure 6. (a) Computation of transient aspect ratio and particle size distribution. (b) Computation of transient aspect ratio and particle size distribution.
Processes 07 00611 g006aProcesses 07 00611 g006b
Figure 7. The model’s predictions for the final aspect ratio.
Processes 07 00611 g007
Figure 8. Variation of reduced constants, KR and kFR with temperature.
Processes 07 00611 g008
Figure 9. Computation of WC reduced growth inhibition factor in expected ranges for Ea, and temperature for A.
Processes 07 00611 g009
Table 1. Literature accounts of crystallization of atropisomers.
AuthorsEb (kcal/mol)Purity of Atropisomer in CrystalProportion of Crystal Atropisomer in Solution
Walter and maerten [116]NRPureNR
Walter et al. [117] 25.16Pure50%
Walter and Becker [118]22.31Pure50%
Mannschreck [119,120]22.9 at 38.5Pure64% in CCl4 at 38.2 °C
Jaeschke et al. [121]23.4–22.8Pure41% at 50 °C in
1-Chloronaphthalen/Benzotricholide (1:1)
Staab and Lauer [122]32 at 120 °CPure *66% in THF at RT
Mannschreck [119,120]26.8–27.3Pure68% at 50 °C in CDCl3
Xing et al. [56]>25Pure50%
Bungard and Morris [123]NRPure50%
Mannschreck [119,120]NR94%81% at 36 °C in CCl4
Mannschreck et al. [124]22.3–23.294%NR
23.9–24.2Pure *62.5% in CCl4 at 36.5 °C
Parker et al. [125]NR89%NR
NR97%40% at 60 °C
Ischenko et al. [126]11 (Chair major)Pure50%
Jaeschke et al. [121]22Pure57.1% at 50 °C in Hexachlorobutadiene
Derdour and Skliar [50]NMR: 16.8
ab initio: 22.4
Pure15.6%
Li et al. [75]20–21 [108]PureDominant (14 rotors)
Mixture (16 rotors)
Zimmer et al. [78]5.51Pure100%
(NR: Not reported, * Atropisomers were separated by chromatography before isolation by crystallization).
Table 2. Parameters used for computation.
Conditions #C1C2C3C4C5C6C7C8
SL (% input)11221122
AR (mL/(mn)11113333
RSSo (%)151.931.731.7151.9151.931.731.7151.9

