Article

Effect of Hydrothermal Pretreatment on Volatile Fatty Acids Production from Source-Separated Organics

by
Farokh laqa Kakar
1,
Ehssan Hosseini Koupaie
1,
Hisham Hafez
1,2 and
Elsayed Elbeshbishy
1,*
1
Environmental Research Group for Resource Recovery, Department of Civil Engineering, Faculty of Engineering, Architecture and Science, Ryerson University, 350 Victoria Street, Toronto, ON M5B 2K3, Canada
2
Greenfield Global, 275 Bloomfield Road, Chatham, ON N7M 0N6, Canada
*
Author to whom correspondence should be addressed.
Processes 2019, 7(9), 576; https://doi.org/10.3390/pr7090576
Submission received: 7 July 2019 / Revised: 22 August 2019 / Accepted: 23 August 2019 / Published: 1 September 2019
(This article belongs to the Special Issue Processes for Bioenergy and Resources Recovery from Biowaste)

Abstract

:
The current study investigates the effect of hydrothermal pretreatment (HTP) on acidification of source-separated organics (SSO) in terms of volatile fatty acids (VFAs) production and solubilization. Temperature and retention time for HTP of SSO ranged from 150 to 240 °C and 5 to 30 min, respectively. The soluble substance after hydrothermal pretreatment initially increased, reaching its peak at 210 °C and then declined gradually. The highest overall chemical oxygen demand (COD) solubilization of 63% was observed at “210 °C-20 min” compared to 17% for raw SSO. The highest VFAs yield of 1536 mg VFAs/g volatile suspended solids (VSS) added, was observed at “210 °C-20 min” compared to 768 mg VFAs/g VSS for raw SSO. Intensification of hydrothermal pretreatment temperature beyond 210 °C resulted in the mineralization of the organics and adversely affected the process.

1. Introduction

Fulfilling the food and modern habitat demand for the growing population is one of the major challenges of the 21st century while reducing the adverse impact of the food waste, wood waste, yard and landscaping debris, and paper fibers or source-separated organics (SSO) production system on the environment [1]. Canada annually produces 25 million tons of wastes [2] and 75,000 tonnes of SSO in Toronto [3]. Hence, abundant solid waste generation and its appropriate treatment has become a global challenge.
Food waste management hierarchy indicates that prevention is the best strategy, followed by biological treatment (anaerobic digestion and composting), thermal disintegration (incineration), and landfilling. Thermal treatment of solid waste requires a high amount of energy to evaporate the water, mineralize, and recover energy, while biological treatments are more cost-effective, reliable, and feasible [4]. Biological treatments such as anaerobic digestion (AD) and dark fermentation have been extensively studied for their ability to convert a wide variety of lignocellulosic biomass to methane and biohydrogen, respectively [5,6].
Anaerobic digestion has four stages: hydrolysis, acidogenesis, acetogenesis, and methanogenesis. The first two steps, which involve hydrolysis and acidogenesis, are known as acidogenic fermentation or dark fermentation. During hydrolysis, complex organic polymers in the substrate are broken down into simpler organic monomers by the enzymes excreted from the hydrolytic microorganisms. Subsequently, acidogens ferment these monomers mainly into volatile fatty acids (VFAs) such as acetic, propionic, butyric, and lactic acids [7,8,9].
VFAs are mainly produced by chemical and petrochemical approaches that use nonrenewable materials and cause pollution [10]. However, the production of VFAs through the dark fermentation process from waste is considered to be a sustainable method for on-site application as a carbon source for biological nutrient removal (BNR) that uses renewable resources. VFAs can also be utilized for the production of biodegradable plastics or generation of bioenergy [7,11].
In the dark fermentation or the AD process, hydrolysis is the rate-limiting step because of the complex structure of some wastes, including lignocellulosic biomass. In addition, the limited surface area of recalcitrant parts of biomass does not provide easy access for the biodegradable organics during hydrolysis [12]. Such limited accessibility causes significantly lower process efficiency than the theoretical estimations based on the biomass’ structural features. To overcome these obstacles and enhance the hydrolysis step, scholars have come up with a variety of approaches. One of the main approaches to enhance the hydrolysis step is pretreatment. Scholars have utilized a variety of mechanical, chemical, thermal, and biological pretreatment methods prior to anaerobic digestion for different substrates to enhance the biodegradability of the materials and expedite the hydrolysis step [6].
Hydrothermal pretreatment (HTP) has been broadly explored as a pretreatment method for VFAs and methane production because of its high efficiency and eco-friendliness as well as having a recognized and successful manufacturing application background [6]. The disintegration of a material’s cell membranes due to HTP leads to the dissolution of soluble organics as well as the promotion of hydrolysis of dissolved macromolecular organics [13,14]. However, some studies revealed that hydrothermal pretreatment higher than 200 °C results in occurrence of Maillard reaction, which leads to the production of the melanoidins. These compounds are difficult to degrade and inhibit the degradation of other organics such as VFAs [15,16]. Yin et al. [16] investigated the effect of melanoidins on VFA production from food waste by adding low (4 g), medium (8 g), and high (16 g) dosages of melanoidins to the food waste that was hydrothermally pretreated at 120 °C for 30 min. It was found that low and medium dosages of melanoidins did not affect the VFA production, whereas high dosage of melanoidins reduced the VFA production by 12% compared to the control.
Most studies concentrate on the effect of HTP on AD and biomethane production from food waste. Scholars investigated the impact of HTP ranging from 100 °C to 220 °C. The previous studies reported that HTP promoted the solubilization of organic biomass and VFAs production; however, it inhibited hydrogen production [13,17,18,19]. Table 1 shows some studies on the effect of HTP on the acidification and AD of food waste. For example, Yin et al. [13] evaluated the impact of hydrothermal pretreatment on fermentation of food waste at temperatures of 120, 140, 160, 180, 200, and 220 °C for 30 min retention time. They found that the optimum HTP condition for VFAs production was 160 °C. The VFAs yield increased from 0.6 g acetic acid/g vs. removal for the raw sample to about 0.9 g acetic acid/g vs. removal for the pretreated sample. “VS” stands for Volatile solids which represents the amount of organics present in the initial sample. In another study, Li and Jin [14] investigated the impact of hydrothermal pretreatment at different temperatures of 55, 70, 90, 120, 140, and 160 °C on the acidification phase of two-stage anaerobic digestion of kitchen waste. They observed that the highest VFAs concentration of 4.4 g/L was achieved for the sample pretreated at “120 °C-50 min” compared to 1.5 g/L for the raw sample. Ding et al. [17] studied the effect of HTP of food waste for two-stage AD at the temperatures of 100, 120, 140, 160, 180, and 200 °C for 20 min. In addition, a set of experiments were performed at 140 °C but for different times of 5, 10, 15, 25, and 30 min.
Considering the above-mentioned studies, it was revealed that HTP is a promising pretreatment technology for enhancing VFAs production. However, its impact is highly related to the severity of the HTP conditions, which are affected by both temperature and retention time. There is no comprehensive study on the effect of HTP on VFAs production combined with different temperatures with different retention times. Furthermore, to the best of the authors’ knowledge, there is no single study on the effect of different combinations of heat and retention time for the same severity index. A more comprehensive range of HTP temperatures and retention times needs to be investigated to further determine the effect of HTP on acidification of food waste and VFAs production.
Therefore, the aim of this study was to explore the effect of hydrothermal pretreatment on solubilization of organic matter after the HTP and fermentation process as well as the production of VFAs due to acidification by applying a wide range of temperature and retention time. A novelty of this research is the hired substrate, SSO, which was subjected to HTP. SSO is a combination of lignocellulosic materials and food waste collected together from the green bins of residential households.

2. Methods and Materials

2.1. Substrate and Inoculum

SSO is a combination of food waste, wood waste, yard and landscaping debris, and paper fibers collected from the Toronto SSO green bin program of single and multifamily residential and various commercial and agency departments. SSO samples were obtained from the Disco Road Organic Processing Facility (DROPF) located in Toronto, Canada. In 2010, this facility was designed and built on CCI’s technology platform, the BTA® Process. The design capacity is 75,000 metric tonnes of residential and commercial SSO per year. DROPF operates in three phases; the preprocessing stage, conversion phase, and utilization phase. During the preprocessing step, SSO is fed directly to the BTA® Hydromechanical Pretreatment System, which is designed with 3 × BTA® Waste Pulpers and 3 × BTA® Grit Removal Systems where the organics will eventually turn into a liquid (slurry) pulp. Afterwards, preprocessed wastes undergo wet digestion process in the mesophilic range using 2 × 5300 m3 digesters that are continuously mixing using compressed biogas [3]. The samples for this study were obtained after SSO passed through BTA® wet mechanical pretreatment occurring within two core components, the BTA® waste pulper and the BTA® grit removal system, and before feeding to the anaerobic digester.
The seed inoculum for fermentation experiment was collected from a steady operating digester at Ash-bridges wastewater treatment plant (AWWTP) located in Toronto, Ontario. The treatment capacity of this plant is 818,000 m3/day and serves a population equivalent of 1,524,000. The anaerobic digestion tanks operate under a mesophilic temperature range (34–38 °C) and with a sludge hydraulic retention time of 18 days. The digesters have 30.5 to 33.5 m diameter and the organic loading rate of the digester is approximately 1.1 kg TVS/m3 (TVS: Total Volatile Solids) of digester capacity per day [20].
The inoculum was thermally pretreated to enrich the VFA-producing microorganisms and inactivate the methanogens. The freshly collected inoculum was heated to reach 70 °C and stirred continuously at 60 rpm (it took about one hour). It was then incubated for 30 min at the same temperature while being stirred continuously. Afterwards, the inoculum was cooled down to room temperature in order to be used in the fermentation experiment. The characteristics of unpretreated SSO and the seed inoculum can be found in Table 2.

2.2. Hydrothermal Pretreatment

To promote the solubility and biodegradability of the substrates, SSO was hydrothermally pretreated. HTP was carried out under five different severity index values (SI) of 3, 3.5, 4, 4.5, and 5. Under each SI, different combinations of temperature (150 to 240 °C) and retention time (5–30 min) were studied. Overall, SSO went through fifteen different pretreatment scenarios. Table 3 shows the experimental design of the hydrothermal pretreatment. Temperature and retention time were independent variables that were controlled during the hydrothermal pretreatment, while pressure was a variable dependent on the HTP temperature and retention time (RT) and was monitored throughout the HTP process. SI is a function of hydrothermal pretreatment temperature and retention time [21] that can be calculated by Equation (1):
SI = log [t × exp((T − 100)/14.75)]
where T is the hydrothermal temperature (°C) and t is retention time (min).
The hydrothermal pretreatment was performed with a Parr 4848 Hydrothermal Reactor with a capacity of 2 L. During the pretreatment, the SSO was constantly mixed and the heating ramp rate was 3 °C/min at the beginning of the process and then it was lowered to 2 °C/min. The last phase of hydrothermal pretreatment consisted of holding the sample at the target HTP temperature. The hydrothermal reactor was operated by a specView Parr 4848 controller equipped with proportional integral derivative (PID) programming with autotuning capabilities for accurate control of temperature, heating ramp, and soak (retention time) and the pressure and hydrothermal pretreatment rate was recorded accordingly.

2.3. Acidification Experiment

Hydrothermally pretreated and raw SSO were mixed with the inoculum considering the food to microorganisms (F/M) ratio of 1 g-TCOD/g-VSS. All mixed samples were then placed in incubators and were fermented. Acidification experiments were conducted in triplicate for each pretreated and raw sample, which resulted in 48 mesophilic batches. Each reactor had a total volume of 500 mL. The working capacity of each reactor was 300 mL. Volumes of substrates and inoculum were calculated based on the F/M ratio of 1 g-TCOD/g-VSS using Equation (2).
F M = T C O D S S O × V 1 V S S s e e d × V 2
where V1 and V2 represent the volumes of substrate and inoculum, respectively. VSSseed is the VSS of the inoculum, and TCODSSO indicates the Total COD of the SSO. After adding the substance and inoculum, the initial pH was adjusted to be 5.50 by using adequate 3.5 M HCl or NaOH. To make sure that the anaerobic condition is maintained, the reactors were purged with nitrogen gas for 5 min, and then the reactors were sealed. The experiments were conducted using the Bioprocess Automatic Methane Potential Test System (AMPTS) II. This system consists of two main components—the sample incubation unit and the gas volume measuring device. In the sample incubation unit, the sealed reactor was placed and incubated for 72 h. The temperature was maintained at 37 °C and the mixer rotational speed was set at 120 rpm. In the gas volume measuring unit, the gas released from unit A was measured using a wet gas flow measuring device with a multiflow-cell arrangement. An integrated embedded data acquisition system was used to record, display, and analyze the results.

2.4. Solubilization Study

The performance of the pretreatment process can be determined by the degree of solubilization [22]. To determine the impact of HTP on solubilization of SSO, soluble contents of the substrate, such as chemical oxygen demand (COD), carbohydrates, and proteins, were measured before and after HTP. The COD solubilization percentage (%) due to HTP detected in this study was calculated using Equations (3) and (4):
S o l u b i l i z a t i o n   p e r c e n t a g e   ( % ) =   S C O D H T P S C O D R a w / P C O D R a w × 100
P C O D R a w = T C O D R a w S C O D R a w
The solid reduction percentage “R” of the hydrothermally pretreated samples was calculated using Equation (5):
R   ( % ) = V S S R a w V S S H T P / V S S R a w × 100
The percentage of COD solubilization during the acidification test was calculated using Equations (6)–(10).
S o l u b i l i z a t i o n   p e r c e n t a g e   ( % ) = M S C O D P / P C O D S u b
M S C O D P = M S C O D F M S C O D I
S C O D I = S C O D S u b × V S u b + S C O D S e e d × V S e e d V S u b + V S e e d
P C O D H T P = T C O D H T P S C O D H T P
M a s s   o f   S C O D F = S C O D F × ( V S u b + V S e e d ) S C O D S e e d × V S e e d
The abbreviations used in the abovementioned equations are explained as follow:
  • S C O D H T P : Concentration of soluble COD of TWAS after HTP
  • S C O D R a w : Concentrations of soluble COD of the raw sample
  • PCODRaw: Particulate COD of the raw substrate before adding to the reactor
  • T C O D R a w : Concentrations of total COD of the raw sample
  • V S S R a w : Volatile suspended solids (VSS) concentration of the raw sample
  • V S S H T P : Volatile suspended solids (VSS) concentration of the pretreated sample
  • M S C O D P : Mass of soluble COD produced
  • P C O D S u b : Particulate COD of raw or pretreated samples that can be calculated as P C O D R a w or P C O D H T P
  • M S C O D F : Mass of soluble COD after acidification
  • M S C O D I : Mass of soluble COD before acidification
  • S C O D I : Soluble COD before acidification
  • SCODSub: Soluble COD of the substrate (raw or pretreated)
  • VSub: Volume of substrate added to the acidification reactor
  • SCODSeed: Soluble COD of the inoculum
  • VSeed: Volume of inoculum added to each acidification reactor
  • PCODHTP: Particulate COD of the pretreated substrate before adding to the reactor
  • TCODHTP: Total COD concentration of the pretreated sample
  • SCODF: Soluble COD after acidification test.
Mass of SCODF was calculated with the assumption that the SCOD in the seed was not degraded or converted during the acidification process.

2.5. Analytical Methods

Soluble and solid indexes, including SCOD, total COD (TCOD), soluble and total protein, carbohydrate, ammonium nitrogen (NH4+–N), total suspended solids (TSS), volatile suspended solids (VSS), alkalinity, viscosity, and particle size distribution (PSD) were measured before and after the HTP process. In addition, VFAs were measured at the end of the fermentation experiment. All untreated, pretreated, and fermented samples were centrifuged at 3600 rpm for 10 min following filtration through a membrane filter with a pore size of 0.45 µm to separate the particulate part of samples from the soluble part for the soluble analysis.
The TSS and VSS were analyzed in accordance with the standard methods [23]. The total and soluble protein were determined via Coomassie Bradford assay [24]. Total and soluble carbohydrates were measured using the phenol sulfuric acid method [25]. TCOD, SCOD, and ammonium nitrogen were assayed using the reactor digestion method and salicylate methods, respectively, via a HACH DR 2900 spectrophotometer [26]. The particle size distribution (PSD) was determined via a laser diffraction particle size analyzer (model: LS 13 320, Beckman Coulter, Indianapolis, IN, USA). The viscosity of substrates before and after HTP was determined with a Fungi lab Alpha Series Rotational Viscometer, software version 1.2, under room temperature.
VFAs fractions were analyzed using Agilent 7820A gas chromatography equipped with a flame ionization detector (Agilent Technologies, Santa Clara, CA, USA) and DB-wax column 15 m × 0.32 mm × 0.5 μm (Agilent Technologies, Santa Clara, CA, USA). The oven temperature for VFA analysis was programmed to initially hold at 80 °C for 1 min, then increase to 180 °C at a slope of 10 °C/min and maintain at 180 °C for 4 min. The hydrogen content of the produced gas was measured with the gas chromatography (GC) method by Thermo Scientific Trace 1310 GC after 16, 24, 48, and 72 h under 100 °C detector temperature. The model of the column used in the GC was TG-Bond Msieve 5A with 30 mm length and 0.53 mm diameter.

2.6. Statistical Analysis

To evaluate the significance of the three variables, temperature, retention time, and severity index, on the performance of the dark fermentation and sludge solubility, multifactor analysis of variance (ANOVA) was used. The main effect plot, interaction plot, and contour plot were created via Minitab and Matlab R2018a. Correlation between solubilization after HTP and fermentation for VFAs production was calculated using Excel data functions. The confidence level for all analyses was chosen as 95%. All analysis was done in triplicate and the standard deviations of all measurements were calculated by Excel.

3. Results and Discussion

3.1. Effect of Hydrothermal Pretreatment on Source-Separated Organics

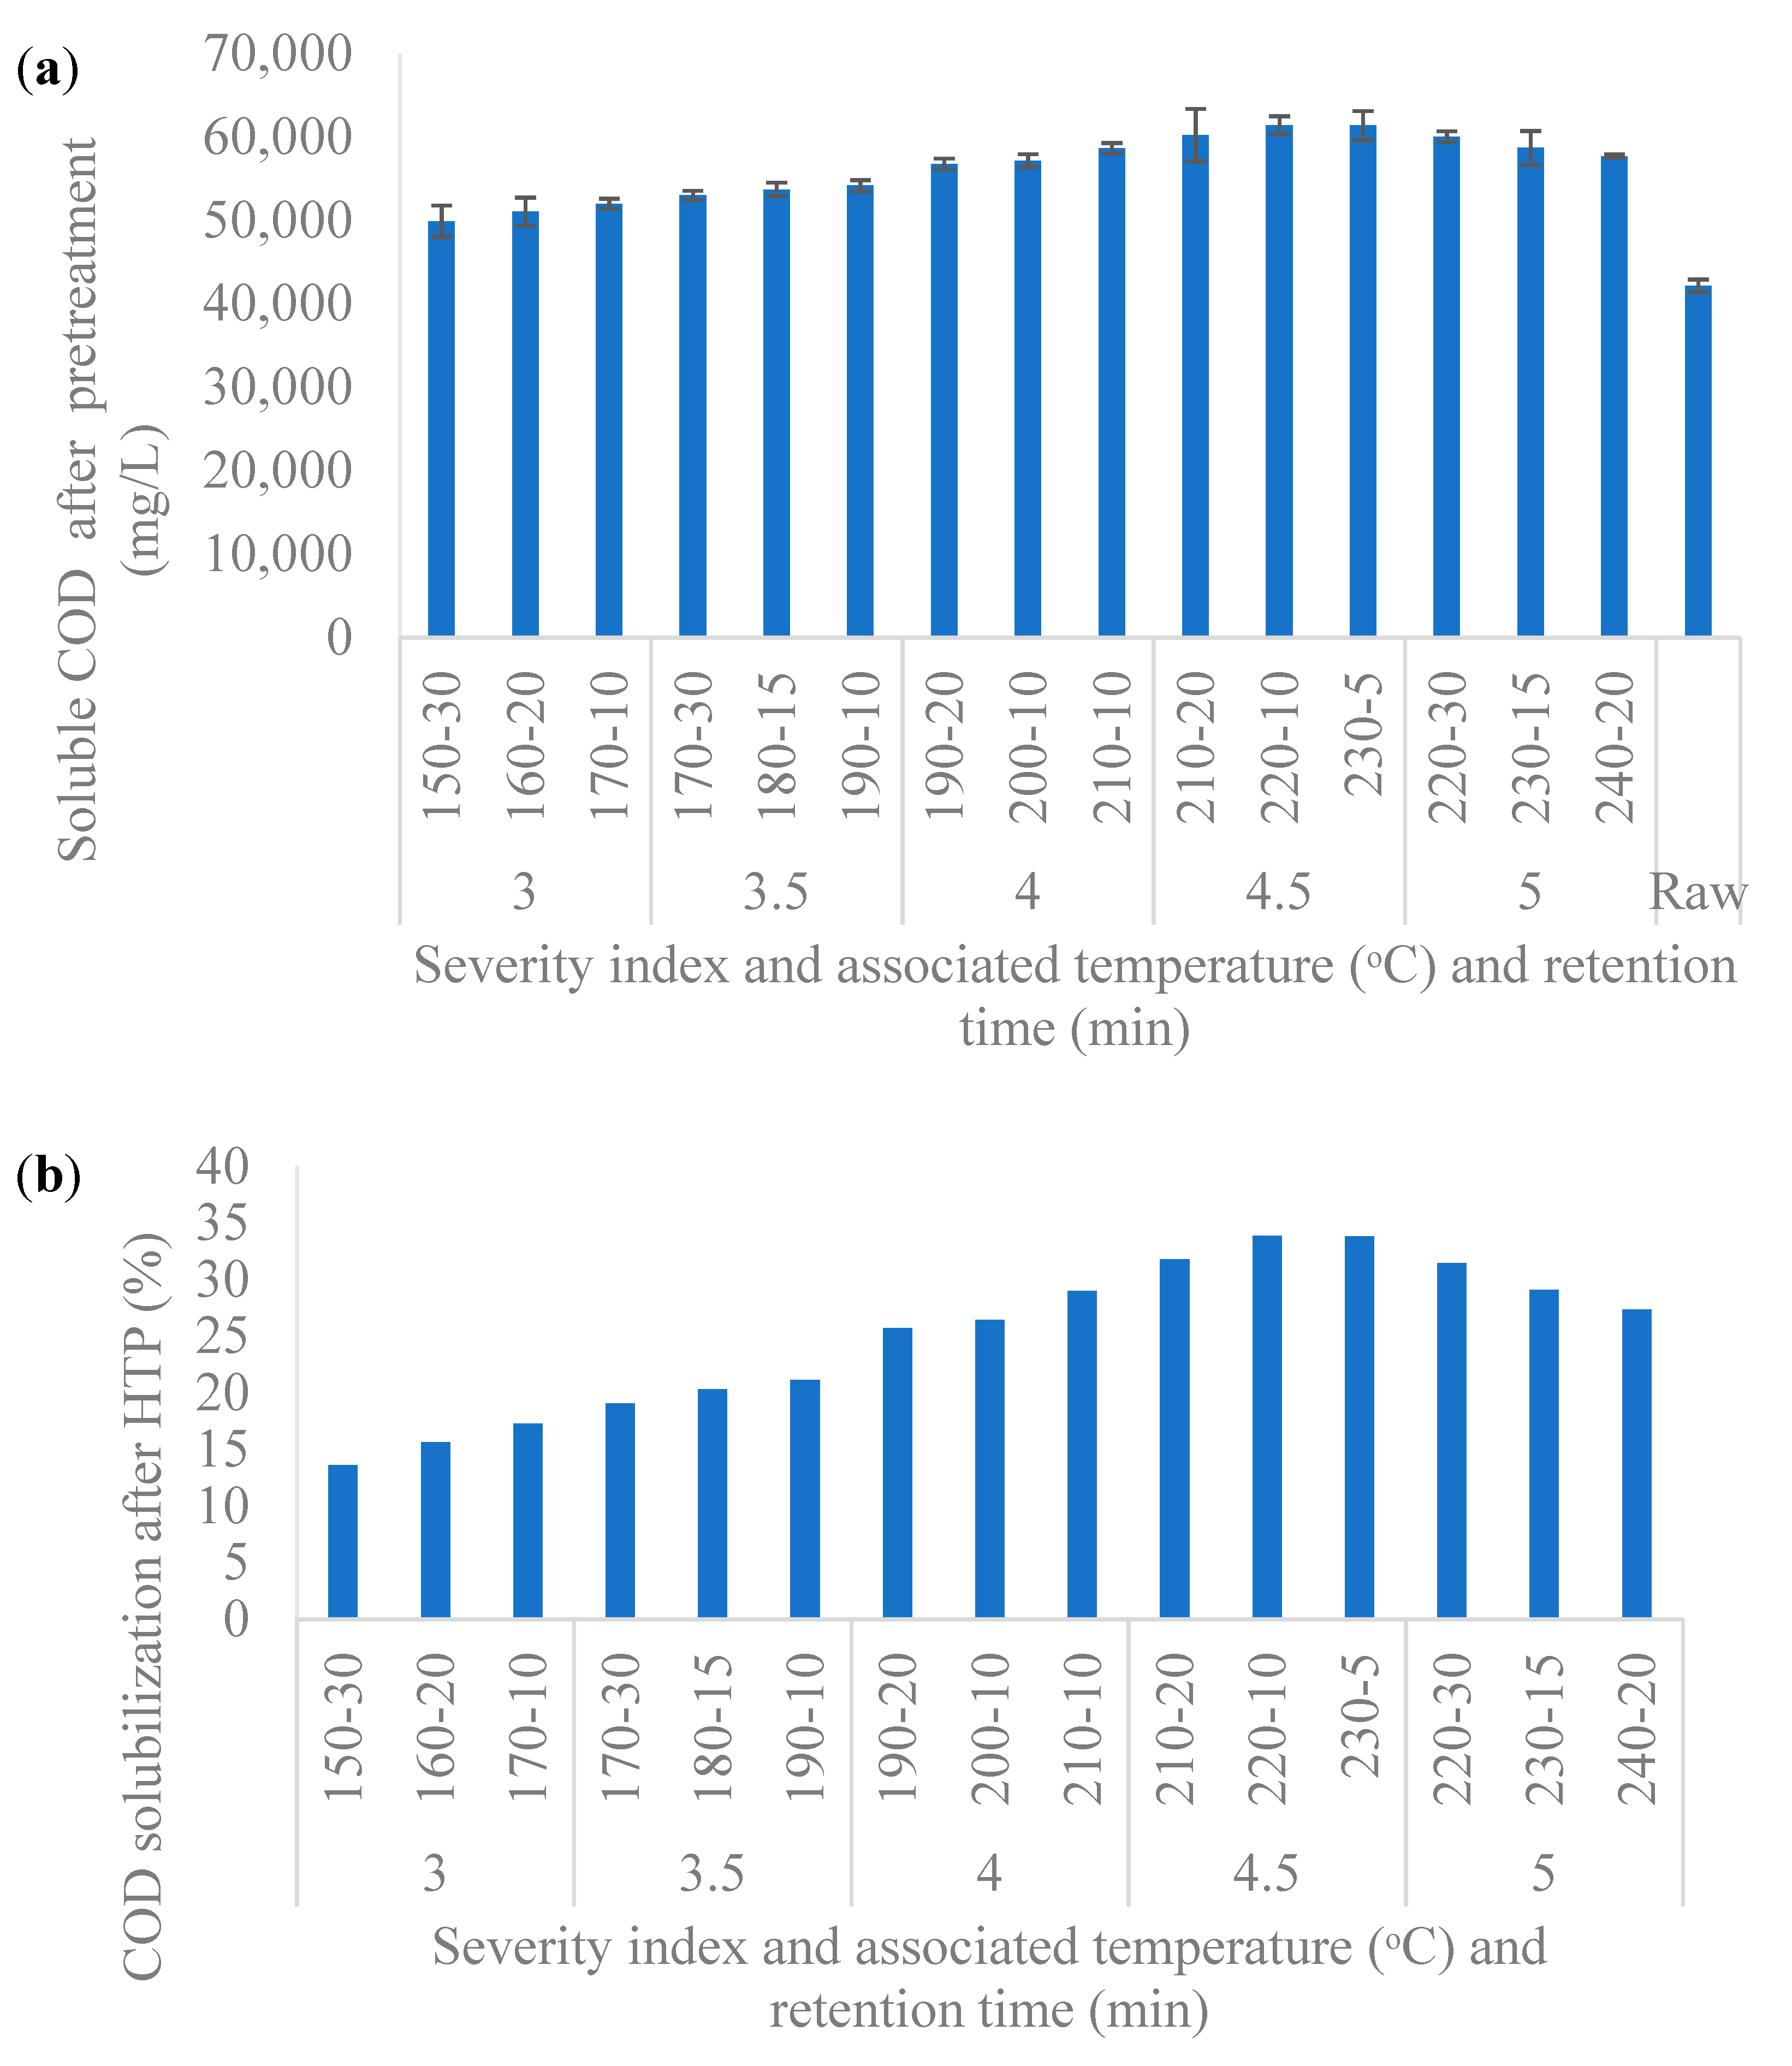
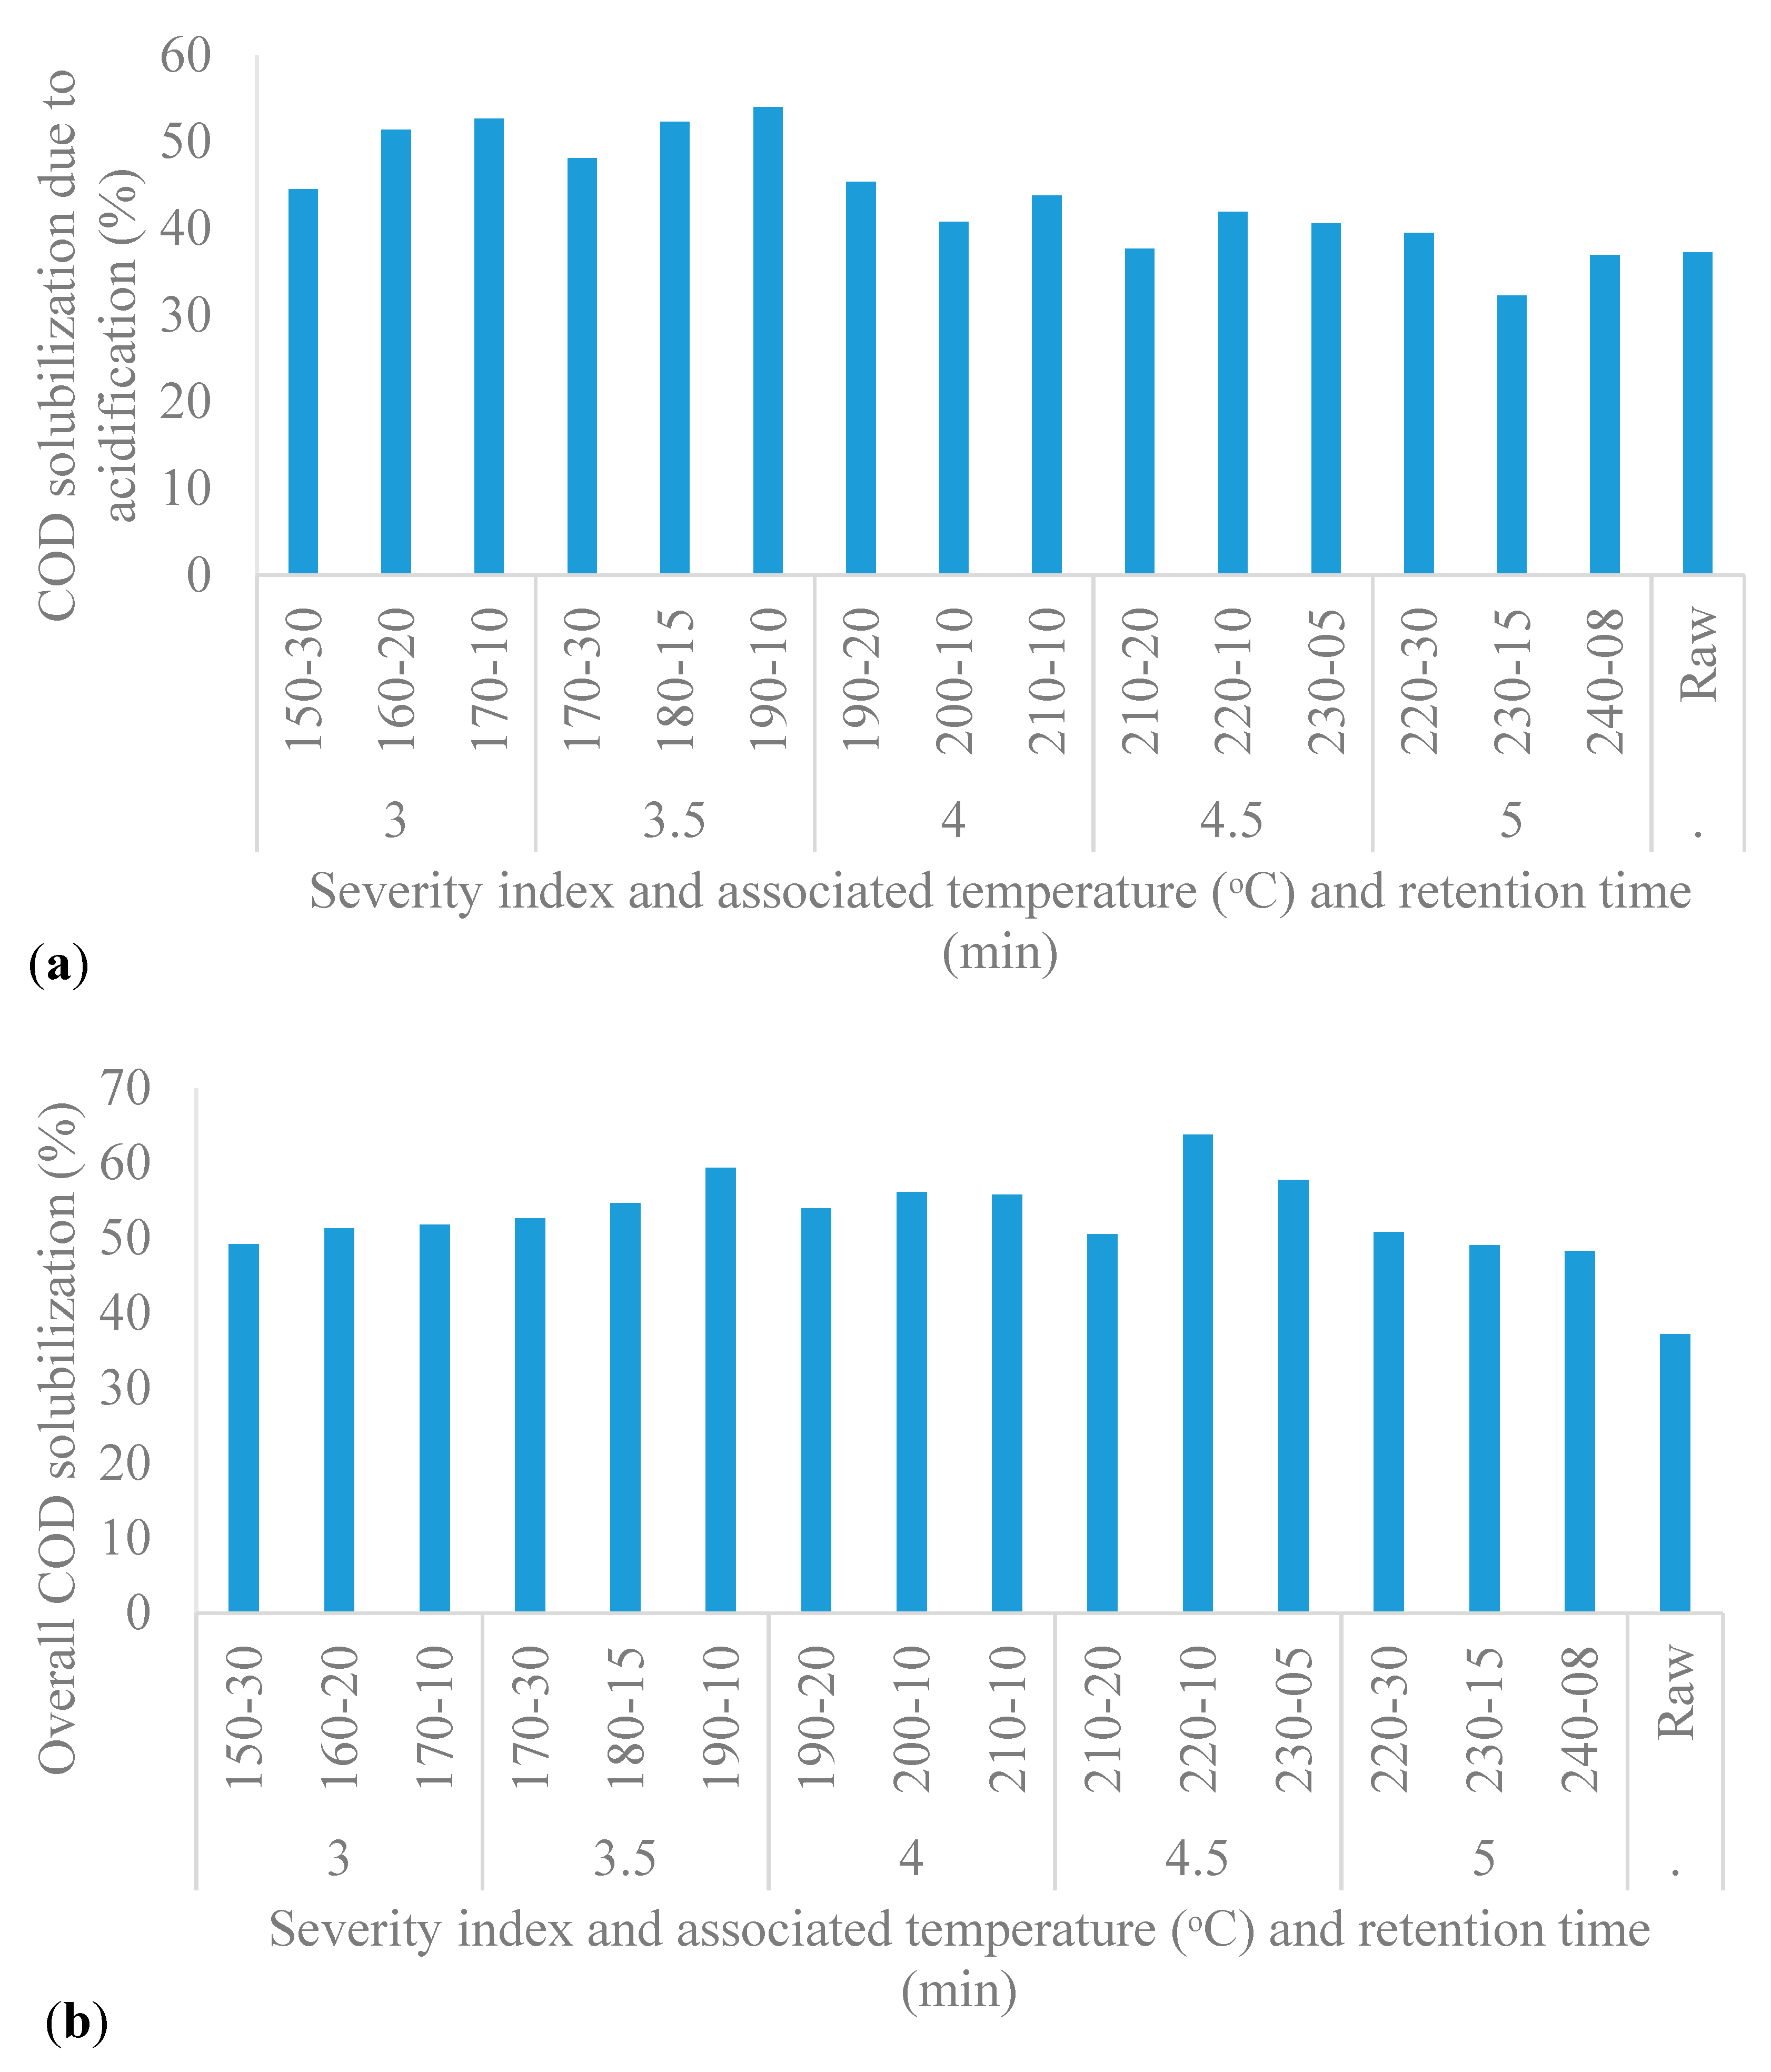
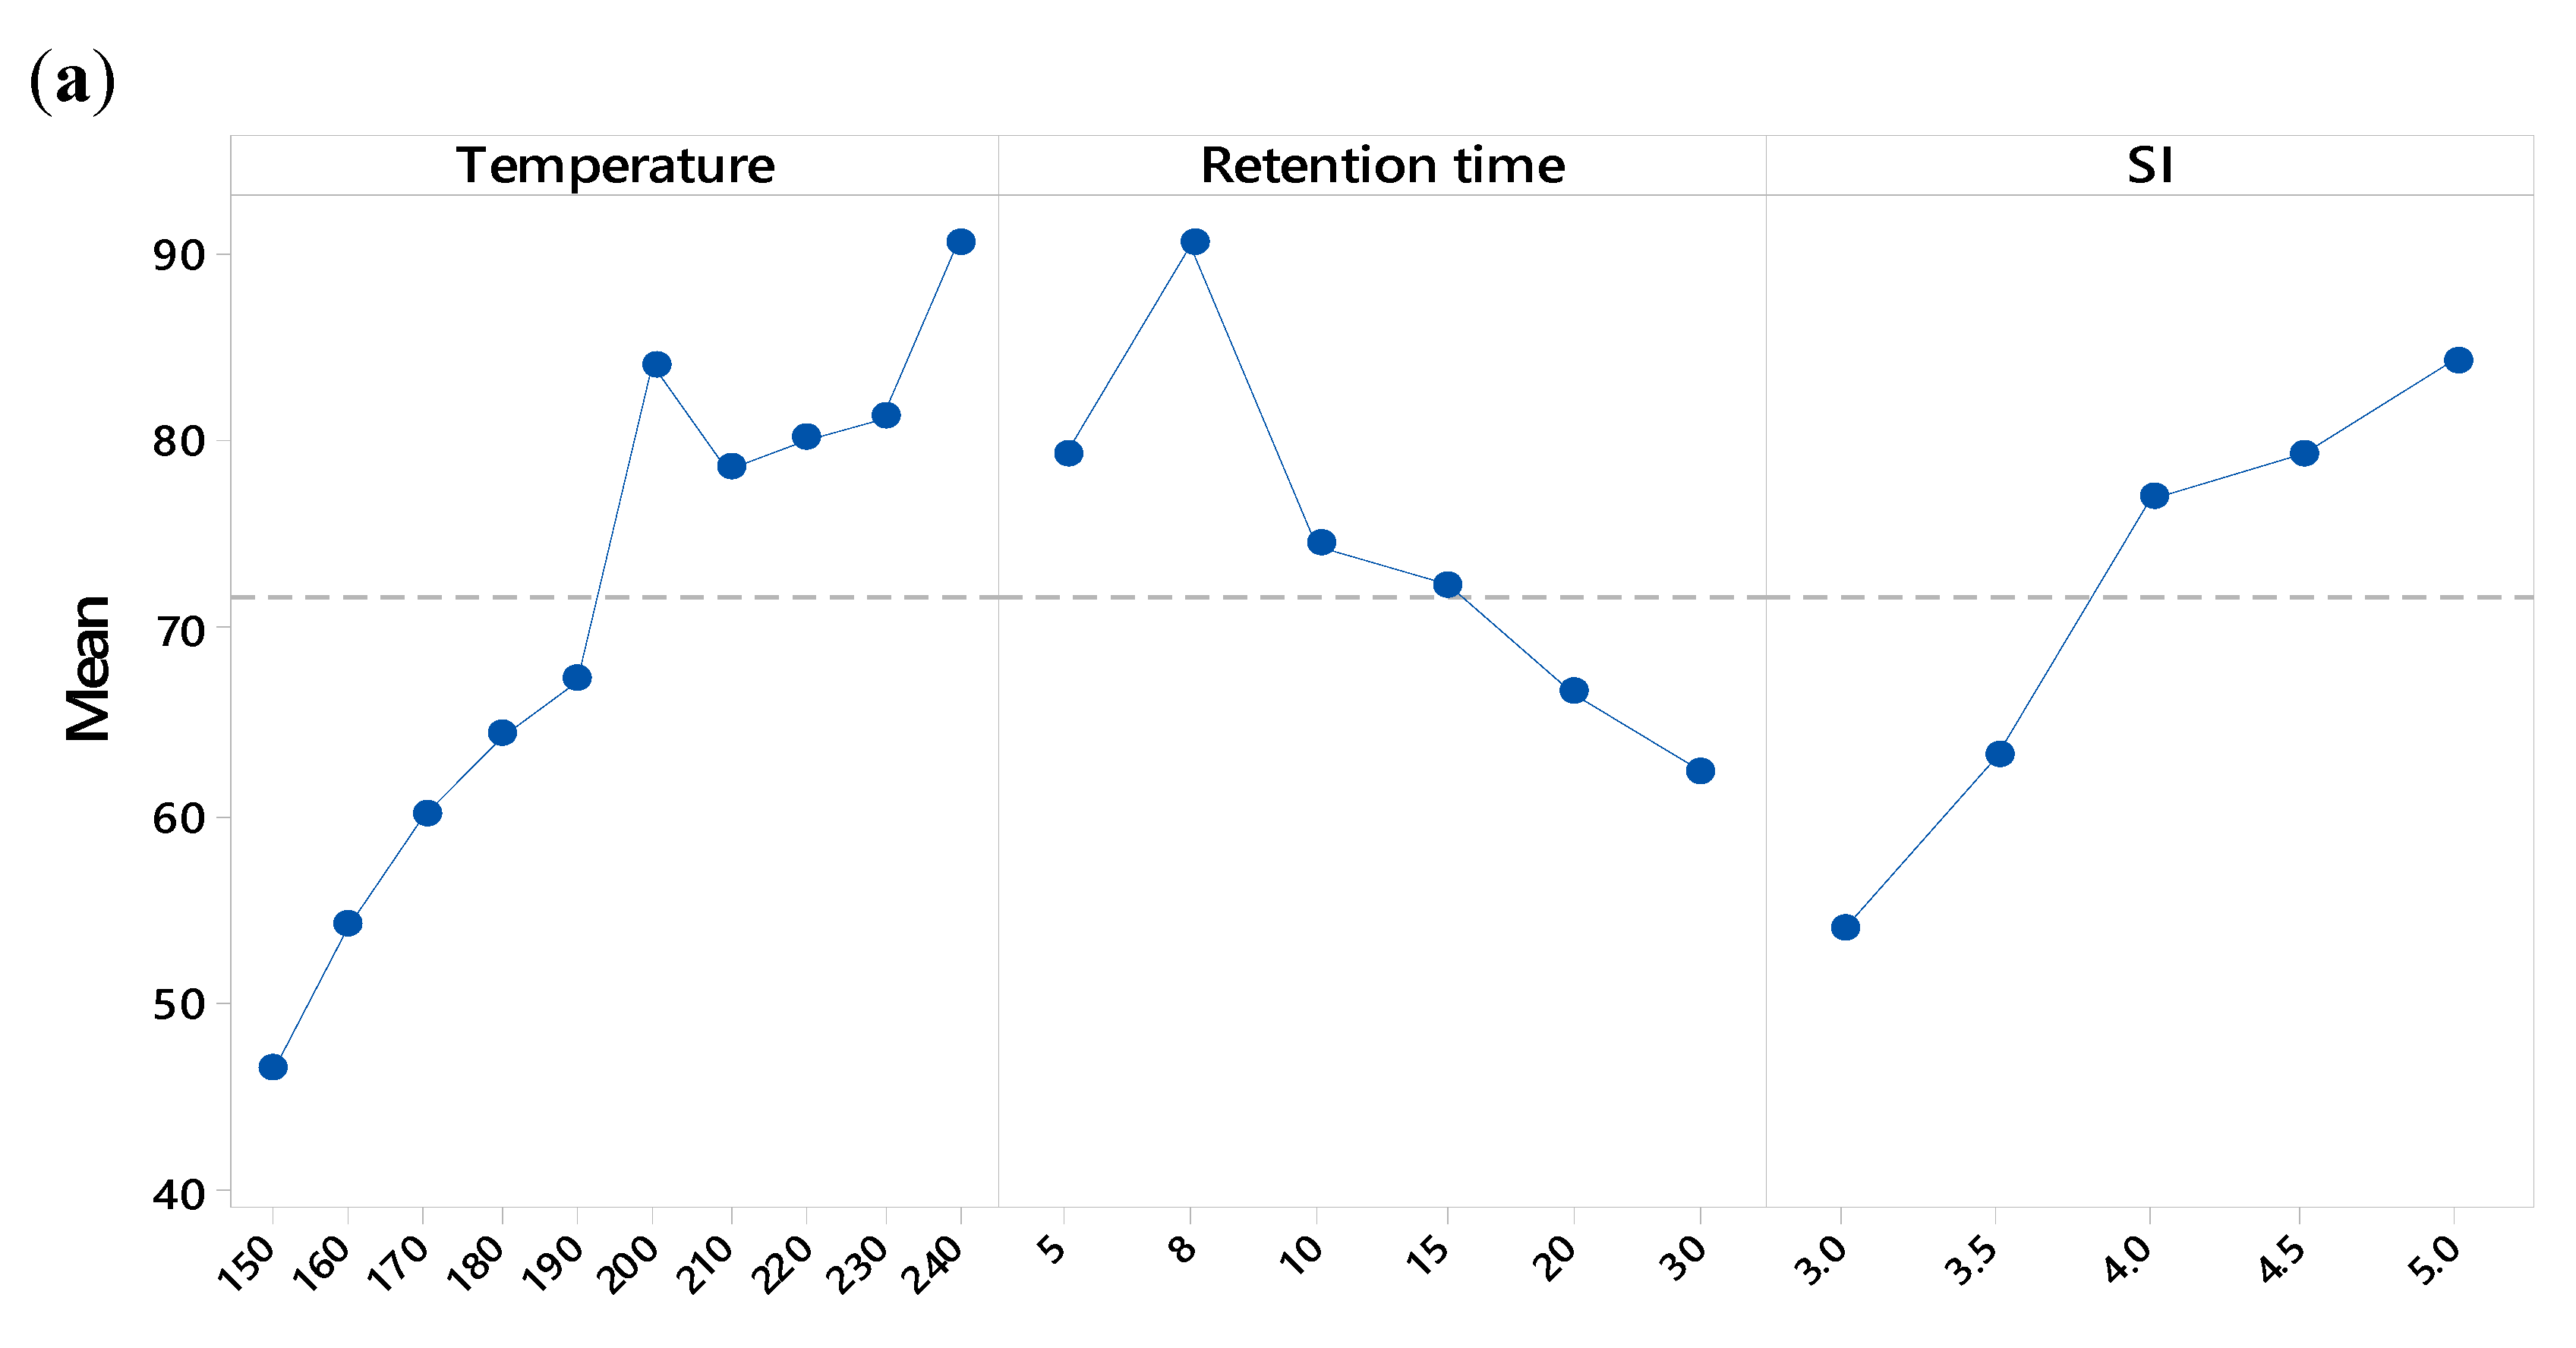
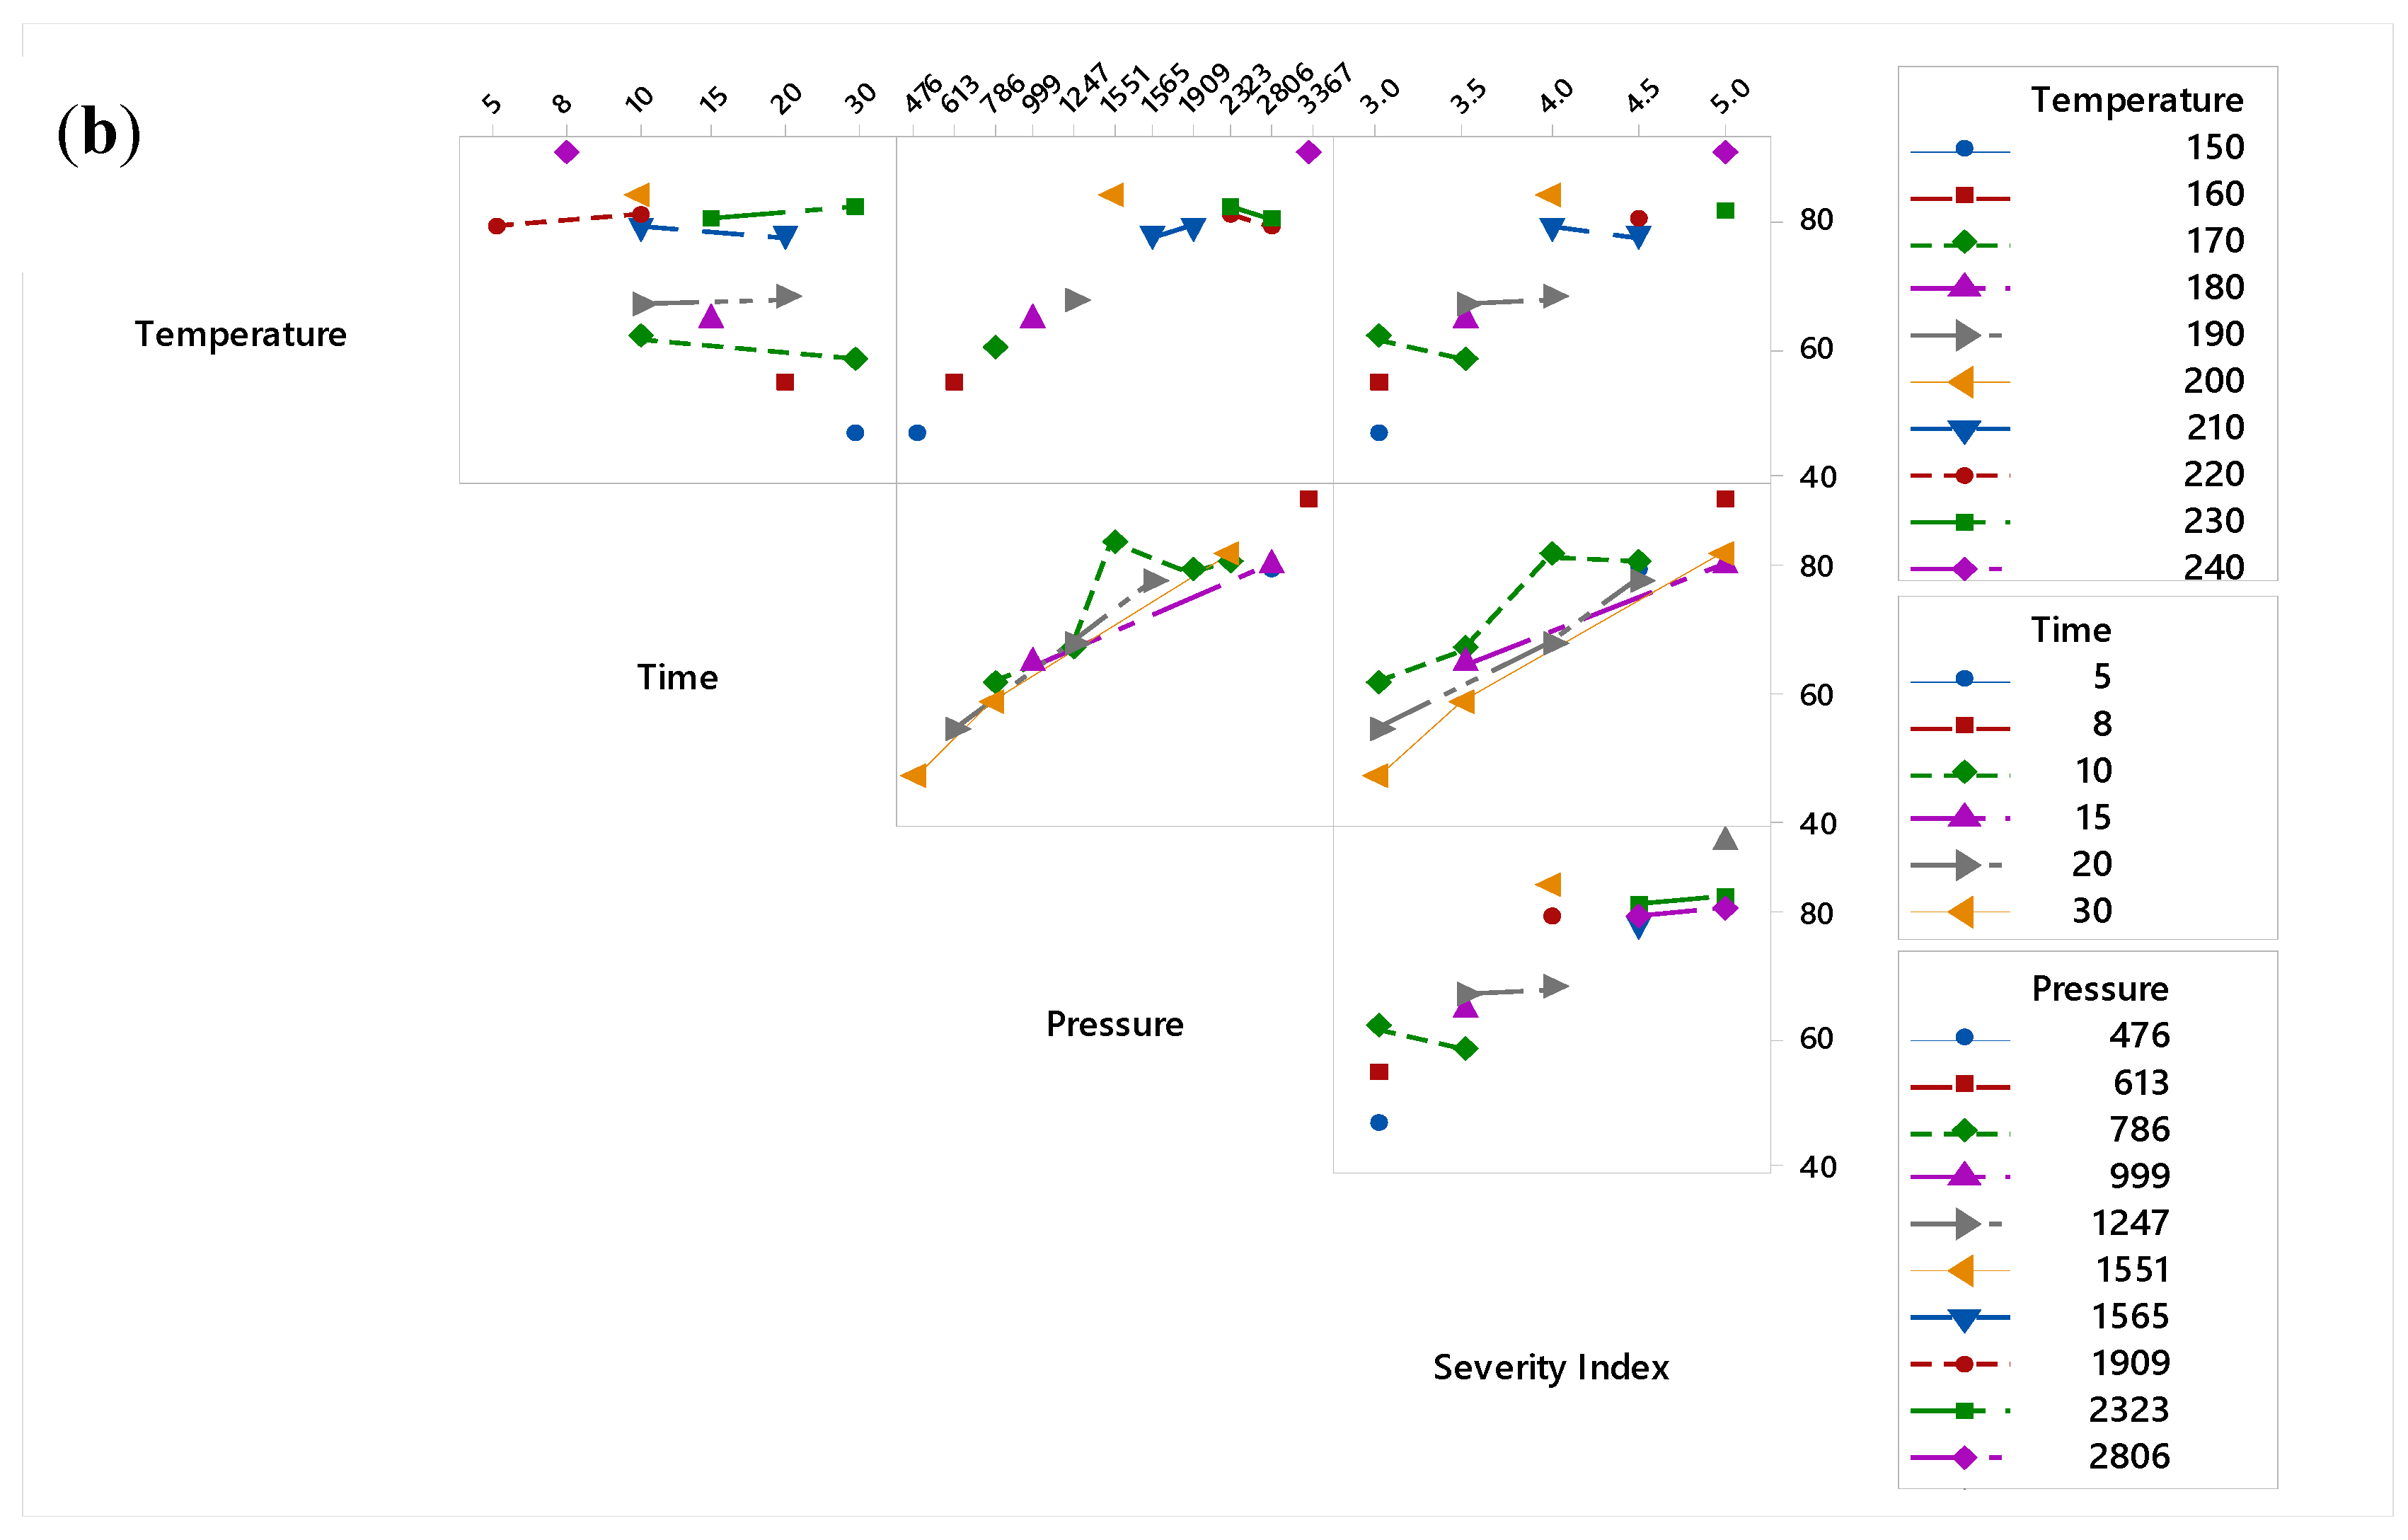
3.1.1. COD Solubilization of Source-Separated Organics

SSO samples were hydrothermally pretreated in fifteen different scenarios with a temperature range of 150 °C to 240 °C and a retention time of 5 to 30 min. After HTP, the soluble COD of all pretreated samples was higher than that of the unpretreated samples, which implies that HTP promoted the solubilization of solid organics in the SSO, see Figure 1a. As the temperature was elevated from 150 °C to 220 °C, the COD solubilization percentage was enhanced from 14% to 34% and ANOVA (p <0.05) confirmed that the effect of temperature on organic dissolution was significant. In spite of this, when the temperature increased to 240 °C, the solubilization percentage dropped to 27%, see Figure 1b. Likewise, Ding et al. [17] reported that at higher temperatures, the COD solubilization percentage began to decrease. The reason behind this phenomenon was the formation of insoluble high-carbon hydrochar, which is a result of intensified carbonization of SSO by high temperature [27].
Looking into each severity index to evaluate the effect of retention time on the dissolution of the SSO, it was found that at severity indexes of 3.00 to 4.5, higher temperatures with lower retention time demonstrate higher COD solubilization. Whereas, at a severity index of 5.00, lower temperature with higher retention time had superior results. For example, at SI of 3, the sample pretreated at “170 °C-10 min” showed a higher solubilization percentage of 17% compared to the 14% solubilization at “150 °C-30 min”. Whereas, at SI of 5, the sample pretreated at “220 °C-30 min” demonstrated a solubilization percentage of 31% which was higher than that of “240 °C-08 min” with 27% COD solubilization.
The effect of RT on the COD solubilization of the SSO was evaluated by ANOVA. It was observed that longer retention time did not have a significant effect on substrates cell disintegration as its p-value was higher than 0.05, demonstrating moderate evidence for significance of retention time. Ultimately, the severity index of 4.5 was found to be the optimal HTP condition in terms of COD dissolution.
In this experiment, the highest percentage of solubilization occurred at pretreatment conditions of “220 °C-10 min” and “230 °C-05 min” with a maximum solubilization percentage of 34%. Menon et al. [18] applied HTP to food waste at different temperatures of 80, 105, and 130 °C. They found that the highest COD solubilization percentage of 43% was achieved at 130 °C for 30 min, which is not in agreement with our study’s result. In another study, Ding et al. [17] reported the highest peak of COD solubilization of 70% was achieved at 180 °C for 20 min when they pretreated food waste with a temperature range of 100 to 200 °C. This dissimilarity for the optimal HTP condition might be due to the nature of the substrates, as SSO contains more lignocellulosic material which needs higher temperatures to be degraded [28]. After the HTP of SSO, the pH of all pretreated substrates decreased compared to the raw SSO, demonstrating the generation of organic acids at high temperatures [13]. Consequently, it can be concluded that the HTP promotes COD solubilization of SSO and the optimal condition for the highest COD solubilization would be at an SI of 4.5.

3.1.2. Carbohydrates and Proteins

An increase in temperature of HTP demonstrated a considerable effect on both total and soluble carbohydrates of hydrothermally pretreated SSO. With increasing temperature, the soluble carbohydrates increased to the highest concentration of 1949 mg/L at a temperature of “200 °C-10 min”, after which it started to drop. However, the concentration of total carbohydrates was negatively correlated with raising the temperature. For example, the concentration of total carbohydrates for the sample hydrothermally pretreated at “150 °C-30 min” was 11,500 mg/L, which was higher than that of the sample pretreated at higher HTP temperatures of “240 °C-08 min” with 6900 mg/L total carbohydrates.
Enhancement of soluble carbohydrates due to HTP is expected as the large-molecular-weight carbohydrate polymers (e.g., starch, cellulose, and hemicellulose) were hydrolyzed into small-molecular weight oligosaccharides and monosaccharides (e.g., glucose and xylose), leading to the release of soluble sugars from solid carbohydrates in SSO [29]. However, some soluble sugars, such as hemicellulose derivatives, were further degraded into short-chain VFAs, such as acetic acid, hence minimizing total carbohydrates [30]. However, the reduction of the soluble carbohydrates in intensified HTP temperature is due to the formation of Amadori-like compounds which are byproducts of melanoidins [31]. Melanoidins are formed by the reaction between soluble carbohydrates with themselves or proteins [32]. Ding et al. [17] applied a 100–200 °C HTP temperature to waste activated sludge (WAS). They found that an increase in HTP temperature resulted in the enhancement of soluble carbohydrates solubilization from 51% to 74% when the temperature reached 180 °C, and then dropped to 54% when the temperature increased to 200 °C.
Considering the concentration of soluble proteins after and before HTP, it was observed that the soluble proteins for all hydrothermally pretreated samples were higher than that of the raw samples (77 mg/L). As the HTP temperature was increased from 150 °C to 170 °C, the concentration of soluble proteins was enhanced from 330 to 420 mg/L (the highest soluble protein content), followed by a significant drop to 131 mg/L for the “240 °C-8 min” sample.
The protein and ammonia results indicate that the solubilization of protein was dramatically promoted after HTP, whereas the degradation of protein was not remarkable. This observation is in accordance with two similar studies [13,17]. The highest temperature used for HTP of food waste in this research was 200 °C. It was found that an increase in temperature increases the protein solubilization.

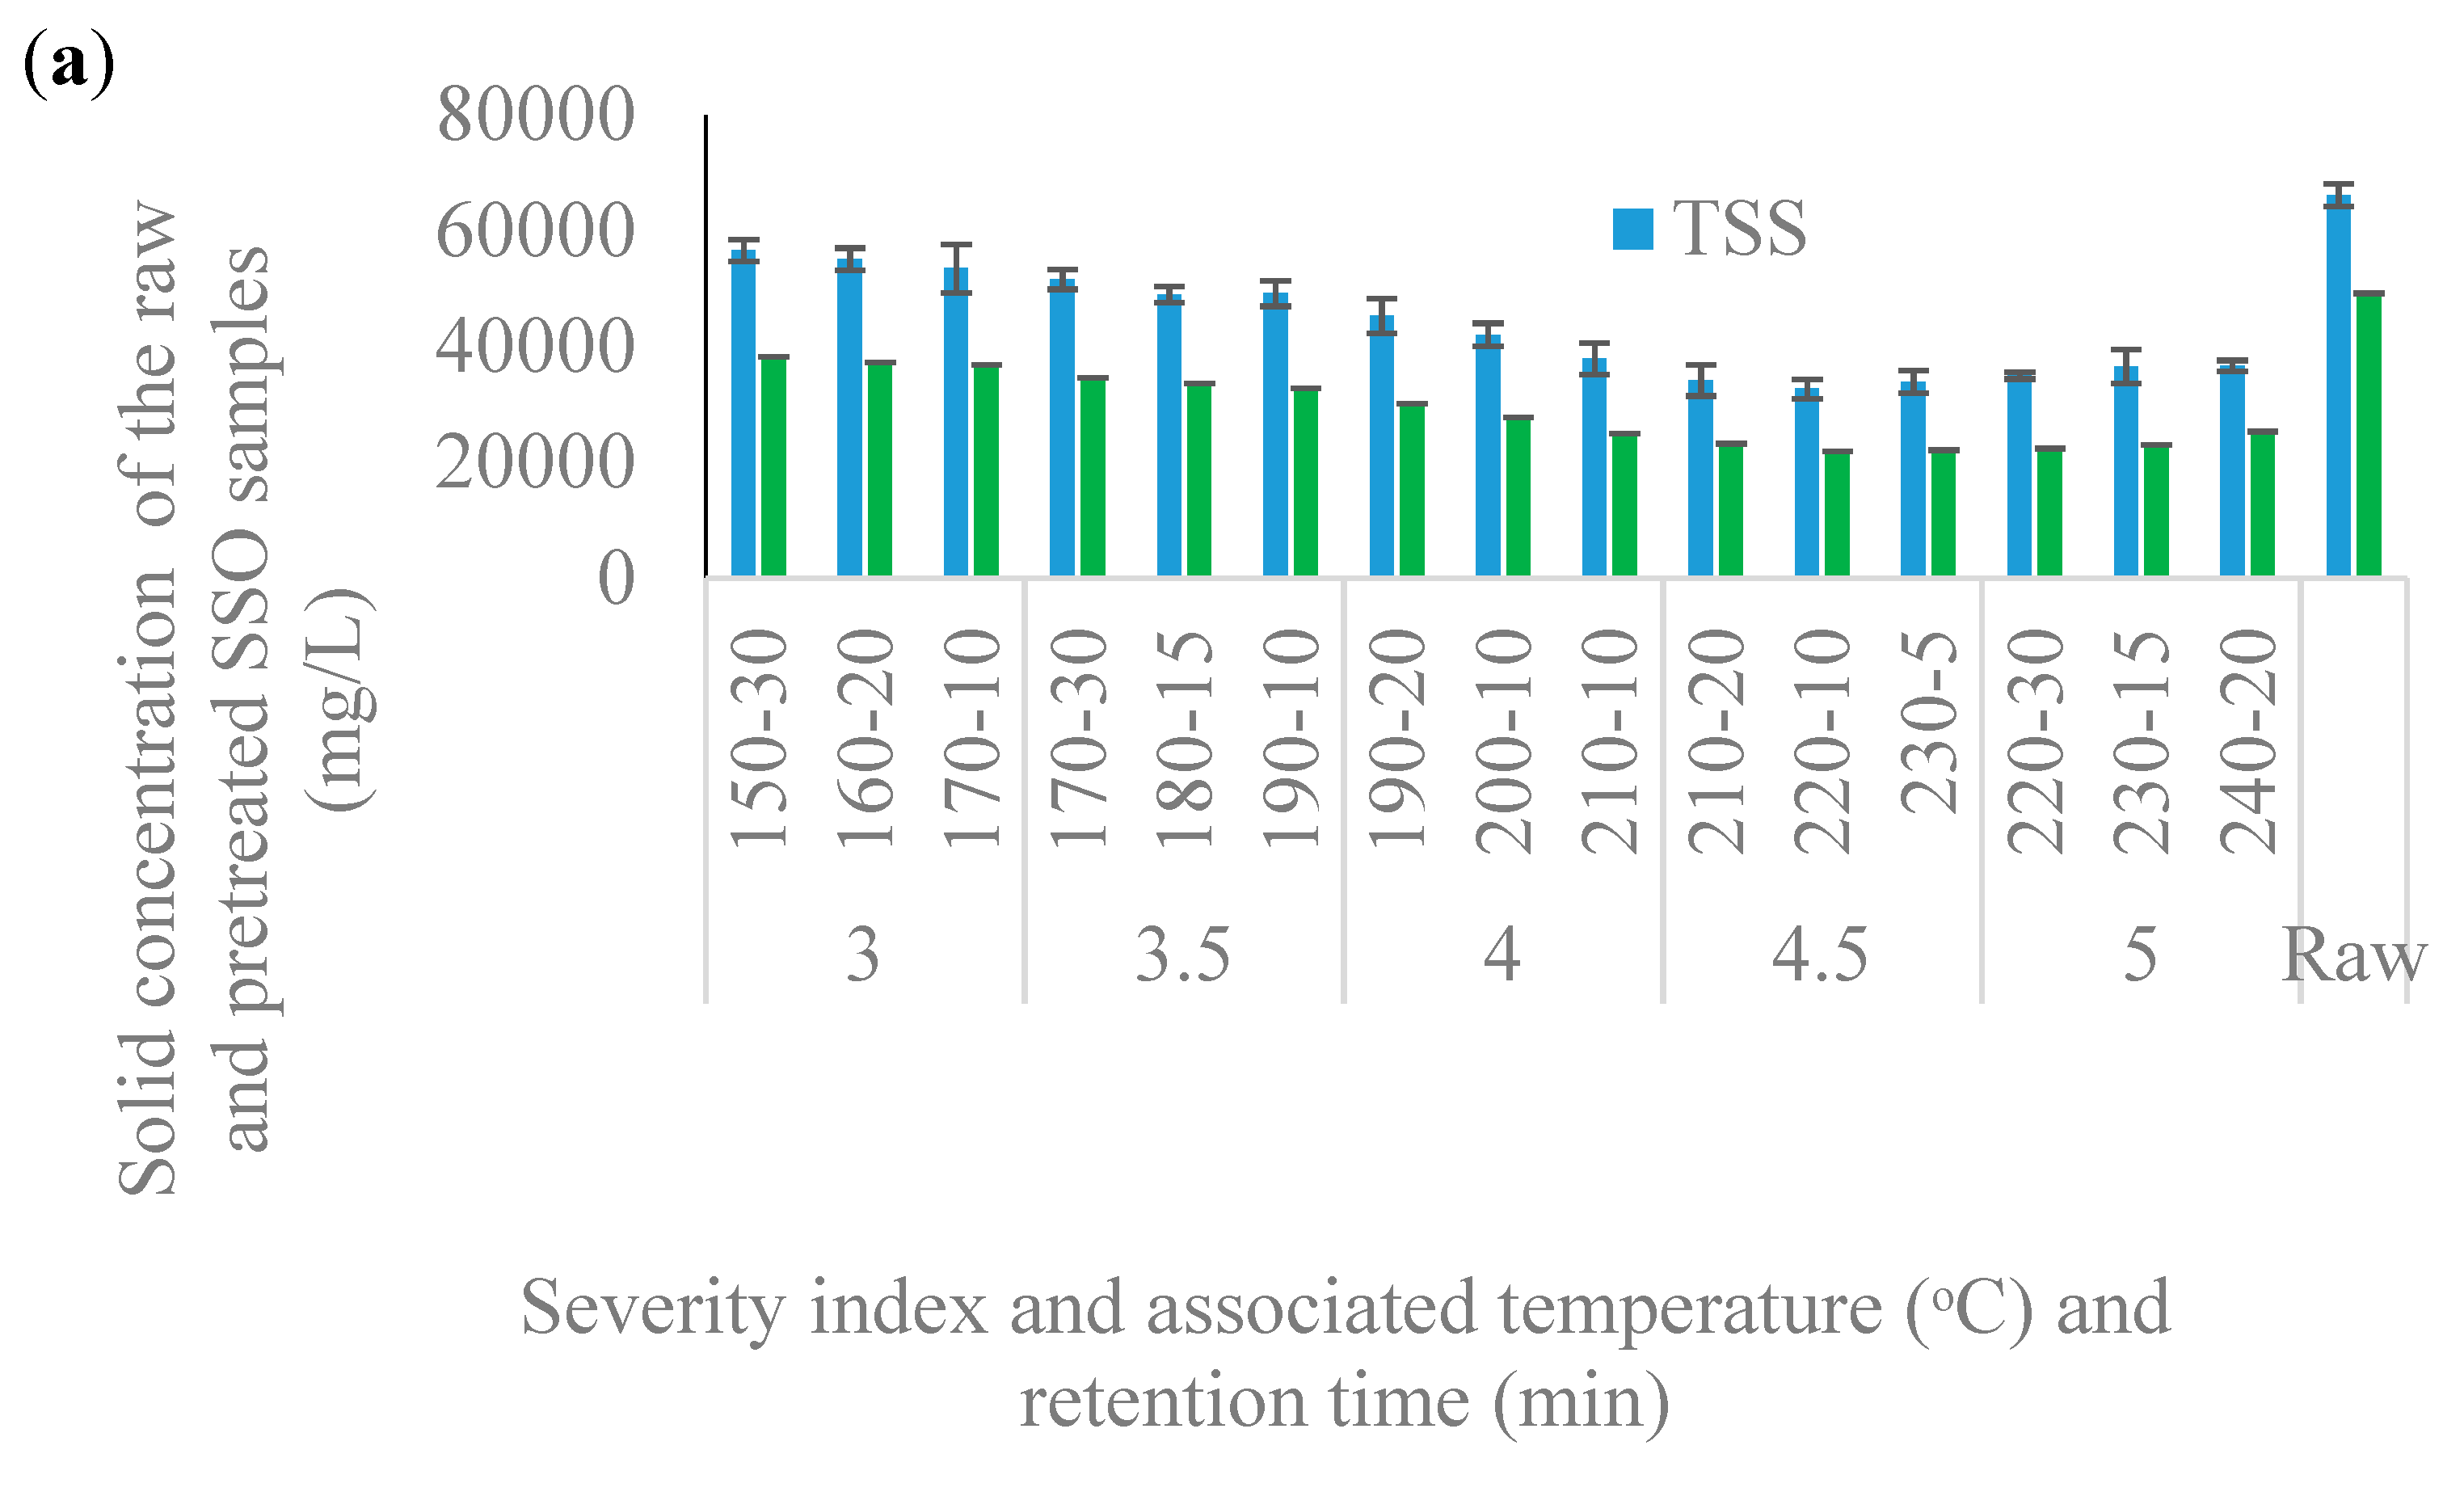
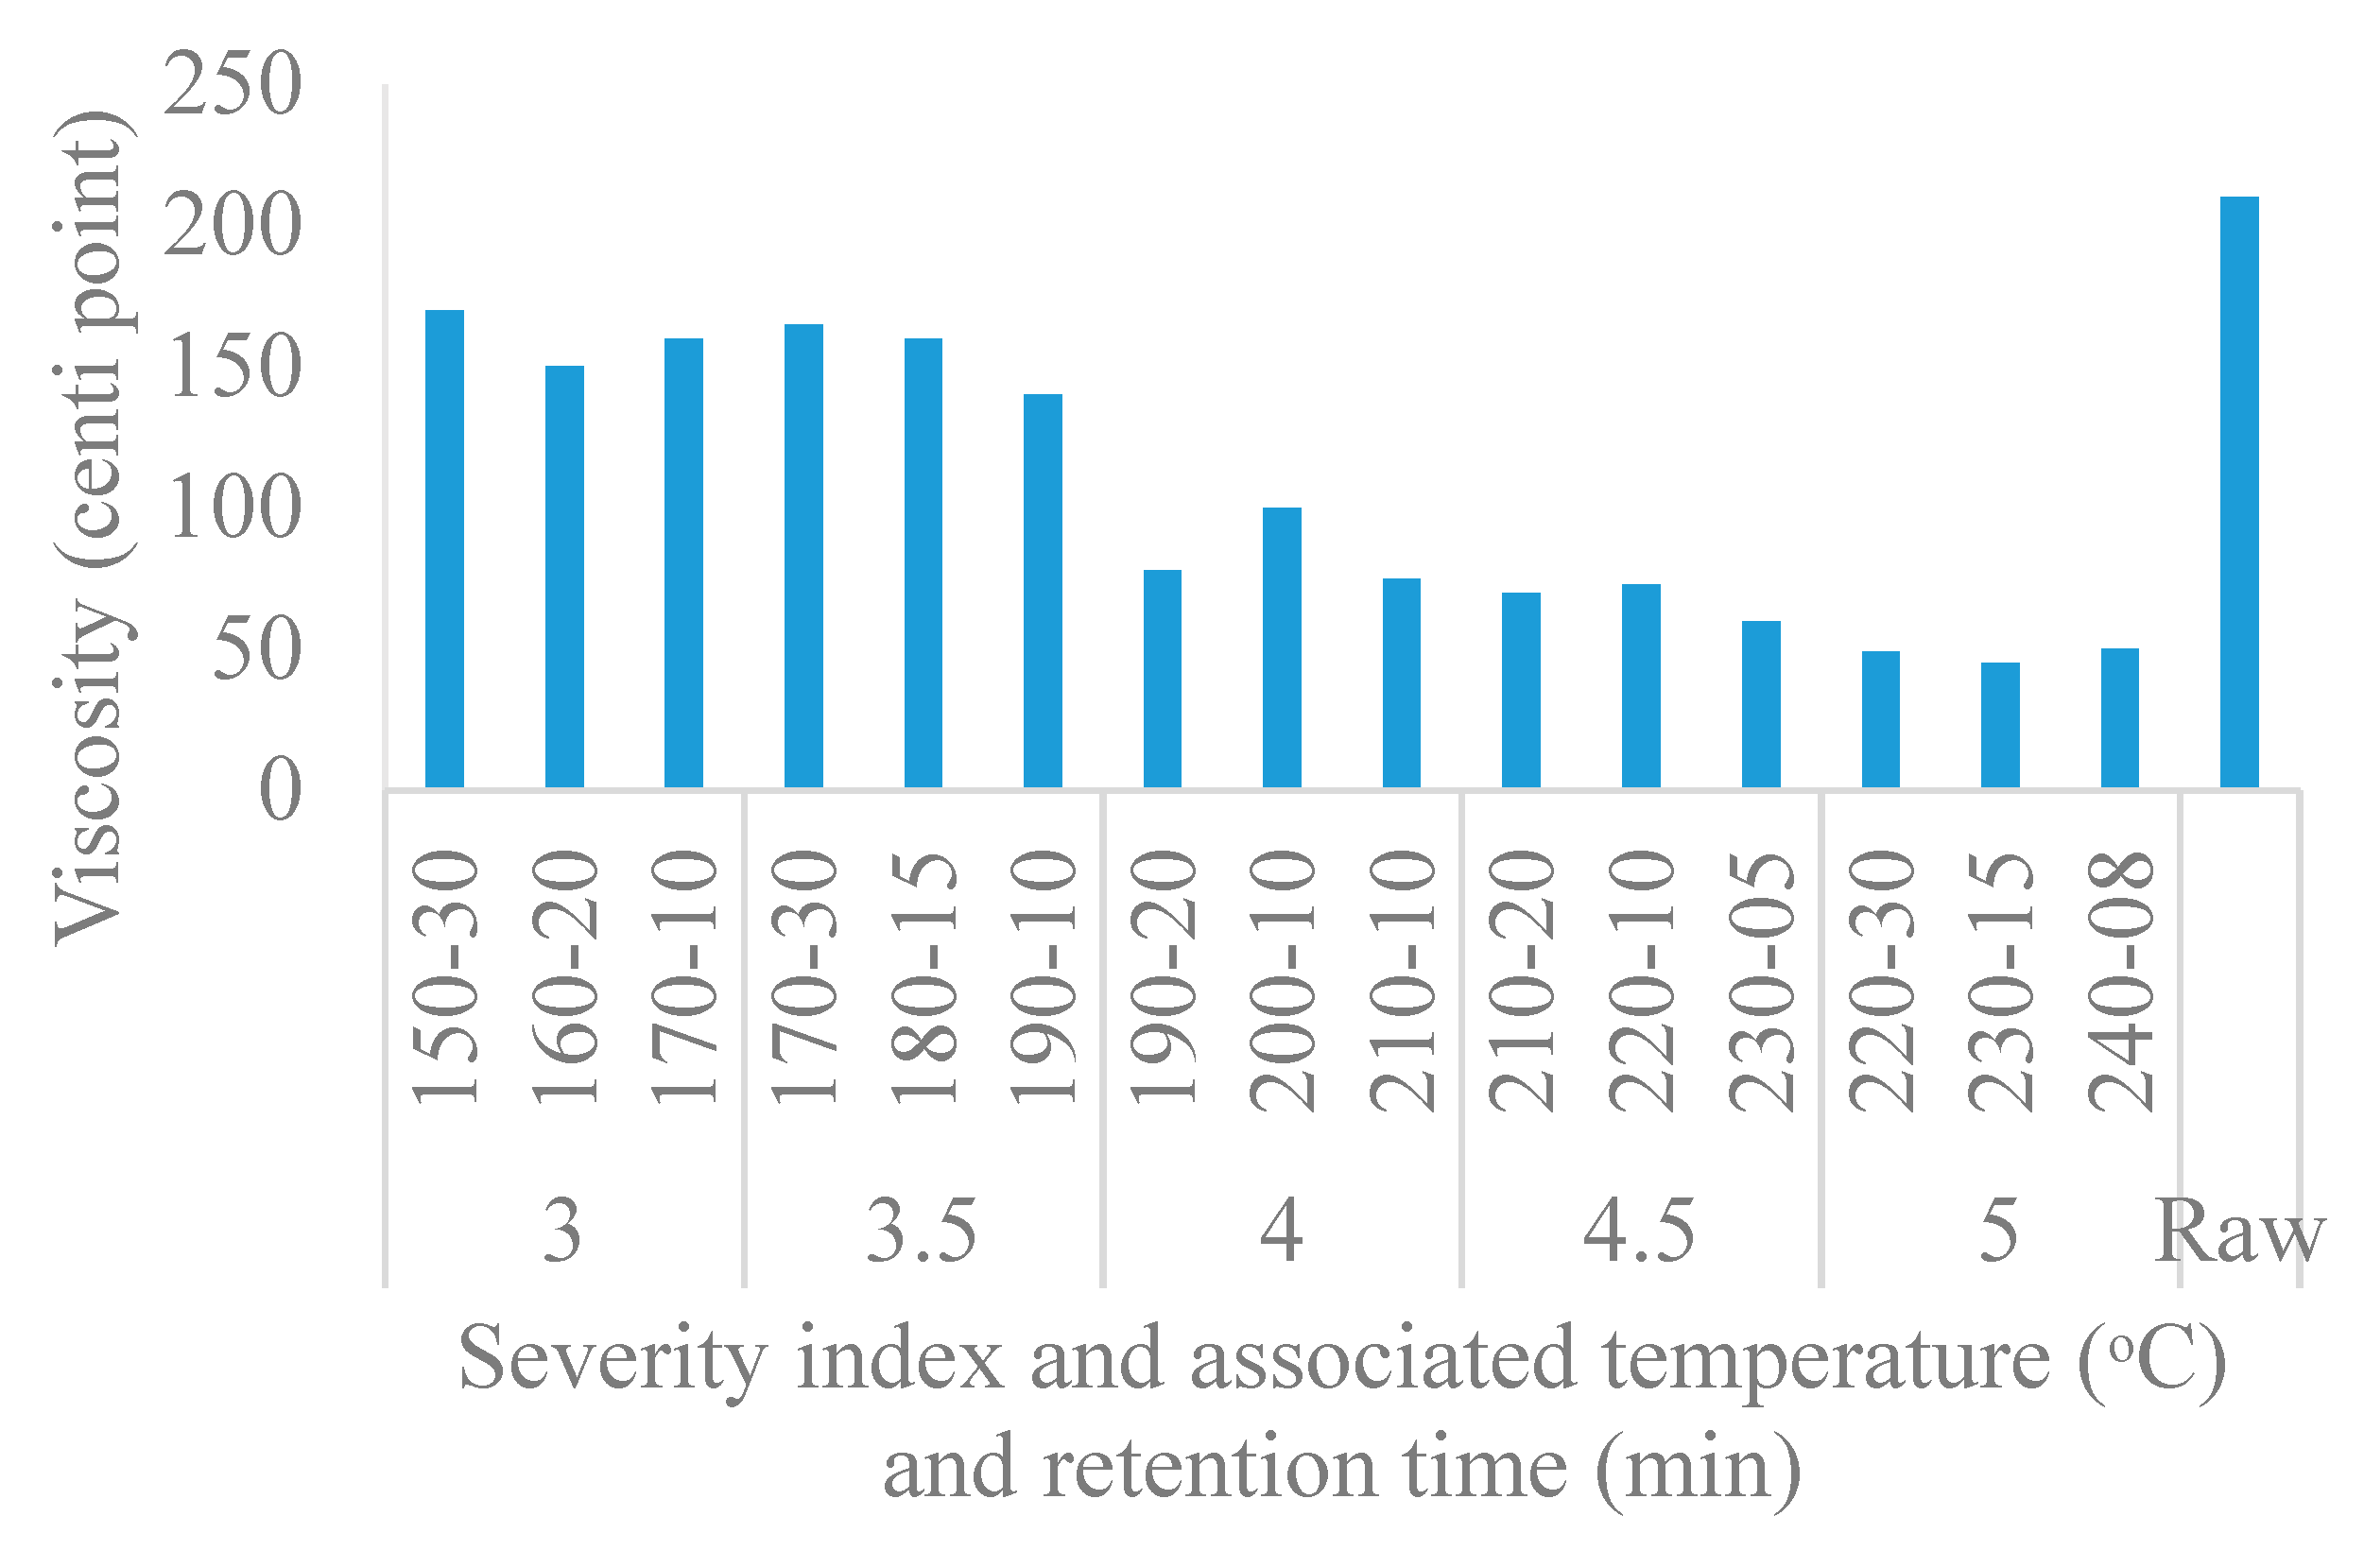
3.1.3. Solid Reduction
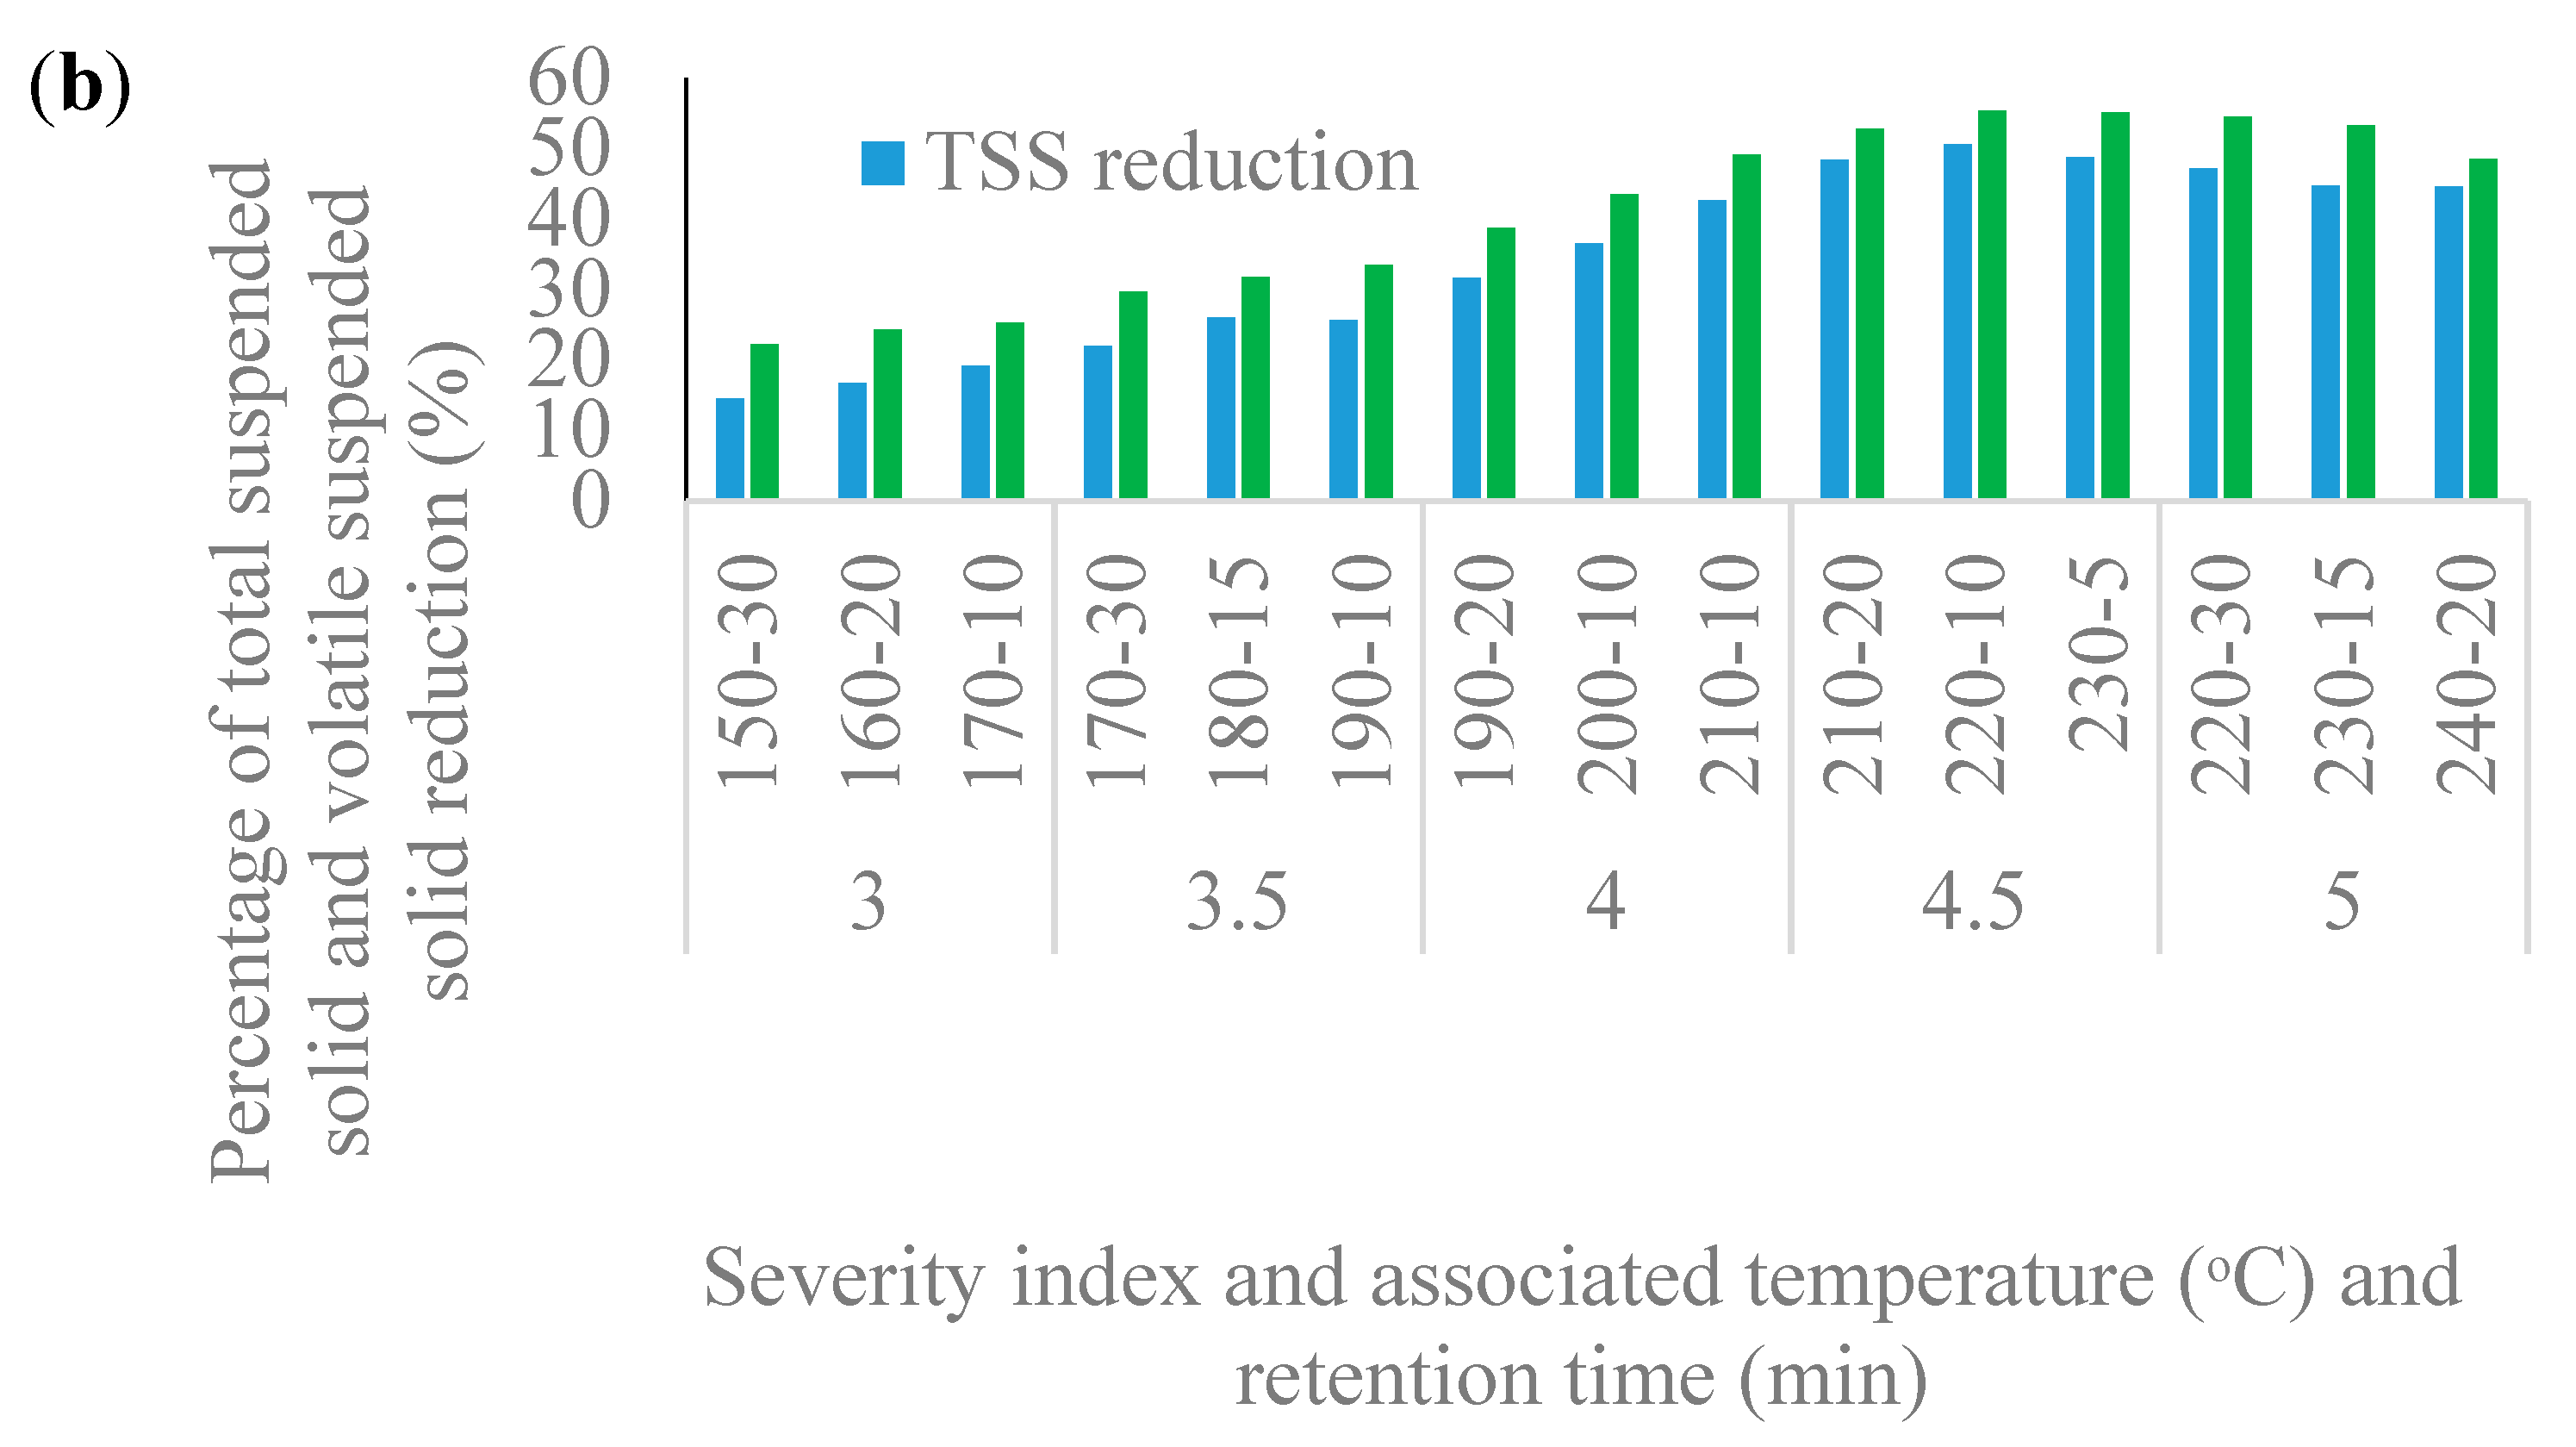
The concentration of TSS and VSS of all hydrothermally pretreated and raw substrates are shown in Figure 2a. According to this graph, the TSS and VSS concentrations of all hydrothermally pretreated samples were decreased compared to the raw SSO. VSS is mainly hemicellulose and cellulose, which can be decomposed to lower molecular organics, such as monosaccharides, furans, and organic acids when subjected to higher temperatures [33].
The results of this study indicated that the percentage of solid reduction had a direct relation with temperature until an SI of 4.5 and then it started to decrease. The highest percentage reduction of 51% and 55% for TSS and VSS, respectively, were observed at the HTP condition of “220 °C-10 min” or SI of 4.5, see Figure 2b. For TSS and VSS reduction due to HTP, comparing the different combinations of temperature and retention time inside each severity index, it was observed that the higher temperature with lower retention time showed higher percentage reduction of both TSS and VSS for SI ranged from 3.00 to 4.5. Whereas, at high SI of 5.00, lower temperature with longer retention time had higher solid reduction efficiency.
Based on the abovementioned results, it can be concluded that longer retention times do not necessarily enhance the solid reduction considerably for SSO; therefore, it is moderate evidence for RT to be a significant factor (p-value <0.05).

3.1.4. Viscosity

Viscosity, providing a clue about the mode of agitation and energy consumption of the bioreactors, becomes a significant and useful parameter for designing and monitoring biological processes [34]. Visually, after HTP, the SSO samples were transformed into a more fluid slurry mass. The viscosities of SSO samples after and before HTP are shown in Figure 3. Results revealed that after HTP, the viscosity of all samples decreased significantly. The lowest viscosity of 45–50 centi-point was observed at SI of 5, which is approximately 76% lower than the viscosity of raw SSO. Viscosity and HTP temperature demonstrated a very strong negative correlation where an increase in temperature resulted in a decrease of viscosity. These observations were in accordance with Xue et al.’s results [35]. Xue et al. [35] evaluated the effect of low and high temperatures ranging from 60 to 180 °C in combination with a wide range of retention time (15 to 180 min) on TWAS. The viscosity of the sludge dropped from 4480 centi-point to the lowest value of 1.4 centi-point at 180 °C.

3.2. Acidification of Organics

Hydrothermally pretreated and raw SSO samples were used for running the dark fermentation (acidification) experiment. The percentage of COD solubilization after acidification is shown in Figure 4a. Increasing the temperature from 150 to 190 °C resulted in an increase in COD solubilization and maintained a positive correlation. Hence, the point of transition for COD solubilization where it began to drop was the HTP condition of “190 °C-10 min”. The COD solubilization continues to decrease up to an HTP temperature of 240 °C (the highest operating HTP temperature). The optimal HTP condition in terms of COD solubilization was “190 °C-10 min”, which resulted in 54% COD solubilization, which was 31% higher than that of the raw sample.
It was also observed that some of the samples had superior COD solubilization to the raw sample, some were equal, and some were lower than the raw samples. The HTP condition of “230 °C-15 min” demonstrated a lower COD solubilization percentage of 32% compared to that of raw (37%). The HTP condition of “240 °C-8 min” had similar COD solubilization as the raw. All the rest of the samples exhibited a higher COD solubilization percentage.
By evaluating the COD solubilization of SSO after acidification in each severity index, it was discovered that the percentages of solubilization for samples pretreated at severity indexes of 3, 3.5, 4, and 4.5 were higher than that of raw sample. However, a higher severity index of 5 had lower or equal solubilization percentages than raw. The average COD solubilization at severity indexes of 3, 3.5, 4, and 4.5 were 50, 51, 43, and 40%, respectively. These values were 8 to 26% higher compared to the acidification of the raw SSO. Whilst at the severity index of 5, average solubilization of all HTP scenarios was 36%, presenting slightly lower solubilization compared to the raw sample. Wyin et al. [10] also reported the increase of COD solubilization after HTP of food waste and its positive correlation with HTP temperature by employing HTP temperature of 100 to 200 °C and RT of 30 min for all samples. They found that the HTP condition of “180 °C-30 min” had the highest SCOD concentration of (127.50 ± 1.55 g/kg) after fermentation compared to the raw and other HTP conditions.
Considering three lower SIs of this study (3.00, 3.5, and 4.00), which indicated higher solubilization percentage, it was observed that substrates pretreated at higher temperature with lower retention time demonstrated higher solubilization percentage than those with lower temperature and higher RT, emphasizing that the HTP temperature was the dominant factor.
As shown in Figure 4b, the overall COD solubilization due to sequential HTP and acidification also increased by increasing the HTP temperature from 150 °C to 220 °C and dropped sharply afterwards. By evaluating the overall COD solubilization, it was revealed that despite the lower COD solubilization during the acidification step, the overall COD solubilization of all hydrothermally pretreated samples was higher than that of the raw sample. This implies that the hydrothermal pretreatment at all temperatures promoted the overall COD solubilization. The highest sequential COD due to HTP and acidification was 64%, which was almost two times higher than that of the raw sample.
To illustrate the relationship between COD solubilization percentage and three main variables, the main effect plot of COD solubilization percentage vs. HTP severity index, temperature, and retention time is shown by Figure 5a. Besides, the interactions between the four main variables (temperature, pressure, time, and SI) for the COD solubilization after hydrothermal pretreatments are represented by Figure 5b.
The concentration of soluble carbohydrates after acidification for the raw and pretreated samples are shown in Table 4. The soluble carbohydrates concentration after acidification declined with increasing HTP temperature. This phenomenon might be due to the formation of some toxic and nonbiodegradable products which might raise the stress of fermenting microorganisms [36]. For instance, Maillard reactions that occur between proteins and carbohydrates and the byproducts at a higher temperature have been reported to be antimicrobial agents [32,37]. The final soluble carbohydrates concentrations at the lowest severity index (3.00), specifically at 170 °C, were higher than in other scenarios. These results were in agreement with Yin et al.’s findings, who observed carbohydrates solubilization inhibition at an elevated temperature of 200 °C (the highest HTP temperature in their study).
After 72 h of fermentation, concentrations of soluble protein and ammonia in reactors containing hydrothermally pretreated substrates were lower than reactors with raw SSO (Table 4). Although, with increasing the temperature of HTP, the soluble protein concentrations after HTP increased; however, the abundant dissolution of the proteins after HTP did not lead to higher degradation. These results were in line with Yin et al.’s results, who found that the concentrations of soluble proteins were almost constant after two days’ fermentation, and the degradation of proteins was limited [13].
Similar to soluble protein, concentrations of ammonia for hydrothermally pretreated samples were lower than that for the raw SSO. Although the trend of this reduction was not corresponding to the raising HTP temperature, the amount of ammonia in all reactors was approximately equivalent, demonstrating a peak of 707 mg/L NH4-N in the reactor containing samples hydrothermally pretreated at the HTP condition of “210 °C-20 min”. Overall, the HTP effect was significant in terms of organic cell integration and solubilization. However, it was not very efficient in terms of protein degradation.
The stability of a digester medium can be described by an indicator such as pH since it is dependent on the buffering capacity of the digester itself [19]. The initial pH values of the digesters were adjusted to 5.00, and the final pH of all the reactors did not change significantly; the final pH values varied from 5.00 to 5.6.

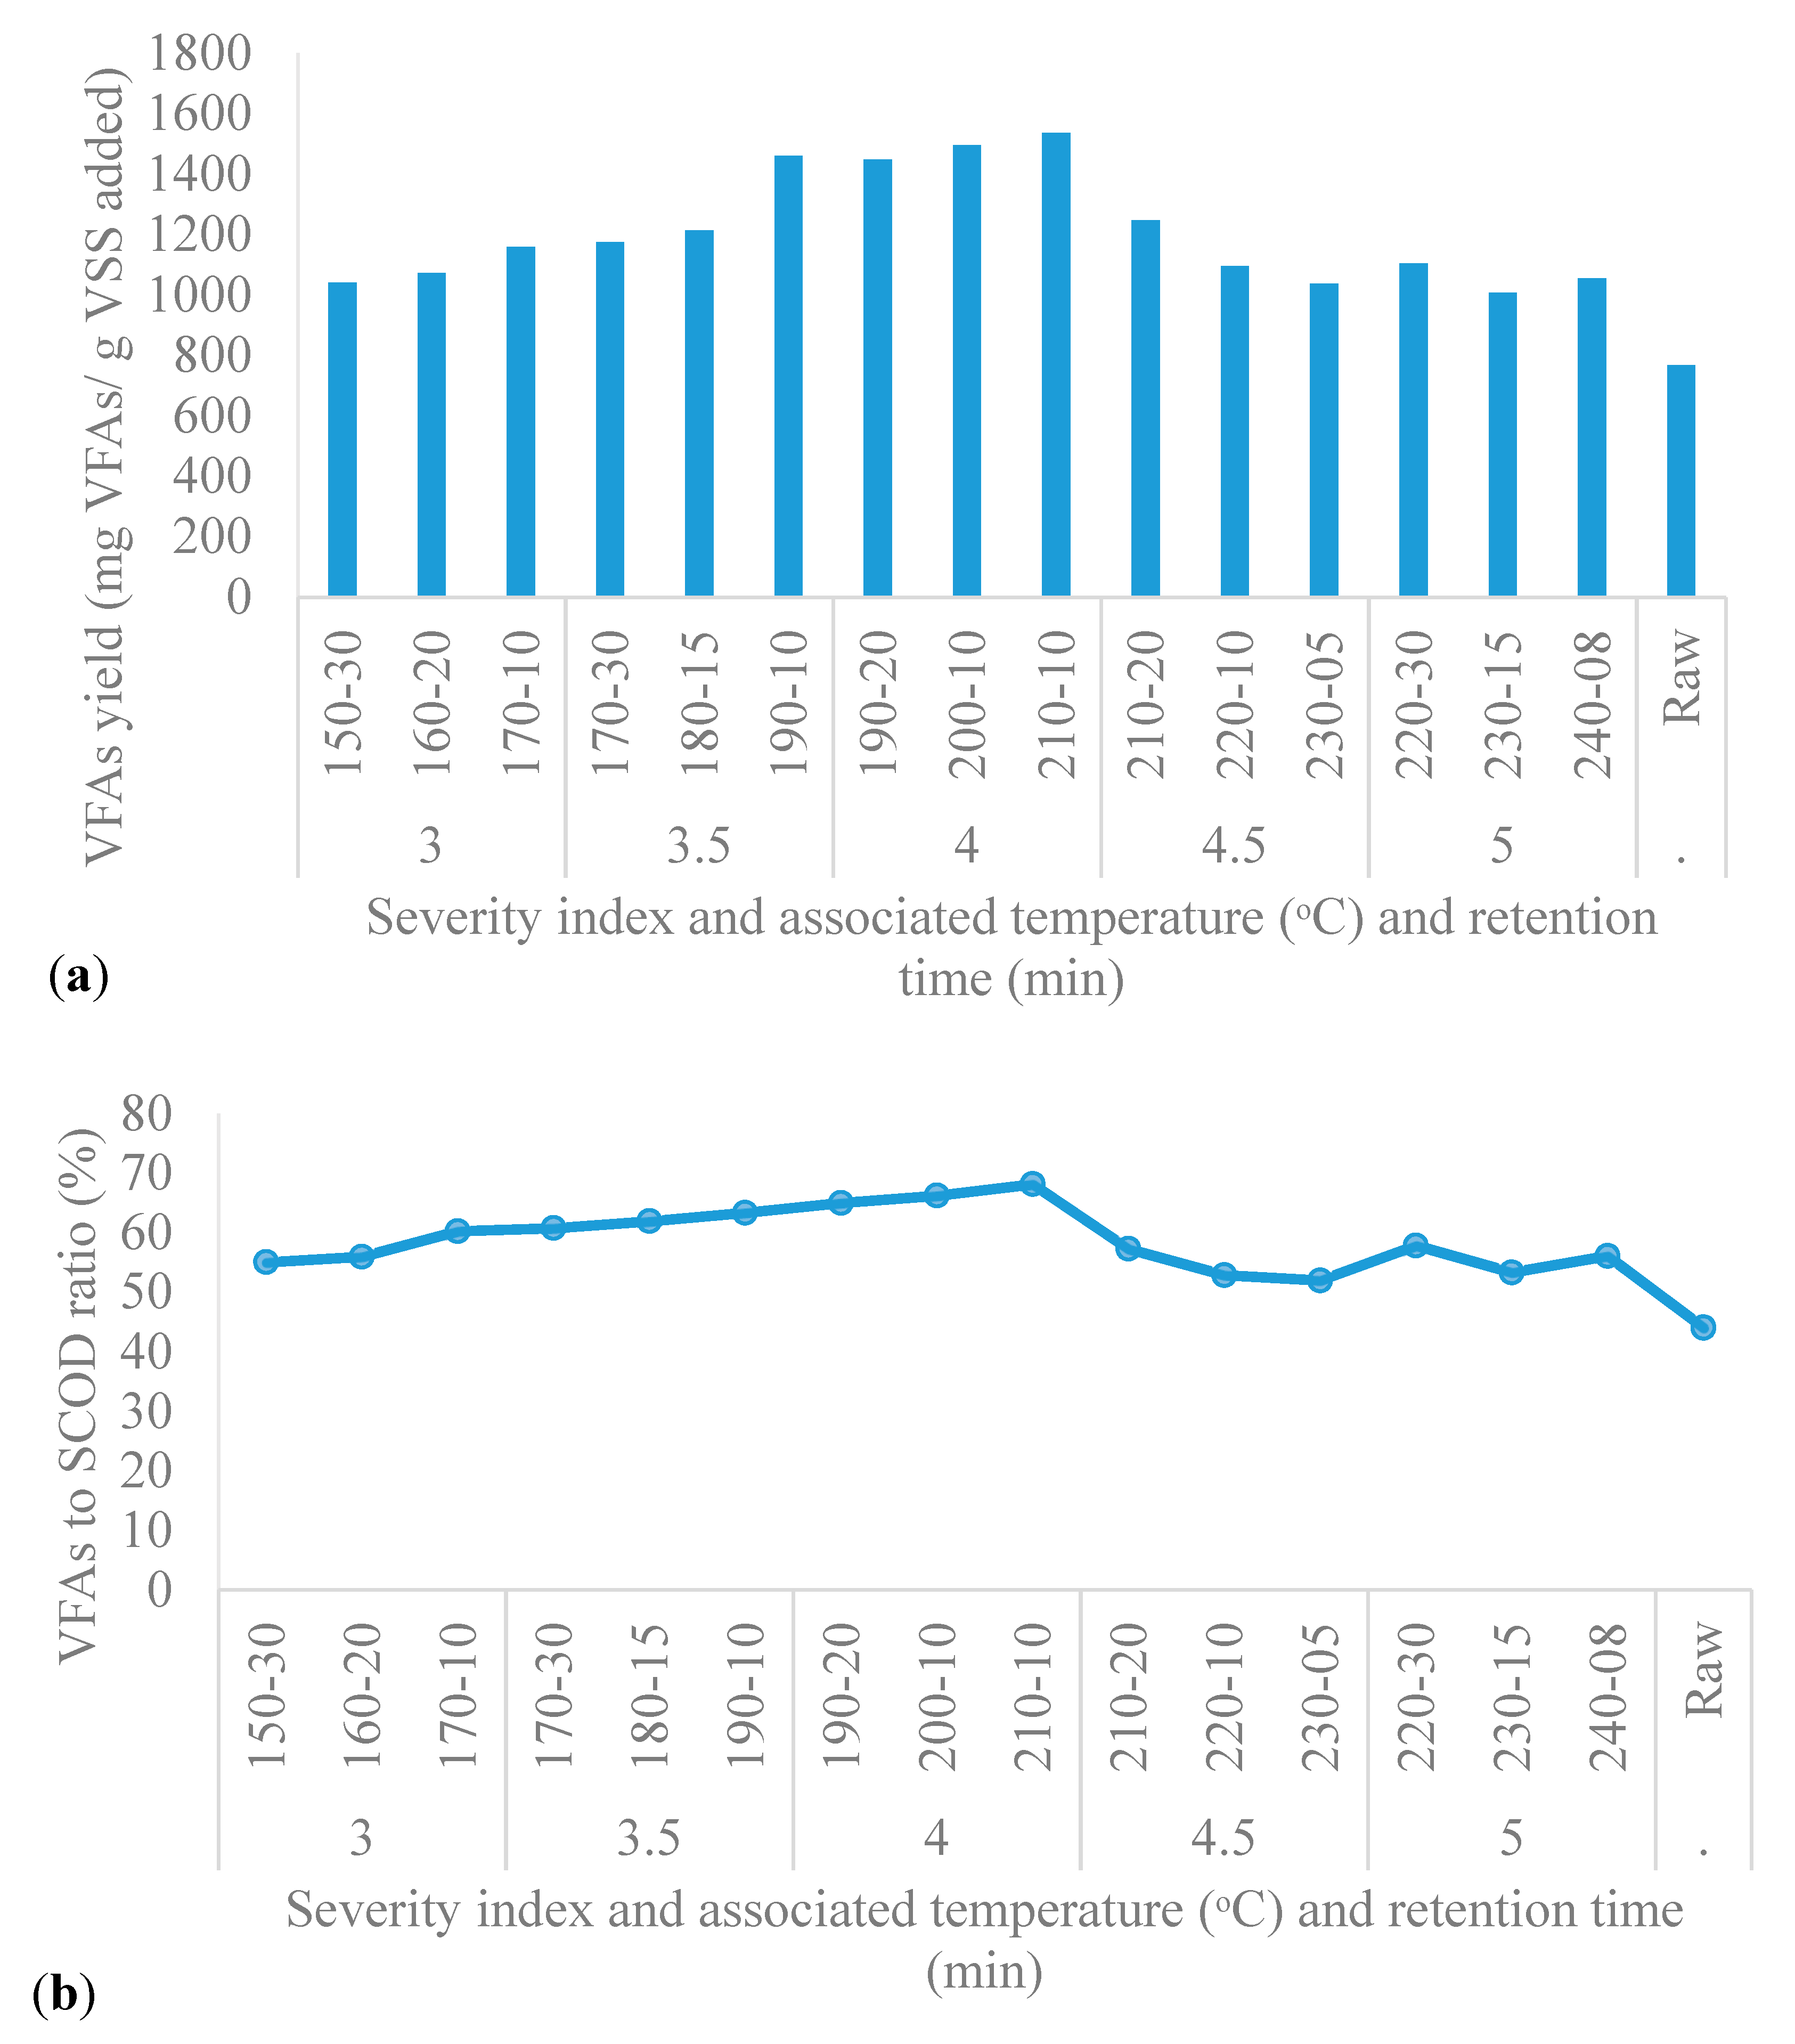
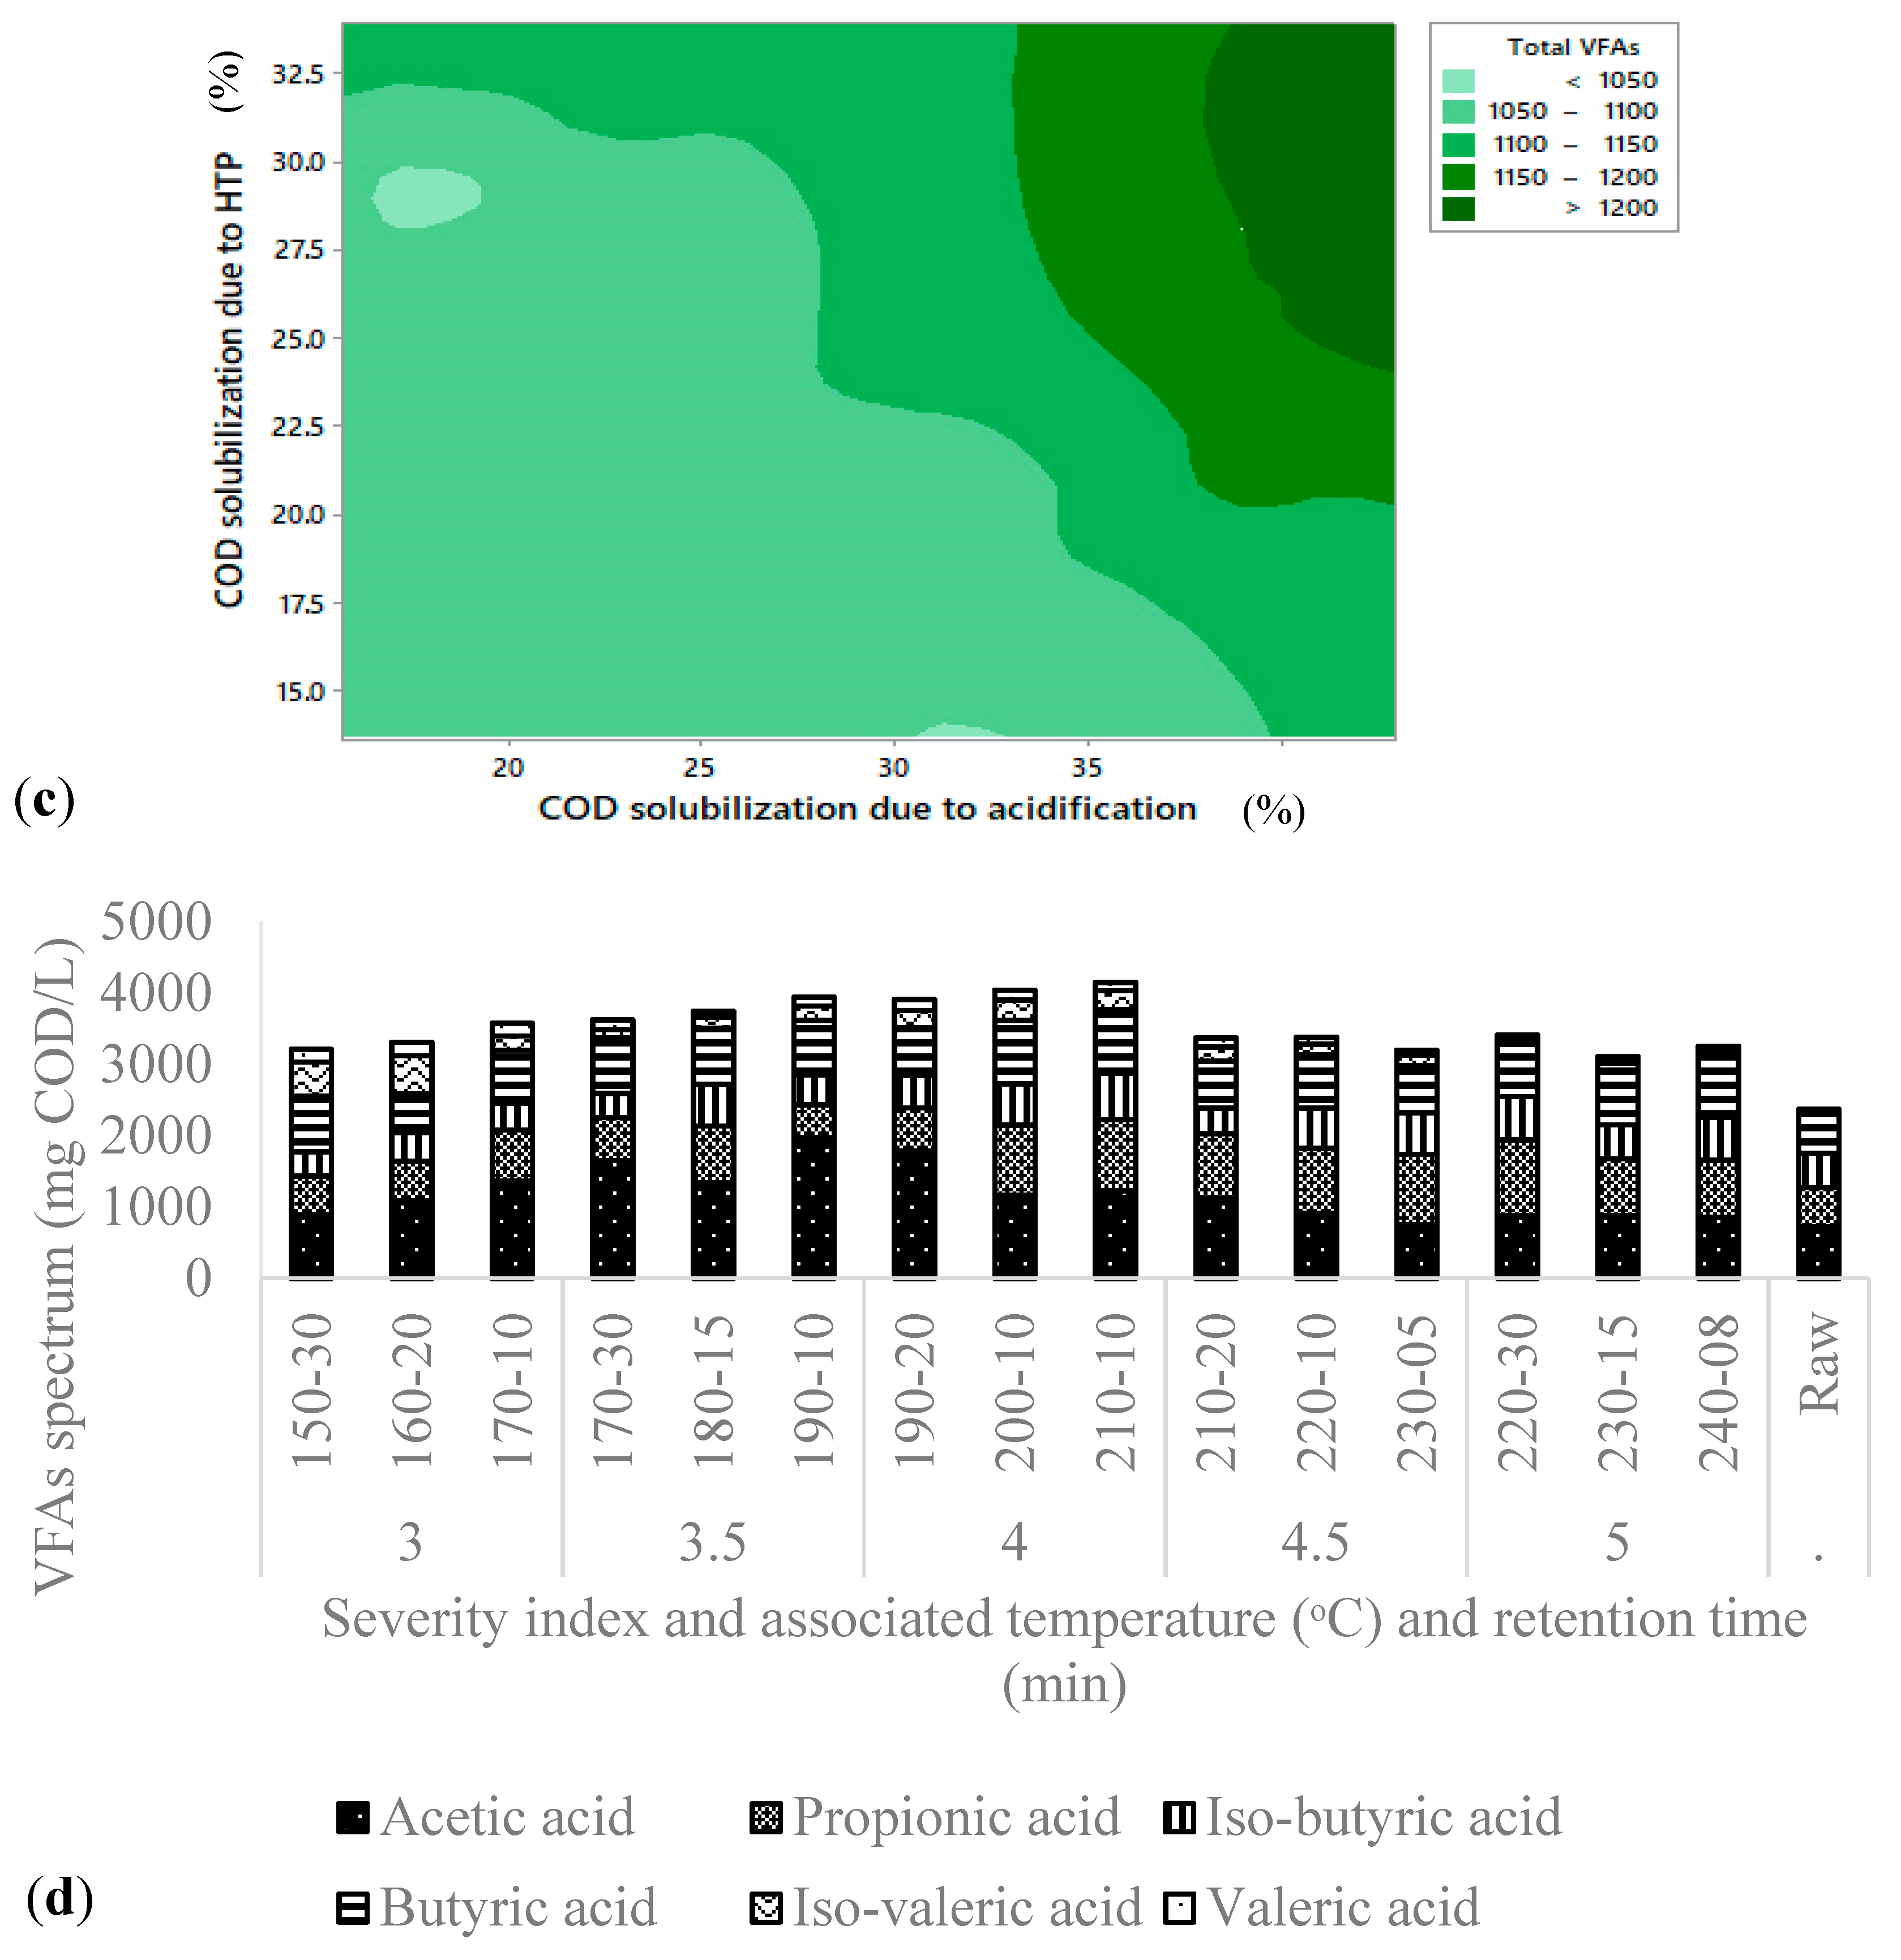
3.3. Volatile Fatty Acids Production

The enhancement of VFAs production from MSW via application of hydrothermal pretreatment has been investigated and confirmed by several studies [13,17,38,39]. Figure 6a presents the VFAs yields per mass of VSS added after acidification of pretreated and raw SSO samples. The VFAs concentrations increased with the intensification of HTP temperature up to the HTP condition of “210 °C-10 min” and then dropped. The release of organic matter and screening of diverse micro-organisms during each pretreatment may be the reason behind this trend. Ding et al. [12] used food waste and applied hydrothermal pretreatment for 20 min at 100, 120, 140, 160, 180, and 200 °C. They found that HTP temperature exceeding 160 °C resulted in a sharp decrease in VFAs. However, in our experiment, the point where VFA concentrations began to decline was 210 °C. Therefore, it can be concluded that HTP at temperatures higher than 210 °C does not necessarily lead to higher VFAs production as many inhibitors, such as the formation of melanoid, might have affected the process [40].
As shown in Figure 6, the VFA yields from all pretreated samples were higher than that of raw SSO, demonstrating the positive impact of HTP on VFA production. The highest VFAs yield of 1536 mg VFAs/g VSS added was achieved for the pretreated sample at HTP conditions of “210 °C-10 min” compared to 768 mg VFAs/g VSS added for the raw sample, corresponding to an approximate 50% enhancement. Ding et al. [17] reported that HTP enhanced the production of VFAs from kitchen waste by using pretreatment temperatures ranging from 100 to 160 °C. The highest VFAs yield achieved in Ding et al.’s study was 1248 mg VFAs/g VSS added which was 16% more than the VFAs yield (1051 mg VFAs/VSS added) from the raw sample. Yin et al. applied HTP temperatures ranging from 140 to 200 °C for 30 min to food waste and found that the highest VFAs concentration of 908 mg/g VSS added was for the sample HTP treated at a temperature of 160 °C for 30 min compared to 586 mg/g VSS added for the raw sample. The noticeable contrast between the optimum HTP condition of different studies can be due to the difference in the nature of the substrates, as SSO contains more slowly biodegradable materials and less fat and organic substance (lower TCOD) compared to food waste.
The VFAs/SCOD ratios of the fermented SSOs are reported in Figure 6b. The VFAs/SCOD ratios of all hydrothermally pretreated samples ranged from 52 to 68%, which were higher than that of raw SSO (44%). Thereby, it can be concluded that the hydrothermal pretreatment promoted the VFAs portion of the SCOD for all pretreated samples compared to the raw. The highest VFAs/SCOD ratio of 68% was observed for the sample that was pretreated at HTP conditions of “210 °C-10min”. Whereas, for the raw sample, the VFAs/SCOD ratio was 44%. Yin et al. [13] reported that the highest VFAs/SCOD ratio of 32% for the food waste was obtained by the sample hydrothermally pretreated at “160 °C-30 min”. Their observations regarding the VFAs/SCOD ratio was somewhat lower than what we achieved in this study. Furthermore, their optimal condition was at lower HTP temperatures. The reason for this contradiction could be due to the nature of the substrates used.
Figure 6c shows the contour plot of the VFAs concentration as a function of solubilization after pretreatment and COD solubilization after fermentation. From this graph, it can be observed that the higher the COD solubilization after HTP and fermentation, the higher the VFAs produced. Also, increasing the COD solubilization resulted in an increase in VFAs production, meaning the COD solubilization has a significant effect on VFA production (p <0.05).

Product Spectrum

The concentrations of all types of VFAs produced for hydrothermally pretreated and raw samples after acidification are illustrated in Figure 6d. The detected VFAs included acetic acid, propionic acid, iso-butyric acid, butyric acid, iso-valeric acid, and valeric acid. As shown in the Figure, all types of VFAs increased by elevation of the HTP temperature reaching to the HTP condition of “210 °C-10 min” and began to decline with the intensification of the temperature. The VFAs concentrations of all types of VFAs were higher than that of raw for the majority of the HTP conditions.
Acetic acid was the most abundant VFA among all types of detected VFAs. The acetic acid to VFAs ratio of all hydrothermally pretreated samples ranged from 24 to 50% while the raw sample had a ratio of 30%. SIs of 4.5 and 5 showed lower ratios compared to the raw, whereas lower SIs of 3 to 4 demonstrated higher percentages. The propionic acid to VFAs ratio of all hydrothermally pretreated samples was in the range of 11 to 31%. In contrast to the acetic acid, the lower SIs of 3 and 3.5 had lower propionic acid to VFAs ratios compared to the raw. The SI of 4 had a similar ratio, and SIs of 4.5 and 5 had higher ratios compared to the raw.
All hydrothermally pretreated samples showed a higher concentration of acetic acid compared to the raw SSO. The concentration of acetic acid increased by increasing the HTP temperature up to 190 °C and dropped afterwards. Although the highest amount of total VFAs was observed at the HTP condition of “210 °C-10 min”, in terms of acetic acid, the highest concentration of 1980 mg COD/L was observed at HTP conditions of “190 °C-10 min”. The concentration of acetic acid in the raw sample was 723 mg COD/L, which was approximately three times less than that of the highest one. Ding et al. [17], comparing the VFAs produced after fermentation of the food waste samples thermally pretreated at 100 to 200 °C for 20 min with the raw sample, also reported that acetic acid was the most abundant VFA. In addition, Ding et al.’s results indicated that the concentration of acetic acid for all thermally pretreated samples was higher than that of raw, which is in agreement with the findings of this study. They achieved an acetic acid concentration of 11.43 g/L at a temperature of 160 °C, compared to 5.6 g/L for the raw sample.
Propionic acid ranked as the second most abundant VFA. The concentration of propionic acid ranged from 456 to 1059 mg COD/L for the hydrothermally pretreated samples. The lowest value of propionic acid was observed at the HTP condition of “190 °C-10 min”, which was the optimum condition for acetic acid. The highest amount of propionic acid of 0.59 mg COD/L was achieved at the HTP condition of “220 °C-30 min”. The concentration of propionic acid for the raw sample was 550 mg COD/L, which was lower than all of the hydrothermally pretreated samples except the sample pretreated at the HTP condition of “190 °C-10 min”.
Ding et al. [17] also reported that propionic acid was the second most abundant VFA after acetic acid, and the concentration of propionic acid for hydrothermally pretreated samples was higher than that of raw. The highest level of propionic acid was 2.27 g/L at 160 °C, compared to 1.38 g/L for the raw.
The concentration of iso-butyric acid ranged from 336 to 654 mg COD/L, while the concentration of butyric acid was from 543 to 889 mg COD/L. The concentration of iso-butyric acid and butyric acid for the raw samples was 485 and 543 mg COD/L, respectively. Higher SIs resulted in higher iso-butyric acid compared to the raw. The highest amount of iso-butyric and butyric acids was 654 and 889 mg COD/L, respectively, for the sample pretreated at “210 °C-10 min”, which was 40% higher than that of raw. Most conditions of HTP at lower SIs demonstrated lower amounts of iso-butyric acid compared to the raw. However, the concentrations of butyric acid for all hydrothermally pretreated samples, except the sample pretreated at the HTP condition of “160 °C-20 min”, were higher than the raw sample. These observations were in agreement with Ding et al.’s finding regarding the decrease of iso-butyric acid after HTP compared to the raw, but contradicted the butyric acid results. Ding et al. [17] reported iso-butyric and butyric acid concentration of 0.07 and 0.42 g/L for raw food waste and the sample treated with an HTP temperature of 160 °C, respectively.
The iso-butyric acid to VFAs and butyric acid to VFAs ratios of the thermally pretreated samples ranged from 9 to 18% and 16 to 28%, respectively. Those percentages for the raw sample were 20 and 23%, respectively. The proportion of iso-butyric acid to VFAs for all hydrothermally pretreated samples was lower than that of raw sample. Similarly, the butyric to VFAs ratios of all hydrothermally pretreated samples except HTP conditions of “230 °C-15 min” and “240 °C-08 min” were lower than that of the raw sample.
The concentrations of iso-valeric and valeric acid were as low as 50 and 33 mg COD/L and as high as 536 and 189 mg COD/L, respectively. HTP temperature had a negative correlation with the concentration of both iso-valeric and valeric acid. The higher the temperature, the lower the concentration of these two acids. The highest concentrations of iso-valeric and valeric acid of 536 and 189 mg COD/L, respectively, were produced from the sample hydrothermally pretreated at the HTP condition of “160 °C-20 min”. The concentrations of iso-valeric and valeric acids in the raw sample were 48 and 22 mg COD/L, respectively. These concentrations were about ten times higher for the sample pretreated at the HTP condition of “160 °C-20 min”. Ding et al. [12] also confirmed the enhancement of the iso-valeric and valeric acids by applying thermal pretreatment compared to the raw.
The iso-valeric and valeric acids to VFAs ratios of all hydrothermally pretreated samples (2–16% for iso-valeric acid and 1–6% for valeric acid) were higher than that of raw (2% for iso-valeric acid and 1% for valeric acid). The highest iso-valeric and valeric acids to VFAs percentage of 16 and 6% were observed at an SI of 3, respectively.
In general, HTP affected the concentration and percentage of different types of VFAs produced after the fermentation process. The HTP temperature demonstrated different correlations with each type of VFA. Each type of VFA had a different optimum HTP condition in terms of its production. Acetic acid favored medium temperatures and SI (3.5 and 4). Propionic acid, iso-butyric, and butyric acid preferred higher HTP temperature and SI (5). Iso-valeric and valeric acid had maximum production at the lowest HTP temperature and SI (3).
Since the type of VFA governs the further application of the VFAs, it is important to control the HTP conditions based on the intended application. For instance, the electroactive bacteria in microbial electrolysis cells (MEC) technology tend to be induced by acetic acid, where power generated by this acid is higher than butyric acid and others. Similarly, for the BNR at wastewater treatment plants, acetate is the first consumed VFA, followed by propionate, butyrate, and valerate [41]. On the other hand, for the purpose of poly-hydroxyalkanoate PHA production, the ratio of hydroxybutyrate (HB) and hydroxyvalerate (HV) is a crucial factor for the production of PHAs, where HB is produced by acetate and butyrate and HV is formed by propionic and valeric acids [7]. Therefore, when hydrothermal pretreatment is to be applied prior to fermentation, the pretreatment conditions should be adjusted based on the target application as these pretreatment conditions regulate the types of VFAs produced.

4. Conclusions

This research revealed that HTP pretreatment enhanced COD solubilization and VFAs production. Although HTP promoted the solubility of SSO, HTP greater than 230 °C caused the production of inhibitory substances and a decrease in the activity of hydrolytic microbial enzymes. The highest overall COD solubilization and VFAs production were observed at an SI of 4.5, indicating 62% overall COD solubilization and 1536 (mg VFAs/g VSS added) yield, respectively. Further investigation of SSO using a variety of HTP scenarios, food to micro-organism ratios, pH, and other parameters is required.

Author Contributions

F.l.K.: design of experiment, conduct the experiments, data analysis, and writing the manuscript. E.H.K.: design of experiment, sample analysis, and data analysis. H.H.: design of experiment, edit the manuscript. E.E.: design of experiment, data analysis, and edit the manuscript.

Funding

This research was funded by southern Ontario water consortium (SOWC) grant number [SUB02523] and the APC was funded by [Ryerson University].

Acknowledgments

The authors appreciate the Greenfield Global and southern Ontario water consortium for their funding and support.

Conflicts of Interest

The authors declare no conflict of interest.

References

  1. Grizzetti, B.; Pretato, U.; Lassaletta, L.; Billen, G.; Garnier, J. The contribution of food waste to global and European nitrogen pollution. Environ. Sci. Policy 2013, 33, 186–195. [Google Scholar] [CrossRef]
  2. Jin, Y.; Li, Y.; Li, J. Influence of thermal pretreatment on physical and chemical properties of kitchen waste and the efficiency of anaerobic digestion. J. Environ. Manag. 2016, 180, 291–300. [Google Scholar] [CrossRef] [PubMed]
  3. TORONTO DISCO ROAD Canada Disco Road Organics Processing Facility (DROPF). Available online: https://www.ccibioenergy.com/wp-content/uploads/2018/01/CCI-Fact-Sheet_Disco_mar-2015_email.pdf (accessed on 7 July 2019).
  4. Karthikeyan, P.O.; Trably, E.; Mehariya, S.; Bernet, N.; Wong, J.W.C.; Carrere, H. Pretreatment of food waste for methane and hydrogen recovery: A review. Bioresour. Technol. 2017, 249, 1–15. [Google Scholar] [CrossRef] [PubMed]
  5. Chen, H.; Meng, H.; Nie, Z.; Zhang, M. Polyhydroxyalkanoate production from fermented volatile fatty acids: Effect of pH and feeding regimes. Bioresour. Technol. 2013, 128, 533–538. [Google Scholar] [CrossRef] [PubMed]
  6. Srikanth, S.; Venkata Mohan, S.; Devi, P.M.; Peri, D.; Sarma, P.N. Acetate and butyrate as substrates for hydrogen production through photo-fermentation: Process optimization and combined performance evaluation. Int. J. Hydrogen Energy 2009, 34, 7513–7522. [Google Scholar] [CrossRef]
  7. Lee, W.S.; Chua, A.S.M.; Yeoh, H.K.; Ngoh, G.C. A review of the production and applications of waste-derived volatile fatty acids. Chem. Eng. J. 2014, 235, 83–99. [Google Scholar] [CrossRef]
  8. Spasiano, D.; Luongo, V.; Petrella, A.; Alfè, M.; Pirozzi, F.; Fratino, U.; Piccinni, A.F. Preliminary study on the adoption of dark fermentation as pretreatment for a sustainable hydrothermal denaturation of cement-asbestos composites. J. Clean. Prod. 2017, 166, 172–180. [Google Scholar] [CrossRef]
  9. Spasiano, D. Dark fermentation process as pretreatment for a sustainable denaturation of asbestos containing wastes. J. Hazard. Mater. 2018, 349, 45–50. [Google Scholar] [CrossRef]
  10. Huang, Y.L.; Wu, Z.; Zhang, L.; Cheung, C.M.; Yang, S. Production of carboxylic acids from hydrolyzed corn meal by immobilized cell fermentation in a fibrous-bed bioreactor. Bioresour. Technol. 2002, 82, 51–59. [Google Scholar] [CrossRef]
  11. Luongo, V.; Palma, A.; Rene, E.R.; Fontana, A.; Pirozzi, F.; Esposito, G.; Lens, P.N. Lactic acid recovery from a model of Thermotoga neapolitana fermentation broth using ion exchange resins in batch and fixed-bed reactors. Sep. Sci. Technol. 2019, 54, 1008–1025. [Google Scholar] [CrossRef]
  12. Li, Y.; Noike, T. Upgrading of anaerobic digestion of waste activated sludge by thermal pretreatment. Water Sci. Technol. 1992, 26, 857–866. [Google Scholar] [CrossRef]
  13. Yin, J.; Wang, K.; Yang, Y.; Shen, D.; Wang, M.; Mo, H. Improving production of volatile fatty acids from food waste fermentation by hydrothermal pretreatment. Bioresour. Technol. 2014, 171, 323–329. [Google Scholar] [CrossRef] [PubMed]
  14. Ariunbaatar, J.; Panico, A.; Esposito, G.; Pirozzi, F.; Lens, P.N.L. Pretreatment methods to enhance anaerobic digestion of organic solid waste. Appl. Energy 2014, 123, 143–156. [Google Scholar] [CrossRef]
  15. Dwyer, J.; Starrenburg, D.; Tait, S.; Barr, K.; Batstone, D.J.; Lant, P. Decreasing activated sludge thermal hydrolysis temperature reduces product colour, without decreasing degradability. Water Res. 2008, 42, 4699–4709. [Google Scholar] [CrossRef] [PubMed]
  16. Yin, J.; Liu, J.; Chen, T.; Long, Y.; Shen, D. Influence of melanoidins on acidogenic fermentation of food waste to produce volatility fatty acids. Bioresour. Technol. 2019, 284, 121–127. [Google Scholar] [CrossRef] [PubMed]
  17. Ding, L.; Cheng, J.; Qiao, D.; Yue, L.; Li, Y.Y.; Zhou, J.; Cen, K. Investigating hydrothermal pretreatment of food waste for two-stage fermentative hydrogen and methane co-production. Bioresour. Technol. 2017, 241, 491–499. [Google Scholar] [CrossRef]
  18. Menon, A.; Ren, F.; Wang, J.Y.; Giannis, A. Effect of pretreatment techniques on food waste solubilization and biogas production during thermophilic batch anaerobic digestion. J. Mater. Cycles Waste Manag. 2016, 18, 222–230. [Google Scholar] [CrossRef]
  19. Li, Y.; Jin, Y. Effects of thermal pretreatment on acidification phase during two-phase batch anaerobic digestion of kitchen waste. Renew. Energy 2015, 77, 550–557. [Google Scholar] [CrossRef]
  20. City of Toronto Ashbridges Bay Wastewater Treatment Plant 2018 Annual Report. Available online: https://www.toronto.ca/wp-content/uploads/2019/05/8f0f-2018-TAB-Annual-Report-FINAL-ecopy.pdf (accessed on 7 July 2019).
  21. Hendriks, A.T.W.M.; Zeeman, G. Pretreatments to enhance the digestibility of lignocellulosic biomass. Bioresour. Technol. 2008, 100, 10–18. [Google Scholar] [CrossRef]
  22. Higgins, M.J.; Beightol, S.; Mandahar, U.; Suzuki, R.; Xiao, S.; Lu, H.W.; Le, T.; Mah, J.; Pathak, B.; DeClippeleir, H.; et al. Pretreatment of a primary and secondary sludge blend at different thermal hydrolysis temperatures: Impacts on anaerobic digestion, dewatering and filtrate characteristics. Water Res. 2017, 122, 557–569. [Google Scholar] [CrossRef]
  23. Standard Methods for the Examination of Water and Wastewater Part 4000 INORGANIC. Nonmetallic Constituents Standard Methods for the Examination of Water and Wastewater; American Public Health Association, American Water Works Association, Water Environment Federation: Washington, DC, USA, 1999.
  24. Ampules, A.S. Bradford Protein Assay Kit Bradford. Available online: www.thermoscientific.com/pierce (accessed on 7 July 2019).
  25. Dubois, M.; Gilles, K.A.; Hamilton, J.K.; Rebers, P.A.; Smith, F. Colorimetric Method for Determination of Sugars and Related Substances. Anal. Chem. 1956, 28, 350–356. [Google Scholar] [CrossRef]
  26. HACH DR2900 Procedure Manual. Available online: https://www.google.com/url?sa=t&rct=j&q=&esrc=s&source=web&cd=1&ved=2ahUKEwiHnum5tqvkAhUHSN8KHaa-CGIQFjAAegQIAhAC&url=https%3A%2F%2Fwww.hach.com%2Fasset-get.download.jsa%3Fid%3D7639982436&usg=AOvVaw3LdGgPYQQQsdIJmWcCCZPS (accessed on 7 July 2019).
  27. Liu, Z.; Zhang, C.; Lu, Y.; Wu, X.; Wang, L.; Wang, L.; Han, B.; Xing, X.H. States and challenges for high-value biohythane production from waste biomass by dark fermentation technology. Bioresour. Technol. 2013, 135, 292–303. [Google Scholar] [CrossRef] [PubMed]
  28. Ravindran, R.; Jaiswal, A.K. A comprehensive review on pre-treatment strategy for lignocellulosic food industry waste: Challenges and opportunities. Bioresour. Technol. 2016, 199, 92–102. [Google Scholar] [CrossRef] [PubMed] [Green Version]
  29. Li, F.; Liu, L.; An, Y.; He, W.; Themelis, N.J.; Li, G. Hydrothermal liquefaction of three kinds of starches into reducing sugars. J. Clean. Prod. 2016, 112, 1049–1054. [Google Scholar] [CrossRef]
  30. Monlau, F.; Sambusiti, C.; Barakat, A.; Quéméneur, M.; Trably, E.; Steyer, J.P.; Carrère, H. Do furanic and phenolic compounds of lignocellulosic and algae biomass hydrolyzate inhibit anaerobic mixed cultures? A comprehensive review. Biotechnol. Adv. 2014, 32, 934–951. [Google Scholar] [CrossRef] [PubMed]
  31. Ariunbaatar, J.; Panico, A.; Frunzo, L.; Esposito, G.; Lens, P.N.L.; Pirozzi, F. Enhanced anaerobic digestion of food waste by thermal and ozonation pretreatment methods. J. Environ. Manag. 2014, 146, 142–149. [Google Scholar] [CrossRef] [PubMed]
  32. Li, C.; Liu, F.; Gong, Y.; Wang, Y.; Xu, H.; Yuan, F.; Gao, Y. Investigation into the Maillard reaction between ε-polylysine and dextran in subcritical water and evaluation of the functional properties of the conjugates. LWT Food Sci. Technol. 2014, 57, 612–617. [Google Scholar] [CrossRef]
  33. Takata, E.; Tsutsumi, K.; Tsutsumi, Y.; Tabata, K. Production of monosaccharides from napier grass by hydrothermal process with phosphoric acid. Bioresour. Technol. 2013, 143, 53–58. [Google Scholar] [CrossRef] [PubMed]
  34. Liu, X.; Wang, W.; Gao, X.; Zhou, Y.; Shen, R. Effect of thermal pretreatment on the physical and chemical properties of municipal biomass waste. Waste Manag. 2012, 32, 249–255. [Google Scholar] [CrossRef] [PubMed]
  35. Xue, Y.; Liu, H.; Chen, S.; Dichtl, N.; Dai, X.; Li, N. Effects of thermal hydrolysis on organic matter solubilization and anaerobic digestion of high solid sludge. Chem. Eng. J. 2015, 264, 174–180. [Google Scholar] [CrossRef]
  36. Matsakas, L.; Kekos, D.; Loizidou, M.; Christakopoulos, P. Utilization of household food waste for the production of ethanol at high dry material content. Biotechnol. Biofuels 2014, 7, 1–9. [Google Scholar] [CrossRef] [PubMed]
  37. Hauser, C.; Müller, U.; Sauer, T.; Augner, K.; Pischetsrieder, M. Maillard reaction products as antimicrobial components for packaging films. Food Chem. 2014, 145, 608–613. [Google Scholar] [CrossRef] [PubMed]
  38. Elbeshbishy, E.E. Enhancement of Biohydrogen and Biomethane Production from Wastes Using Ultrasonication. Ph.D. Thesis, The University of Western Ontario, London, ON, Canada, 2011. [Google Scholar]
  39. Ozkan, L.; Erguder, T.H.; Demirer, G.N. Effects of pretreatment methods on solubilization of beet-pulp and bio-hydrogen production yield. Int. J. Hydrogen Energy. 2011, 36, 382–389. [Google Scholar] [CrossRef]
  40. Elbeshbishy, E.; Dhar, B.R.; Nakhla, G.; Lee, H.S. A critical review on inhibition of dark biohydrogen fermentation. Renew. Sustain. Energy Rev. 2017, 79, 656–668. [Google Scholar] [CrossRef]
  41. Luo, K.; Pang, Y.; Yang, Q.; Wang, D.; Li, X.; Lei, M.; Huang, Q. A critical review of volatile fatty acids produced from waste activated sludge: enhanced strategies and its applications. Environ. Sci. Pollut. Res. 2019, 26, 13984–13998. [Google Scholar] [CrossRef] [PubMed]
Figure 1. Effect of HTP on the soluble content of SSO: (a) Concentration of soluble chemical oxygen demand (COD) after HTP; (b) COD solubilization after HTP.
Processes 07 00576 g001
Figure 2. The effect of HTP on solid reduction; (a) Solid concentration before and after HTP; (b) solid reduction percentage of the SSO samples after and before HTP.
Processes 07 00576 g002aProcesses 07 00576 g002b
Figure 3. Viscosity of raw and hydrothermally pretreated samples after HTP.
Processes 07 00576 g003
Figure 4. Effect of HTP on COD after acidification. (a) COD solubilization after acidification; (b) Overall acidification.
Processes 07 00576 g004
Figure 5. (a) The main effect plots of sequential COD solubilization (%) vs. pretreatment temperature (°C), retention time (min), and severity index; (b) The interaction plots of HTP temperature (°C), retention time (min), pressure (kPa) and severity index for the overall COD solubilization (%).
Processes 07 00576 g005aProcesses 07 00576 g005b
Figure 6. Volatile fatty acid (VFA) production after acidification (a) VFAs yield after acidification; (b) VFAs/SCOD ratio; (c) The contour plot of total VFAs vs. COD solubilization after hydrothermal pretreatment and acidification; (d) VFAs production spectrum.
Processes 07 00576 g006aProcesses 07 00576 g006b
Table 1. Studies on thermal pretreatment of food waste prior to fermentation and anaerobic digestion (AD).
Studies on Thermal Pretreatment of Food Waste Following Fermentation.
ReferencePretreatment ConditionEffect of Hydrothermal Pretreatment
Temperature (°C)Retention Time (min)Increase in SCODIncrease in VFAs/Methane Compared to the Raw Sample Solid Reduction
[1]100–2005–30 Highest COD solubilization 70% at 180 °C85% at 160 °C-20 min,NA *
[2]55–16050–70NA 63% at 120 °C-50 minHighest vs. solubilization of 49% at 120 °C-50 min
[3]100–22030 43% more soluble COD than the control at 180 °C-30 min35% at 160 °C-50 min31% decrease in vs. after HTP at 220 °C
[4]90–20030Highest COD solubilization of 26% at 150 °CNA NA
Studies on Thermal Pretreatment of Food Waste Following AD
[5]90 30NA29% NA
[6]55–16015–120NA15% at 120 °C29% increase in vs. proportion at 120 °C-15 min
[7]70–15030–60NA90% at 80 °CNA
[10]17560SCOD increased significantly after HTP (No Numbers)decreased by 7.9% at 175 °C-60 minVSS solubilization ratio increased by 39%
* NA: Not available.
Table 2. Untreated source-separated organics (SSO) and seed inoculum characteristics.
ParameterSSOInoculum
TCOD (mg/L)144,050 ± 17,25416,267 ± 1595
SCOD (mg/L)42,167 ± 400575 ± 50
TSS (mg/L)66,183 ± 86015,100 ± 600
VSS (mg/L)49,250 ± 33010,500 ± 800
Total carbohydrates (mg/L)11,408 ± 15065707 ± 991
Soluble carbohydrates (mg/L)302 ± 583 ± 0.03
Total Protein (mg/L)986 ± 113410 ± 93
Soluble Protein (mg/L)221 ± 933 ± 3
Ammonia nitrogen NH3-N (mg/L)1716 ± 45543 ± 12
Alkalinity (mg CaCO3/L)5183 ± 2261545 ± 30
pH5.97.00
TCOD: Total chemical oxygen demand; SCOD: Soluble chemical oxygen demand; TSS: Total suspended solids; VSS: Volatile suspended solids.
Table 3. Hydrothermal pretreatment (HTP) design of this study.
Severity Index (SI)3.0 ± 0.053.5 ± 0.054.0 ± 0.054.5 ± 0.055.0 ± 0.05
Pretreatment Parameters(kPa) (°C) (min)(kPa) (°C) (min)(kPa) (°C) (min)(kPa) (°C) (min)(kPa) (°C) (min)
Pretreatment Scenario 1476-150-30786-170-301247-190-201565-210-201909-220-30
Pretreatment Scenario 2613-160-20999-180-151551-200-101909-220-102323-230-15
Pretreatment Scenario 3786-170-101247-190-101565-210-52323-230-52806-240-8
Table 4. Concentration of soluble compounds after acidification for the raw and pretreated samples.
Soluble-Carbohydrate (mg/L)Soluble-Protein (mg/L)Ammonia (mg/L)TVFAs/SCOD Ratio
SITemp (°C)-Time (min)AverageSTDAverageSTDAverageSTD°
3.00150-3023611152767190.55
160-2027716141696360.56
170-10293319376190.60
3.50170-3027127192769350.61
180-1527216212761180.62
190-1022313324757140.63
4.00190-2015512351780350.65
200-1016020384789420.66
210-101706361775130.68
4.50210-2015713341834550.57
220-1012019393707560.53
230-0513715413690420.52
5.00220-3014522491779140.58
230-1510525444791170.53
240-0811226382757170.56
.Raw16015443893150.44
Standard deviation (STD); Temperature (Temp); Soluble carbohydrate (S-Carbohydrate); Soluble protein (S-Protein).

